Communication

Analysis of In Vivo Radachlorin Accumulation through FLIM-Assisted Examination of Ex Vivo Histological Samples

by
Andrey V. Belashov
1,
Anna A. Zhikhoreva
1,
Stepan S. Kruglov
2,
Andrey V. Panchenko
2,
Irina V. Semenova
1,* and
Oleg S. Vasyutinskii
1
1
Ioffe Institute, Russian Academy of Sciences, 26, Polytekhnicheskaya, 194021 St. Petersburg, Russia
2
N.N. Petrov National Medical Research Center of Oncology, Ministry of Health of Russia, 197758 St. Petersburg, Russia
*
Author to whom correspondence should be addressed.
Photonics 2022, 9(10), 711; https://doi.org/10.3390/photonics9100711
Submission received: 30 August 2022 / Revised: 23 September 2022 / Accepted: 25 September 2022 / Published: 29 September 2022
(This article belongs to the Topic Biomedical Photonics)

Abstract

:
We report an investigation of the in vivo accumulation of Radachlorin photosensitizer in a murine model in several types of normal and tumor tissues based on an FLIM-assisted analysis of fluorescence intensity images, time-resolved fluorescence signals, and phasor plots. Experiments were performed on ex vivo histological samples of normal and tumor tissues. It was shown that the investigation of fluorescence intensity distributions combined with that of time-resolved fluorescence images can be used for qualitative and—under some limitations—quantitative analyses of the relative uptake of this photosensitizer in tissues. The phasor plot representations of time-resolved fluorescence signals were shown to be suitable for identification of the accumulation of predominant photosensitizers in tissues.

1. Introduction

A number of advantages offered by photodynamic therapy (PDT) in the treatment of various malignancies [1,2,3] and benign pathologies [4,5,6] have boosted research on a vast array of phenomena associated with different aspects of the treatment procedure. The fundamentals and applications of PDT were discussed in detail in quite a few review papers (see, e.g., [7,8,9]). The PDT efficacy depends on several factors, including the local concentration of the photosensitizer (PS), the amount of light absorbed, and the tissue oxygenation [7]. An important aspect that is essential for efficient PDT is the extent of accumulation of PS molecules in a target tissue. The uptake of PSs by cells of different lines was intensively studied in recent years; see, e.g., [10,11,12]. However the analysis of PS accumulation in tissues is a more challenging problem. The only direct way to analyze the amount of PSs in tissue is to record the fluorescence signal. In clinics, such an analysis is routinely performed for diagnostics or intraoperative imaging by using protoporphyrin IX (PpIX), although it is mainly aimed at the localization of tumor boundaries, since PpIX is produced more efficiently in cancerous tissues [13,14,15,16]. For research purposes, the detection of PS fluorescence distributions is also performed ex vivo on histological samples of target tissues [17,18].
However, the analysis of steady-state PS fluorescence signals in both cells and tissues may produce erroneous results caused by contributions from other chromophores that emit in the same spectral range, as well as by changes in PS molecules due to various processes, e.g., aggregation, binding to surrounding biomolecules, or formation of photoproducts [19]. These changes may considerably affect the phototoxicity of PS molecules without noticeable changes in the fluorescence intensity, since the produced species often have overlapping fluorescence spectra [20]. Therefore, monitoring of steady-state fluorescence signals may not be informative in the analysis of changes in PS molecules caused by their own evolution under photoexcitation and by interactions with the microenvironment in cells and tissues.
More informative data on PSs’ fluorescence parameters in cells and tissues can be obtained by utilizing fluorescence lifetime imaging microscopy (FLIM). It is known that the fluorescence decay rate of a fluorophore depends on the rates of both radiative and non-radiative relaxation of excited molecules. Therefore, the decay dynamics are sensitive to all changes in the molecule itself and in its microenvironment. PS molecules can provide quite different toxicities if they are in an initial free form, in the form of aggregates or photoproducts, or are bound to different biomolecules or intracellular organelles. Although these changes are scarcely distinguishable through steady-state recording of the fluorescence intensity, they may be revealed by utilizing time-domain measurements [20,21].
Numerous papers are published annually on FLIM-assisted research on various processes in cells in vitro with both endogeneous and exogeneous fluorophores; see [22,23,24,25,26,27] for some recent examples. In vivo studies utilizing FLIM have also gained popularity both for research purposes and as a diagnostic tool in clinics [28,29,30,31]. Some studies also concerned time-resolved detection of photosensitizer fluorescence and its analysis [19]. At the same time, analyses of ex vivo tissue samples are relatively rare so far. One of the first applications of the FLIM of endogeneous fluorophores along with multiphoton imaging for the analysis of samples obtained from resected brain tumors [32] allowed for the segmentation of a tumor from normal brain tissue. However, no identification of fluorescing agents was performed in that paper. Rodimova et al. [33] used fluorescence lifetimes of the endogeneous fluorophore NAD(P)H in rat liver tissue samples in order to map tissue metabolism. The lifetimes of the same cofactor were applied by Lukina et al. for the analysis of energy metabolism in postoperative glioma and colorectal tumor samples of individual patients [34]. To the best of our knowledge, no research on the accumulation of exogenous PSs in tissues through a time-resolved analysis of tissue samples has been reported so far.
In this paper, we present an FLIM-assisted investigation of ex vivo samples of malignant and normal tissues in a murine model with mammary adenocarcinoma intended for the analysis of the in vivo accumulation of a chlorin-based PS, Radachlorin, in these tissues.

2. Materials and Methods

2.1. Radachlorin Photosensitizer

As a photosensitizer, we used Radachlorin (RadaPharma, Russia), which is a clinically approved chlorin-based PS that comprises sodium salts of chlorin e6 (≈80%), purpurin 5 (≈15%), and chlorin p6 (≈5%). The basic photophysical properties of Radachlorin in solutions were thoroughly studied by a number of research groups (see, e.g., [35,36,37,38,39]). The dynamics of the in vitro accumulation of Radachlorin in cells of established cell lines of different origins and the kinetics of its photobleaching in cells and on biological surfaces were recently reported in [12,40]. The in vitro responses of cells of established lines and those obtained from tumor materials of patients to photodynamic treatment (PDTr) with Radachlorin were analyzed using digital holographic microscopy [41,42]. The results obtained demonstrated considerable variations in the sensitivity of different cell lines to PDTr with Radachlorin, which could be partially explained by the differences in PS uptake and photobleaching rate, as well as in the intracellular concentration of molecular oxygen and antioxidant species [12].
Radachlorin is an efficient photosensitizer that exhibits relatively low dark toxicity and rapid and efficient accumulation in target tissues [36]. Radachlorin is applied primarily for cancer treatment through the photosensitized generation of singlet oxygen and other reactive oxygen species, as was demonstrated in several clinical studies [43,44] and in vitro experiments [45]. Aside from its antitumor performance, it was shown to be promising for the inactivation and inhibition of viral [46] and microbial [47,48] pathogens.

2.2. Animals

One female and five male FVB/N strain mice with 20–22 g of body weight and carrying the erbB2 (HER2) gene (originating from Charles River Laboratories and maintained as local breeding stock in the husbandry of N.N. Petrov National Medical Research Center of Oncology) were used in this study. This mice strain is characterized by a high incidence of the development of spontaneous HER2-positive mammary adenocarcinomas (in females, up to 100%; in males, in rare cases) [49]. The animals were maintained on a 12:12 light/dark cycle (lights on at 08:00 a.m., lights off at 08:00 p.m.) at 22 ± 2 C with a 50 ± 20% average humidity, and with ad libitum access to tap water and the PK120 laboratory diet (Laboratorkorm, Moscow, Russia). The animal experiments were performed in compliance with the ethical principles established by the European Convention for the Protection of Vertebrate Animals used for Experimental and Other Scientific Purposes (accepted in Strasbourg 18.03.1986 and confirmed in Strasbourg 15.06.2006). The study was approved by the Local Ethical Committee of FSBI of the N.N. Petrov National Medical Research Center of Oncology (Protocol No. 20 of 19.11.2020).

2.3. Mammary Cancer Model and PS Administration

Male mice were inoculated subcutaneously with a 20% suspension of tumor tissue taken from a female mouse of the same strain with a spontaneous mammary adenocarcinoma that was 10 mm in diameter, with a slight modification of the procedure described earlier [50]. A total of 21 days after inoculation, when the tumor reached about 10 mm in diameter, the skin above the tumor was depilated, and Radachlorin (10 mg/kg) or placebo (sterile 0.9% NaCl solution) was injected intraperitoneally. After 3 h, the animals were euthanized via CO 2 inhalation, and the tumors were immediately excised, placed in an ice-cooled PBS solution, and divided into two equal parts. One part of the tumor was irradiated with a 662 ± 3 nm semiconductor ALOD-01 laser apparatus (Alcom Medica LLC, St. Petersburg, Russia) with a dose of 300 J/cm 2 , and the other part served as a control without further treatment. The time for PS accumulation was chosen based on our previous studies [51]. The comparative analysis of irradiated and non-irradiated photosensitized tumor samples allowed us to verify the suggested approach, since partial photobleaching of the PS resulted in an a priori decrease in its concentration.
In addition to the tumor tissues, samples of testicular tissues were taken from the mice that were treated and not treated with Radachlorin. Testicular tissue was chosen due to (1) its blood–tissue barrier and (2) our previous observations of the penetration of Radachlorin into the testicles. The analysis of PS accumulation in testicles is considered to be important for further applications.

2.4. Preparation of Histological Tissue Samples

Immediately after excision, the tissue samples were ice-cooled and packed into a dark container; within 15 min, they were transported to a room for the preparation of cryosections. Upon arrival, the samples were fast-frozen in an automatic sample preparation device (PrestoCHILL; Milestone, Italy). Tissue sections that were about 3 µm thick were prepared on a freezing rotary microtome (Leica CM1950; Germany), placed on glass slides, mounted with a ready-made mounting medium (Vitrogel; Italy) based on acrylic resins with a refractive index of 1.5, and covered with cover slips. The obtained tissue slides were placed in a dark container without access to light and were transported to the laboratory for fluorescent analysis. The samples were examined by means of fluorescence lifetime imaging microscopy (FLIM) within the next 24 h after preparation.

2.5. Examination of Histological Samples through FLIM

Confocal fluorescence microscopy assisted by time-resolved fluorescence lifetime imaging was employed for the analysis of the content and distribution of Radachlorin in the histological preparations. The device was based on a Nikon TI2-A inverted microscope with a 20 × 0.7 NA microscope lens equipped with the DCS-120 confocal FLIM System by Becker&Hickl. Time-resolved fluorescence signals were recorded in several dozen fields of view in each sample with an HPM-100-40 Hybrid GaAsP Photodetector (Becker&Hickl, Berlin, Germany) within the spectral band of 608–683 nm, and an interference bandpass filter was chosen. The excitation of the fluorescence of Radachlorin was performed with a picosecond laser (BDS-SM; Becker&Hickl) operating at 405 nm with a pulse duration of 60 ps. The laser pulse frequency was set to 20 MHz so that the complete fluorescence decay could be observed. The signal accumulation time comprised 100 s, and the FWHM of the instrument response function (IRF) of the system was equal to 120 ps. The relatively low intensity of the excitation laser’s radiation allowed us to maintain almost bleaching-free conditions during the analysis of the samples. To achieve robust results, special care was taken to ensure that no significant decrease in fluorescence intensity occurred after several measurements of the same field of view with the same accumulation time of 100 s.
The acquired FLIM images were analyzed using a self-developed MATLAB-based software and the SPCImage NG Data Analysis Software (Becker&Hickl) for the evaluation of the fluorescence lifetime images. To enhance the accuracy, spatial binning was performed when analyzing the obtained time-resolved signals so that each analyzed signal would contain at least 2000 photons.
Phasor plots [52] of the FLIM images were calculated from the data obtained for 5 investigated samples using the SPCImage NG Data Analysis Software. Note that the phasor plots were constructed based on the data obtained from several fields of view within each sample.

2.6. Analysis of the Fluorescence Lifetime Distributions

Alongside the data on the fluorescence intensity distributions obtained through confocal fluorescence microscopy, time-resolved photon counting provided information on the fluorescence lifetimes at each pixel of the image. Representative examples of the FLIM images of the same fields of view as the fluorescence intensity images shown in Figure 1a–e are displayed in Figure 1f–j, where the pseudocolored lifetime scale within the range of 2–5 ns was used. As can be seen in Figure 1, the lifetime distributions determined in the samples with and without Radachlorin were significantly different.
Moreover, due to the apparent inhomogeneity of the microenvironment within the samples, some variations in the fluorescence lifetime were found in all of the samples. This was especially clear for the Radachlorin-containing samples shown in Figure 1i,j, and this was due to the uneven distribution of PS molecules in the tissues. A statistical analysis of the data collected from several dozens of FLIM images in each sample was performed for the estimation of the mean values of the fluorescence lifetimes.
The recorded time-resolved fluorescence signals demonstrated a multi-exponential decay and could be approximated by the function:
I ( t ) = I 0 N i a i e t / τ i ,
where i 1 , N is a fluorophore concentration, τ i is a fluorescence decay time, a i is a corresponding weighting coefficient, and I 0 is a constant proportional to the excitation light intensity, dipole transition matrix elements, and fluorescence quantum yield.
However, for the sake of clarity and the simplicity of the analysis, the fluorescence lifetimes shown in Figure 1f–j were calculated using a single-exponential fitting function. To justify the eligibility of this simplified approach, we compared the accuracy of the fitting of the signals with the single- and double-exponential functions. As the time-resolved fluorescence signals in the Radachlorin-containing samples were notably inhomogeneous, only homogeneous areas with similar morphologies were selected in each field of view for further analysis. Binning over 49 pixels was performed to increase the number of recorded photons and to enhance the fitting quality. Single- and double-exponential fitting was performed for each of the selected areas, and the data obtained were averaged over each sample.

3. Results and Discussion

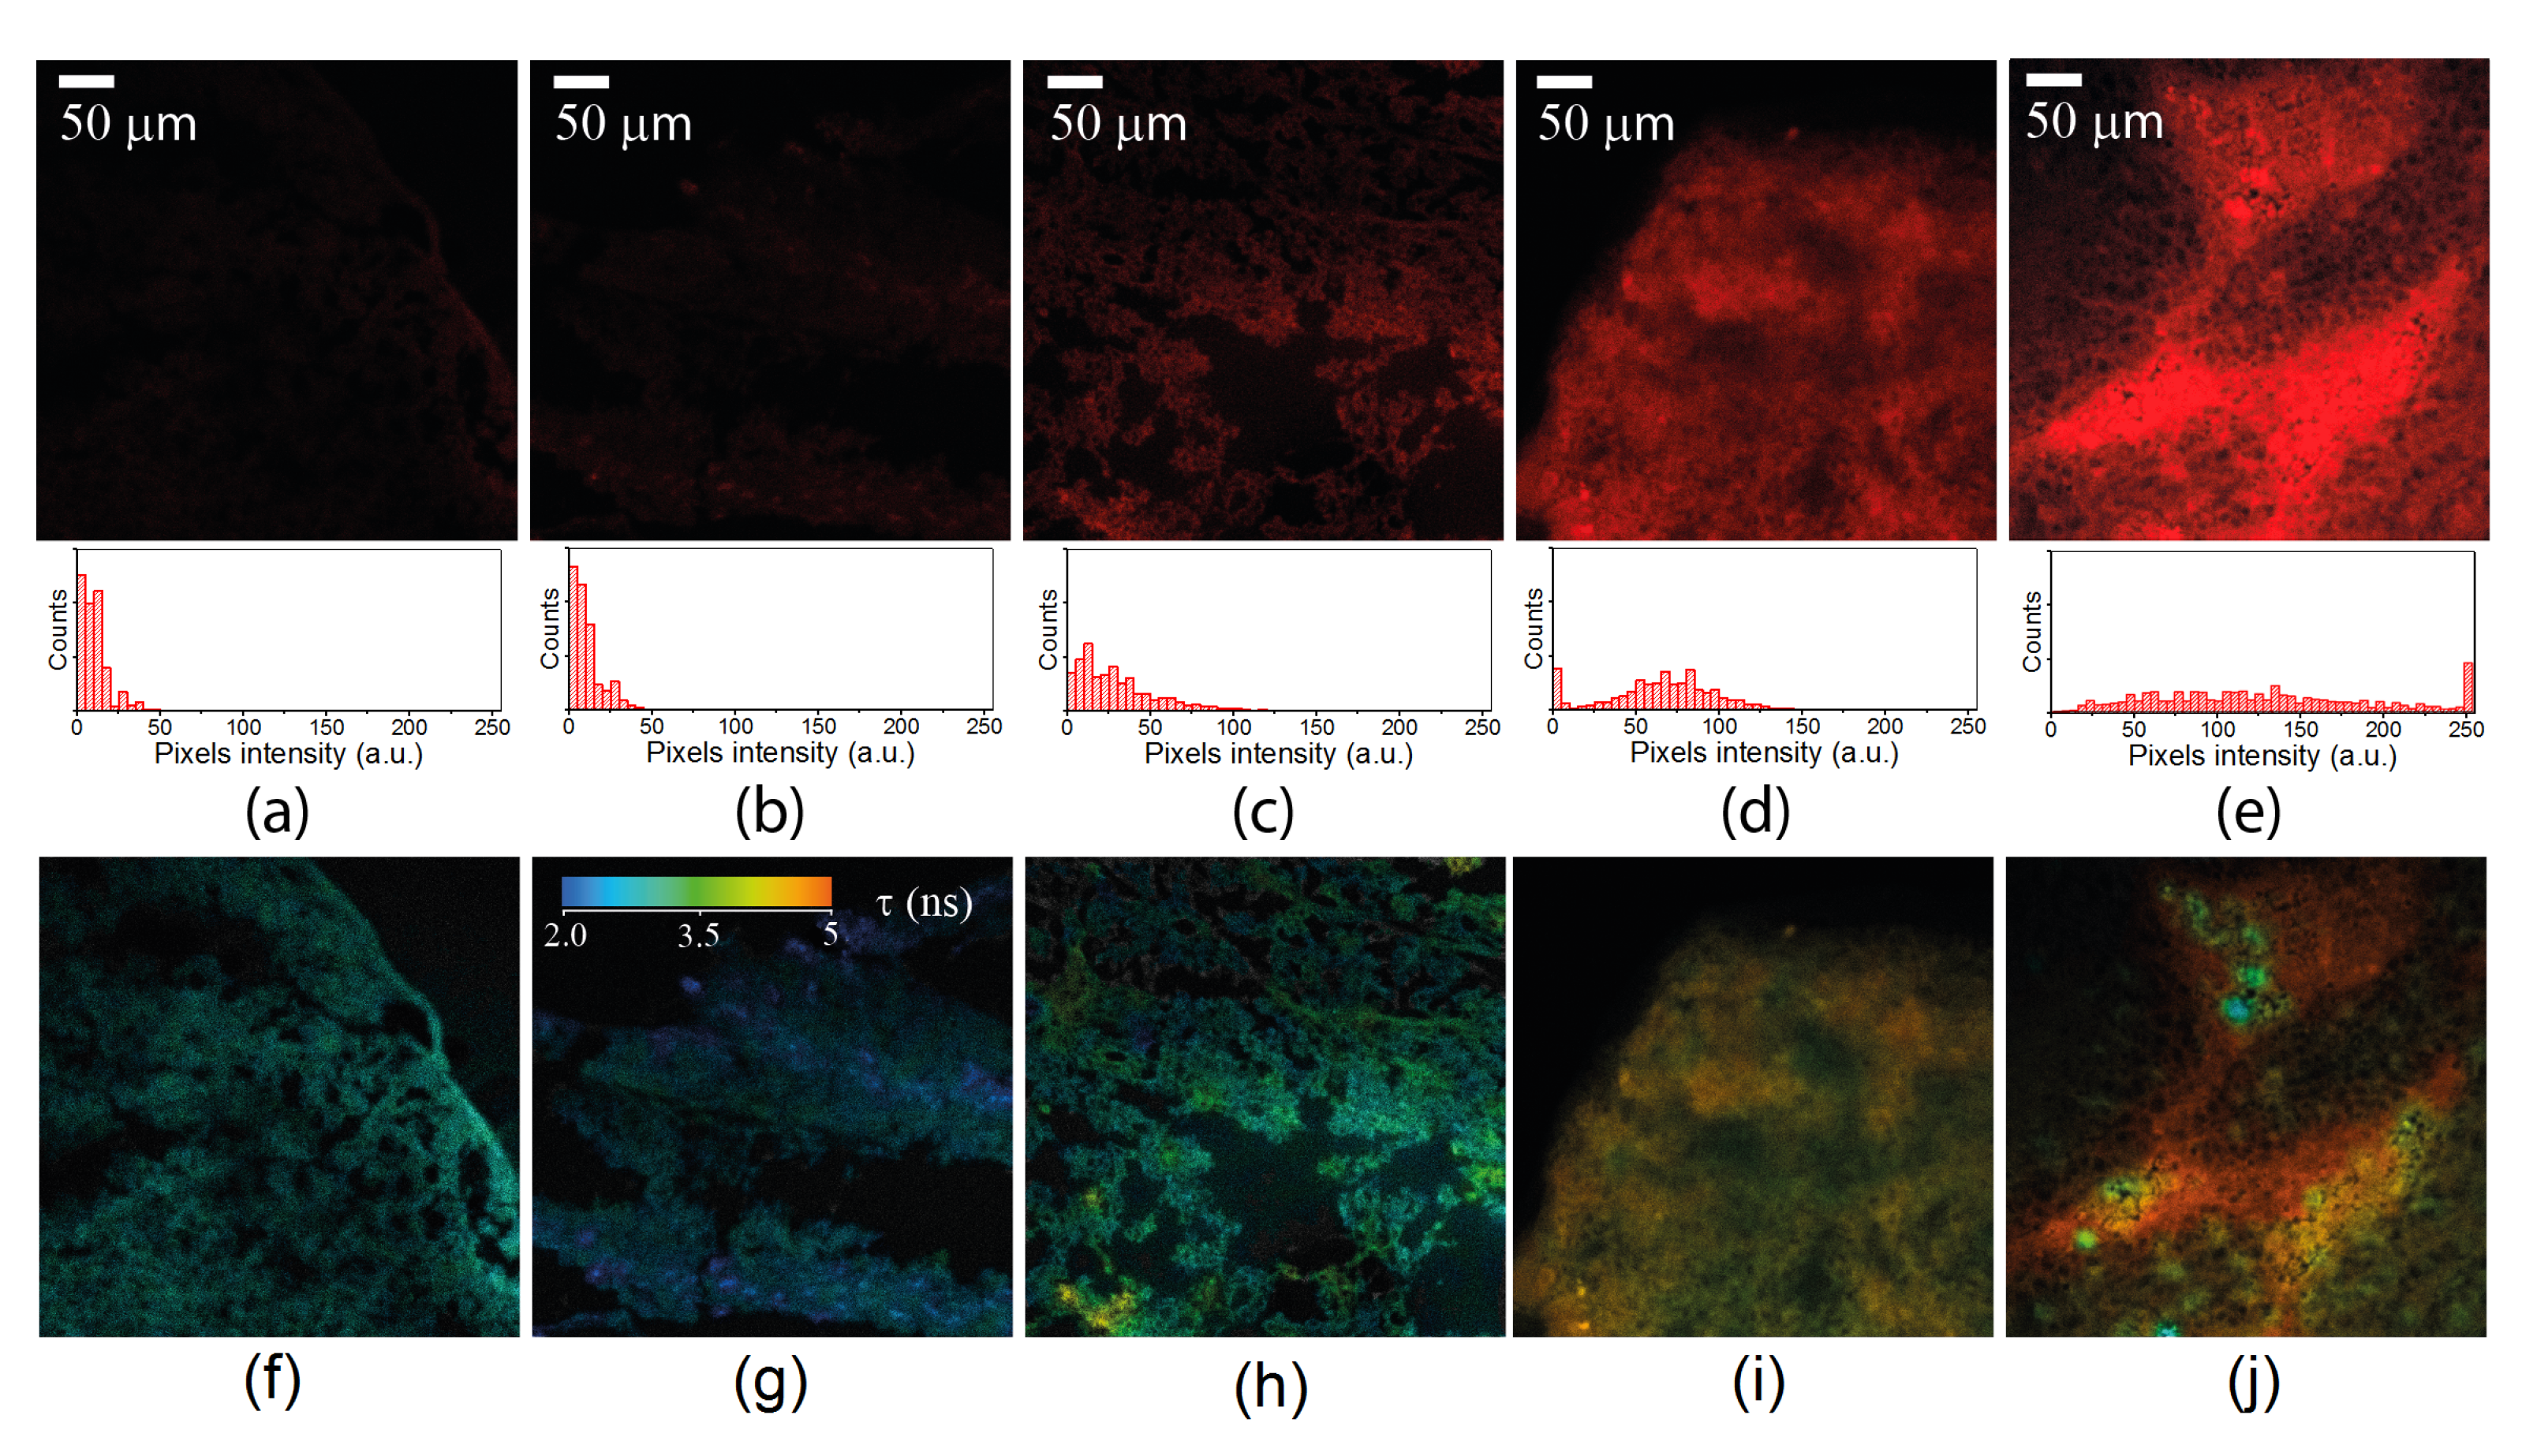
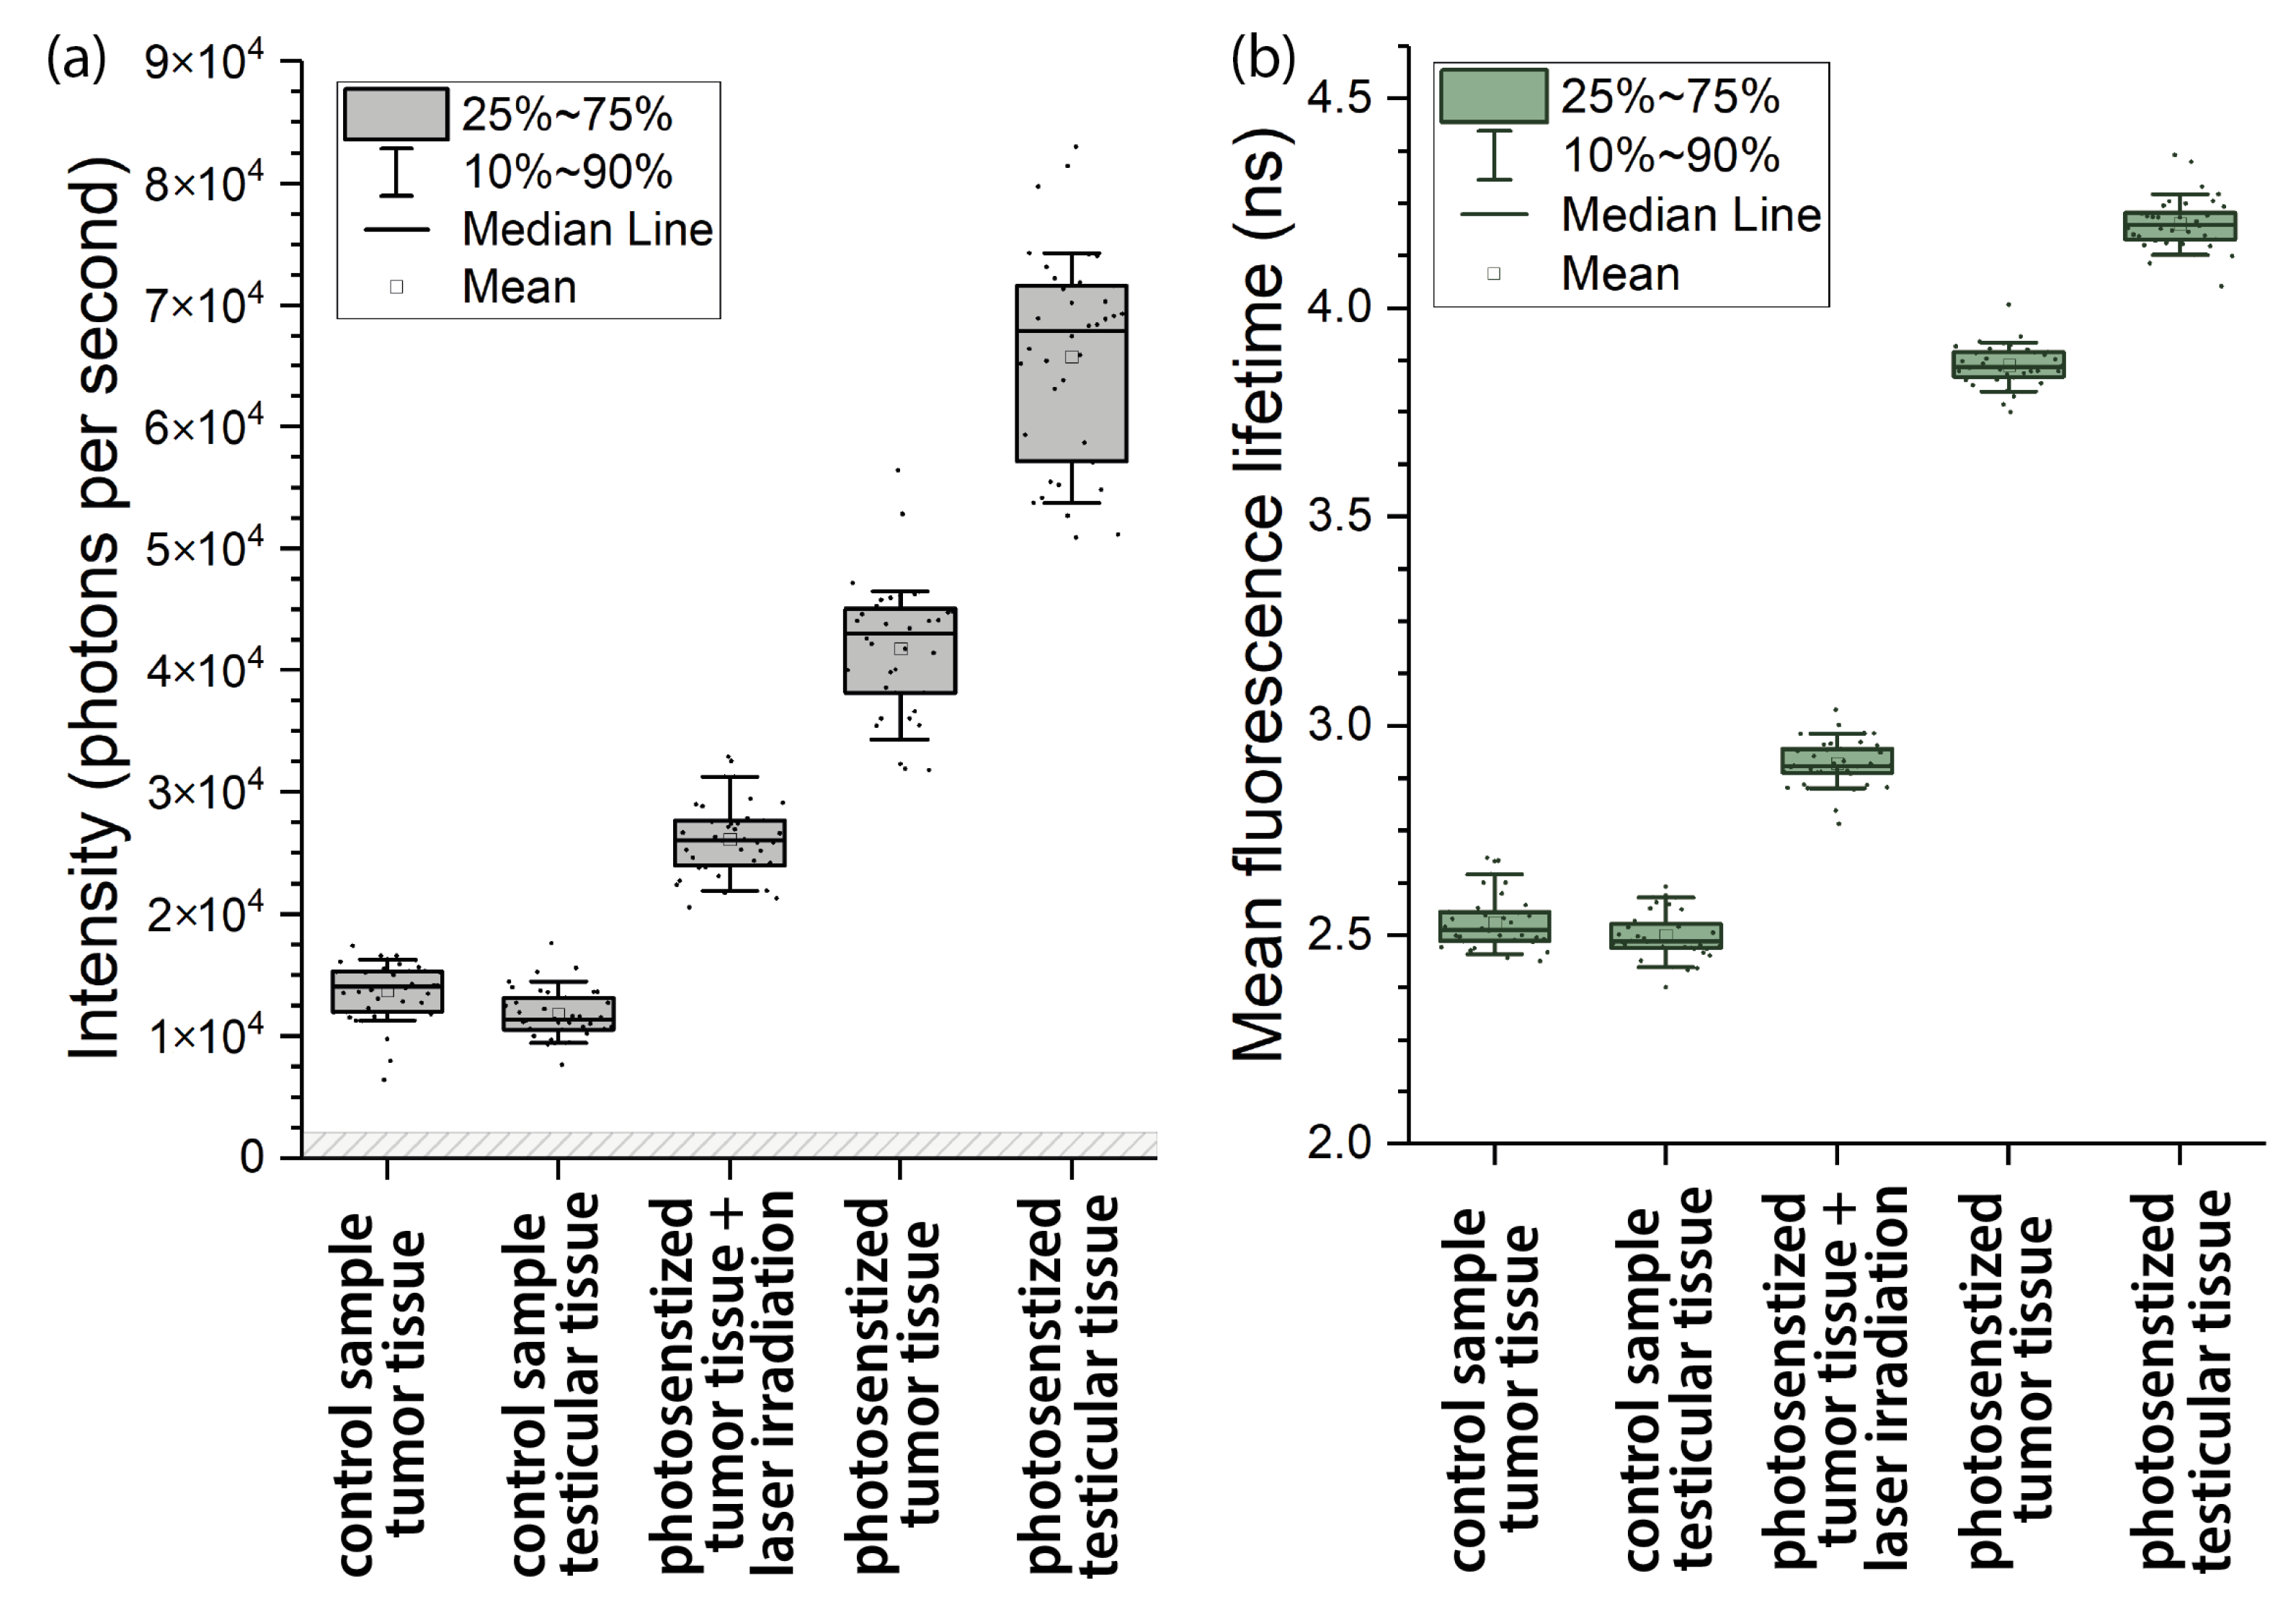
3.1. Detection of Radachlorin Distributions through the Analysis of Fluorescence Intensity in the Spectral Range of 608–683 nm

Along with the detection of Radachlorin fluorescence in the samples obtained from the PS-treated animals, robust fluorescence signals were also observed in the control samples that did not contain PSs. These signals were apparently related to autofluorescence from intrinsic fluorophores, which could be excited at 405 nm and could fluoresce in the range of 608–683 nm, such as FAD, PpIX, etc. Figure 1 demonstrates the typical fluorescent images of different samples obtained at the same excitation laser intensity and accumulation time. The images clearly show that even control samples obtained from non-treated animals exhibited weak fluorescence.
As can be seen from the images in Figure 1, the fluorescence intensity was distributed highly inhomogenously in both the control samples and the samples obtained from animals treated with Radachlorin. Therefore, a numerical analysis of several dozens of fields of view within the samples was performed for a qualitative evaluation of the relative accumulation of Radachlorin in the samples. Note that the observed mean fluorescence signals in all images in Figure 1 were much higher than the dark noise level of about 2500 photons per second. The mean values of the fluorescence intensity were calculated for each fluorescent image within the areas covered by tissue.
The results obtained are shown in a box-plot form in Figure 2a. In spite of some variations in fluorescence intensity in different fields of view in each sample, a clear difference in the mean fluorescence intensity was observed among the samples. The fluorescence intensity of the control samples of both the tumor and testicular tissues (Figure 1a,b) was nearly the same and had no statistically significant differences, which led to the conclusion that approximately the same concentrations of autofluorescent species were in these tissues.
Meanwhile, the fluorescence intensity in the tumor tissue taken from the PS-treated mice (Figure 1d) was about four times higher than that in the control samples. In the testicular tissue, the fluorescence intensity was even higher (Figure 1e), at about five-fold what it was in the control samples. Taking into account the inevitable contribution from autofluorescence in Figure 1a,b, the mean Radachlorin fluorescence intensity was estimated to be 4.3 × 10 4 photons per second in the tumor tissue (Figure 1d) and 6.7 × 10 4 photons per second in the testicular tissue (Figure 1e).
In addition, as can be seen in Figure 1c,d, the fluorescence intensity of the Radachlorin-containing tumor tissue irradiated by the 662-nm laser at 300 J/cm 2 (2.6 × 10 4 photons per second) was significantly lower than that of the non-irradiated photosensitized tumor tissue (4.3 × 10 4 photons per second). The major reason for this noticeable difference in fluorescence intensities was PS photobleaching.

3.2. FLIM-Assisted Analysis of Fluorescence Lifetime Distributions

Table 1 presents the decay times, corresponding weighting coefficients, and χ 2 values calculated from the single- and double-exponential fits.
As can be concluded by considering the χ 2 values in Table 1, single-exponential fit of our time-resolved fluorescence signals was quite a rough approximation, while double-exponential fit provided more reliable results. At the same time contribution of each term in the sum in Equation (1) to the fluorescence intensity in Figure 1 is proportional to the corresponding decay times τ i according to the expression:
I t o t = I ( t ) = I 0 N i a i τ i ,
where I t o t is a total fluorescence intensity in each pixel in Figure 1, i = 1, 2 and angular brackets mean integration over time.
Since the decay times τ 2 in Table 1 are much longer than the times τ 1 , they gave the major contribution to the fluorescence intensities I t o t in Figure 1. Therefore, even in the case of double-exponential fit the fluorescence intensity was roughly proportional to a single term I 0 N a 2 τ 2 in Equation (2). In the case of single-exponential fit the fluorescence intensity was proportional to the term I 0 N τ , where τ is given in the 2-nd column in Table 1. Having in mind a highly sophisticated structure of the images in Figure 1 that allowed to perform only a qualitative analysis, we used both single- and double-exponential approaches to study the relative uptake of the PS in tissues since both of them had similar accuracy within the calculated error bars.
For better elucidation of the nature of Radachlorin fluorescence lifetimes in tissues these lifetimes were measured also in solutions. According to our experiments in various solutions Radachlorin fluorescence decayed monoexponentially. The determined fluorescence lifetime of Radachlorin in water comprised about 3.5 ns, while in 50% water-ethanol and 50% water-methanol mixtures, the organic solutions with lower polarity than that of pure water, the lifetime rose up to 4.5 and 4.2 ns, respectively.
There could be several physical reasons for the double-exponential decay of Radachlorin fluorescence in tissues. As can be seen in Table 1 and in Equation (2), the exponential decays with the times τ 1 and τ 2 contributed to the fluorescence intensity almost equally. In addition, the longer lifetime τ 2 was close to the lifetime recorded for free Radachlorin in organic solutions, while the lifetime τ 1 was 4–5 times shorter. Therefore, the longer lifetime τ 2 could characterize relatively free Radachlorin molecules in the intercellular space or in the cell cytosol, while the shorter lifetime τ 1 could characterize interactions with the cellular organelles. Radachlorin molecules could collect at cellular organelles and undergo a reversible chemical reaction with the microenvironment upon laser excitation. It is known [53] that the reversible chemical reactions in the excited molecular states can result in biexponential fluorescence decay kinetics in which the value of an additional decay time ( τ 1 in Table 1) depends on the reaction details and can be much shorter than the initial one [54]. The reason for the multiexponential decay of Radachlorin’s fluorescence could also be the contribution from multiple autofluorescing species in the environment, such as flavins and porphyrins, which fluoresce in the range of 608–683 nm under excitation at 405 nm.
The fluorescence decay times τ averaged over the images in Figure 1f–j are presented in Figure 2b. As can be seen in this figure, the typical fluorescence lifetimes in all control samples were practically the same and varied within the range of 2.45–2.65 ns. These values nicely fit the longest lifetimes observed in FAD in cells [55]. At the same time, the fluorescence decay times in the Radachlorin-containing tissues shown in Figure 2 were considerably longer and varied within the range of 3.7–4.5 ns. These values were close to the Radachlorin fluorescence lifetimes in the solutions mentioned above and those in living cells (of about 4–5 ns), which we very recently reported [56]. Therefore, the analysis of fluorescence intensity and mean lifetimes shown in Figure 2 undoubtedly suggests that Radachlorin gave a major contribution to the fluorescence intensity in all of the Radachlorin-containing samples.
The data in Figure 2 can also be used for the estimation of the PS uptake in tissues. As can be seen in Equation (2), the fluorescence intensity I t o t was proportional to the product of the PS concentration N and the fluorescence lifetime τ . Therefore, the ratio I t o t / τ can be used for the analysis of the PS uptake if all other experimental parameters in Equation (1) are the same. As can be seen in Figure 2, the range of variations in the fluorescence lifetime in the samples was smaller than that of the fluorescence intensity. This result suggests that the samples exhibiting more intensive fluorescence contained higher amounts of Radachlorin.
We did not proceed with more detailed calculations of the PS uptake in this study because the data in Figure 2 were obtained from different fixed samples, and we could not be certain that other experimental parameters (e.g., quantum yield) in these samples were the same. However, we believe that a similar approach can be applied for the analysis of the PS uptake in the same tissues under different conditions or for the monitoring of PS photobleaching in a sample as a function of time.

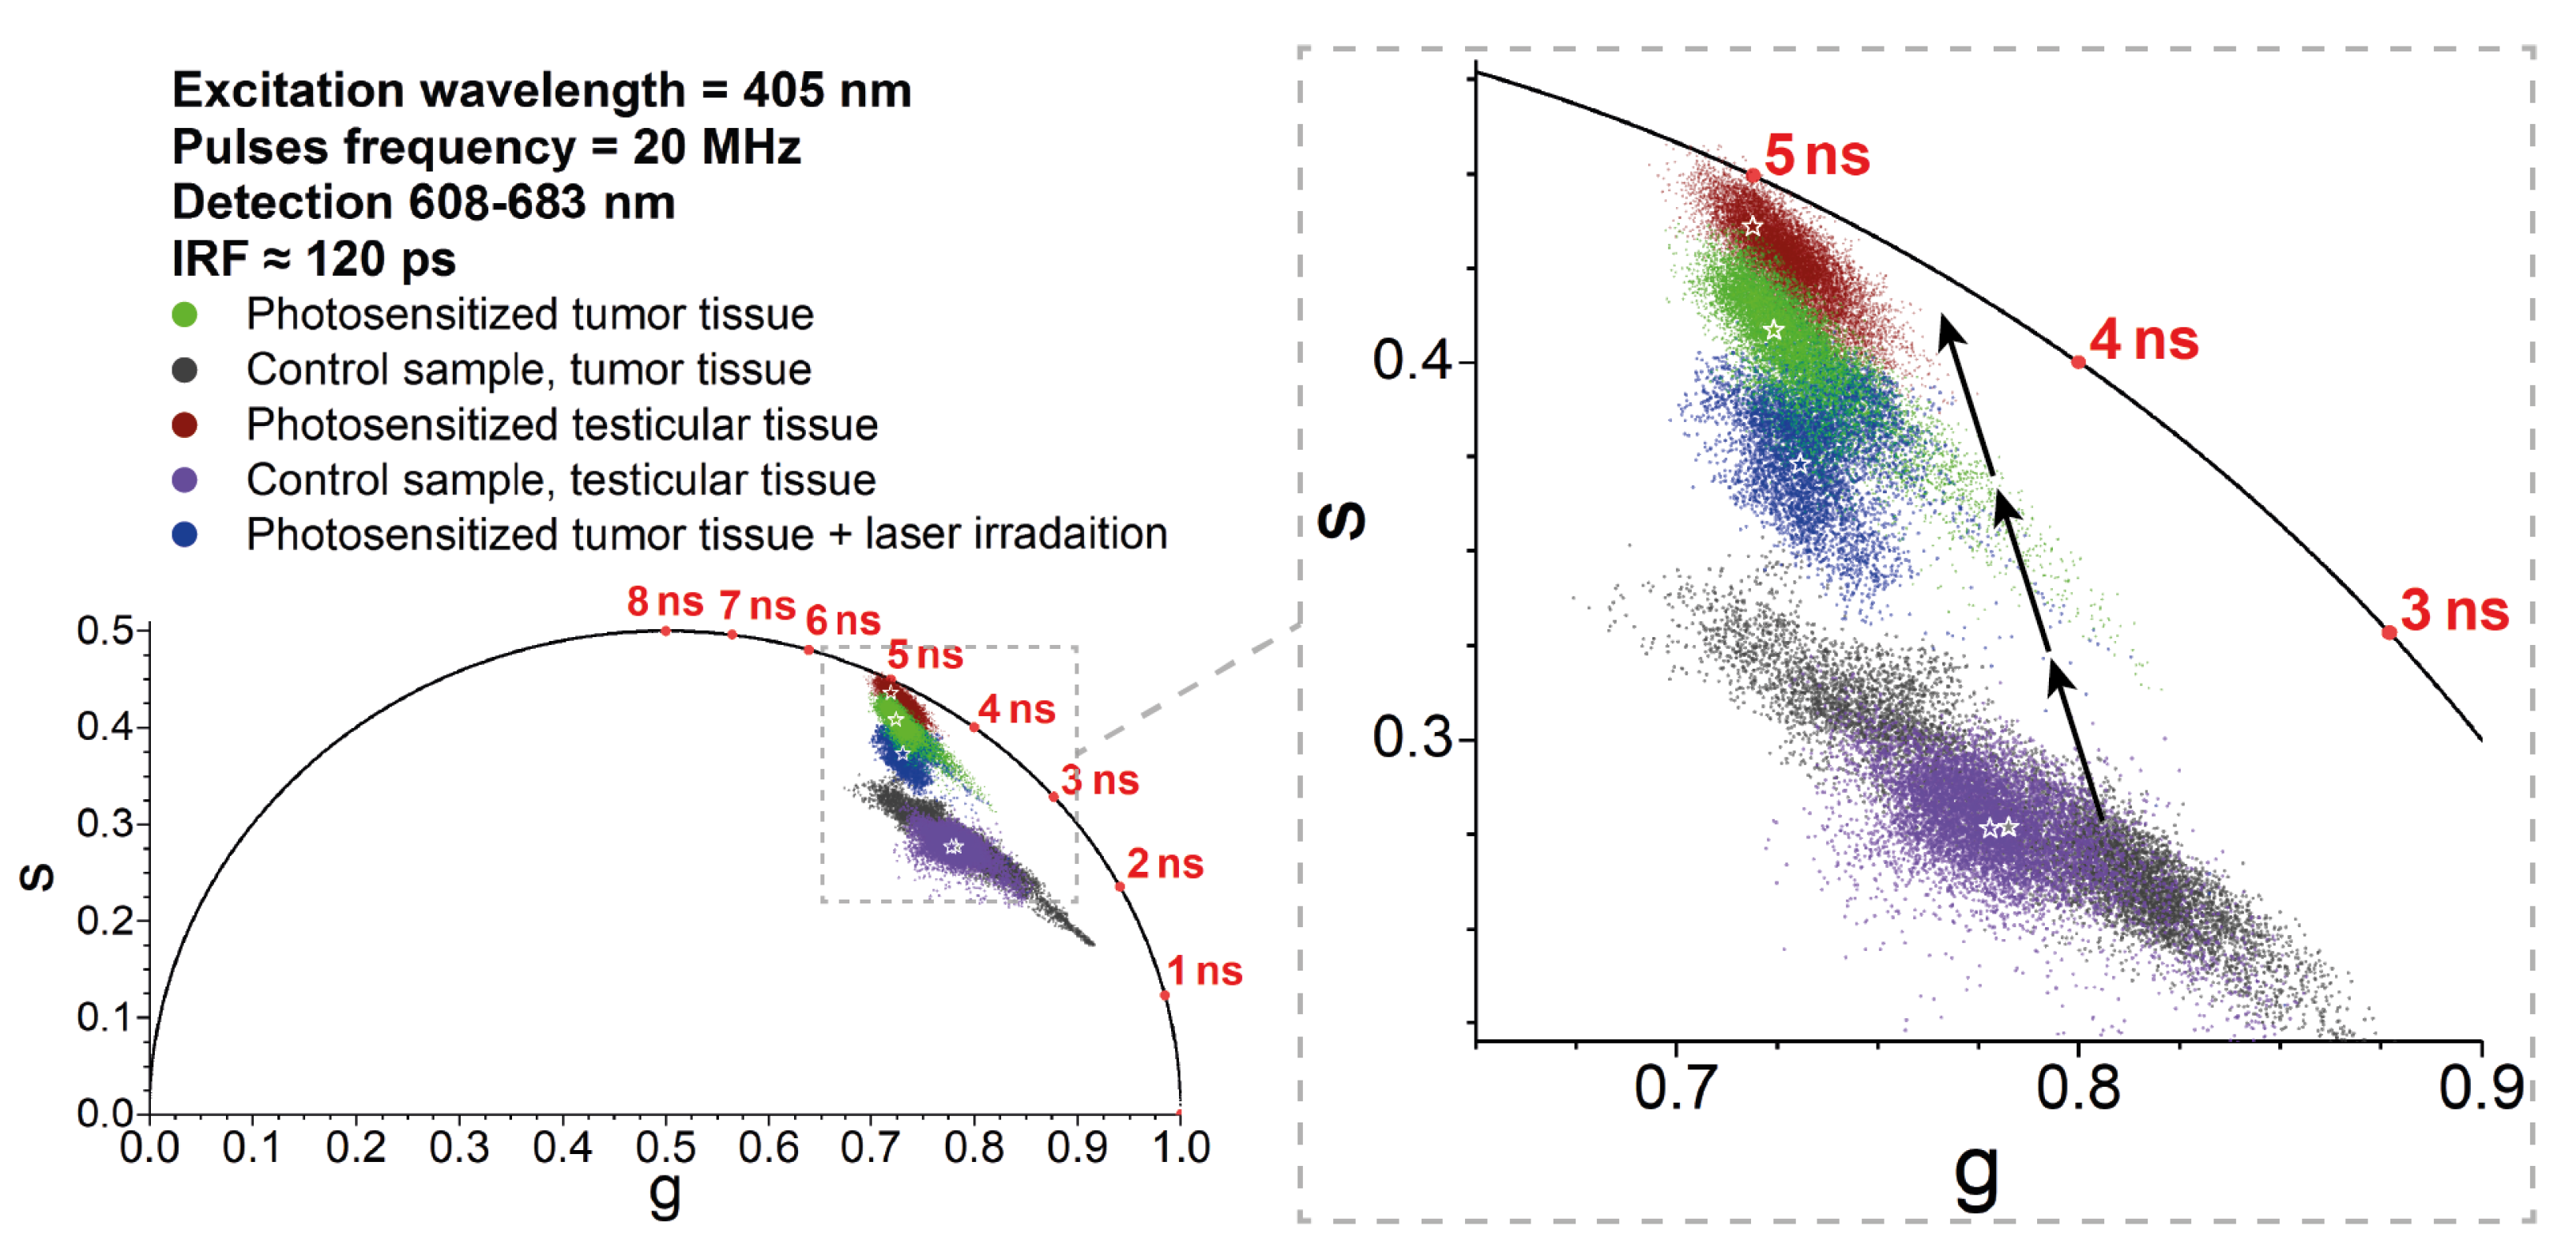
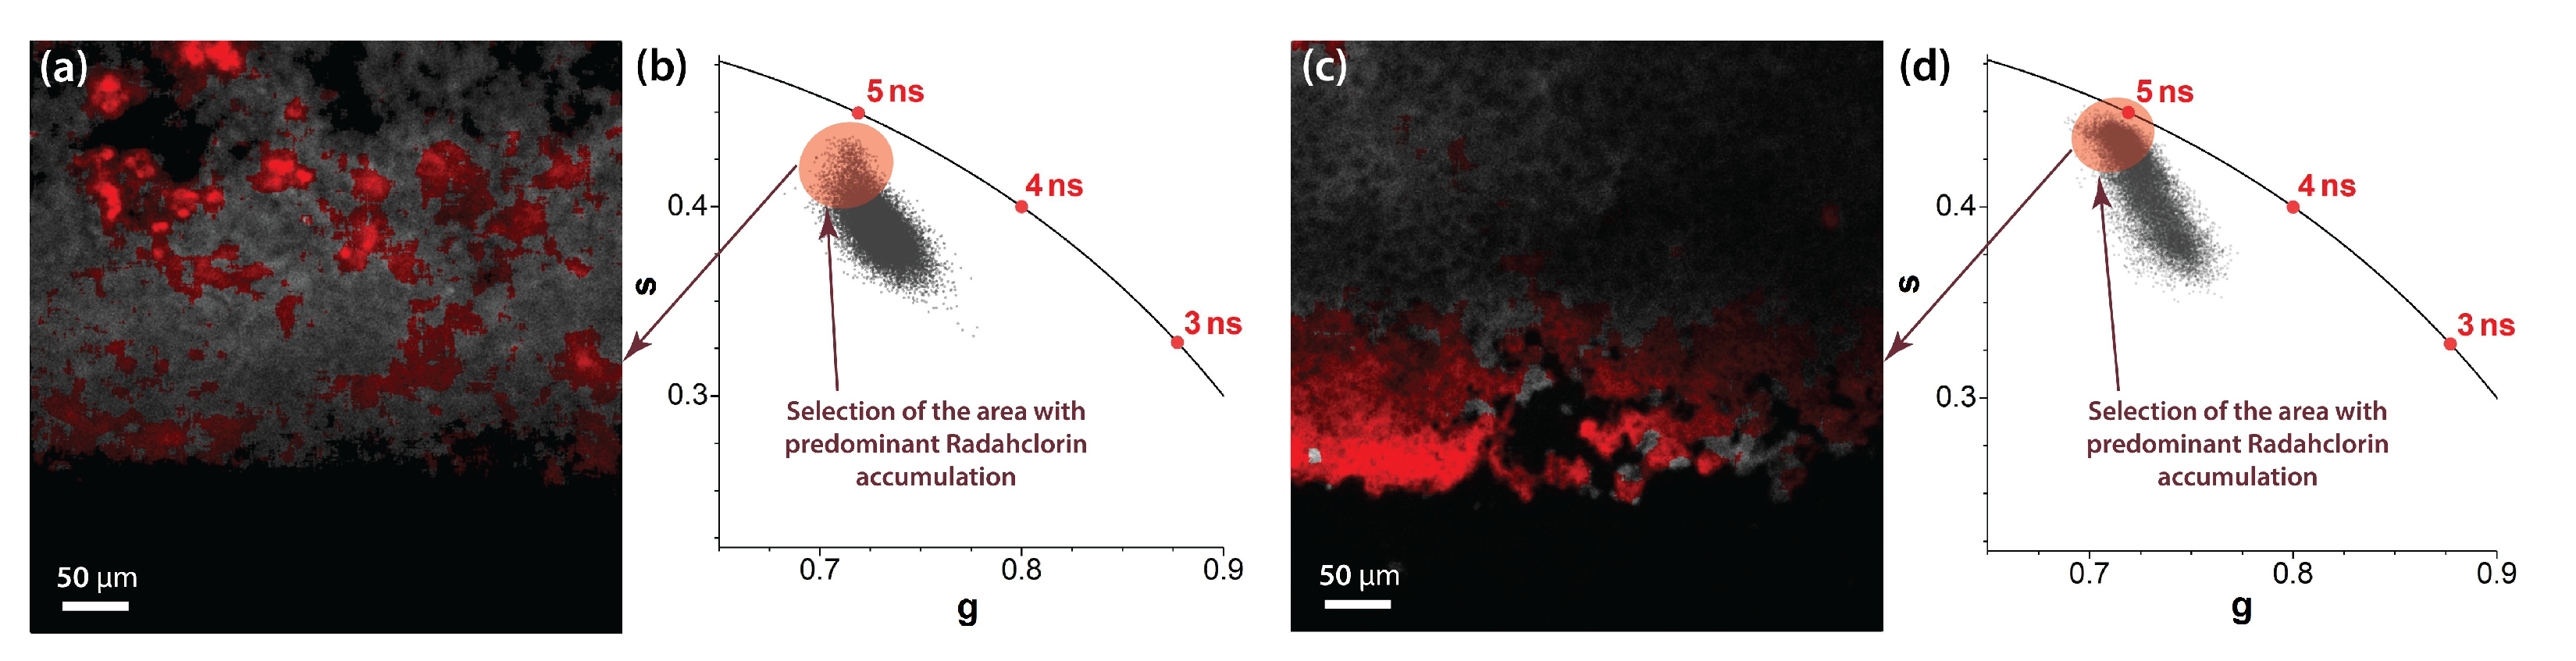
3.3. Analysis of Time-Resolved Signals Using Phasor Plots

The variations in the fluorescence lifetimes could be analyzed by using phasor plot representations, which allowed the evaluation of the fluorescence lifetimes and visual identification of whether the signals obeyed single- or multi-exponential decay kinetics [52,57,58]. Figure 3 presents phasor plots that were constructed for a number of fields of view in each tissue sample. As can be seen in Figure 3, the locations of the points inside the semicircles indicate the multi-exponential decay kinetics of the detected signals (see [59,60] for a detailed description of phasor analysis). It is important to note that the laser light at 405 nm used in our experiments could also result in the excitation of a variety of intracellular autofluorescent species [61,62]. This excitation was clearly visible in the control samples that did not contain Radachlorin.
The phasor analysis demonstrated that the time-resolved signals from the control samples were definitely multi-exponential (due to the tissue autofluorescence), while in the presence of Radachlorin, the signals typically became more `single-exponential’ due to the domination of Radachlorin’s fluorescence with an intensity that was 4–6 times greater than that of the autofluorescent species. The contribution of Radachlorin’s fluorescence brought the phasor plot data closer to the lifetime of about 5.1–5.2 ns, which was close to Radachlorin’s fluorescence lifetime in living cells [56]. The typical fluorescence lifetimes and locations of the data in the phasor plots for the sample of photosensitized tumor tissues irradiated with the 405-nm laser had intermediate values between the control and PS-loaded samples, but the non-irradiated samples. As we mentioned above, this could be due to the partial photobleaching and degradation of PS molecules.
The clearly visible trajectory of the phasor plots corresponding to the increasing PS concentration is indicated in Figure 3, which describes the transformation of the time-resolved fluorescence signal from the control sample (exhibiting autofluorescence only) to the purely single-exponential Radachlorin fluorescence signal. In addition to the comparison of the accumulation of Radachlorin in different tissues, the phasor plot can also be used for the identification of the areas of predominant PS accumulation within the same field of view. To achieve that, one can use the phasor plot reciprocity [52,58] and identify only the pixels that are located close enough to the point of the single-exponential Radachlorin lifetime of about 5.1 ns. An example of such an allocation of the areas with predominant Radachlorin accumulation within a single field of view using the phasor plot is shown in Figure 4 for the samples of photosensitized tissues of a tumor (Figure 4a,b) and testicle (Figure 4c,d).

4. Discussion and Conclusions

In this study, we demonstrated the applicability of time-resolved fluorescence microscopy, the estimation of fluorescence lifetime values, and a phasor plot analysis of ex vivo samples for the investigation of the relative accumulation of the Radachlorin photosensitizer in different types of tissues. The proposed approach can be used for the evaluation of the accumulation of Radachlorin in tissues in in vivo studies using macro-scanner TCSPC detection systems [63,64], time-gated wide-field detection [65], or fiber optics [66]. Moreover, we believe that the analysis of time-resolved fluorescence signals in vivo and phasor plot analysis can potentially be used for the evaluation of Radachlorin photobleaching in the course of photodynamic therapy.
The major advantage of an analysis based on time-resolved data is the independence from the fluorescence signal intensity. The detected fluorescence intensity may depend on a variety of conditions, including the laser intensity, exposure, sensitivity, sample thickness, etc. On the other hand, the fluorescence lifetime imaging and phasor plot analysis allowed for the easy detection of PS-loaded tissues independently from the detected intensity and without taking into consideration the diversity of experimental parameters. The relatively long fluorescence lifetime of Radachlorin in cells and tissues makes it easy to detect the difference between time-resolved signals from tissues with low and high PS concentrations. Since the fluorescence lifetime of Radachlorin is longer than typical autofluorescence lifetimes, when a complex multi-exponential signal is fitted with the single-exponential decay function, the resulting fluorescence lifetime depends on the ratio of the intensities of Radachlorin and autofluorescence. Therefore, the tissues and the areas with enhanced Radachlorin accumulation can be distinguishable from samples or areas in which Radachlorin did not accumulate, or those in which it accumulated in only a small amount. Thus, in spite of the excitation of Radachlorin molecules within the Soret absorption band at the wavelength of 405 nm, where many autofluorescent species were excited as well, the application of time-resolved fluorescence analysis allowed robust data on relative PS accumulation in tissues to be obtained.
The application of time-resolved fluorescence microscopy allowed us to demonstrate that the accumulation of Radachlorin in testicular tissues was higher than that in tumor tissues, which should be taken into account when applying PDT with Radachlorin. Photodynamic treatment of the photosensitized tumor resulted in photobleaching of the PS molecules, which could also be detected by the analysis of time-resolved fluorescence signals. Partial photobleaching of the irradiated tumor sample resulted in somewhat of a decrease in the PS concentration in comparison with that in the tumor sample that was not subjected to irradiation. A comparative analysis of both the fluorescence lifetime images and phasor plots of these samples allowed us to see the difference: The typical fluorescence lifetime in the irradiated sample was about 0.8 ns lower than that in the non-irradiated one. Moreover, the typical positions of the coordinates in the phasor plot of the irradiated sample were closer to those in the control sample, which additionally validated the proposed approach of FLIM-assisted analysis.

Author Contributions

Conceptualization and methodology, A.V.B., A.A.Z. and O.S.V.; validation and investigation, S.S.K., A.A.Z. and A.V.B.; data curation and writing, A.V.B. and I.V.S.; supervision, O.S.V. and A.V.P. All authors have read and agreed to the published version of the manuscript.

Funding

The financial support from the Russian Science Foundation under the grant #21-72-10044 is gratefully acknowledged.

Institutional Review Board Statement

Animal experiments were performed in compliance with the ethical principles established by the European Convention for the Protection of Vertebrate Animals used for Experimental and Other Scientific Purposes (accepted in Strasbourg on 18.03.1986 and confirmed in Strasbourg on 15.06.2006). The study was approved by the Local Ethical Committee of FSBI of the N.N. Petrov National Medical Research Center of Oncology (Protocol No. 20 of 19.11.2020).

Informed Consent Statement

Not applicable.

Data Availability Statement

The data are available within the paper.

Acknowledgments

The authors are grateful to RadaPharma for providing Radachlorin for the experiments.

Conflicts of Interest

The authors declare no conflict of interest.

References

  1. Usuda, J.; Kato, H.; Okunaka, T.; Furukawa, K.; Tsutsui, H.; Yamada, K.; Suga, Y.; Honda, H.; Nagatsuka, Y.; Ohira, T.; et al. Photodynamic Therapy (PDT) for lung cancers. J. Thorac. Oncol. 2006, 1, 489–493. [Google Scholar] [CrossRef]
  2. Yanovsky, R.L.; Bartenstein, D.W.; Rogers, G.S.; Isakoff, S.J.; Chen, S.T. Photodynamic Therapy for Solid Tumors: A Review of the Literature. Photodermatol. Photoimmunol. Photomed. 2019, 35, 295–303. [Google Scholar] [CrossRef] [PubMed]
  3. Yakovlev, D.; Shiryaev, A.; Farrakhova, D.; Savelieva, T.; Efendiev, K.; Loshchenov, M.; Zhemerikin, G.; Amouroux, M.; Daul, C.; Blondel, W.; et al. Comparison of the Capabilities of Spectroscopic and Quantitative Video Analysis of Fluorescence for the Diagnosis and Photodynamic Therapy Control of Cholangiocellular Cancer. Photonics 2022, 9, 65. [Google Scholar] [CrossRef]
  4. Kalka, K.; Merk, H.; Mukhtar, H. Photodynamic therapy in dermatology. J. Am. Acad. Dermatol. 2000, 42, 389–413. [Google Scholar] [CrossRef]
  5. Weinreb, R.; Cotlier, E.; Schmidt-Erfurth, U.; Hasan, T. Mechanisms of action of photodynamic therapy with verteporfin for the treatment of age-related macular degeneration. Surv. Ophthalmol. 2000, 45, 195–214. [Google Scholar]
  6. Wei, J.; Peng, X.; Wang, S.; Xu, M.; Liu, H.; Zhong, Y.; Chen, X.; Wang, Q.; Huang, X.; Zeng, K. The Effect of 5-Aminolevulinic Acid Photodynamic Therapy in Promoting Pyroptosis of HPV-Infected Cells. Photonics 2022, 9, 408. [Google Scholar] [CrossRef]
  7. Wilson, B.C.; Patterson, M.S. The physics, biophysics and technology of photodynamic therapy. Phys. Med. Biol. 2008, 53, R61–R109. [Google Scholar] [CrossRef]
  8. Brown, S.B.; Brown, E.A.; Walker, I. The present and future role of photodynamic therapy in cancer treatment. Lancet Oncol. 2004, 5, 497–508. [Google Scholar] [CrossRef]
  9. Macdonald, I.J.; Dougherty, T.J. Basic principles of photodynamic therapy. J. Porphyrines Phthalocyanines 2001, 5, 105–129. [Google Scholar] [CrossRef]
  10. Gupta, S.; Dwarakanath, B.S.; Muralidhar, K.; Jain, V. Cellular uptake, localization and photodynamic effects of haematoporphyrin derivative in human glioma and squamous carcinoma cell lines. J. Photochem. Photobiol. 2003, 69, 107–120. [Google Scholar] [CrossRef]
  11. Mojzisova, H.; Bonneau, S.; Vever-Bizet, C.; Brault, D. Cellular uptake and subcellular distribution of chlorin e6 as functions of pH and interactions with membranes and lipoproteins. Biochim. Biophys. Acta 2007, 1768, 2748–2756. [Google Scholar] [CrossRef] [PubMed] [Green Version]
  12. Zhikhoreva, A.A.; Belashov, A.V.; Belyaeva, T.N.; Salova, A.V.; Litvinov, I.K.; Kornilova, E.S.; Semenova, I.V.; Vasyutinskii, O.S. Comparative analysis of Radachlorin accumulation, localization, and photobleaching in three cell lines by means of holographic and fluorescence microscopy. Photodiagnosis Photodyn. Ther. 2022, 39, 102973. [Google Scholar] [CrossRef] [PubMed]
  13. Mckechnie, T.; Jahan, A.; Tait, I.; Cuschieri, A.; Sibbett, W.; Padgett, M. An endoscopic system for the early detection of cancers of the gastrointestinal tract. Rev. Sci. Instrum. 1998, 69, 2521–2523. [Google Scholar] [CrossRef]
  14. Valdés, P.A.; Jacobs, V.; Harris, B.T.; Wilson, B.C.; Leblond, F.; Paulsen, K.D.; Roberts, D.W. Quantitative fluorescence using 5-aminolevulinic acid–induced protoporphyrin IX biomarker as a surgical adjunct in low-grade glioma surgery. J. Neurosurg. 2015, 123, 771–780. [Google Scholar] [CrossRef]
  15. Bravo, J.J.; Olson, J.D.; Davis, S.C.; Roberts, D.W.; Paulsen, K.D.; Kanick, S.C. Hyperspectral data processing improves PpIX contrast during fluorescence guided surgery of human brain tumors. Sci. Rep. 2017, 7, 9455. [Google Scholar] [CrossRef] [PubMed]
  16. Azari, F.; Kennedy, G.; Bernstein, E.; Hadjipanayis, C.; Vahrmeijer, A.L.; Smith, B.L.; Rosenthal, E.; Sumer, B.; Tian, J.; Henderson, E.R.; et al. Intraoperative molecular imaging clinical trials: A review of 2020 conference proceedings. J. Biomed. Opt. 2021, 26, 050901. [Google Scholar] [CrossRef] [PubMed]
  17. Rudys, R.; Bagdonas, S.; Kirdaite, G.; Papeckiene, J.; Rotomskis, R. Multidimensional visualization of healthy and sensitized rabbit knee tissues by means of confocal microscopy. J. Biomed. Opt. 2015, 20, 051035. [Google Scholar] [CrossRef]
  18. van Leeuwen–van Zaane, F.; van Driel, P.B.A.A.; Gamm, U.A.; Snoeks, T.J.A.; de Bruijn, H.S.; van der Ploeg–van den Heuvel, A.; Lowik, C.W.G.M.; Sterenborg, H.J.C.M.; Amelink, A.; Robinson, D.J. Microscopic Analysis of the Localization of Two Chlorin-Based Photosensitizers in OSC19 Tumors in the Mouse Oral Cavity. Lasers Surg. Med. 2014, 46, 224–234. [Google Scholar] [CrossRef]
  19. Yeh, S.C.A.; Patterson, M.S.; Hayward, J.E.; Fang, Q. Time-Resolved Fluorescence in Photodynamic Therapy. Photonics 2014, 1, 530–564. [Google Scholar] [CrossRef]
  20. Rueck, A.; Dolp, F.; Huelshoff, C.; Hauser, C.; Scalfi-Happ, C. Fluorescence lifetime imaging in PDT. An overview. Med. Laser Appl. 2005, 20, 125–129. [Google Scholar] [CrossRef]
  21. König, K.; Wabnitz, H.; Dietel, W. Variation in the fluorescence decay properties of haematoporphyrin derivative during its conversion to photoproducts. J. Photochem. Photobiol. B 1990, 8, 103–111. [Google Scholar] [CrossRef]
  22. Kalinina, S.; Rueck, A. FLIM and PLIM in biomedical research—An innovative way to combine autofluorescence and oxygen measurements. Photonics Lasers Med. 2016, 5, 257–266. [Google Scholar] [CrossRef]
  23. Okkelman, I.A.; Papkovsky, D.B.; Dmitriev, R.I. Estimation of the Mitochondrial Membrane Potential Using Fluorescence Lifetime Imaging Microscopy. Cytom. Part A 2020, 97A, 471–482. [Google Scholar] [CrossRef]
  24. Levchenko, S.M.; Pliss, A.; Qu, J. Fluorescence lifetime imaging of fluorescent proteins as an effective quantitative tool for noninvasive study of intracellular processes. J. Innov. Opt. Health Sci. 2018, 11, 1730009. [Google Scholar] [CrossRef]
  25. Datta, R.; Heaster, T.M.; Sharick, J.T.; Gillette, A.A.; Skala, M.C. Fluorescence lifetime imaging microscopy: Fundamentals and advances in instrumentation, analysis, and applications. J. Biomed. Opt. 2020, 25, 071203. [Google Scholar] [CrossRef]
  26. Görlitz, F.; Corcoran, D.S.; Garcia Castano, E.A.; Leitinger, B.; Neil, M.A.; Dunsby, C.; French, P.M. Mapping molecular function to biological nanostructure: Combining structured illumination microscopy with fluorescence lifetime imaging (SIM + FLIM). Photonics 2017, 4, 40. [Google Scholar] [CrossRef]
  27. Sahoo, G.R.; Singh, P.; Pandey, K.; Kala, C.; Pradhan, A. Improving diagnosis of cervical pre-cancer: Combination of PCA and SVM applied on fluorescence lifetime images. Photonics 2018, 5, 57. [Google Scholar] [CrossRef]
  28. Sun, Y.H.; Hatami, N.; Yee, M.; Phipps, J.E.; Elson, D.S.; Gorin, F.; Schrot, R.J.; Marcu, L. Fluorescence lifetime imaging microscopy for brain tumor image-guided surgery. J. Biomed. Opt. 2010, 15, 056022. [Google Scholar]
  29. Wang, Z.; Zheng, Y.; Zhao, D.; Zhao, Z.; Liu, L.; Pliss, A.; Zhu, F.; Liu, J.; Qu, J.; Luan, P. Applications of fluorescence lifetime imaging in clinical medicine. J. Innov. Opt. Health Sci. 2018, 11, 1830001. [Google Scholar] [CrossRef]
  30. König, K. Review: Clinical in vivo multiphoton FLIM tomography. Methods Appl. Fluoresc. 2020, 8, 034002. [Google Scholar] [CrossRef]
  31. Ouyang, Y.; Liu, Y.; Wang, Z.M.; Liu, Z.; Wu, M. FLIM as a Promising Tool for Cancer Diagnosis and Treatment Monitoring. Nano-Micro Lett. 2021, 13, 133. [Google Scholar] [CrossRef] [PubMed]
  32. Kantelhardt, S.R.; Kalasauskas, D.; Konig, K.; Kim, E.; Weinigel, M.; Uchugonova, A.; Giese, A. In vivo multiphoton tomography and fluorescence lifetime imaging of human brain tumor tissue. J. Neurooncol. 2016, 127, 473–482. [Google Scholar] [CrossRef] [PubMed]
  33. Rodimova, S.; Kuznetsova, D.; Bobrov, N.; Elagin, V.; Shcheslavskiy, V.; Zagainov, V.; Zagaynova, E. Mapping metabolism of liver tissue using two-photon FLIM. Biomed. Opt. Express 2020, 11, 4458–4470. [Google Scholar] [CrossRef] [PubMed]
  34. Lukina, M.M.; Shimolina, L.E.; Dudenkova, V.V.; Gavrina, A.I.; Zagainov, V.E.; Komarov, D.V.; Yashin, K.S.; Medyanik, I.A.; Zagaynova, E.V.; Shirmanova, M.V. Ex vivo metabolic imaging of tumor samples from patients by FLIM. Proc. SPIE 2021, 11648, 116480N. [Google Scholar]
  35. Ferreira, J.; Menezes, P.F.C.; Kurachi, C.; Sibata, C.; Allison, R.R.; Bagnato, V.S. Photostability of different chlorine photosensitizers. Laser Phys. Lett. 2008, 5, 156–161. [Google Scholar] [CrossRef]
  36. Douillard, S.; Lhommeau, I.; Olivier, D.; Patrice, T. In vitro evaluation of Radachlorin sensitizer for photodynamic therapy. J. Photochem. Photobiol. B Biol. 2010, 98, 128–137. [Google Scholar] [CrossRef]
  37. Belik, V.P.; Gadzhiev, I.M.; Petrenko, M.V.; Petrov, M.A.; Semenova, I.V.; Vasyutinskii, O.S. Visible to near IR luminescence spectrum of Radachlorin under excitation at 405 nm. Chem. Phys. Lett. 2016, 665, 127–130. [Google Scholar] [CrossRef]
  38. Beltukova, D.M.; Vasyutinskii, O.S.; Glazov, A.L.; Semenova, I.V.; Smolin, A.G. Photobleaching mechanisms of Radachlorin photosensitizer in aqueous solution. Opt. Spectrosc. 2017, 122, 229–234. [Google Scholar] [CrossRef]
  39. Belik, V.P.; Gadzhiev, I.M.; Semenova, I.V.; Vasyutinskii, O.S. Time-resolved spectral analysis of Radachlorin luminescence in water. Spectrochim. Acta Part A Mol. Biomol. Spectrosc. 2017, 178, 181–184. [Google Scholar] [CrossRef]
  40. Zhikhoreva, A.A.; Belashov, A.V.; Ignatov, E.S.; Gelfond, M.L.; Semenova, I.V.; Vasyutinskii, O.S. Singlet oxygen generation in aerosol jet and on biological surfaces. J. Photochem. Photobiol. B Biol. 2022, 228, 112395. [Google Scholar] [CrossRef]
  41. Belashov, A.V.; Zhikhoreva, A.A.; Belyaeva, T.N.; Nikolsky, N.N.; Semenova, I.V.; Kornilova, E.S.; Vasyutinskii, O.S. Quantitative assessment of changes in cellular morphology at photodynamic treatment in vitro by means of digital holographic microscopy. Biomed. Opt. Express 2019, 10, 4975–4986. [Google Scholar] [CrossRef]
  42. Zhikhoreva, A.A.; Belashov, A.V.; Danilova, A.B.; Avdonkina, N.A.; Baldueva, I.A.; Gelfond, M.L.; Nekhaeva, T.L.; Semenova, I.V.; Vasyutinskii, O.S. Significant difference in response of malignant tumor cells of individual patients to photodynamic treatment as revealed by digital holographic microscopy. J. Photochem. Photobiol. B Biol. 2021, 221, 112235. [Google Scholar] [CrossRef] [PubMed]
  43. Ji, W.; Yoo, J.w.; Bae, E.K.; Lee, J.H.; Choi, C.M. The effect of Radachlorin® PDT in advanced NSCLC: A pilot study. Photodiagnosis Photodyn. Ther. 2013, 10, 120–126. [Google Scholar] [CrossRef] [PubMed]
  44. Kochneva, E.V.; Filonenko, E.V.; Vakulovskaya, E.G.; Scherbakova, E.G.; Seliverstov, O.V.; Markichev, N.A.; Reshetnickov, A.V. Photosensitizer Radachlorin®: Skin cancer PDT phase II clinical trials. Photodiagnosis Photodyn. Ther. 2010, 7, 258–267. [Google Scholar] [CrossRef] [PubMed]
  45. Mirzaei, H.; Djavid, G.E.; Hadizadeh, M.; Jahanshiri-Moghadam, M.; Hajian, P. The efficacy of Radachlorin-mediated photodynamic therapy in human hepatocellular carcinoma cells. J. Photochem. Photobiol. B Biol. 2015, 142, 86–91. [Google Scholar] [CrossRef]
  46. Svyatchenko, V.A.; Nikonov, S.D.; Mayorov, A.P.; Gelfond, M.L.; Loktev, V.B. Antiviral photodynamic therapy: Inactivation and inhibition of SARS-CoV-2 in vitro using methylene blue and Radachlorin. Photodiagnosis Photodyn. Ther. 2021, 33, 102112. [Google Scholar] [CrossRef]
  47. Vahabi, S.; Fekrazad, R.; Ayremlou, S.; Taheri, S.; Zangeneh, N. The effect of antimicrobial photodynamic therapy with radachlorin and toluidine blue on streptococcus mutans: An in vitro study. J. Dent. (Tehran Iran) 2011, 8, 48. [Google Scholar]
  48. Fekrazad, R.; Bargrizan, M.; Sajadi, S.; Sajadi, S. Evaluation of the effect of photoactivated disinfection with Radachlorin® against Streptococcus mutans (an in vitro study). Photodiagnosis Photodyn. Ther. 2011, 8, 249–253. [Google Scholar] [CrossRef]
  49. Panchenko, A.V.; Popovich, I.G.; Trashkov, A.P.; Egormin, P.A.; Yurova, M.N.; Tyndyk, M.L.; Gubareva, E.A.; Artyukin, I.N.; Vasiliev, A.G.; Khaitsev, N.V.; et al. Biomarkers of aging, life span and spontaneous carcinogenesis in the wild type and HER-2 transgenic FVB/N female mice. Biogerontology 2016, 17, 317–324. [Google Scholar] [CrossRef]
  50. Stukov, A.N.; Osipov, M.A.; Semiglazova, T.Y.; Filatova, L.V.; Alexandrov, V.A.; Bespalov, V.G.; Semenov, A.L.; Tyndyk, M.L.; Yurova, M.N.; Panchenko, A.V.; et al. Enchancement of Toremifene Anti-Tumor Action by Metformin and Unusual Side Effect of Toremifene in Male Transgenic Mice with HER2-Positive Breast Tumor. Drug Res. 2019, 69, 683–687. [Google Scholar] [CrossRef]
  51. Kruglov, S.S.; Gelfond, M.L.; Tyndyk, M.L.; Maydin, M.A.; Grishacheva, T.G.; Basina, R.M.; Gubareva, E.A.; Plakhov, E.A.; Kireeva, G.S.; Panchenko, A.V. Methodological Aspects of photodynamic therapy of Ehrlich solid carcinoma in BALB/C mouse strain with various tumor localization. Sib. J. Oncol. 2020, 19, 82–92. [Google Scholar] [CrossRef]
  52. Digman, M.A.; Caiolfa, V.R.; Zamai, M.; Gratton, E. The phasor approach to fluorescence lifetime imaging analysis. Biophys. J. 2008, 94, L14–L16. [Google Scholar] [CrossRef] [PubMed]
  53. Ladokhin, A.S.; Brand, L. Evidence for an Excited-State Reaction Contributing to NADH Fluorescence. J. Fluores. 1995, 5, 99–106. [Google Scholar] [CrossRef]
  54. Gorbunova, I.A.; Sasin, M.E.; Semenov, A.A.; Smolin, A.G.; Beltukov, Y.M.; Golyshev, D.P.; Vasyutinskii, O.S. Two-Photon Excited Fluorescence Dynamics in Enzyme-Bound NADH: The Heterogeneity of Fluorescence Decay Times and Anisotropic Relaxation. J. Phys. Chem. B 2021, 125, 9692–9707. [Google Scholar] [CrossRef] [PubMed]
  55. Chorvat, D.; Chorvatova, A. Spectrally resolved time-correlated single photon counting: A novel approach for characterization of endogenous fluorescence in isolated cardiac myocytes. Eur. Biophys. J. 2006, 36, 73–83. [Google Scholar] [CrossRef]
  56. Belashov, A.V.; Zhikhoreva, A.A.; Belyaeva, T.N.; Litvinov, I.K.; Salova, A.V.; Kornilova, E.S.; Semenova, I.V.; Vasyutinskii, O.S. Dependence of Radachlorin fluorescence lifetime on solution pH and localization in HeLa cells. In Proceedings of the 2022 International Conference Laser Optics (ICLO), Saint Petersburg, Russia, 20–24 June 2022; p. 1. [Google Scholar]
  57. Padilla-Parra, S.; Auduge, N.; Coppey-Moisan, M.; Tramier, M. Non fitting based FRET–FLIM analysis approaches applied to quantify protein–protein interactions in live cells. Biophys. Rev. 2011, 3, 63–70. [Google Scholar] [CrossRef]
  58. Ranjit, S.; Malacrida, L.; Jameson, D.M.; Gratton, E. Fit-free analysis of fluorescence lifetime imaging data using the phasor approach. Nat. Protoc. 2018, 13, 1979–2004. [Google Scholar] [CrossRef]
  59. Torrado, B.; Malacrida, L.; Ranjit, S. Linear Combination Properties of the Phasor Space in Fluorescence Imaging. Sensors 2022, 22, 999. [Google Scholar] [CrossRef]
  60. Malacrida, L.; Ranjit, S.; Jameson, D.M.; Gratton, E. The phasor plot: A universal circle to advance fluorescence lifetime analysis and interpretation. Annu. Rev. Biophys. 2021, 50, 575–593. [Google Scholar] [CrossRef]
  61. García-Plazaola, J.I.; Fernández-Marín, B.; Duke, S.O.; Hernández, A.; López-Arbeloa, F.; Becerril, J.M. Autofluorescence: Biological functions and technical applications. Plant Sci. 2015, 236, 136–145. [Google Scholar] [CrossRef]
  62. Croce, A.C.; Bottiroli, G. Autofluorescence spectroscopy and imaging: A tool for biomedical research and diagnosis. Eur. J. Histochem. 2014, 58, 2461. [Google Scholar] [CrossRef] [PubMed]
  63. Shcheslavskiy, V.I.; Shirmanova, M.V.; Dudenkova, V.V.; Lukyanov, K.A.; Gavrina, A.I.; Shumilova, A.V.; Zagaynova, E.V.; Becker, W. Fluorescence time-resolved macroimaging. Opt. Lett. 2018, 43, 3152–3155. [Google Scholar] [CrossRef] [PubMed]
  64. Lukina, M.; Yashin, K.; Kiseleva, E.E.; Alekseeva, A.; Dudenkova, V.; Zagaynova, E.V.; Bederina, E.; Medyanic, I.; Becker, W.; Mishra, D.; et al. Label-free macroscopic fluorescence lifetime imaging of brain tumors. Front. Oncol. 2021, 11, 1781. [Google Scholar] [CrossRef] [PubMed]
  65. Requejo-Isidro, J.; McGinty, J.; Munro, I.; Elson, D.S.; Galletly, N.P.; Lever, M.J.; Neil, M.A.A.; Stamp, G.W.H.; French, P.M.W.; Kellett, P.A.; et al. High-speed wide-field time-gated endoscopic fluorescence-lifetime imaging. Opt. Lett. 2004, 29, 2249–2251. [Google Scholar] [CrossRef] [Green Version]
  66. Lukina, M.; Orlova, A.; Shirmanova, M.; Shirokov, D.; Pavlikov, A.; Neubauer, A.; Studier, H.; Becker, W.; Zagaynova, E.; Yoshihara, T.; et al. Interrogation of metabolic and oxygen states of tumors with fiber-based luminescence lifetime spectroscopy. Opt. Lett. 2017, 42, 731–734. [Google Scholar] [CrossRef]
Figure 1. Typical fluorescence intensity images (ae) and corresponding fluorescence lifetime images (fj) recorded in the spectral range of 608–683 nm for the five samples: (a,f) control sample of the tumor tissue, (b,g) control sample of the testicular tissue, (c,h) photosensitized tumor tissue exposed to laser radiation prior to sample preparation, (d,i) photosensitized tumor tissue, and (e,j) photosensitized testicular tissue. Histograms of the intensity distributions in the fluorescence intensity images are shown below the images (ae) for comparison.
Photonics 09 00711 g001
Figure 2. Statistical results for the mean intensity (a) and mean lifetimes (b) of the fluorescence signals in tissue samples within the spectral range of 608–683 nm.
Photonics 09 00711 g002
Figure 3. Phasor plot of the data from five analyzed samples on the time-resolved fluorescence signals within the spectral range of 608–683 nm. Note that to obtain reliable results, the phasor plot’s points were collected from several fields of view in each sample. The stars indicate the positions of the central mass coordinate for each sample. The black arrows indicate shifts of the phasor plot’s position with increasing Radachlorin concentration. The fluorescence signals from the control samples were due to the autofluorescence of the tissues.
Photonics 09 00711 g003
Figure 4. Selection of the areas close to the semicircle of the phasor plot allows the identification of areas of predominant Radachlorin accumulation. Examples of fluorescent images (a,c) and corresponding phasor plots (b,d) with predominant accumulation of Radachlorin PS in the samples of photosensitized tumor tissue (a,b) and photosensitized testicular tissue (c,d).
Photonics 09 00711 g004
Table 1. Characteristic decay times and amplitudes of fluorescence determined by the single- and double-exponential fitting.
SampleSingle-Exponential FitDouble-Exponential Fit
τ , ns χ 2 a 1 , % a 2 , % τ 1 , ns τ 2 , ns χ 2
photosens. tumor tissue3.9 ± 0.32.1 ± 0.455.0 ± 6.645.0 ± 6.61.0 ± 0.25.0 ± 0.31.3 ± 0.2
photosens. testicular tissue4.1 ± 0.22.3 ± 0.552.5 ± 5.847.5 ± 5.81.4 ± 0.45.3 ± 0.31.5 ± 0.3
Publisher’s Note: MDPI stays neutral with regard to jurisdictional claims in published maps and institutional affiliations.

