1. Introduction
Owing to the invention of the chirped-pulse amplification (CPA) method, the laser peak power and focal intensity have been continuously improved throughout the past three decades. A recent review paper showed that there were more than fifty petawatt (PW)-class laser facilities around the world [
1], where the SULF facility [
2] in China and the ELI-NP facility [
3] in Romania have achieved levels of ten petawatts, with both facilities already in operation. Several devices aiming to achieve tens of petawatts or hundreds of petawatts, such as the Russian XCELS-200PW [
4], the European ELI-200PW, the American OPAL-75PW [
5] and the Chinese SEL-100PW [
6], are also currently in planning or under construction. The focused intensities of these PW-100PW lasers are expected to be 10
21−23 W/cm
2, which will induce special physical conditions with extremely high pressures, high temperatures and high electrical fields [
7]. If those intensities are realized, in the future, important research on laser–matter interactions can be conducted by using such ultra-high-intensity lasers to accelerate electrons [
8,
9,
10], protons [
11], ion particles [
12], etc.
In the process of laser–matter interaction, a solid target is easily ionized since the ionization intensity threshold is about 10
11 W/cm
2. Accordingly, for a 10
21−23 W/cm
2 ultra-high-intensity laser pulse, the temporal contrast should be higher than 10
10−12 to avoid the strong pre-pulse ionizing the solid target before the main pulse. To obtain an ultra-intense laser pulse with such high temporal contrast, special methods may be applied at different stages, such as double CPA and plasma mirror. The first step of such methods is to obtain a seed pulse with high temporal contrast before the main amplification since the temporal contrast of a typical CPA output pulse is at the level of 10
6−8. To date, many techniques have been developed to improve the temporal contrast of the seed pulse based on the double CPA configuration, such as saturable absorbers [
13], the use of OPA [
14], cross-polarized wave (XPW) generation [
15] and second harmonic generation (SHG) [
16]. Among them, XPW is the most widely used method to achieve a clean seed pulse in PW facilities. This is because XPW can improve the temporal contrast by five orders of magnitude. Furthermore, the output laser spectrum can be smoothed and broadened in the XPW process because it is a third-order nonlinear process. However, two polarizers must be used in the XPW process to clean the input polarization and separate the output XPW from the input laser beam. Due to the limitation of the extinction ratio of the polarizer, which is approximately 10
5, the temporal contrast improvement is limited to a maximum of 10
5. Unfortunately, this extinction ratio cannot be improved by adding more polarizers. Moreover, only a few nonlinear media such as BaF
2 can be used for XPW.
As with XPW, the self-diffraction (SD) process is also a frequency-degenerated four-wave mixing process. However, no polarizers are required in the SD process. This means the SD process is a promising method for obtaining seed pulses with higher temporal contrast. In 2010, the SD process was first proposed to enhance the temporal contrast in a fused silica glass plate [
17]. However, the relatively low pulse energy of the first-order SD (SD + 1) signal limited the enhancement of temporal contrast to about four orders of magnitude. By using a cylindrical reflective mirror to focus the input beams, a 100 μJ-level SD + 1 pulse [
18] was recently obtained with several millijoules of inputted pulse energy. Furthermore, the SD process has been used in a single-shot fourth-order autocorrelator [
19] to measure pulses from a petawatt laser system. Additionally, it was successfully applied in two PW laser facilities [
20,
21] where the temporal contrast of the output pulses was improved to ~10
12. In comparison to the XPW process, although higher temporal contrast can be achieved for the SD process, the energy-conversion efficiency is usually about 6.0%, while the conversion efficiency of the XPW process with single BaF
2 crystals can be higher than 10.0%. Fortunately, in a key difference from the XPW process, which has few practicable crystals, the SD process can work in almost all transparent bulk media and across a broad spectral range.
In this paper, different transparent materials including BK7 glasses, sapphire plates (AL2O3) and CVD diamonds were compared as the nonlinear medium in the SD process. AL2O3 and CVD diamonds are transparent materials with high refractive indexes and high third-order nonlinear coefficients. It was found that CVD diamonds most easily generate a SD + 1 signal pulse with the lowest incident energy. However, a black dot often appears on the surface when using CVD diamonds, likely due to their carbon composition. The sapphire plate, a medium with a simultaneously high third-order nonlinear coefficient and high damage threshold, proved to be the best to achieve high energy-conversion efficiency. The maximum energy-conversion efficiency of 9.1% was achieved with 401.7 μJ SD + 1 pulse energy on one side. Furthermore, the temporal contrast was improved by 7 orders of magnitude to 1012 with a broadened and smoothed spectrum.
2. Theoretical Analysis
The SD process is a well-known third-order nonlinear process that has been used as part of the frequency-resolved optical gating (FROG) method to measure the complete electric-field amplitude and phase of ultra-short laser pulses. Similar to the XPW process, SD is also a frequency-degenerated four-wave mixing process, where the newly generated SD signals have the same central wavelength as the incident beams. In contrast to XPW, SD involves a single-input laser beam, and in the experiment, the input beams not only have relatively high pulse energies, the same wavelengths and linear polarization but also have a small crossing angle in the nonlinear medium. The SD signals mainly originate from the interference of two beams induced in the transient grating due to the nonlinear index [
22,
23] and can be automatically separated from the two input laser beams in the spatial domain.
In fact, for a third-order nonlinear process, the temporal contrast of the generated SD signal Csd can be improved to be the cube of the incident temporal contrast Cin, Csd = Cin3. For an incident pulse with 106, the output temporal contrast can be 1018 theoretically. According to this cubic relationship of the temporal contrast between input and output pulse, it is important to explore a new third-order nonlinear process in detail, one without an extinction ratio limitation, to further improve the output temporal contrast.
The phase-matching configuration of the SD process is shown in
Figure 1. As a four-wave-mixing optical parametric process, the phase-matching conditions need to be satisfied:
where
is the wave vector,
is the angular frequency of the incident pulse and
m is the order number of the generated SD signals.
The spectral intensity of the generated SD + 1 signal is an integral part of the spectral intensities of the two incident pulses. The intensity of the first-order SD signal can be briefly expressed as:
The spectral intensity of the SD + 1 signal can be seen as an averaged contribution of the incident pulses in the entire spectral range. Therefore, the spectrum of SD + 1 is likely to be broader than that of the incident pulses. Meanwhile, the strong incident light energy and high nonlinear coefficient of the Kerr medium will assist with generating strong SD + 1 signals.
Besides BK7 glasses, two further transparent media with high refractive indexes and high third-order nonlinear coefficients are AL
2O
3 and CVD diamonds, which were chosen for comparison. All three Kerr media have high transmittance in the spectral range from 700 nm to 900 nm, which is shown in
Figure 2a. Due to their relatively high refractive index, the surface reflection of CVD diamonds is about 17% at zero-degrees input, which gives it approximately 70% lower transmittance. The absorbance of the three Kerr media can be disregarded.
Table 1 shows their refractive indexes and third-order nonlinear coefficients at 800 nm. The refractive index curves of the three Kerr media are then shown in
Figure 2b, where the trend of the refractive index of AL
2O
3 is the same as that of BK7 glasses.
When the input pulse is centered at 800 nm with a FWHM bandwidth of 22 nm, the best crossing-angle range differs for the three Kerr media. The crossing angle range of AL
2O
3 is from 0 to 2.89° which is similar to BK7 glasses, the range of which is within 2.76°, whilst the CVD diamonds have the biggest crossing angle range—within 4.65°. With one beam fixed at 800 nm, the suitable phase-matching angle between two input beams is shown in
Figure 3, which shows that the suitable crossing angles of AL
2O
3 and BK7 are almost the same, differing from that of the CVD diamonds.
Figure 4a show the spectral profiles of the inputted pulse and the generated SD + 1 signal theoretically, where the input beam was considered as an ideal point source without spatial distribution in the simulation. In all three media, the FWHM spectral bandwidth of the SD + 1 signal can be broadened to 37.5 nm from the input of 22.0 nm. The corresponding exit angles and intensity of the SD + 1 signal can be simulated from Equations (1)–(3). The trend of the SD + 1 signal-intensity distribution generated by the three Kerr media is the same but the exit angle range is slightly different, which is related to the refractive index curves. Here,
Figure 4b is the result of the SD + 1 signal-intensity distribution generated by Al
2O
3 in the spatial domain. The output beam shows different central wavelengths at different exit angles. Obviously, there is a linear angular dispersion in the output SD + 1 beam.
3. Experiment and Results
Figure 5 shows the experimental setup of the SD signal-generating device. The input pulse duration was about 60 fs and the repetition rate was 1 kHz. The aperture of the input beam was 12.0 mm. A variable neutral-density filter (NDF) helped to continuously tune the total inputted pulse energy. In the experiment, only one cylindrical lens with a 500 mm focal lens was used to focus two split laser beams on the transparent nonlinear medium. It was convenient to adjust the consistency of the focal beam size of the two laser beams on the nonlinear medium. A 1:2 beam splitter (BS) was used to split the input laser beam into transmission and reflection beams. Temporal overlapping of the two laser beams was achieved by a delay stage. The two input beams were both linearly polarized and the size of the input beams was about 12.0 mm × 1.1 mm on the nonlinear medium. With a total of 4.40 mJ energy, the intensities of the two input beams to be measured on the Kerr medium could reach approximately 185 and 370 GW/cm
2, respectively. The spatially overlapping positions can be adjusted by tuning M5, which will additionally affect the crossing angle of the two incident laser beams. In this stud, when the two input beams were temporally synchronized and spatially overlapped in the nonlinear medium, SD signals were generated on both sides of the two input beams.
In our experiment, the crossing angle was initially set to 1.5° according to the crossing-angle range of the three Kerr media from above. It was a reasonable phase-matching angle both for BK7 glasses and AL2O3 in the experiment, and mirror M5 was tuned to find the most reasonable phase-matching angles for the different media. The three nonlinear media had the same thickness of 0.5 mm. The Kerr medium was placed in the coincident position of the two incident laser beams. It is worth mentioning that, according to the different laser-damage thresholds of the materials, we slightly tuned the coincident position away from the focus of the cylinder mirror. Compared to BK7 glass, AL2O3 had a higher laser-damage threshold, which meant that the sapphire plate could be placed closer to the focus of the lens, while the CVD diamonds, which have a lower laser-damage threshold, were placed far away from the focus. Different pulse energies of the SD + 1 signal were acquired by changing the coincident position and tuning the input energy. The obtained signal beam was collimated by a sliver-coated cylinder of reflective mirrors with a focal length of 500 mm. A lens with a focal length of 1000 mm and a beam-reducing system was used to focus the output SD + 1 signal into a third-order cross-correlator for parameter characterization. A commercial, highly dynamic, third-order cross-correlator (Amplitude Technology Inc., (France), Sequoia 800) with a 20 fs time-delay step was used to record the temporal contrast of the original pulse and the SD + 1 signal.
By increasing the input pulse energy gradually in the experiment and ensuring that the Kerr media were not damaged, the differences between the SD process in the three different Kerr media could be explored in detail. Over 1.50 mJ of inputted pulse energy was required to generate measurable SD signals for BK7 glasses and AL2O3. For the CVD diamonds, only 0.88 mJ of input pulse energy was needed to generate measurable SD signals. This is because the CVD diamonds have the highest third-order nonlinear coefficient among the three media. When the input pulse energy reached 2.90 mJ, there was approximately 62.8 μJ of output SD + 1 energy in the CVD diamonds. However, a black dot appeared on the surface of the CVD diamonds with only about 3.00 mJ of input. This indicates that CVD diamonds are not a good material for the SD process, even though they have a large third-order nonlinear coefficient, which was an unexpected finding. This might be due to the carbon composition of the CVD diamonds.
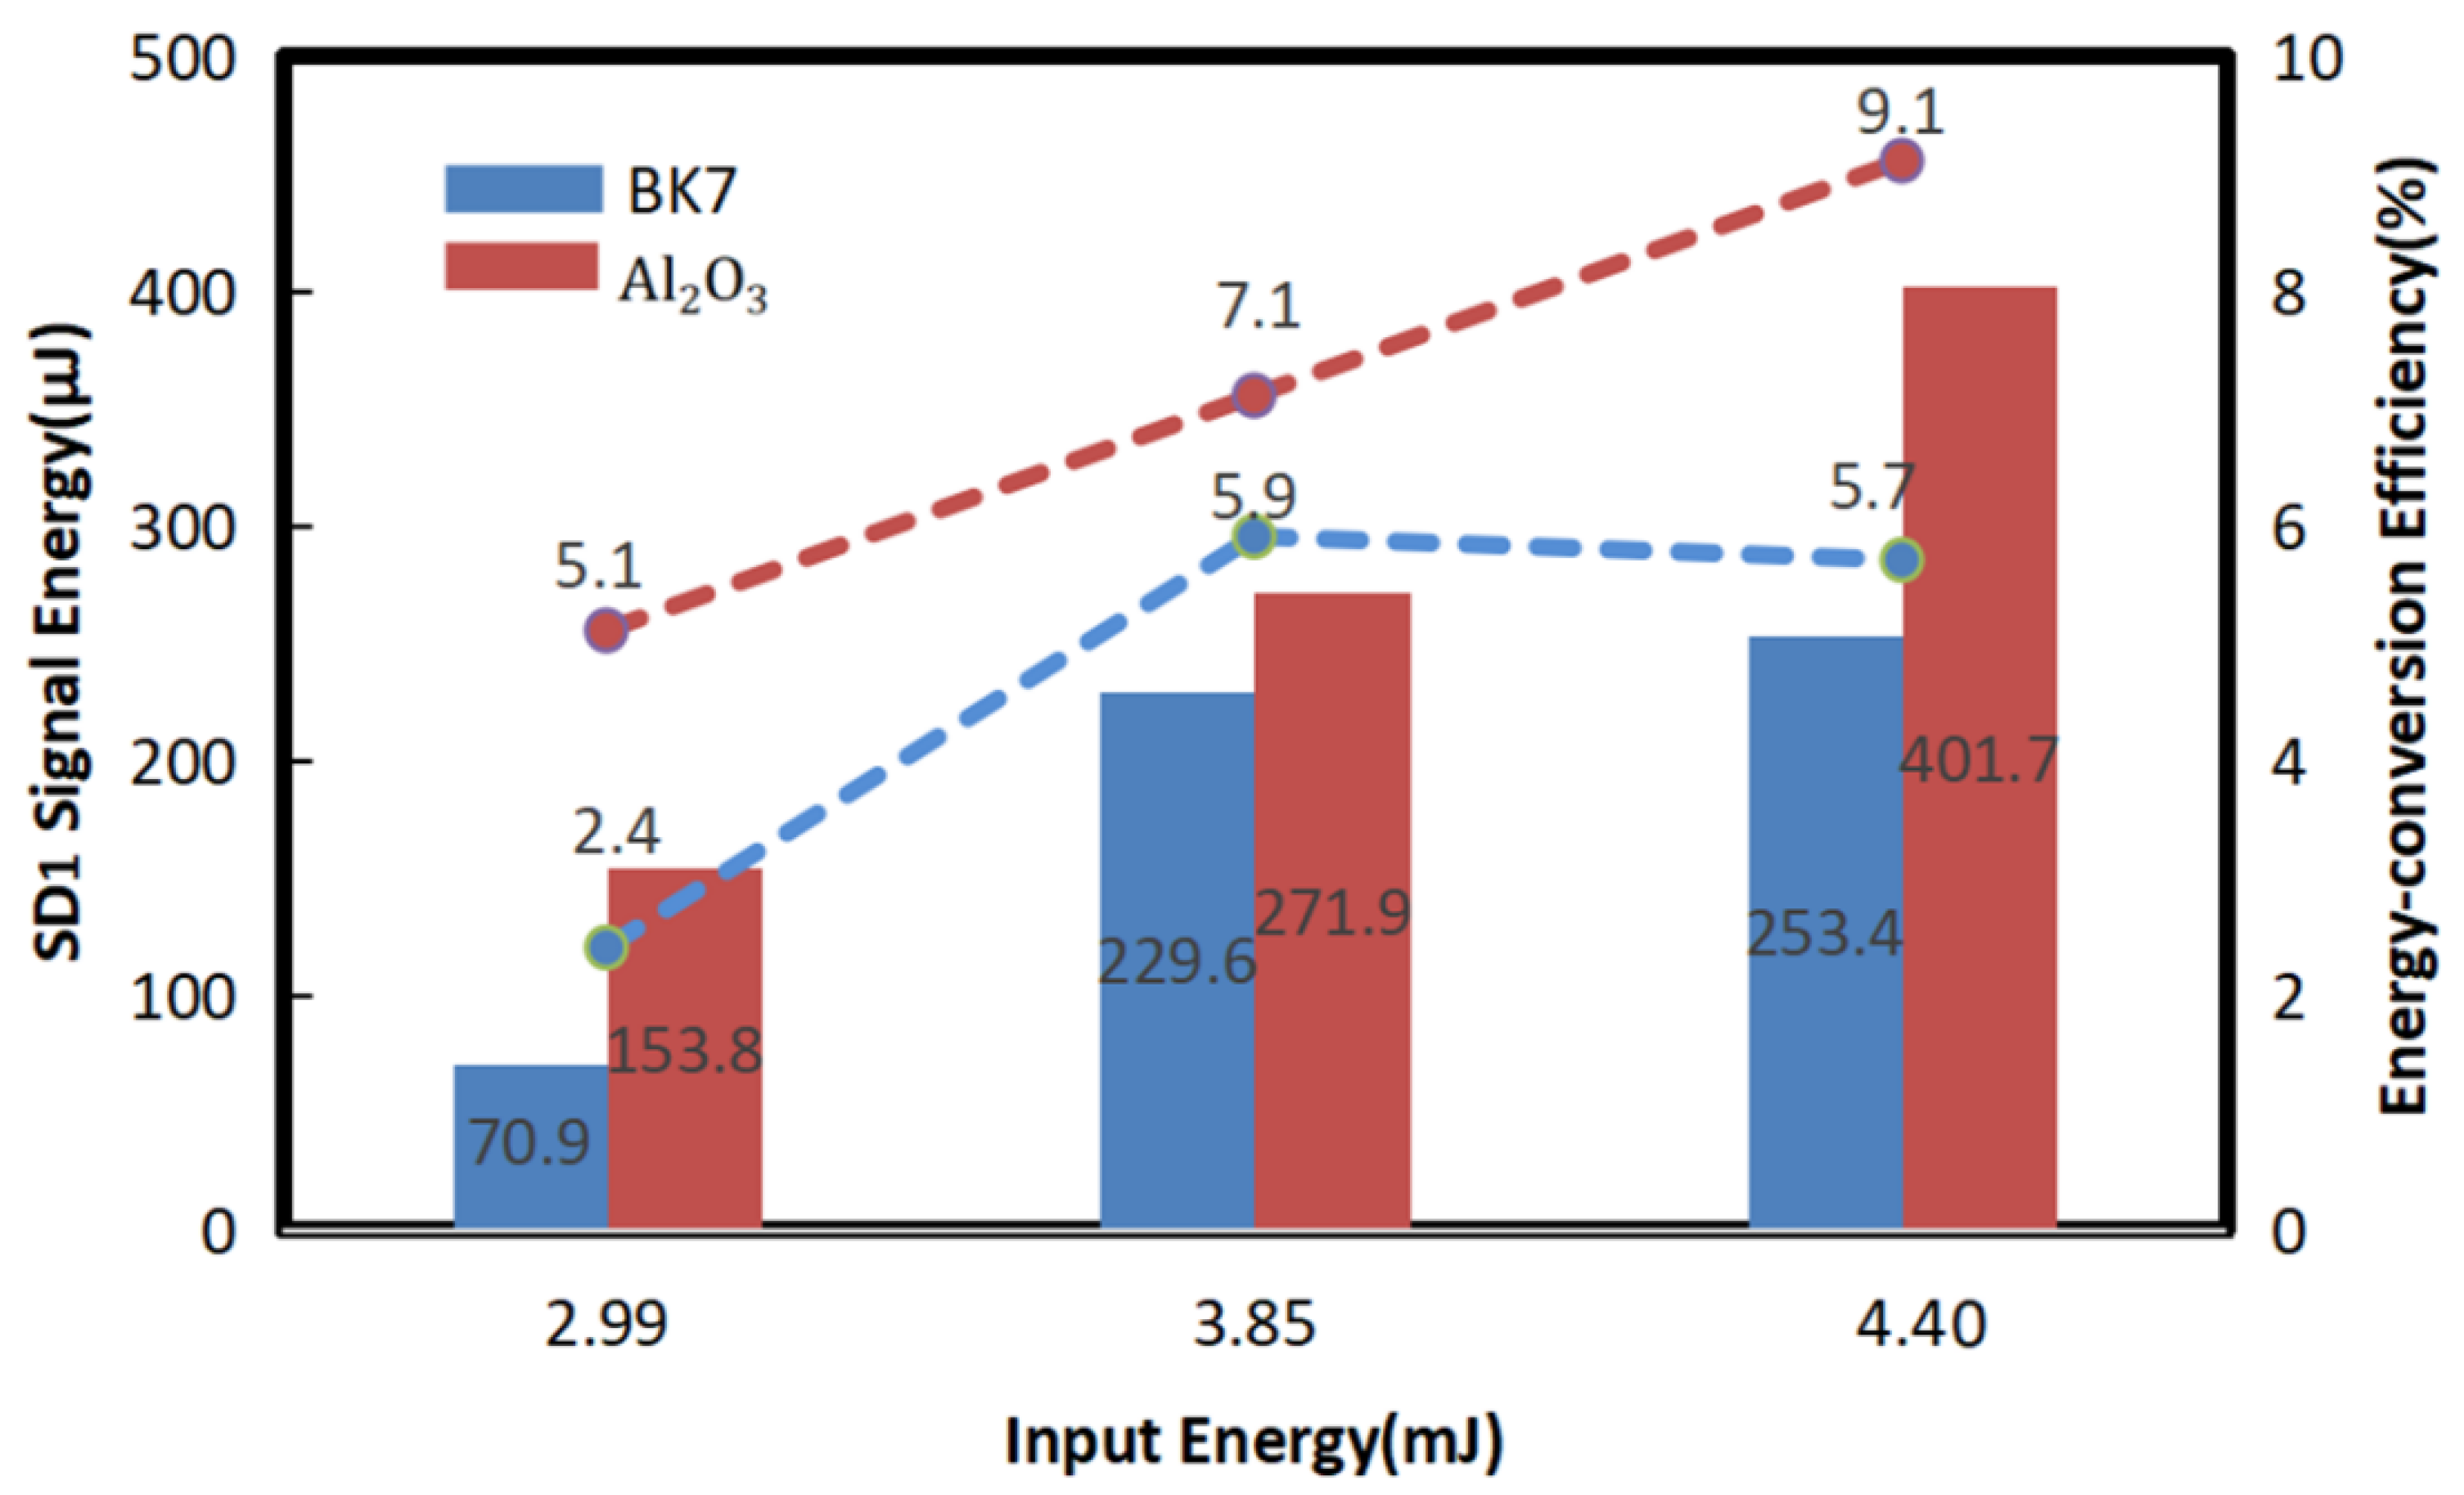
Figure 6 shows the recorded output SD + 1 energies and corresponding energy-conversion efficiencies at different inputted pulse energies when BK7 glasses and Al
2O
3 were used in the SD process. The most commonly used media, BK7 glass, had a maximum energy-conversion efficiency of 6.0% with 3.85 mJ of input. At all three inputted pulse energies, the energy-conversion efficiencies of Al
2O
3 were higher than those of BK7 glass. Moreover, when the inputted pulse energy was increased to 4.40 mJ, the SD + 1 signal energy reached 401.7 μJ. The corresponding energy-conversion efficiency reached 9.1%, which was the highest energy-conversion efficiency we recorded for the SD process. According to the experimental results, transparent materials with high refractive indexes, high third-order nonlinear coefficients as well as high damage thresholds should be chosen to achieve high energy-transfer efficiency in the SD process and other third-order nonlinear processes. As a result, AL
2O
3, with a high third-order nonlinear coefficient and a high damage threshold, was discovered to be the best medium to effectively improve the SD + 1 signal energy and energy-conversion efficiency when comparing the three media.
When the input energy was 4.40 mJ, we recorded the temporal contrast of the original pulse and that of the 401.7 μJ SD + 1 signal obtained in the Al
2O
3 plate, as shown in
Figure 7a. The temporal contrast of the SD + 1 signal was obviously enhanced in comparison to that of the original input pulse. The ASE pedestal contrast of the incident original pulse was about 10
7 within 20 ps and 10
8 beyond 60 ps, which are typical for commercial CPA laser systems, and the pre-pulse of the input was about 10
5. Under the SD effect, the intensity of the pre-pulses was flattened and the ASE pedestal was also well-suppressed. The temporal contrast pulse of the SD + 1 signal exceeded the third-order cross-correlator’s range of measurement, which is 10
12. In order to validate the cleaning ability of the SD effect, two identical 0.15 mm-thick glass plates were placed before the beam splitter and before the third-order cross-correlator, respectively. The results are shown in
Figure 7a. The intensity of the pulse near 1.52 ps brought by the 0.15 mm-thick glass plate was improved from its original intensity of 1.36×10
−3 to 8.60×10
−8, which is very close to the theoretically predicted value of 2.50 × 10
−9. We completed the same validation experiment by adding a 0.5 mm-thick glass plate, in which the energy of the post-pulse brought by the 0.5 mm-thick glass plate was also enhanced to the same level of magnitude, which demonstrated the cubic relationship between input and output energy in the SD effect.
The obtained SD + 1 signal was also collimated and then focused by a lens with a 1000 mm focal length. The maximum SD + 1 we could reach was 401.7 μJ, and the error bar was 3.81% with the 15.3 μJ jitter of output energy. By using a CCD (Thorlabs Inc., Newton, NJ, USA, BC106-vis), the approximately 218 µm focal diameter was measured, as shown in the inset of
Figure 7b, demonstrating that it corresponded to 1.36 times the diffraction limitation. The spectra of the inputted laser pulse and the generated SD + 1 pulse were measured by using a spectrometer (Ocean Optic Inc., USA, USB4000), as shown in
Figure 7b. The FWHM spectral bandwidth of the input pulse was 22 nm, while the FWHM spectral bandwidth of the generated SD + 1 signal was broadened to approximately 32 nm, which is well in agreement with previous theoretical calculations.
4. Conclusions
The SD process is a competitive method to achieve high-temporal-contrast seed pulses. To discover a suitable material to achieve higher conversion efficiency, three different nonlinear transparent media, BK7 glasses, Al2O3 and CVD diamonds, were compared in an SD-effect experiment. Among them, the highest conversion efficiency of 9.1% was achieved by using the Al2O3 plate, where an approximately 401.7 μJ SD + 1 signal was obtained on one side with a total of 4.40 mJ of pulse input. This may be attributable to the simultaneously high nonlinear coefficient and high damage threshold of Al2O3, which has been widely used in white light generation. As for the CVD diamonds, since they have the highest nonlinear coefficient, the SD signal could be generated at the lowest input pulse energy. Yet, surprisingly, the CVD diamonds were the most easily damaged, likely due to their carbon composition.
An obvious enhancement of the temporal contrast was achieved by 7 orders of magnitude to 1012. The spectrum of the SD + 1 signal was significantly broadened to 32 nm, matching the theoretical prediction. The results prove the practicability of the SD process when used for temporal-contrast improvement.
In conclusion, Al2O3 is a good choice in the SD process as it can effectively enhance the temporal contrast and pulse energy output. The cleaning signal pulse can be used in the PW system and may play a role in the ultra-intense, ultra-short laser field.

 ,
, 


