Article

Characterization of Collagen I Fiber Thickness, Density, and Orientation in the Human Skin In Vivo Using Second-Harmonic Generation Imaging

Department of Dermatology, Venerology and Allergology, Charité-Universitätsmedizin Berlin, Corporate Member of Freie Universität Berlin and Humboldt-Universität zu Berlin, Charitéplatz 1, 10117 Berlin, Germany
*
Author to whom correspondence should be addressed.
These authors contributed equally to this work.
Photonics 2021, 8(9), 404; https://doi.org/10.3390/photonics8090404
Submission received: 31 August 2021 / Revised: 17 September 2021 / Accepted: 20 September 2021 / Published: 21 September 2021
(This article belongs to the Special Issue Tissue Optics)

Abstract

:
The assessment of dermal alterations is necessary to monitor skin aging, cancer, and other skin diseases and alterations. The gold standard of morphologic diagnostics is still histopathology. Here, we proposed parameters to distinguish morphologically different collagen I structures in the extracellular matrix and to characterize varying collagen I structures in the skin with similar SAAID (SHG-to-AF Aging Index of Dermis, SHG—second-harmonic generation; AF—autofluorescence) values. Test datasets for the papillary and reticular extracellular matrix from images in 24 female subjects, 36 to 50 years of age, were generated. Parameters for SAAID, edge detection, and fast Fourier transformation directionality were determined. Additionally, textural analyses based on the grey level co-occurrence matrix (GLCM) were conducted. At first, changes in the GLCM parameters were determined in the native greyscale images and, furthermore, in the Hilbert-transformed images. Our results demonstrate a robust set of parameters for noninvasive in vivo classification for morphologically different collagen I structures in the skin, with similar and different SAAID values. We anticipate our method to enable an automated prevention and monitoring system with an age- and gender-specific algorithm.

1. Introduction

Collagen is a dermal protein made of scleroproteins. In addition, 28 different subtypes of collagen can be found throughout the human body as structural components of, among others, tendons, cartilage, and skin, but also bones and teeth. The main collagens in the human skin are type I, III, XII, and XIV collagen [1]. In human skin, collagens of types I and III are mainly found in scaffolding structures [2,3] and are synthesized by fibroblasts [4,5].
The relative amount of dermal collagen I can be used as an indicator for skin damage and skin aging [6,7] due to intrinsic aging processes and UV exposure [8,9]. In earlier studies, it was shown that collagen I and III change in distribution and density [10]. Healthy skin of younger subjects shows interwoven structures with voids and contains higher concentrations of collagen I than aged skin [11]. Aged or symptomatic skin from diabetes or excessive UV exposure exhibits thinner fibers and less interwoven collagen I structures [6,12]. In healthy skin, collagen I structures show a unique pattern [13,14] with no significant directionality [15]. Yet, it is known that the directionality has a direct influence on skin parameters, such as elasticity and plasticity [16]. Genetic disorders affecting collagen synthesis can result in different characteristic diseases, depending on the affected collagen type, such as Ehlers-Danlos syndrome [17,18] or Goodpasture syndrome [19]. Moreover, changes in the collagen composition or morphology can be found in, e.g., scar tissue, atrophic skin, diabetic skin, and scleroderma. Due to the noncentrosymmetric structure of collagen I, second-harmonic generation (SHG) is a suitable visualization strategy for imaging collagen I noninvasively in the papillary and reticular dermis [20,21]. Coupled with two-photon tomography [22] for enhanced imaging depth, it is ideal for this task.
For the use of noninvasive optical methods, comprehensive image analysis is required. The SHG-to-AF Aging Index of Dermis (SAAID), where the coefficient of autofluorescence (AF) to SHG signal is measured, was introduced for estimating the relative concentration of collagen I in the skin [23] and was applied in many previous investigations [9,11,20]. The SAAID is regularly used to quantify skin aging and the effect of topical and systemic formulations on collagen I in vivo [9,24]. It is known that, with aging, the amount of collagen I in the skin is reduced [11], which can be seen in the alteration of the SAAID. To determine the SAAID, an AF image acquisition is necessary, increasing computational effort and storage space.
Lehmann et al. [25] could show by electron microscopy that potent topical steroid therapy over several weeks leads to the reorganization of collagen I bundles, showing a less interwoven and more compact collagen I fiber organization, clinically correlating with steroid-induced skin atrophy. It was previously shown that steroid atrophy exhibits a higher SAAID compared to healthy skin in young male adults [26]. These results may be due to the more compact reorganization of collagen I bundles in the dermis with fewer voids and interwoven structures as described previously.
However, the SAAID only takes into account the total intensity of AF and SHG images, but is unaffected by the structural collagen I orientation.
The method for the description of orientation of collagen fibers is readily available by the eccentricity and direction of the ellipse as a result of the Fast Fourier Transformation (FFT). It is a quantitative method used in skin and tissues accessible by microscopy methods producing SHG. It was used in the dermis [27], aging skin [28], scar tissue [29], as well as in situ during skin stretching [30]. Another application is the quantification of collagen in the human optic nerve head [31].
Textural analysis based on the grey level co-occurrence matrix was introduced in 1973 by Haralick [32] and is perfectly suited for medical imaging, where the location and distribution of features matter. FFT can be used to assess directionality and evaluate the distribution of collagen I fiber size [33,34,35]. The Hilbert transform is a special form of Fourier transform [36]. It acts as an envelope function for images to amplify structures in the dermis.
In this study, we identified parameters that are relevant in categorizing dermal collagen I structures using a training set of dermal two-photon excited AF and SHG images and using different image analysis methods to identify relevant properties of aging and damaged dermal collagen I structures. These parameters could be used in addition to the SAAID index in practice to describe collagen I in dermatology and cosmetics. This can be useful in analyzing images with visually different collagen I structures, which, however, have comparable SAAID values and, thus, are not distinguishable with current methods.

2. Materials and Methods

2.1. Two-Photon Tomography

A two-photon tomograph (Dermainspect, JenLab GmbH, Jena, Germany) equipped with a tunable femtosecond Ti:sapphire laser (Mai Tai XF, Spectra Physics, Santa Clara, CA, USA, 710–920 nm, 100 fs pulses at a repetition rate of 80 MHz) was used for horizontal imaging of human skin in vivo down to the reticular dermis. Under the excitation wavelength at 760 nm, a 410–680 nm band pass filter was used to detect two-photon excited AF, and a 375–385 nm band pass filter was used to detect second-harmonic generation (SHG) signals at an excitation wavelength of 760 nm. The lateral and axial resolutions were <0.36 µm and <1.7 µm, respectively [37]. The utilized two-photon tomograph was previously described in detail by our group [38,39].

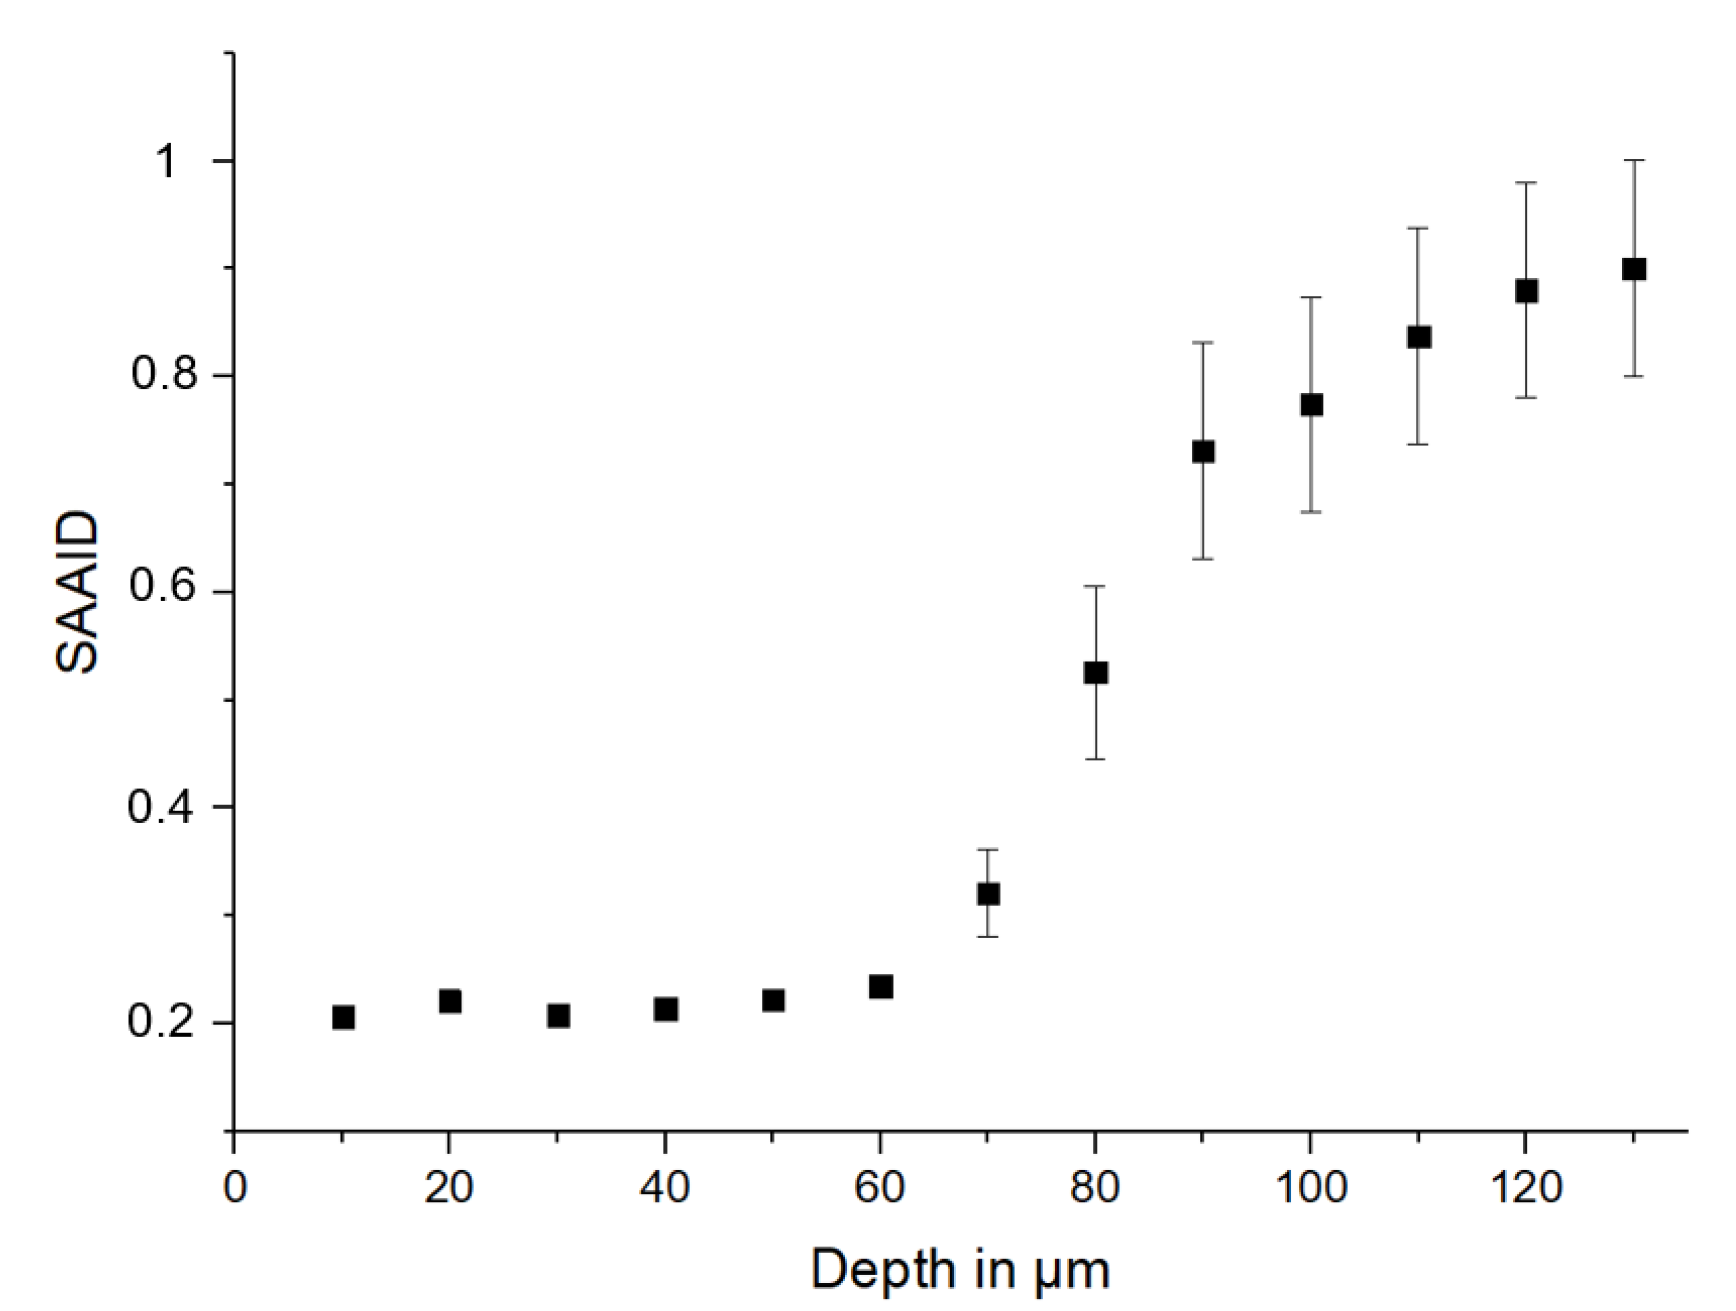
2.2. SHG-to-AF Aging Index of Dermis (SAAID)

The SAAID describes the ratio of the autofluorescence (AF) signal intensity, indicative for elastin, to the SHG signal intensity, indicative for collagen I [9], according to Equation (1).
SAAID = (SHG − AF)/(SHG + AF).
In this nomenclature, the SAAID decreases with photoaging, approaching −1 when the collagen I has been completely replaced by elastic fibers. For the SAAID analysis, the average SAAID value obtained for the transition zone between the stratum basale and the papillary dermis (typical depth between 40 and 80 µm for forearm skin) was used. The SAAID describes the relative intensity of collagen I to elastin [40] in the papillary and reticular dermis. It has to be considered that the SAAID provides arbitrary numeric values, which depend on the specific device. The values are evaluable within the conducted study, but not quantitatively comparable with the results obtained by other measuring devices in previous studies.

2.3. Grey Level Co-Occurrence Matrix (GLCM)

The grey level co-occurrence matrix (GLCM) describes the spatial relationship of adjacent pixels [41,42]. The GLCM is a quadratic matrix with a dimension equal to the amount of all possible grey values. The GLCM describes the density and number of pixels with intensity value i in spatial relation to pixels with intensity value j.
Four textural features were extracted from the GLCM. First, the contrast describes the intensity contrast between a pixel and its neighbor over the whole image, where the contrast is 0 for a constant image. The correlation describes how a pixel is correlated to its neighbor. It is 1 for a positively and −1 for a negatively correlated image. The correlation indicates a recurring pattern in the image. Energy or uniformity is the sum of squared elements in the GLCM and is 1 for a constant image, describing how much of the image is covered with features, and shows how the features and the span of grey values are distributed. The last property of the GLCM is the homogeneity. It describes the closeness of the distribution of elements in the GLCM to the GLCM diagonal and is 1 for a diagonal GLCM. Homogeneity indicates the density of features in an image.

2.4. Hilbert Transformation

The Hilbert transform is used for edge enhancement in image analysis [43] and has a relationship to the fractional Fourier transform [44]. A real function f(t) and its Hilbert transform bf(t) are related in such a way that they create a signal [45]. The signal has a phase and an amplitude. The Fourier transform of the strong analytic signal provides a one-sided spectrum in the frequency domain. A function and its Hilbert transform are orthogonal. The Hilbert transform is a one-dimensional operation and enhances edges in one direction only; for image processing, a two-dimensional mask with two-dimensional convolutions is used. Enhancing edges in images, recurring patterns are emphasized.

2.5. Directionality of Altered Extracellular Matrix

Changes in the extracellular matrix (ECM), especially collagen I structures, were measured by directionality as an indicator of skin alteration [46]. Collagen III mainly surrounds capillaries in the papillary dermis and has a low AF intensity and no SHG signal [3]. Therefore, it cannot be distinguished. Dermal collagen I in healthy intact skin was assumed to have no significant directionality, given the low age of the volunteers. The alteration of collagen I structures was processed by the SHG images; following binarization of the image, an FFT was performed, and the result was fitted with an ellipse consisting of the short axis a and the long axis b. The directionality parameter d is calculated as d = a/b, with a value of d = 1 indicating a higher directionality.

2.6. Statistical Analysis

TPE-FLIM data for all dermal components were recorded, descriptive statistics was applied, and directionality was processed using Matlab R2020b (MathWorks, Natick, MA, USA). All values are given as mean ± standard deviation.

2.7. Ethics

All volunteers enrolled in the study for intravital microscopy provided their written informed consent before participation. The study was approved by the ethics committee of the Charité—Universitätsmedizin Berlin (EA1-093-18).

2.8. Volunteers

All images were taken from the volar forearms of 24 female subjects, 36 to 50 years of age with skin types I–III according to Fitzpatrick [47] in healthy skin. Each measurement was repeated three times each. The skin was scanned down to a depth of 130 µm at 10 µm increments. The epidermis and both the papillary and reticular dermis were measured.

3. Results

3.1. Depth-Analysis of Human Skin with AF and SHG Detection Methods

The untreated healthy skin of n = 24 subjects was measured twice at time points two months apart using AF and SHG on the volar forearm, revealing significantly different ECM structures in the papillary and reticular dermis. SAAID values and textural GLCM feature values were averaged for all n = 24 subjects from 10 to 130 µm in depth as a baseline to establish rules for training dataset construction. The analysis of the training dataset groups follows in the next section.
The SAAID in Figure 1 shows a sharp increase between 60 and 85 µm in the papillary dermis region of the volar forearm from 0.3 to 0.8 and is relatively stable above 90 µm at a value of 0.85 ± 0.05. The AF is lower in the papillary dermis compared to the epidermis, due to the lower density of highly fluorescent cells [39] and the natural decrease in laser power with depth. The small deviations in SAAID throughout the dermis are mainly related to changes in the elastin concentration.
These findings are reflected in the GLCM analysis up to 130 µm shown in Figure 2. The parameters are contrast, correlation, homogeneity, and energy. In the papillary dermis of the forearm between 60 and 85 µm, the contrast and energy are decreasing, while the correlation and homogeneity are increasing toward greater depth. Maxima in the reticular dermis region of 85–130 µm can be found for correlation and homogeneity and minima are observed for contrast and energy.
On further visual inspection of the SHG images in the papillary and reticular dermis regions, two specific collagen I structures are recognized. The first collagen I fibers are thinner (3 ± 2 µm) and interconnected without a preferred orientation of the fibers (Figure 3a,c), and the second are thicker (8 ± 3 µm) collagen I fibers that are more independent, often with a preferred orientation of the fibers (Figure 3b,d). The difference between the papillary and reticular ECM is in collagen I density and intensity of the SHG signal.
For an ECM classification, the papillary dermis must be separated from the reticular dermis for higher specificity and sensitivity [9].

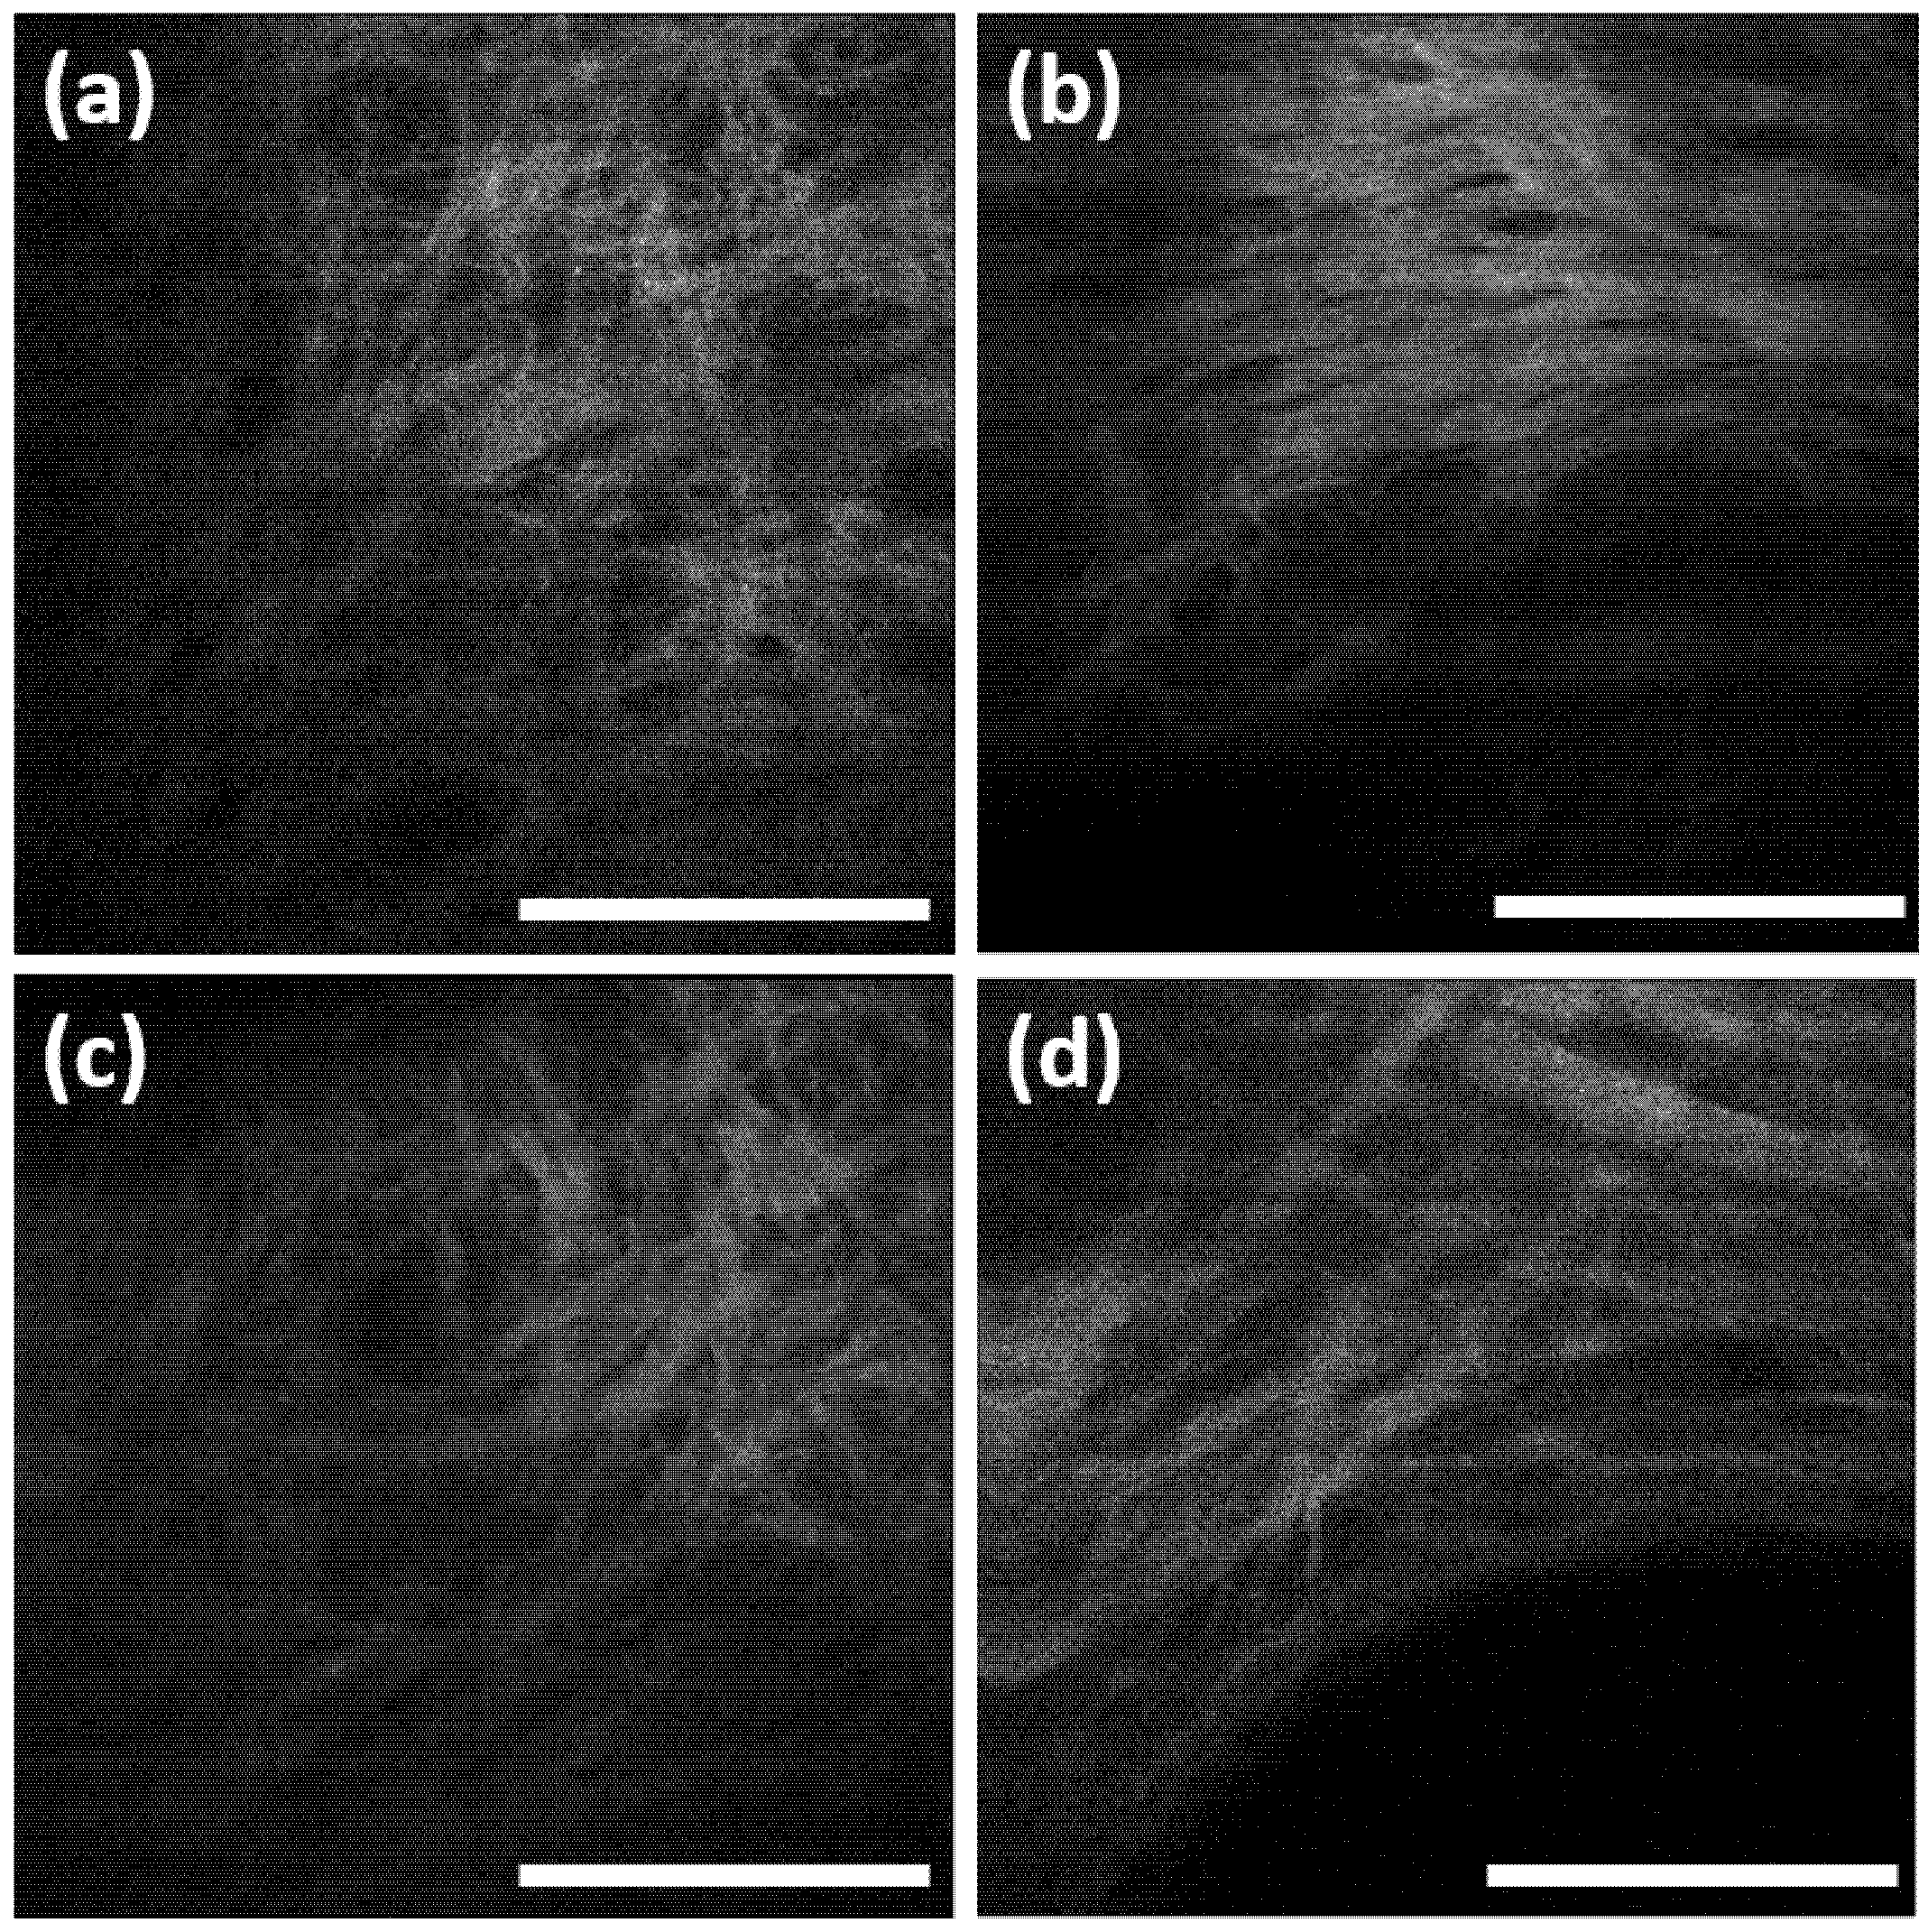
3.2. Construction of Training Datasets of Thin, Convoluted Collagen Structures and Thick, Oriented Collagen Structures

Four independent datasets were constructed for the investigation of extracellular changes in collagen I structures in the human dermis. All images were 512 × 512 pixel, 8-bit greyscale images, acquired at 760 nm and a 6.8 s acquisition time. The first dataset, group 1 (n = 28), was extracted from SHG and AF images of the papillary ECM at a 60–85 µm depth of healthy forearm skin. Collagen I structures were interconnected in a convoluted structure without a preferred orientation (Figure 3a, papillary dermis) and had a mean thickness of 3.4 ± 1.3 µm and an SAAID of 0.69 ± 0.11.
The second dataset, group 2 (n = 16), was extracted from SHG and AF images of the papillary ECM at a 60–85 µm depth of healthy forearm skin. Fewer collagen I fibers per image were visible compared to group 1. Collagen I structures were less interconnected with a preferred orientation (Figure 3b, papillary dermis) and had a higher mean thickness of 5.6 ± 1.5 µm compared to group 1 (Figure 3a) and an SAAID of 0.45 ± 0.08.
The third dataset, group 3 (n = 45), was extracted from SHG and AF images of the papillary ECM at a 85–120 µm depth of healthy skin from the volar forearm. Collagen I structures were interconnected in a convoluted structure without a preferred orientation (Figure 3c, reticular dermis) and had a mean thickness of 6.8 ± 2.0 µm and an SAAID of 0.42 ± 0.08.
The fourth dataset, group 4 (n = 34), was extracted from SHG and AF images of the papillary ECM at a 60–120 µm depth of healthy skin from the volar forearm. Collagen I structures were independent with a preferred orientation (Figure 3d, reticular dermis) and had a higher mean thickness of 8.7 ± 2.8 µm compared to the third dataset and an SAAID of 0.38 ± 0.06 (Figure 3c).
The datasets were constructed in such a way to reflect the parameter observed above and with similar levels of intensity and image coverage.

3.3. Collagen I Containing ECM Structures, and Analysis of SAAID, FFT Directionality, and Edge Detection in Native Grey Value Images

Using the constructed datasets above, parameters were found that could potentially be used in clinical practice to automatically detect changes in dermal ECM (collagen I) and quantitatively assess a progression of skin aging.
The results are summarized in Table 1. Calculated in the training datasets were SAAID, edge-Canny, and Sobel filters, and the directionality of the ellipse resulting from an FFT. The SAAID and edge detection methods correlate with the density of collagen I structures, while the directionality is the most important indicator for the orientation of collagen I fibers. The averaged grey value and Canny edge filter are less meaningful for detecting changes in ECM structures. In the reticular dermis, the SAAID and edge filter are less useful due to an overall drop in collagen I density in the reticular dermis.
Directionality, edge detection, and SAAID can be used to distinguish collagen I structures.

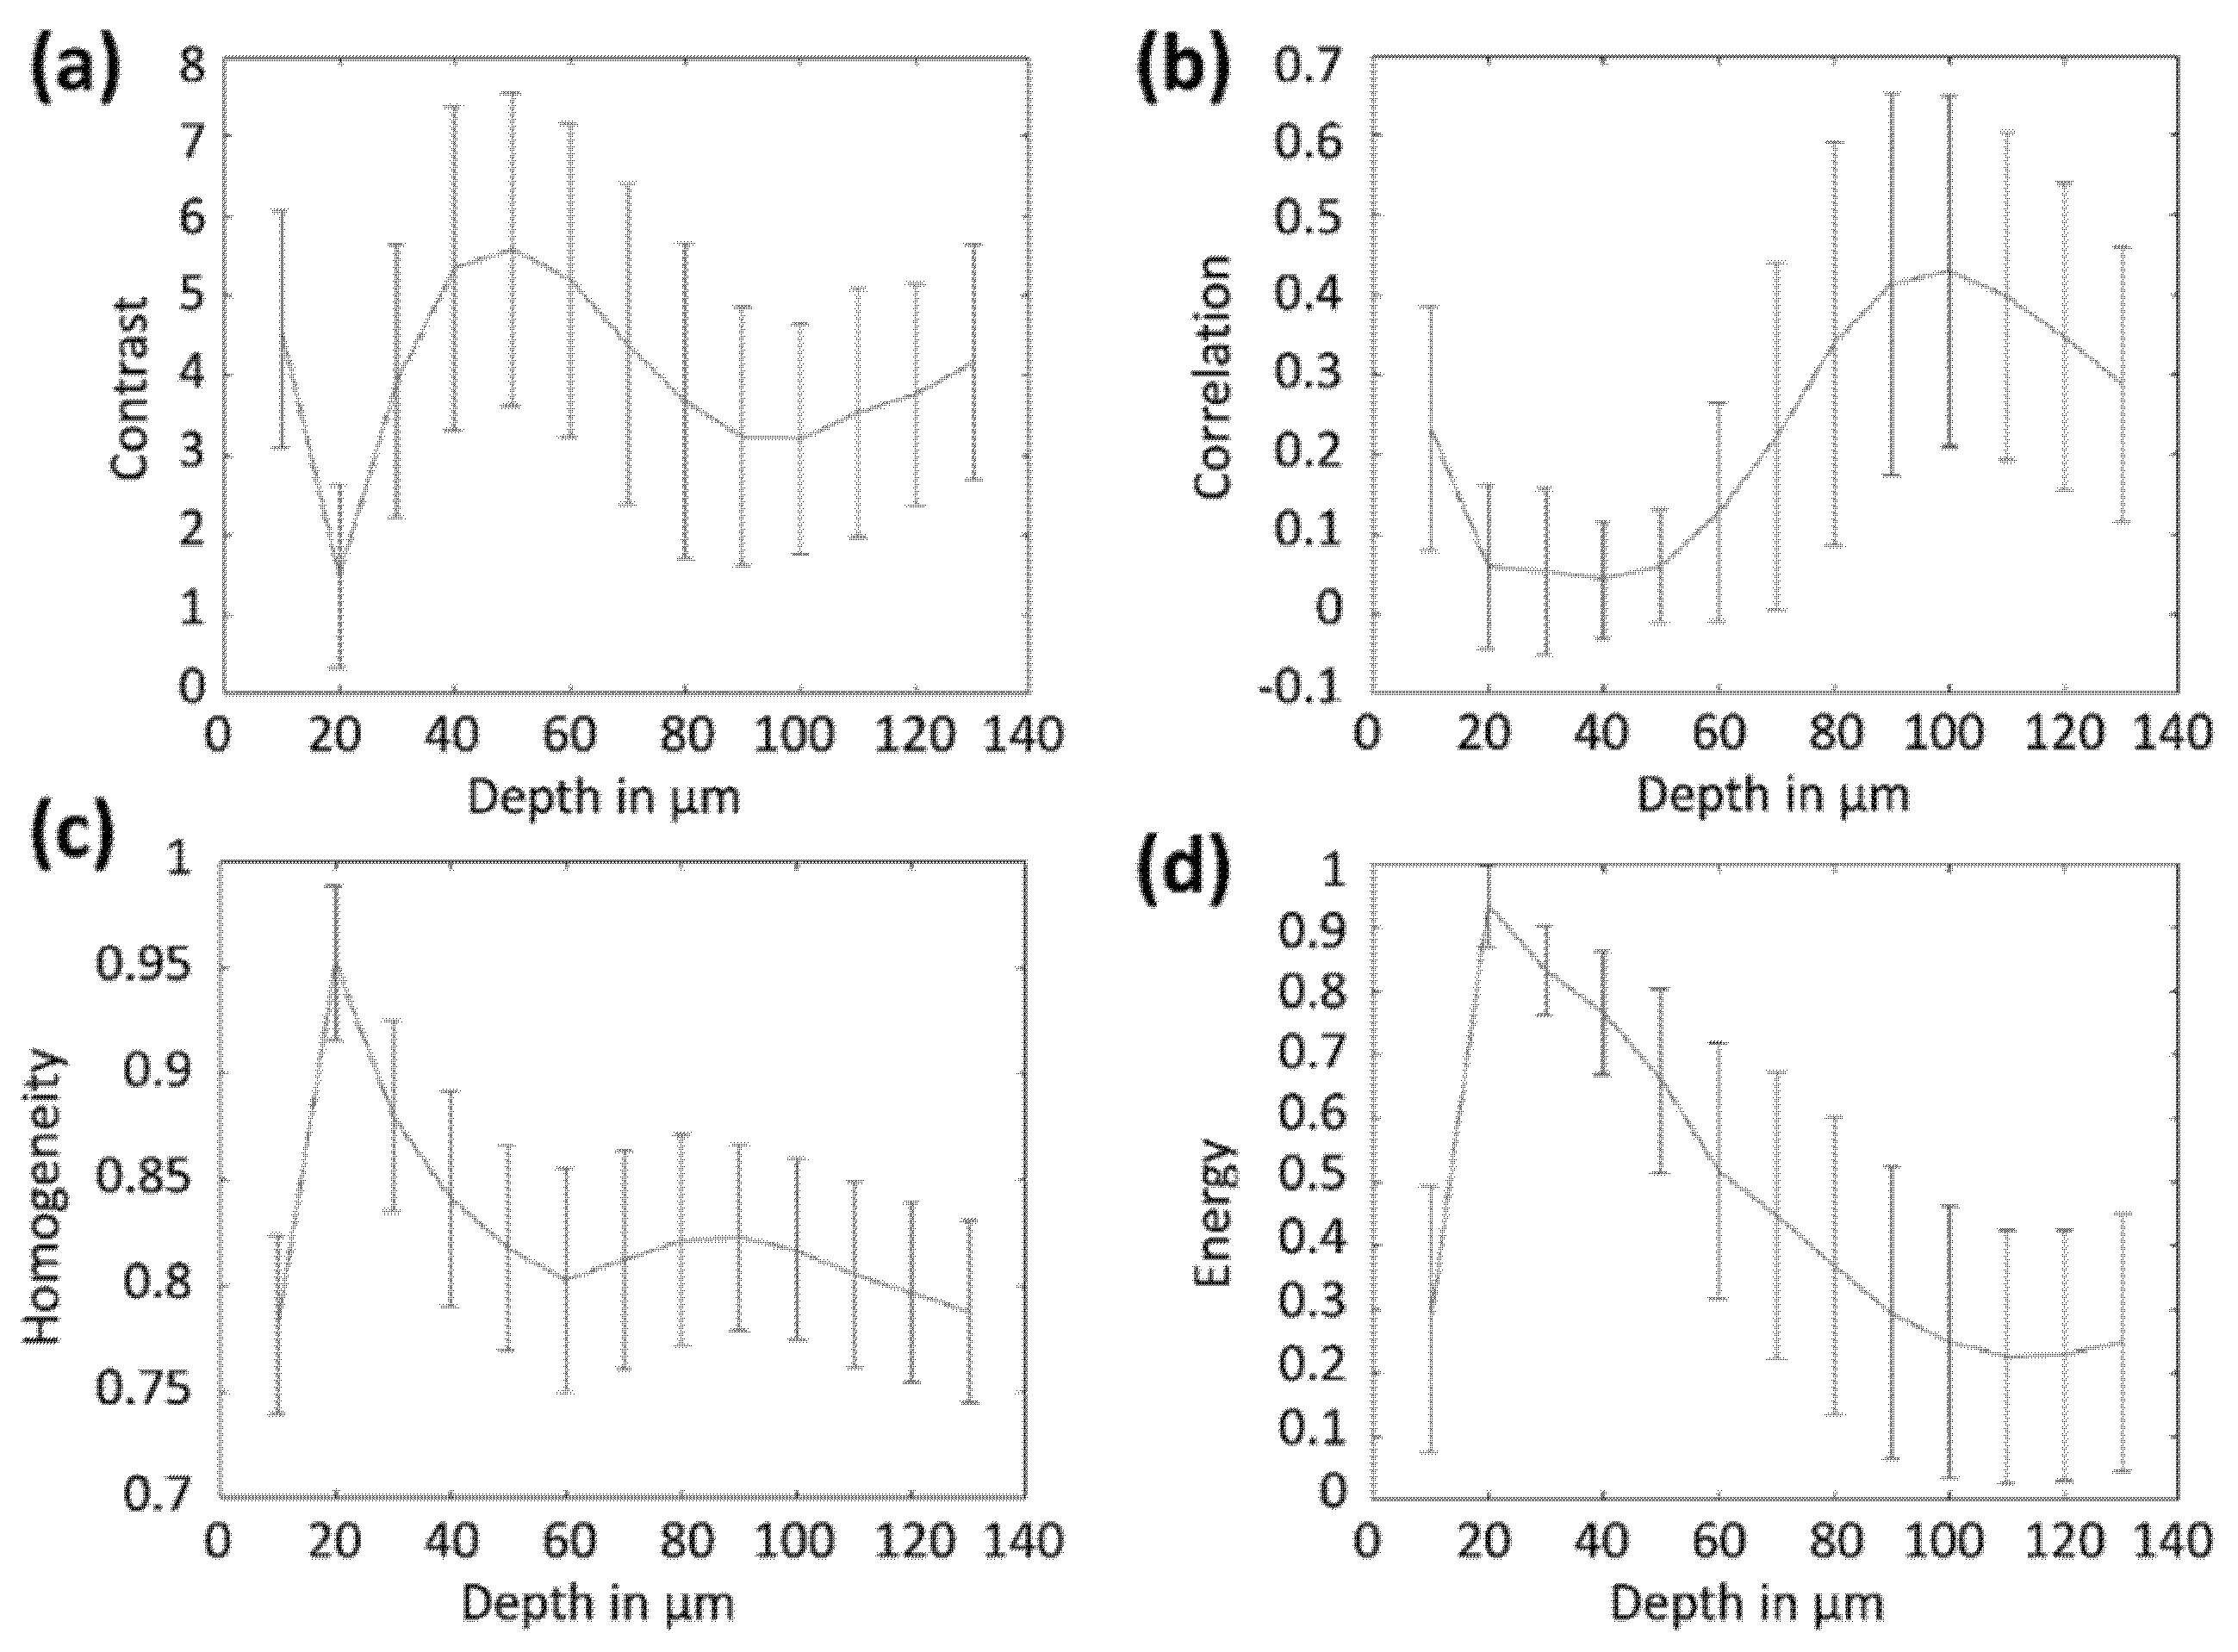
3.4. Grey Level Co-Occurrence Matrix Analysis in Native Grey Values and in Hilbert Transform

Significant differences in parameters in the papillary dermis can be seen for correlation, contrast, energy, and homogeneity, presented in Table 2. All parameters are significantly different and can be used to distinguish ECM structures. The correlation shows the most significant difference of all parameters because the algorithms detect recurring structures. In addition, the contrast is significantly higher due to slimmer collagen I fibers, which is reflected in the homogeneity and energy, as in less deviation in grey values overall. In the reticular dermis, the contrast is higher for thick, oriented structures. Yet, the correlation, energy, and homogeneity parameters are lower for groups 2 and 4 compared to groups 1 and 3. To improve significance, a Hilbert transformation was performed for the reticular datasets and the GLCM was analyzed again, summarized in Table 3. The momentums of the images are vastly different in the papillary dermis, −5461 ± 5284 in group 1 to 2995 ± 478 in group 2, as well as in the reticular dermis, −6287 ± 5272 in group 3 to 2891 ± 330 in group 4. Energy and homogeneity are significantly lower in thick reticular structures (groups 1 and 3) compared to thin reticular structures (groups 2 and 4). The results of the Hilbert transformation show a better separation between ECM structures p < 0.0001 compared to the GLCM parameter of grey value stacks at p < 0.01.
The GLCM shows changes in the papillary dermis. For the reticular dermis, the Hilbert transformation proves to be useful regarding contrast and momentum.

3.5. Distinction of Collagen I Structures in Skin with Similar SAAID Values

Group 2, representing the thick and oriented collagen I structures in the papillary dermis, and group 3, representing thin and convoluted collagen I structures in the reticular dermis, exhibit comparable SAAID values of 0.45 ± 0.08 to 0.42 ± 0.08. Groups can be distinguished by FFT directionality of the grey value images, correlation, and energy to a significant degree in the native GLCM and the third angular momentum in the Hilbert-transformed GLCM. The correlation is low at 0.14 in group 2 compared to 0.75 in group 3. The energy is 0.75 in group 2 compared to 0.12 in group 3. After Hilbert transformation, the third angular momentum is the clear indicator to separate group 2 with positive values from group 3 with negative values.

4. Discussion

The construction of four groups in the training set and the distinction between the papillary and reticular dermis yield robust results. The need for separate datasets depending on depth is clearly shown in Table 1. Superimposed results for SAAID between group 2, representing thick and oriented collagen I in the papillary dermis, and group 3, representing thin and convoluted collagen I in the reticular dermis, are shown. To sufficiently investigate age and sex parameters, a greater number of subjects is needed.
As expected, the size of collagen I fibers is increasing both from the papillary to the reticular dermis and from thin, convoluted oriented structures to thick, oriented structures. It can generally be noted that the distance between collagen I fibers increases and the density decreases with depth. This has consequences for the image analysis methods, which is why a separation between the papillary and reticular dermis was introduced.
The SAAID (Table 1) sharply increases in the papillary dermis region and is stable throughout the reticular dermis, caused by the papillae structures. Parts of the images in the papillary dermis show basal cells of the epidermis, where collagen I is not presented. No differences were observed in the volar forearm. Thus, in the subjects, no significant UV damage was seen.
Statistical GLCM properties (Figure 2, Table 2) were investigated from 10 to 130 µm in depth, together for all subjects, hence showing a wide range. The contrast shows a maximum in the lower epidermal region, suspected to be caused by the increased presence of melanocytes and a resulting high AF of melanin in the stratum basale with possible crosstalk into the SHG channel. A minimum contrast is found in the reticular dermis region around 100 µm. The correlation is lowest in the epidermis because no SHG signal is present; thus, the image is constant. The correlation maximum is in the reticular dermis, where collagen I fibers have a significantly lower density and the size and SHG signal intensities of the collagen I fibers are comparable. The homogeneity shows a local maximum in the reticular dermal region, where collagen I structures are visible all over the image. The energy is decreasing with depth, as the overall intensity is lower and the uniformity of the image is lower in the dermis, because the area of low SHG intensity per image is much higher compared to the epidermis.
Being a location-indifferent method, SAAID has shortcomings, relying completely on intensity. As shown in Table 1, groups 2 and 3 have comparable SAAID values, group 2 is constructed from papillary dermal collagen I structures, and group 3 is constructed from reticular dermal collagen I structures. The decision to separate the groups by depth, too, was validated here again. For the GLCM analysis, the feature location and distribution in the image is important, enabling the distinction of these groups in correlation and energy. The correlation is low at 0.14 ± 0.01 in group 2 compared to 0.75 ± 0.07 in group 3, indicating the sensitivity of the method to recurring patterns as visible in images of group 3. The energy is 0.8 ± 0.1 in group 2 compared to 0.12 ± 0.05 in group 3 because the structure size is greater in group 2 and there are more changes in intensity in group 3. After Hilbert transformation, the third angular momentum is the clear indicator to separate groups 2 and 3. Enhancing edge structures, the changes in intensity are emphasized, leading to negative values for group 3 and positive values for group 2.
Suitable methods to distinguish thin, interwoven collagen I structures from thick and oriented structures in the papillary dermis are FFT directionality [48] and momentum (Table 1), where the SAAID decreases, the directionality is higher in the thick oriented collagen I structures, and the angular third moment is increasing for thicker structures. The SAAID decreases as a wider image area shows the intensity for thin and interwoven structures. The directionality is higher in thick structures, indicated by lower values as the fibers are thicker and fewer fibers have to be pointed in one direction. The angular momentum is increased in both dataset groups toward thick oriented collagen I structures. Interestingly, while the edge detection methods are not statistically significant for collagen I structure categorization, the values for both edge detection methods are decreasing in the papillary dermis and increasing in the reticular dermis. A possible explanation is the better separation of thicker fibers and better recognition of edges by the algorithm.
The correlation is increasing for thick collagen I structures in the papillary dermis as the image is less constant, depicting thick structures. For the reticular dermis, the correlation is decreasing as the fibers are pointed in every direction and less regular patterns occur. The contrast and energy do not yield significant differences. The homogeneity is inconsistent in the papillary and reticular dermis, while the values are higher in thicker structures in the papillary dermis and lower in thicker structures in the reticular dermis compared to their thick interwoven counterparts. The homogeneity is roughly inversely correlated to the contrast; this is true for the papillary dermis. In deeper layers of the dermis, there is collagen I that has a high intensity compared to a negligible SHG intensity outside of collagen I, which leads to a stepped grey value histogram and subsequently to a lower homogeneity compared to closer, more interwoven fibers.
The Hilbert transform is a special version of an FFT transform with data presented in Table 3. Here, the Hilbert transform of the grey value image can be described as an envelope function smoothing out high frequencies in grey values. The biggest improvement for the categorization of collagen I structures is the value of momentum. For group 3, collagen I was at roughly −5000 to −6000, and for group 4, collagen I was around 3000. This is a clear parameter for distinguishing any aged or pathological dermal collagen I structures. Given these results, the SAAID can be supplemented or even be omitted, while the AF channel could become obsolete for collagen I analysis.

5. Conclusions

This study showed automated categorization parameters of different healthy dermal collagen I structures. An appropriate training set made up of four groups for thin and thick collagen I structures and the papillary and reticular dermis was established, and distinction parameters using the GLCM and directionality and Hilbert transform were identified for the appropriate depth for the volar forearm. Additionally, collagen I structures with similar SAAID can be distinguished, enabling an advanced and automated detection of the skin with collagen I alterations. Future studies using the presented methods require a larger sample size to further investigate the skin of different age groups.

Author Contributions

Conceptualization, M.E.D. and S.J.; methodology, M.K. and M.E.D.; software, M.K.; validation, J.S., S.J. and M.E.D.; formal analysis, M.K. and J.S.; investigation, M.K. and M.E.D.; resources, M.E.D.; data curation, S.J. and M.E.D.; writing—original draft preparation, M.K.; writing—review and editing, J.S., S.J. and M.E.D.; visualization, M.K.; supervision, M.E.D.; project administration, S.J.; funding acquisition, M.E.D. All authors have read and agreed to the published version of the manuscript.

Funding

The investigations were supported by the Foundation for Skin Physiology of the Donor Association for German Science and Humanities. M.K. received financial support through a scholarship fund of the Charité—Universitätsmedizin Berlin.

Institutional Review Board Statement

The study was conducted according to the guidelines of the Declaration of Helsinki, and approved by the Ethics Committee of Charité—Universitätsmedizin Berlin (EA1-093-18, approved on 3 May 2018).

Informed Consent Statement

Informed consent was obtained from all subjects involved in the study.

Data Availability Statement

The data are available from the corresponding author upon reasonable request.

Conflicts of Interest

The authors declare no conflict of interest.

References

  1. Pfisterer, K.; Shaw, L.E.; Symmank, D.; Weninger, W. The Extracellular Matrix in Skin Inflammation and Infection. Front. Cell Dev. Biol. 2021, 9, 1–19. [Google Scholar] [CrossRef] [PubMed]
  2. Xue, M.; Jackson, C.J. Extracellular Matrix Reorganization During Wound Healing and Its Impact on Abnormal Scarring. Adv. Wound Care 2015, 4, 119–136. [Google Scholar] [CrossRef] [PubMed] [Green Version]
  3. Shirshin, E.A.; Gurfinkel, Y.I.; Priezzhev, A.V.; Fadeev, V.V.; Lademann, J.; Darvin, M.E. Two-photon autofluorescence lifetime imaging of human skin papillary dermis in vivo: Assessment of blood capillaries and structural proteins localization. Sci. Rep. 2017, 7, 1171. [Google Scholar] [CrossRef] [Green Version]
  4. Carlson, M.A.; Longaker, M.T. The fibroblast-populated collagen matrix as a model of wound healing: A review of the evidence. Wound Repair Regen. 2004, 12, 134–147. [Google Scholar] [CrossRef] [PubMed]
  5. McDougall, S.; Dallon, J.; Sherratt, J.; Maini, P. Fibroblast migration and collagen deposition during dermal wound healing: Mathematical modelling and clinical implications. Philos. Trans. R. Soc. A Math. Phys. Eng. Sci. 2006, 364, 1385–1405. [Google Scholar] [CrossRef] [PubMed]
  6. Marcos-Garcés, V.; Molina Aguilar, P.; Bea Serrano, C.; García Bustos, V.; Benavent Seguí, J.; Ferrández Izquierdo, A.; Ruiz-Saurí, A. Age-related dermal collagen changes during development, maturation and ageing—A morphometric and comparative study. J. Anat. 2014, 225, 98–108. [Google Scholar] [CrossRef] [PubMed]
  7. Fisher, G.J.; Kang, S.; Varani, J.; Bata-Csorgo, Z.; Wan, Y.; Datta, S.; Voorhees, J.J. Mechanisms of Photoaging and Chronological Skin Aging. Arch. Dermatol. 2002, 138, 1462–1470. [Google Scholar] [CrossRef] [PubMed]
  8. Kawaguchi, Y.; Tanaka, H.; Okada, T.; Konishi, H.; Takahashi, M.; Ito, M.; Asai, J. The effects of ultraviolet A and reactive oxygen species on the mRNA expression of 72-kDa type IV collagenase and its tissue inhibitor in cultured human dermal fibroblasts. Arch. Dermatol. Res. 1996, 288, 39–44. [Google Scholar] [CrossRef]
  9. Darvin, M.E.; Richter, H.; Ahlberg, S.; Haag, S.F.; Meinke, M.C.; Le Quintrec, D.; Doucet, O.; Lademann, J. Influence of sun exposure on the cutaneous collagen/elastin fibers and carotenoids: Negative effects can be reduced by application of sunscreen. J. Biophotonics 2014, 7, 735–743. [Google Scholar] [CrossRef] [PubMed]
  10. Meigel, W.N.; Gay, S.; Weber, L. Dermal architecture and collagen type distribution. Arch. Dermatol. Res. 1977, 259, 1–10. [Google Scholar] [CrossRef]
  11. Koehler, M.J.; König, K.; Elsner, P.; Bückle, R.; Kaatz, M. In vivo assessment of human skin aging by multiphoton laser scanning tomography. Opt. Lett. 2006, 31, 2879. [Google Scholar] [CrossRef] [PubMed] [Green Version]
  12. Ueck, C. Charakterisierung Humaner Diabetischer Haut und Diabetischer Modellsysteme Bezüglich Barrierefunktion, Dermisstruktur und der Wirkung von Triterpenen auf die Wundheilung. Ph.D. Thesis, University Hamburg, Hamburg, Germany, 13 May 2016. [Google Scholar]
  13. König, K. Clinical multiphoton tomography. J. Biophotonics 2008, 1, 13–23. [Google Scholar] [CrossRef]
  14. Darvin, M.E.; Richter, H.; Zhu, Y.J.; Meinke, M.C.; Knorr, F.; Gonchukov, S.A.; Koenig, K.; Lademann, J. Comparison of in vivo and ex vivo laser scanning microscopy and multiphoton tomography application for human and porcine skin imaging. Quantum Electron. 2014, 44, 646–651. [Google Scholar] [CrossRef]
  15. Tilbury, K.; Campagnola, P.J. Applications of second-harmonic generation imaging microscopy in ovarian and breast cancer. Perspect. Med. Chem. 2015, 7, 21–32. [Google Scholar] [CrossRef] [PubMed] [Green Version]
  16. Yasui, T.; Sasaki, K.; Tohno, Y.; Araki, T. Tomographic imaging of collagen fiber orientation in human tissue using depth-resolved polarimetry of second-harmonic-generation light. Opt. Quantum Electron. 2005, 37, 1397–1408. [Google Scholar] [CrossRef]
  17. Vanakker, O.M.; Hemelsoet, D.; De Paepe, A. Hereditary connective tissue diseases in young adult stroke: A comprehensive synthesis. Stroke Res. Treat. 2011, 2011, 712903. [Google Scholar] [CrossRef] [Green Version]
  18. Malfait, F.; Castori, M.; Francomano, C.A.; Giunta, C.; Kosho, T.; Byers, P.H. The Ehlers–Danlos syndromes. Nat. Rev. Dis. Prim. 2020, 6, 64. [Google Scholar] [CrossRef]
  19. Shiferaw, B.; Miro, V.; Smith, C.; Akella, J.; Chua, W.; Kim, Z. Goodpasture’s Disease: An Uncommon Disease With an Atypical Clinical Course. J. Clin. Med. Res. 2016, 8, 52–55. [Google Scholar] [CrossRef] [PubMed] [Green Version]
  20. Pittet, J.-C.; Freis, O.; Vazquez-Duchêne, M.-D.; Périé, G.; Pauly, G. Evaluation of Elastin/Collagen Content in Human Dermis in-Vivo by Multiphoton Tomography—Variation with Depth and Correlation with Aging. Cosmetics 2014, 1, 211–221. [Google Scholar] [CrossRef] [Green Version]
  21. Schenke-Layland, K. Non-invasive multiphoton imaging of extracellular matrix structures. J. Biophotonics 2008, 1, 451–462. [Google Scholar] [CrossRef] [Green Version]
  22. Diaspro, A.; Chirico, G. Two-photon excitation microscopy. Adv. Imaging Electron Phys. 2003, 126, 399–429. [Google Scholar] [CrossRef]
  23. Lin, S.-J.; Wu, R.-J.; Tan, H.-Y.; Lo, W.; Lin, W.-C.; Young, T.-H.; Hsu, C.-J.; Chen, J.-S.; Jee, S.-H.; Dong, C.-Y. Evaluating cutaneous photoaging by use of multiphoton fluorescence and second-harmonic generation microscopy. Opt. Lett. 2005, 30, 2275. [Google Scholar] [CrossRef]
  24. Meinke, M.C.; Nowbary, C.K.; Schanzer, S.; Vollert, H.; Lademann, J.; Darvin, M.E. Influences of orally taken carotenoid-rich curly kale extract on collagen I/elastin index of the skin. Nutrients 2017, 9, 775. [Google Scholar] [CrossRef] [Green Version]
  25. Lehmann, P.; Zheng, P.; Lavker, R.M.; Kligman, A.M. Corticosteroid atrophy in human skin. A study by light, scanning, and transmission electron microscopy. J. Investig. Dermatol. 1983, 81, 169–176. [Google Scholar] [CrossRef] [Green Version]
  26. Jung, S.; Lademann, J.; Darvin, M.E.; Richter, C.; Pedersen, C.B.; Richter, H.; Schanzer, S.; Kottner, J.; Blume-Peytavi, U.; Røpke, M.A. In vivo characterization of structural changes after topical application of glucocorticoids in healthy human skin. J. Biomed. Opt. 2017, 22, 076018. [Google Scholar] [CrossRef] [PubMed] [Green Version]
  27. Noorlander, M.L.; Melis, P.; Jonker, A.; Van Noorden, C.J.F. A quantitative method to determine the orientation of collagen fibers in the dermis. J. Histochem. Cytochem. 2002, 50, 1469–1474. [Google Scholar] [CrossRef] [PubMed] [Green Version]
  28. Wu, S.; Li, H.; Yang, H.; Zhang, X.; Li, Z.; Xu, S. Quantitative analysis on collagen morphology in aging skin based on multiphoton microscopy. J. Biomed. Opt. 2011, 16, 040502. [Google Scholar] [CrossRef]
  29. Mostaço-Guidolin, L.; Rosin, N.L.; Hackett, T.L. Imaging collagen in scar tissue: Developments in second harmonic generation microscopy for biomedical applications. Int. J. Mol. Sci. 2017, 18, 1772. [Google Scholar] [CrossRef]
  30. Ducourthial, G.; Affagard, J.S.; Schmeltz, M.; Solinas, X.; Lopez-Poncelas, M.; Bonod-Bidaud, C.; Rubio-Amador, R.; Ruggiero, F.; Allain, J.M.; Beaurepaire, E.; et al. Monitoring dynamic collagen reorganization during skin stretching with fast polarization-resolved second harmonic generation imaging. J. Biophotonics 2019, 12, 1–9. [Google Scholar] [CrossRef] [PubMed] [Green Version]
  31. Pijanka, J.K.; Markov, P.P.; Midgett, D.; Paterson, N.G.; White, N.; Blain, E.J.; Nguyen, T.D.; Quigley, H.A.; Boote, C. Quantification of collagen fiber structure using second harmonic generation imaging and two-dimensional discrete Fourier transform analysis: Application to the human optic nerve head. J. Biophotonics 2019, 12, 1–19. [Google Scholar] [CrossRef] [Green Version]
  32. Haralick, R.M.; Shanmugam, K.; Dinstein, I. Textural Features for Image Classification. IEEE Trans. Syst. Man. Cybern 1973, SMC-3, 610–621. [Google Scholar] [CrossRef] [Green Version]
  33. De Vries, H.J.C.; Enomoto, D.N.H.; Van Marle, J.; Van Zuijlen, P.P.M.; Mekkes, J.R.; Bos, J.D. Dermal organization in scleroderma: The fast fourier transform and the laser scatter method objectify fibrosis in nonlesional as well as lesional skin. Lab. Investig. 2000, 80, 1281–1289. [Google Scholar] [CrossRef] [Green Version]
  34. Osman, O.S.; Selway, J.L.; Harikumar, P.E.; Stocker, C.J.; Wargent, E.T.; Cawthorne, M.A.; Jassim, S.; Langlands, K. A novel method to assess collagen architecture in skin. BMC Bioinform. 2013, 14, 260. [Google Scholar] [CrossRef] [Green Version]
  35. Reznikov, N.; Almany-Magal, R.; Shahar, R.; Weiner, S. Three-dimensional imaging of collagen fibril organization in rat circumferential lamellar bone using a dual beam electron microscope reveals ordered and disordered sub-lamellar structures. Bone 2013, 52, 676–683. [Google Scholar] [CrossRef]
  36. Yang, K.; Yu, K.; Li, Q. Modal parameter extraction based on Hilbert transform and complex independent component analysis with reference. Mech. Syst. Signal Process. 2013, 40, 257–268. [Google Scholar] [CrossRef]
  37. Weinigel, M.; Breunig, H.G.; Kellner-Höfer, M.; Bückle, R.; Darvin, M.E.; Klemp, M.; Lademann, J.; König, K. In vivo histology: Optical biopsies with chemical contrast using clinical multiphoton/coherent anti-Stokes Raman scattering tomography. Laser Phys. Lett. 2014, 11, 055601. [Google Scholar] [CrossRef]
  38. Zhu, Y.; Choe, C.-S.; Ahlberg, S.; Meinke, M.C.; Alexiev, U.; Lademann, J.; Darvin, M.E. Penetration of silver nanoparticles into porcine skin ex vivo using fluorescence lifetime imaging microscopy, Raman microscopy, and surface-enhanced Raman scattering microscopy. J. Biomed. Opt. 2015, 20, 051006. [Google Scholar] [CrossRef] [PubMed]
  39. Kröger, M.; Scheffel, J.; Nikolaev, V.V.; Shirshin, E.A.; Siebenhaar, F.; Schleusener, J.; Lademann, J.; Maurer, M.; Darvin, M.E. In vivo non-invasive staining-free visualization of dermal mast cells in healthy, allergy and mastocytosis humans using two-photon fluorescence lifetime imaging. Sci. Rep. 2020, 10, 14930. [Google Scholar] [CrossRef]
  40. Czekalla, C.; Schönborn, K.H.; Döge, N.; Jung, S.; Darvin, M.E.; Lademann, J.; Meinke, M.C. Impact of Body Site, Age, and Gender on the Collagen/Elastin Index by Noninvasive in vivo Vertical Two-Photon Microscopy. Ski. Pharmacol. Physiol. 2017, 30, 260–267. [Google Scholar] [CrossRef] [Green Version]
  41. Quinn, K.P.; Golberg, A.; Broelsch, G.F.; Khan, S.; Villiger, M.; Bouma, B.; Austen, W.G.; Sheridan, R.L.; Mihm, M.C.; Yarmush, M.L.; et al. An automated image processing method to quantify collagen fibre organization within cutaneous scar tissue. Exp. Dermatol. 2015, 24, 78–80. [Google Scholar] [CrossRef] [Green Version]
  42. Chaudhuri, D. A simple least squares method for fitting of ellipses and circles depends on border points of a two-tone image and their 3-D extensions. Pattern Recognit. Lett. 2010, 31, 818–829. [Google Scholar] [CrossRef]
  43. Davis, J.A.; McNamara, D.E.; Cottrell, D.M.; Campos, J. Image processing with the radial Hilbert transform: Theory and experiments. Opt. Lett. 2000, 25, 99. [Google Scholar] [CrossRef] [PubMed]
  44. Zayed, A.I. Hubert transform associated with the fractional fourier transform. IEEE Signal Process. Lett. 1998, 5, 206–208. [Google Scholar] [CrossRef]
  45. ČÍŽEK, Vá. Discrete Hilbert Transform. IEEE Trans. Audio Electroacoust. 1970, 18, 340–343. [Google Scholar] [CrossRef]
  46. Molina, N.; Aguirre, J.; Walczak, M. Application of FFT analysis for the study of directionality of wear scars in exposure to slurry flow of varying velocity. Wear 2019, 426–427, 589–595. [Google Scholar] [CrossRef]
  47. Fitzpatrick, T.B. The Validity and Practicality of Sun-Reactive Skin Types I Through VI. Arch. Dermatol. 1988, 124, 869–871. [Google Scholar] [CrossRef]
  48. Cicchi, R.; Kapsokalyvas, D.; De Giorgi, V.; Maio, V.; Van Wiechen, A.; Massi, D.; Lotti, T.; Pavone, F.S. Scoring of collagen organization in healthy and diseased human dermis by multiphoton microscopy. J. Biophotonics 2010, 3, 34–43. [Google Scholar] [CrossRef]
Figure 1. SHG-to-AF Aging Index of Dermis (SAAID). The SAAID was measured from the stratum corneum to a depth of 130 µm on the volar forearm and is steeply increasing in the papillary dermis in healthy skin of the volar forearm. The data show the mean ± standard deviation (n = 24).
Photonics 08 00404 g001
Figure 2. Depth analysis of statistical GLCM properties. GLCM parameters contrast (a), correlation (b), homogeneity (c), and energy (d) were recorded from the stratum corneum to a 130 µm depth on the volar forearm in 24 volunteers. The data are presented as a line plot with straight lines connecting the mean data points.
Photonics 08 00404 g002
Figure 3. Exemplary images of collagen I structures (SHG signals) of the papillary and reticular dermis. The training data were categorized into group 1 representing thin, convoluted collagen I structures in the papillary dermis (a); group 2 representing thick, oriented collagen I structures in the papillary dermis (b); group 3 representing thin, convoluted collagen I structures in the reticular dermis (c); and group 4 representing thick, oriented collagen I structures in the reticular dermis (d). All images were acquired at 50 mW, 760 nm, and a 6.8 s acquisition time. Scale bars are 20 µm in length.
Photonics 08 00404 g003
Table 1. Summary of the results of the applied image analysis methods for the papillary and reticular dermis. Values were calculated from the training datasets as described before. Groups 1 and 2 were extracted from a depth of 60–85 µm on the volar forearm, and groups 3 and 4 were extracted from 85–120 µm on the volar forearm.
Papillary DermisReticular Dermis
Group 1:
Thin,
Convoluted
Group 2:
Thick,
Oriented
Group 3:
Thin,
Convoluted
Group 4:
Thick,
Oriented
SAAID0.7 ± 0.10.45 ± 0.080.42 ± 0.080.38 ± 0.06
Grey value21 ± 713 ± 416 ± 510 ± 3
Edge Canny7500 ± 9006500 ± 20007900 ± 11008800 ± 800
Edge Sobel6600 ± 5006100 ± 16006400 ± 4006500 ± 500
FFT directionality0.95 ± 0.040.82 ± 0.080.96 ± 0.030.89 ± 0.03
Third angular momentum0.016 ± 0.0030.054 ± 0.0060.014 ± 0.0030.054 ± 0.006
Table 2. Summary of GLCM results for native grey values. The GLCM parameters, correlation, contrast, energy, and homogeneity are shown for thin and thick datasets in the papillary and reticular dermis in native grey values. Groups 1 and 2 were extracted from a depth of 60–85 µm on the volar forearm, and groups 3 and 4 were extracted from 85–120 µm on the volar forearm.
Papillary Dermis Reticular Dermis
Group 1:
Thin,
Convoluted
Group 2:
Thick,
Oriented
Group 3:
Thin,
Convoluted
Group 4:
Thick,
Oriented
Correlation0.26 ± 0.030.14 ± 0.010.75 ± 0.070.67 ± 0.09
Contrast1.5 ± 0.41.24 ± 0.501.6 ± 0.52.0 ± 0.7
Energy0.5 ± 0.20.8 ± 0.10.12 ± 0.050.11 ± 0.07
Homogeneity0.71 ± 0.030.77 ± 0.020.70 ± 0.050.63 ± 0.02
Table 3. Summary of GLCM results with Hilbert transformation. The GLCM parameters, correlation, contrast, energy, and homogeneity are shown for Hilbert-transformed thin and thick datasets in the papillary and reticular dermis. Groups 1 and 2 were extracted from a depth of 60–85 µm on the volar forearm, and groups 3 and 4 were extracted from 85–120 µm on the volar forearm.
Papillary DermisReticular Dermis
Group 1:
Thin,
Convoluted
Group 2:
Thick,
Oriented
Group 3:
Thin,
Convoluted
Group 4:
Thick,
Oriented
Correlation0.5 ± 0.10.6 ± 0.20.5 ± 0.10.45 ± 0.10
Contrast12 ± 310 ± 412 ± 313 ± 3
Energy0.30 ± 0.030.33 ± 0.040.31 ± 0.030.29 ± 0.02
Homogeneity0.77 ± 0.050.81 ± 0.060.79 ± 0.040.74 ± 0.04
Third angular momentum−5461 ± 52842995 ± 478−6287 ± 52722891 ± 330
Publisher’s Note: MDPI stays neutral with regard to jurisdictional claims in published maps and institutional affiliations.

