Communication

Passive Athermal Optical Design Method Considering Thermal-Induced Surface Deformation

1
Changchun Institute of Optics, Fine Mechanics and Physics, Chinese Academy of Sciences, Changchun 130033, China
2
University of Chinese Academy of Sciences, Beijing 100049, China
*
Author to whom correspondence should be addressed.
Photonics 2021, 8(9), 396; https://doi.org/10.3390/photonics8090396
Submission received: 18 August 2021 / Revised: 1 September 2021 / Accepted: 10 September 2021 / Published: 16 September 2021
(This article belongs to the Special Issue Optical Instrumentation)

Abstract

:
Temperature variation not only results in changes in refractive index, radius, thickness, and air space, but also leads to surface deformation due to the mismatch in thermal expansion coefficients between glass and mechanical materials. However, existing passive athermal optical design methods cannot optimize thermal-induced surface deformation, and optimization methods usually focus on structural optimization or thermal control rather than optical optimization. Here, we investigate the deterioration in image quality caused by thermal-induced surface deformation and propose a passive athermal optical design method to reduce deterioration. To this end, MATLAB was utilized to jointly call finite element analysis (FEA) software (COMSOL) and optical design software (Code V) to realize the data exchange of an optical–mechanical–thermal integrated analysis for iterative optical optimization. This process makes automatic iterative optimization possible by transforming parametric FEA results into Zernike coefficients in each iteration of optimization. The theoretical and design examples indicate that our method can effectively reduce the degradation in image quality with surface deformation. Our method provides an optical optimization approach for optical designers to work on a passive athermal optical design by considering thermal-induced surface deformation.

1. Introduction

Temperature has a considerable influence on image quality. There are two main categories for decreasing this influence: active athermalization and passive athermalization. Active athermalization increases the complexity, volume, and weight of the optical system [1,2]. To avoid these disadvantages, passive athermalization ensures that an optical system without an additional focusing mechanism still provides clear image quality over an entire operating temperature range. This design method is used in optical systems with wide operating temperature ranges, such as large relative aperture photographic objective lenses, aerial drone lenses, projection optical systems, etc., [3,4,5]. Conventional passive athermal design is completed by glass material selection and optical–mechanical–thermal-integrated analysis [6,7]. In this process, optical optimization design can only reduce the deterioration in image quality caused by refractive index, radius, thickness of the lens, and air space. Deformation of a surface due to axial and radial stress caused by the mismatch in thermal expansion coefficients between glass and mechanical materials is only improved by structural optimization or thermal control methods. Optical design merely simulates and analyzes the results of structural and thermal analysis and evaluates the degradation of imaging quality. However, structural optimization design is cumbersome, and the thermal control method increases a system’s volume. At the same time, every optical–mechanical–thermal-integrated analysis needs one or more engineers with different knowledge backgrounds in optical, mechanical, or thermal control to complete a round of analysis, and the data from multiple software analysis results need to be interactively used; thus, each integration analysis requires a long time. Therefore, an optical optimization method that can be performed independently by optical designers with basic knowledge of mechanics and thermodynamics, while considering thermal-induced surface deformation, is required.
A great number of previous studies in passive athermal optical design methods have focused on the selection of lens materials. Graphical selection of optical materials is proposed to achieve an achromatized and athermalized system [8,9]. Rogers proposes the automated glass selection algorithm of Code V to select glasses that reduce the optical aberrations over temperature [10]. Furkan designed an athermalized lens for automotive cameras which could work from −40 °C to 100 °C [11]. However, both of the above studies are limited to lens material selection methods. The influence of thermal-induced surface deformation has not received sufficient attention from optical designers. The thermal-induced surface deformation is usually reduced by thermal control or structural optimization methods [12,13]. However, this process takes time and makes the structure unnecessarily complicated. Therefore, an optical design method is needed that considers thermal-induced surface deformation.
This paper primarily studies a passive athermal optical design method while considering thermal-induced surface deformation. This method introduces surface deformation into each iterative optimization and automatically completes multiple iteration optimizations until an optical optimum result is obtained. We use MATLAB to jointly call FEA software (COMSOL) and optical design software (Code V) to realize this process. In each iterative optimization, the program automatically runs parametric FEA of each lens unit under thermal stress conditions and converts FEA results into the Zernike format for next-step optical optimization. To prove the validity of this method, we use a single lens and a 170 °C temperature range for a passive athermal lens as examples. This method provides an optical optimization approach that optical designers with basic knowledge of mechanics and thermodynamics can complete independently in terms of passive athermal optical design while considering thermal-induced surface deformation.
This paper comprises the following sections. Section 2 analyzes the degradation of image quality of a passive athermalized optical system caused by thermal-induced surface deformation at low temperatures. Section 3 presents our method to solve this issue. Section 3.1 theoretically analyzes the optical design optimizability based on wave aberration theory. Section 3.2 introduces the progression of our passive athermal optical design method with the consideration of thermal-induced surface deformation. Section 3.3 constructs the parametric FEA model of a single-lens unit. Section 3.4 transforms FEA results into the Zernike format, which is suitable for optical design optimization. Section 4 takes a broad temperature range lens as an example to illustrate the feasibility of this method. The discussion and conclusion are presented in Section 5.

2. Degradation of Image Quality Caused by Thermal-Induced Surface Deformation

For an example of a passive athermal lens that does not consider thermal-induced surface deformation, an F/2.4 visible lens operating in the range from −70 °C to 100 °C is presented. The optical system specifications are shown in Table 1.
The result of the athermalized optical system that does not consider thermal-induced surface deformation is shown in Table 2 and Figure 1. The influence of refractive index, radius, thickness, and air space caused by temperature changes is optimized so that the optical system can have clear imaging quality in the entire operating temperature range. The optics transfer function, MTF at 35 lp/mm of different temperatures is shown in Figure 2; the MTF at 35 lp/mm is greater than 0.25 over all operating temperatures. The field curves of different temperatures are shown in Figure 3. The wavefront analysis results of different temperatures are shown in Table 3.
The thermal expansion coefficients of the four lenses are αg1 = 99 × 10−6/°C (HZPK1A), αg2 = 124 × 10−6/°C (HZPK5), αg3 = 84 × 10−6/°C (HZF12), and αg4 = 58 × 10−6/°C (HZLAF68N), which are lower than the thermal expansion coefficients of housing material. In the low temperature state, the mechanical housing shrinkage is greater than that of the optical elements, and the lenses are squeezed by the lens housing, resulting in surface deformation. The conventional optical–mechanical–thermal integrated analysis method uses CAD software modeling, FEA software to obtain the deformation results, data conversion software to generate identifiable files for optical design software, and then analyzes them in the optical design software. The structural profile of the lens is shown in Figure 4. The FEA model is built by Hyperworks as shown in Figure 5. The analysis results should be loaded into optical design software. The MTF graph of the optical system in low temperature is shown in Figure 6. We can obtain the imaging quality of the optical system under low temperature, which is significantly degraded. Specifically in the mid-range region, the MTF results of all fields at 18 lp/mm reduce by at least 0.2 compared to (b) in Figure 2. The field curves graph of the optical system in low temperature is shown in Figure 7. The longitudinal spherical aberration in Figure 7 is 0.183 mm which is only 0.044 mm in Figure 3b. The degradation of the image quality is caused primarily by spherical aberration. The wavefront analysis results of the optical system in low temperature are shown in Table 4. Comparing the results of the wavefront analysis in Table 3 with those in Table 4, there is a significant degradation in the imaging quality of the system at low temperature.

3. Materials and Methods

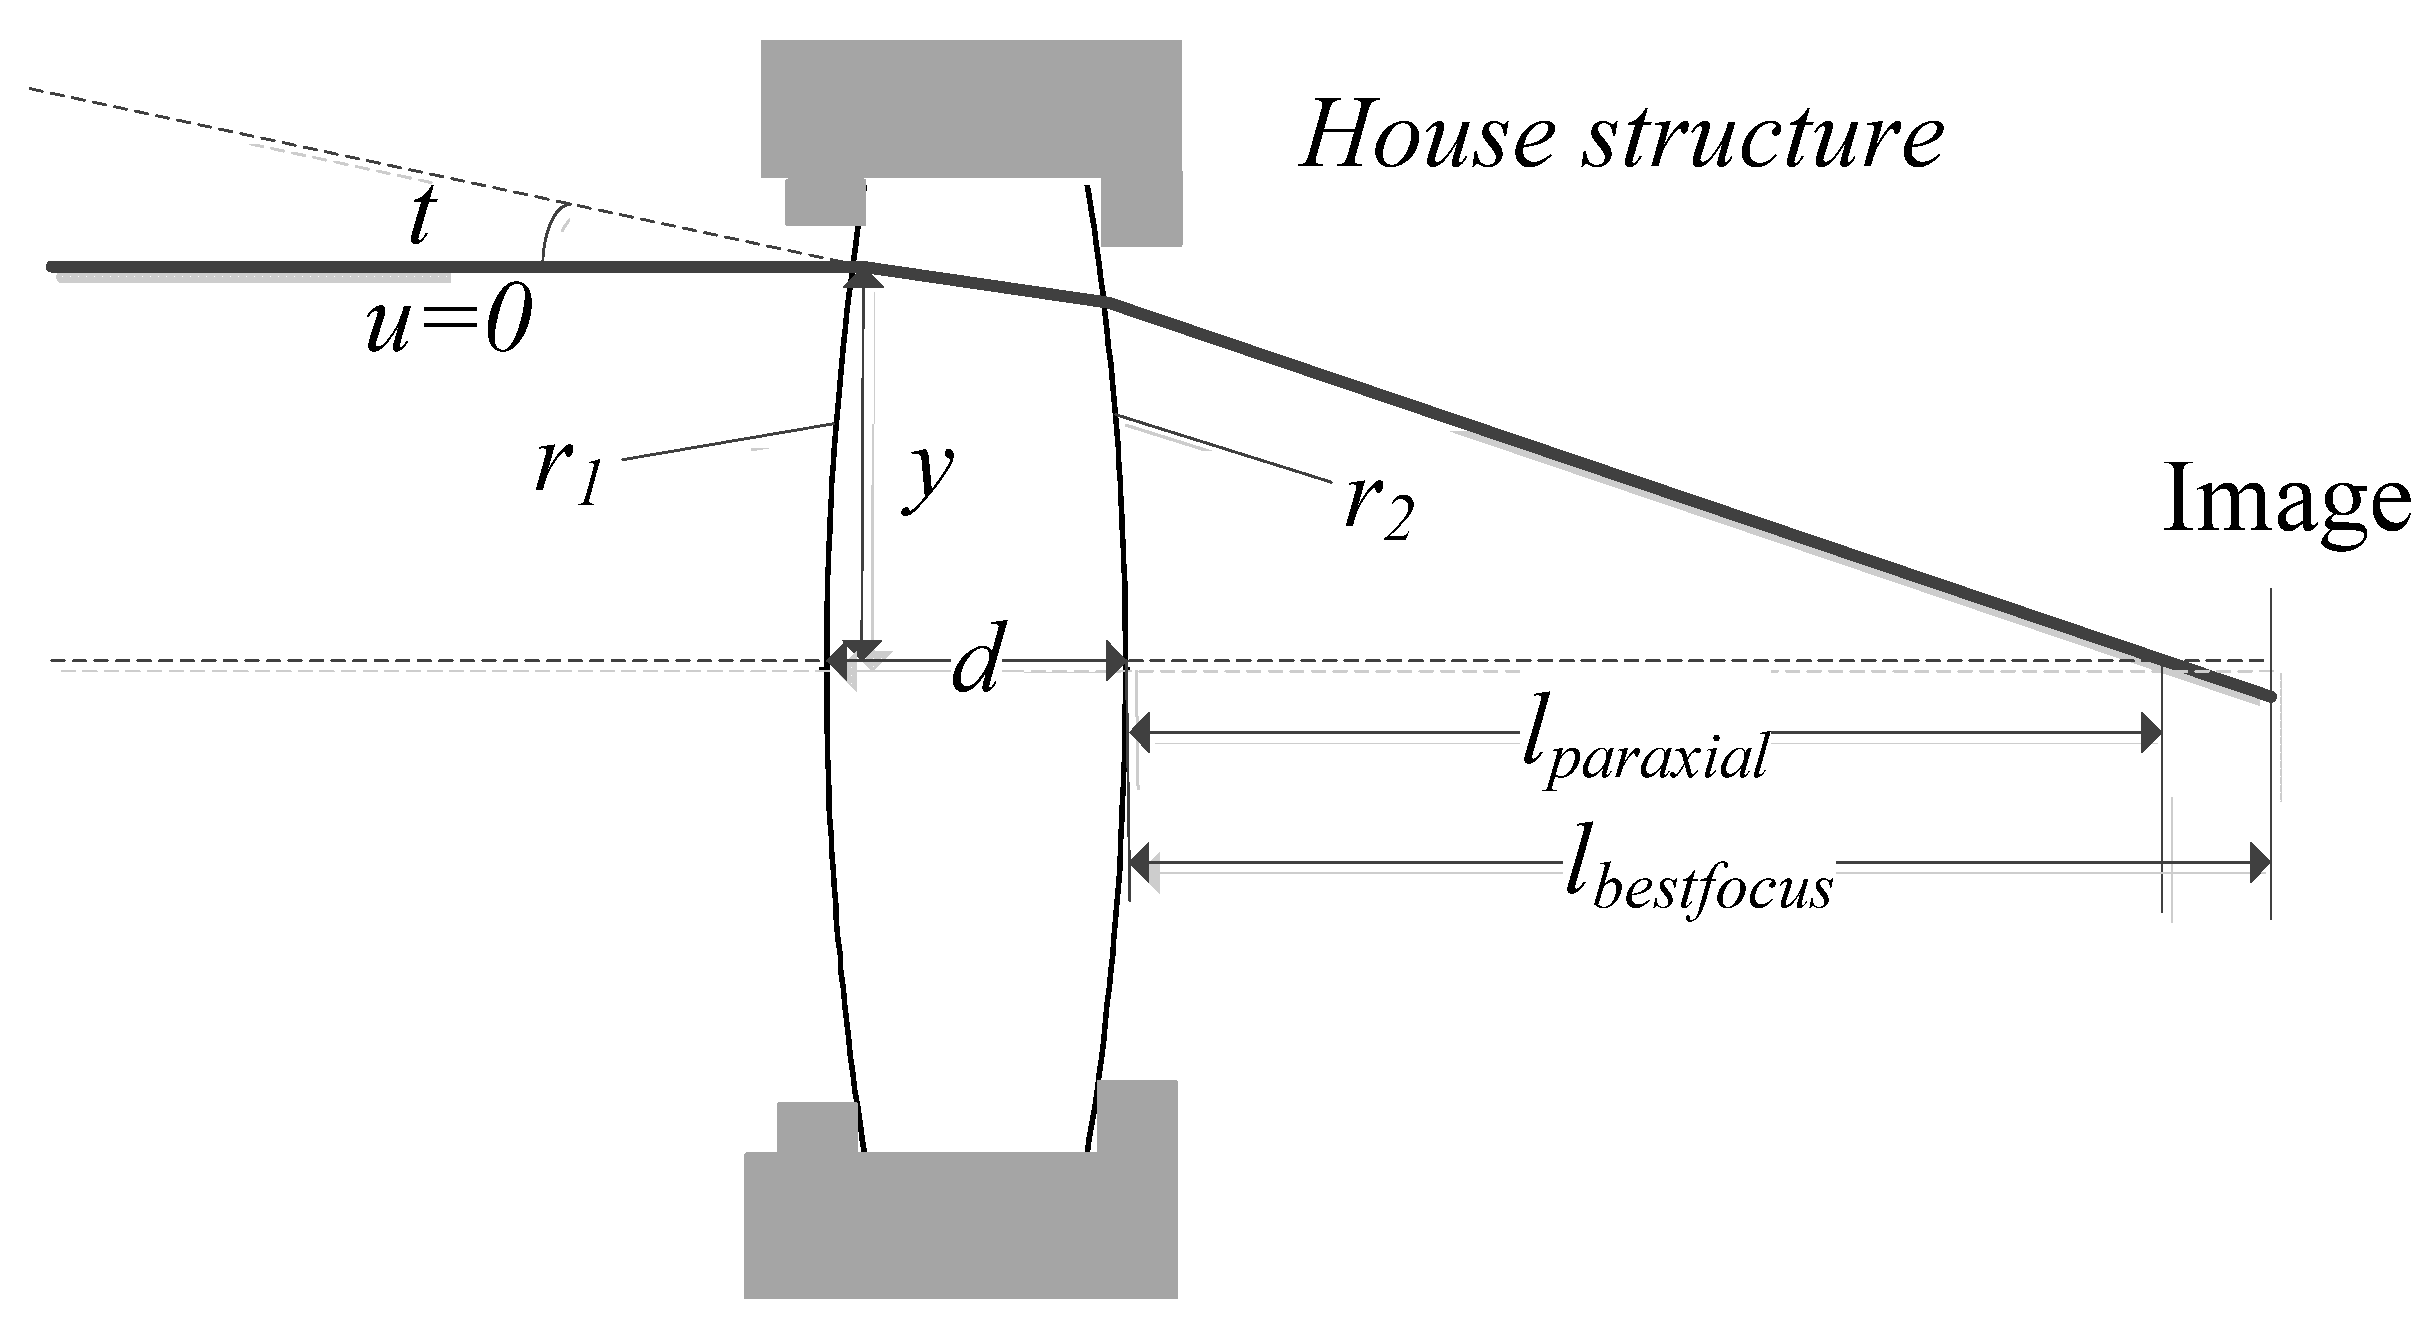
3.1. Optical Optimizability Based on Wavefront Aberration Theory

A single lens with a fixed glass material is shown in Figure 8. To simplify the analysis process, a lens with a fixed focal length at room temperature is only required to have good image quality on the axis with a monochromatic light. At the same time, the optical system wave aberration at high, low, and room temperatures renders the minimized RMS value to the optimization objective. In Figure 8, r 1 , r 2 , and d represent the shape information; t , u , and y represent, respectively, normal angle, aperture angle, and ray height of ray tracing parameters on each surface; and l p a r a x i a l and l b e s t f o c u s represent, respectively, ideal focus and best focus position.
1 f r o o m = ( n r o o m 1 ) ( 1 r 1 r o o m 1 r 2 r o o m ) + ( n r o o m 1 ) 2 d r o o m n r o o m r 1 r o o m r 2 r o o m
In Equation (1), f and n represent the focus length in image side and refractive index, respectively. Room, high, and low temperatures are indicated by the subscripts room, high, and low, respectively. For room temperature, the optimization objective requires that the focal length is a constant value.
{ d h i g h = d r o o m ( 1 + a g × Δ T h i g h ) r 1 h i g h = r 1 r o o m ( 1 + a g × Δ T h i g h ) r 2 h i g h = r 2 r o o m ( 1 + a g × Δ T h i g h ) n h i g h = n r o o m + d n d T × Δ T h i g h
{ d l o w = d r o o m ( 1 + a g × Δ T l o w ) + Δ d r 1 l o w = r 1 r o o m ( 1 + a g × Δ T l o w ) + Δ r 1 r 2 l o w = r 2 r o o m ( 1 + a g × Δ T l o w ) + Δ r 2 n l o w = n r o o m + d n d T × Δ T l o w
When the system temperature drops, assuming that the thermal expansion coefficient of optical glass is less than that of mechanical materials, because thermal stress on the lens at low temperature, the two surfaces are deformed and can be characterized in a Zernike form. The system parameters are shown in Equations (2) and (3), where α g , d n / d T , and Δ T represent, respectively, thermal expansion coefficient of optical glass, index temperature drift, and temperature change. The change in radius and thickness due to thermal stress are denoted by Δ r 1 , Δ r 2 , and Δ d .
{ Δ W r o o m ( x , y ) = W r o o m 020 ( x 2 + y 2 ) + W r o o m 040 ( x 2 + y 2 ) 2 Δ W l o w ( x , y ) = W l o w 020 ( x 2 + y 2 ) + W l o w 040 ( x 2 + y 2 ) 2 Δ W h i g h ( x , y ) = W h i g h 020 ( x 2 + y 2 ) + W h i g h 040 ( x 2 + y 2 ) 2
{ W r o o m 020 = ( l b e s t f o c u s l p a r a x i a l ) 2 f 2 r o o m W l o w 020 = ( l b e s t f o c u s l o w l p a r a x i a l l o w ) 2 f 2 l o w W h i g h 020 = ( l b e s t f o c u s h i g h l p a r a x i a l h i g h ) 2 f 2 h i g h
{ W r o o m 040 = 1 8 i = 1 2 S r o o m i = 1 8 i = 1 2 n r o o m i 2 i r o o m i 2 y r o o m i [ u r o o m i n r o o m i u r o o m i n r o o m i ] W l o w 040 = 1 8 i = 1 2 S l o w i = 1 8 i = 1 2 n l o w i 2 i l o w i 2 y l o w i [ u l o w i n l o w i u l o w i n l o w i ] W h i g h 040 = 1 8 i = 1 2 S h i g h i = 1 8 i = 1 2 n h i g h i 2 i h i g h i 2 y h i g h i [ u h i g h i n h i g h i u h i g h i n h i g h i ]
The system wavefront aberration is denoted by Δ W , as shown in Equation (4), where x and y represent the position of any point at out-pupil. The aberration coefficient for spherical aberration and defocus aberration is expressed as W 040 and W 020 , as shown in Equations (5) and (6), respectively. The first seidel coefficient of each surface is expressed by S i .
For this lens, the wavefront aberration at out-pupil position is primarily derived from spherical aberration and defocus. The objective is to ensure that the system has the smallest residual aberration at all three temperatures while maintaining the focal length at normal temperature. From Equations (1) and (4), it is clear that the system can be optimized with 3 variables and 4 aberration functions. The number of equations is more than the number of optimizable variables, which is an overdetermined equation. The best approximate solution for the three variables can be solved by the least squares method. This shows that the system can be optimized to achieve clear imaging quality over all operating temperatures.
This is not necessary for actual design and this example is only to illustrate optical optimizability. Due to the optical design software, the optical designer only needs to assign the surface to the Zernike coefficients, and the optical software will optimize for different temperature states to ensure that the system has suitable image quality over all operating temperatures. The essence of a thermal-induced surface change is the deformation of the original spherical surface into an aspherical surface that is expressed in the form of Zernike. The deformation of a surface near an aperture causes more aperture-related aberrations, which can be optimized by thickness and spacing, while the deformation of a surface near an image surface causes more view-related aberrations, which can be optimized by radius and incidence height at the surface.

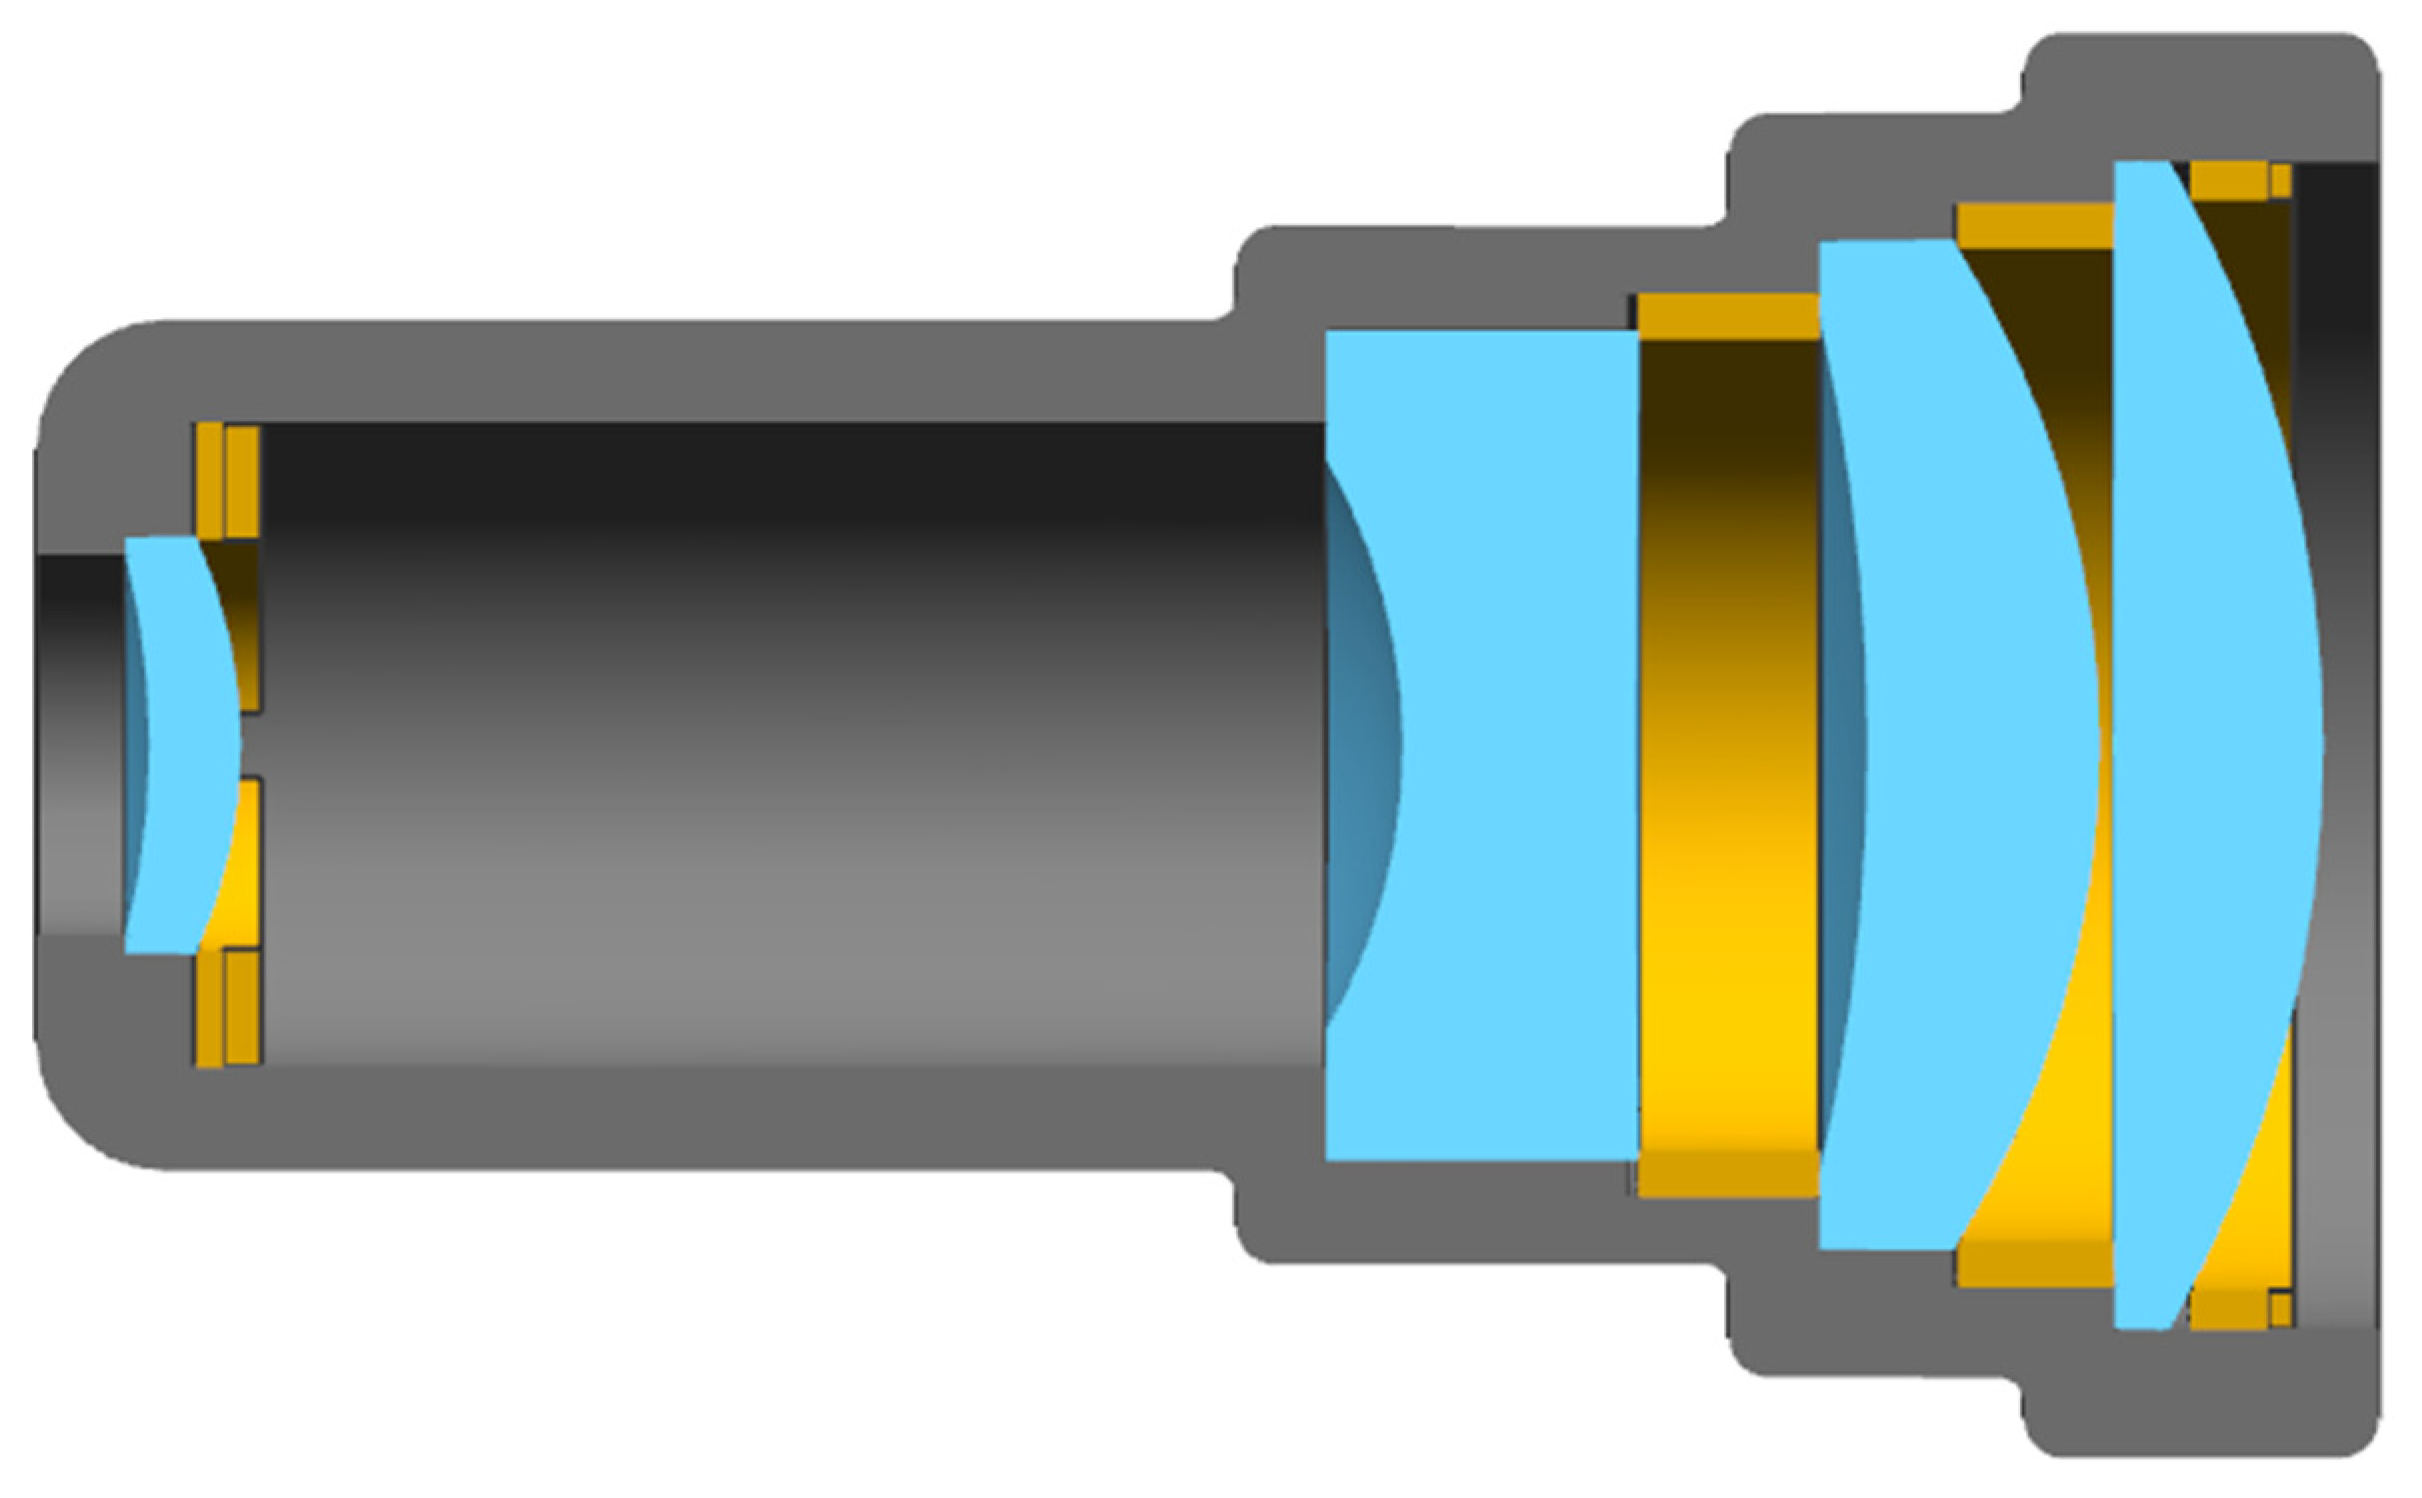
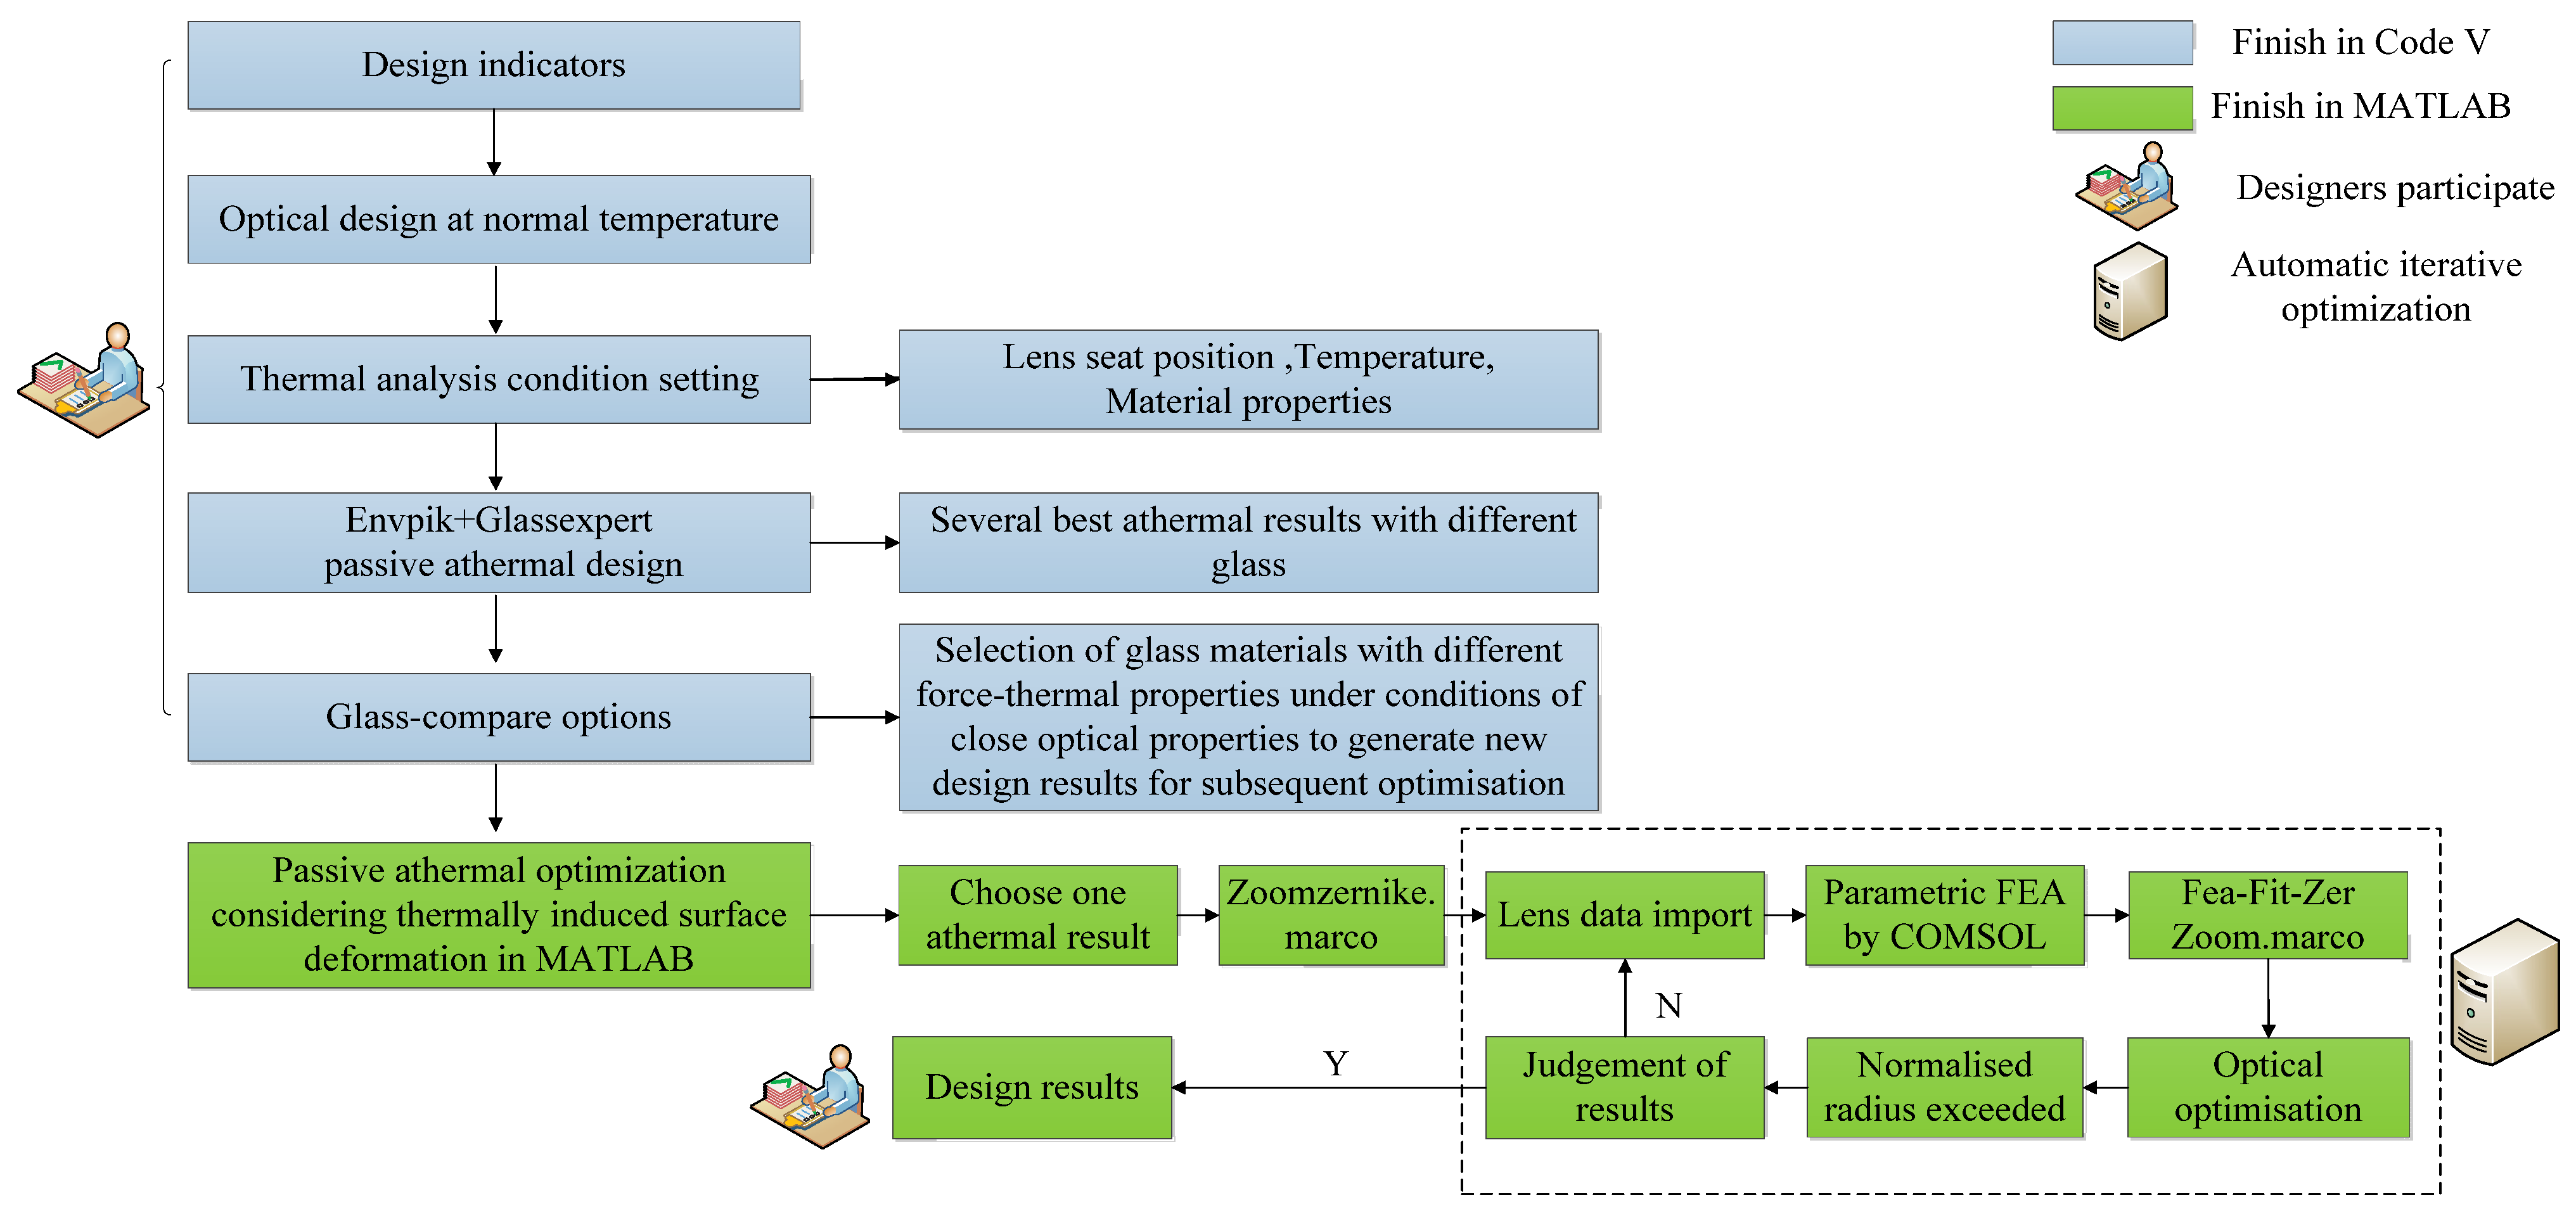
3.2. Process of Passive Athermal Optical Design Method while Considering Thermal-Induced Surface Deformation
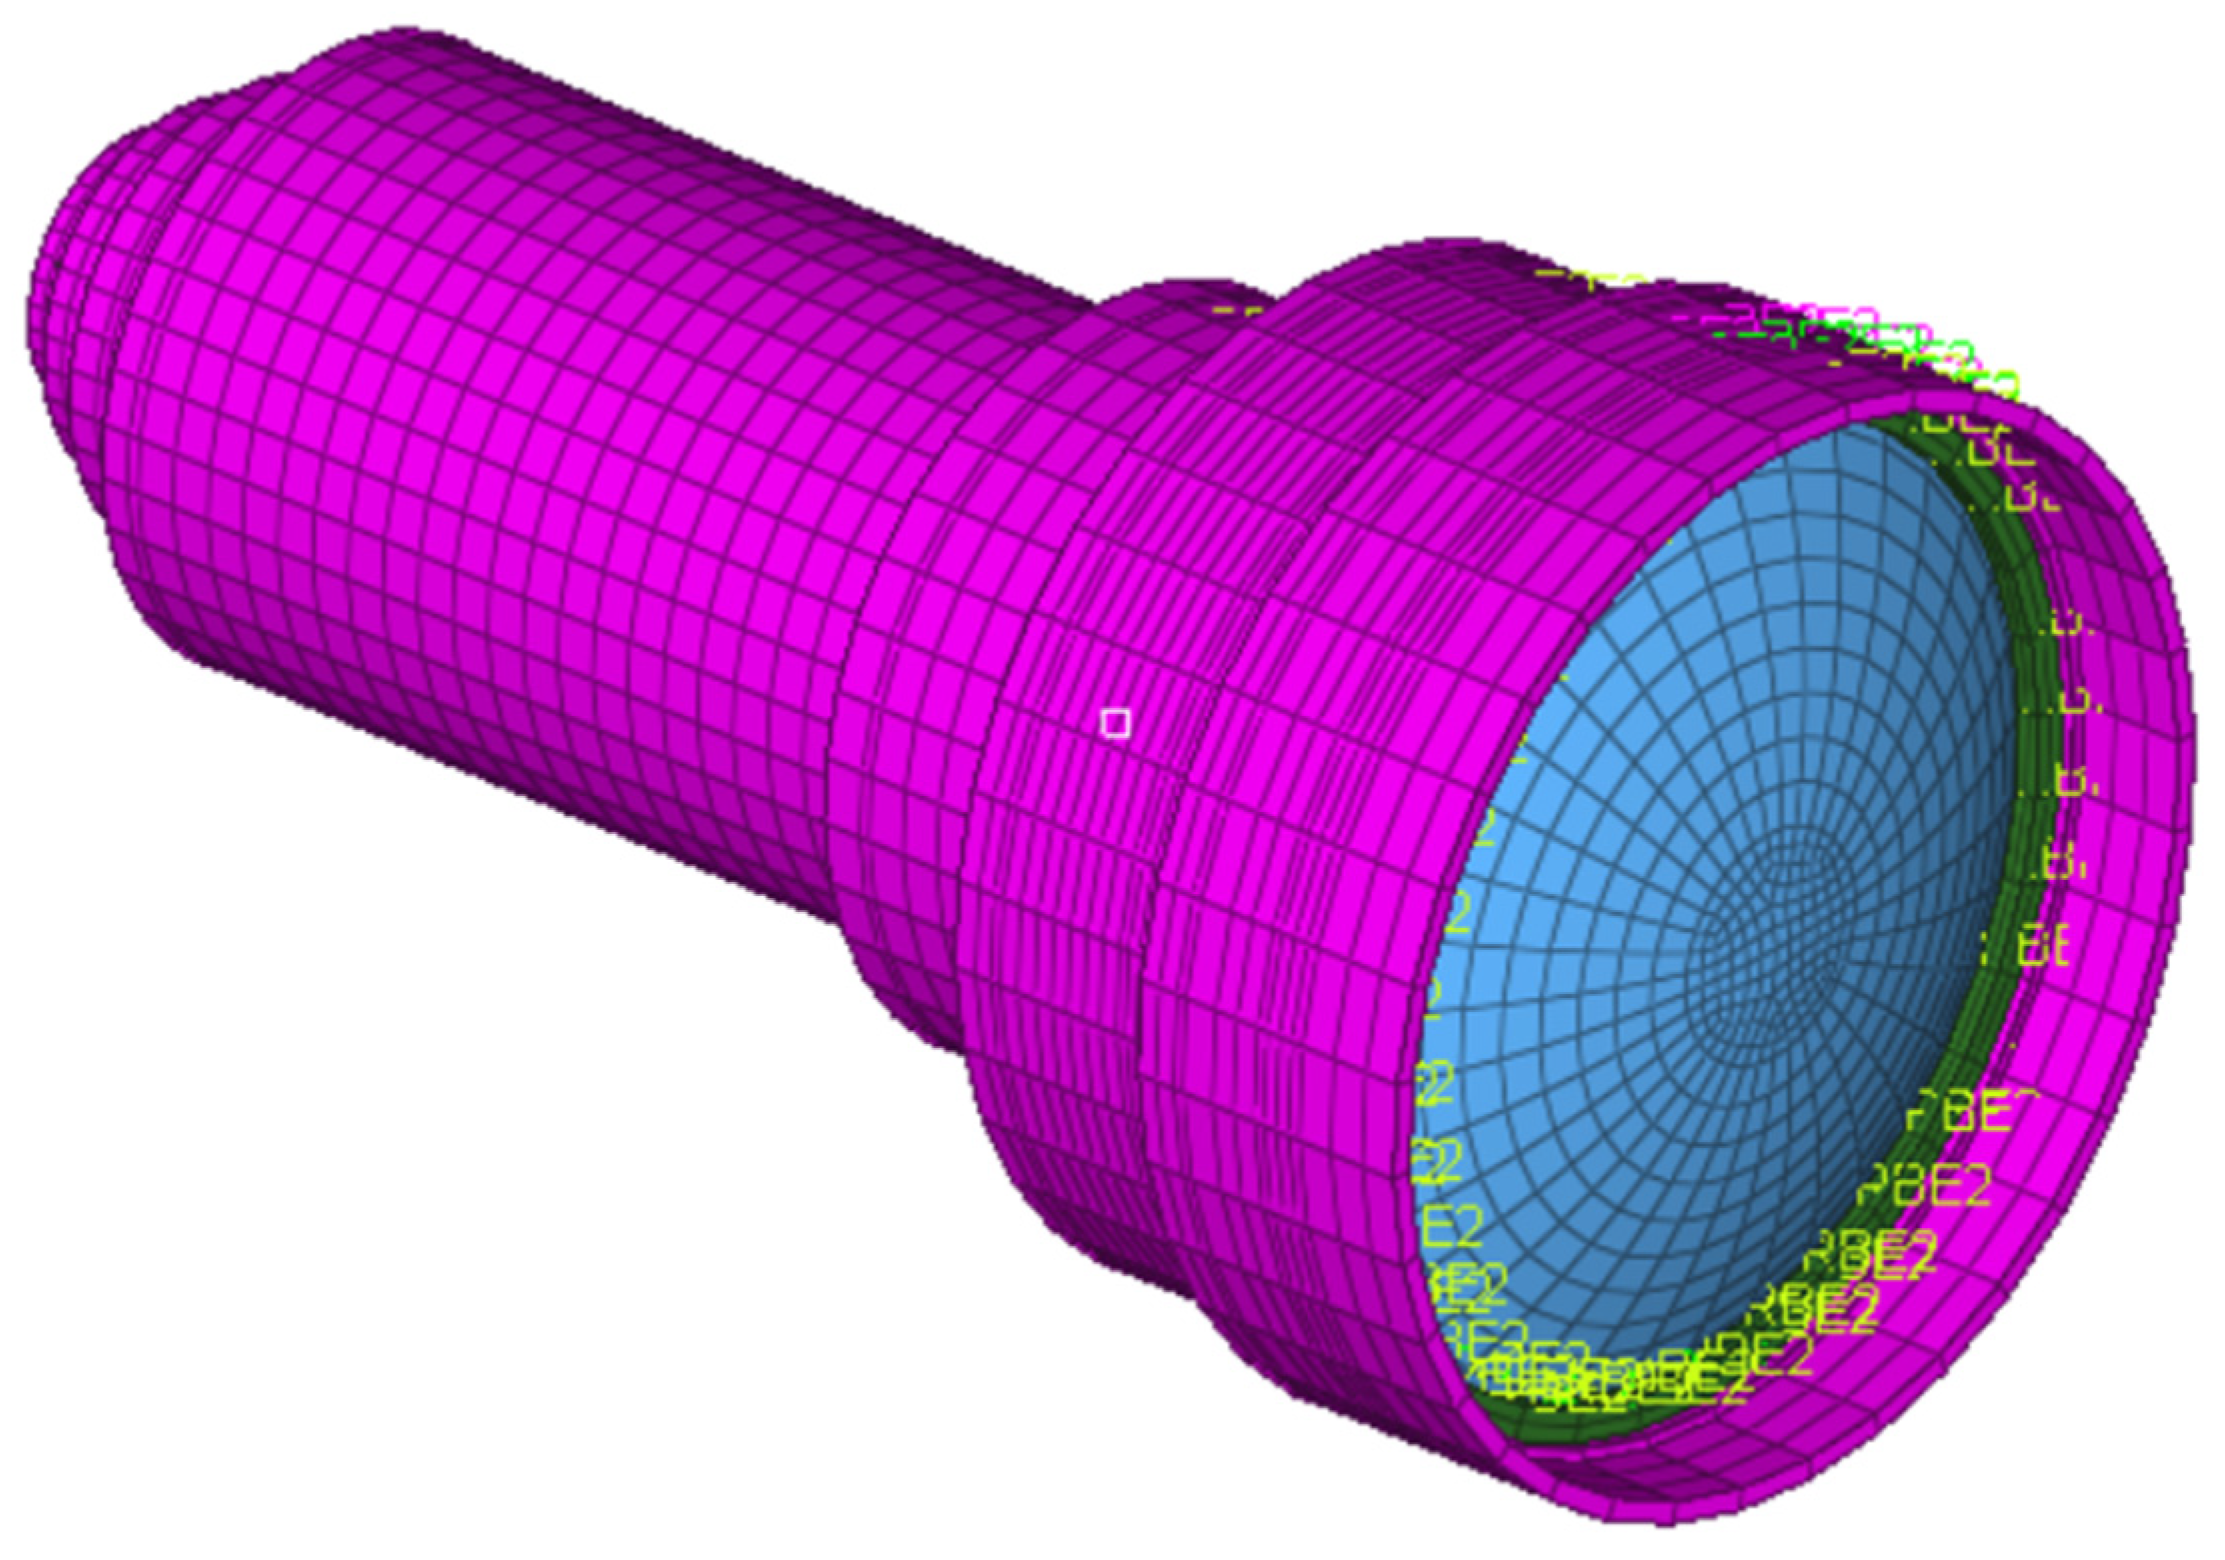
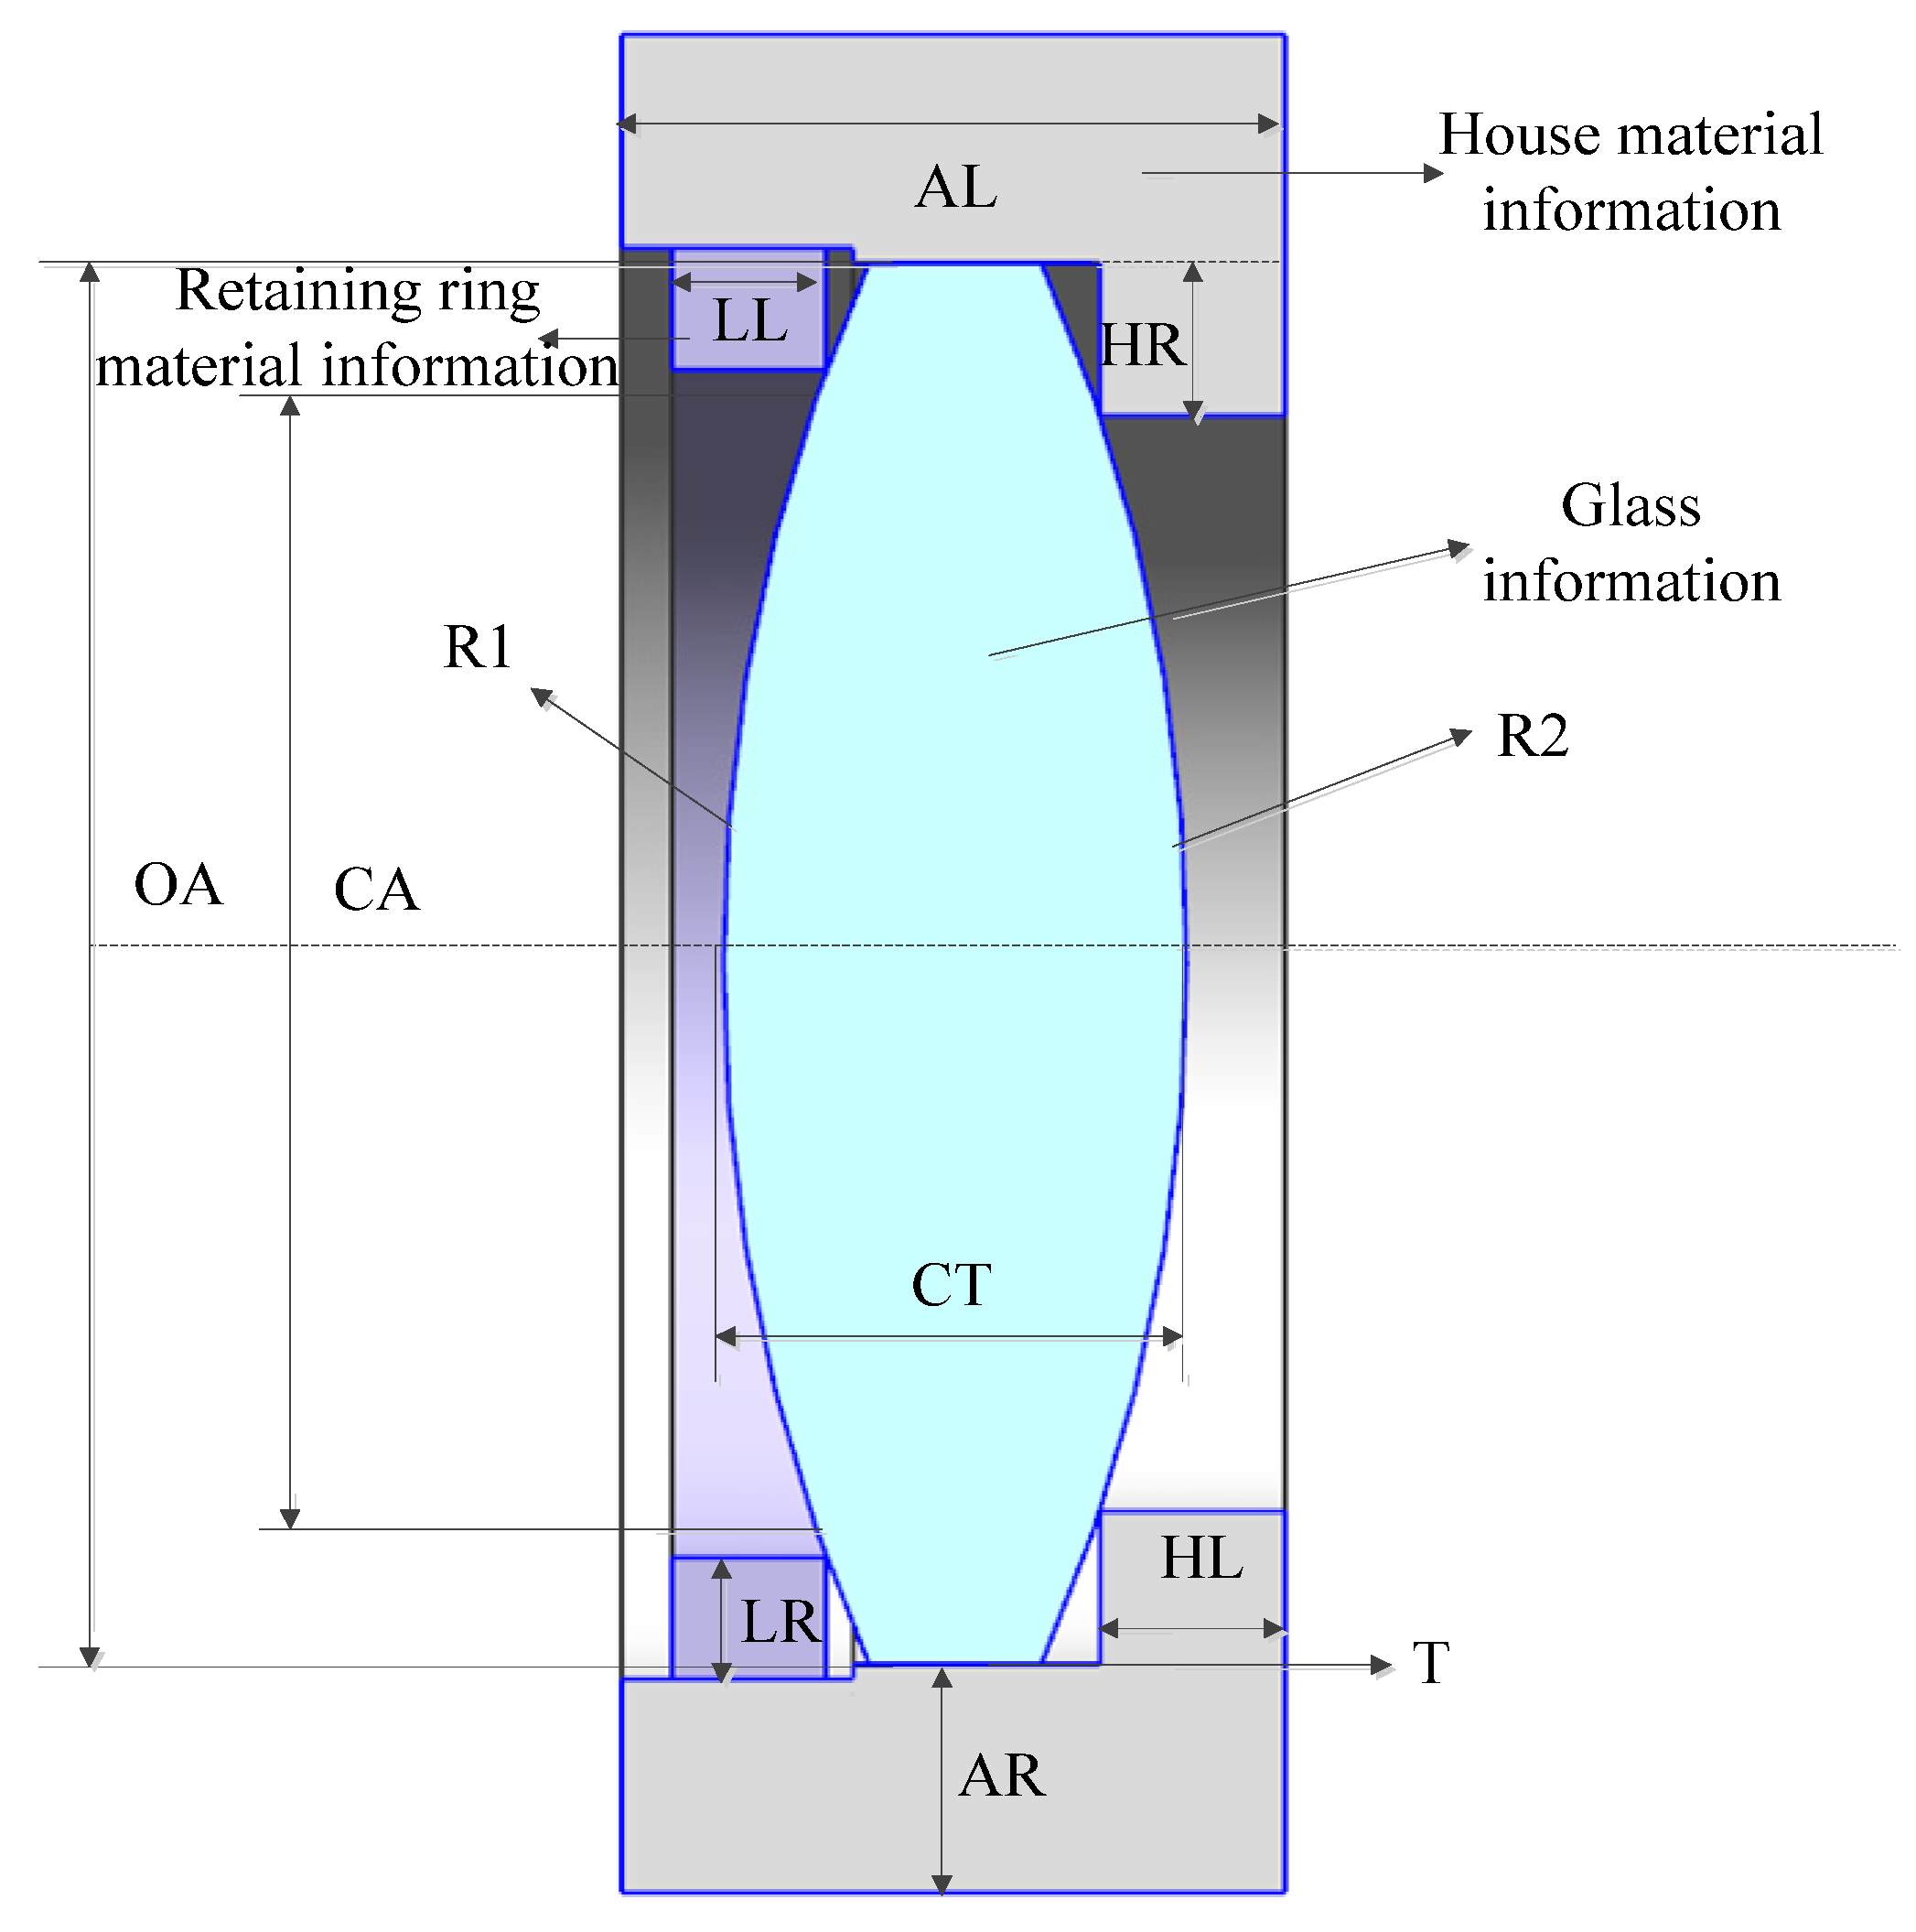
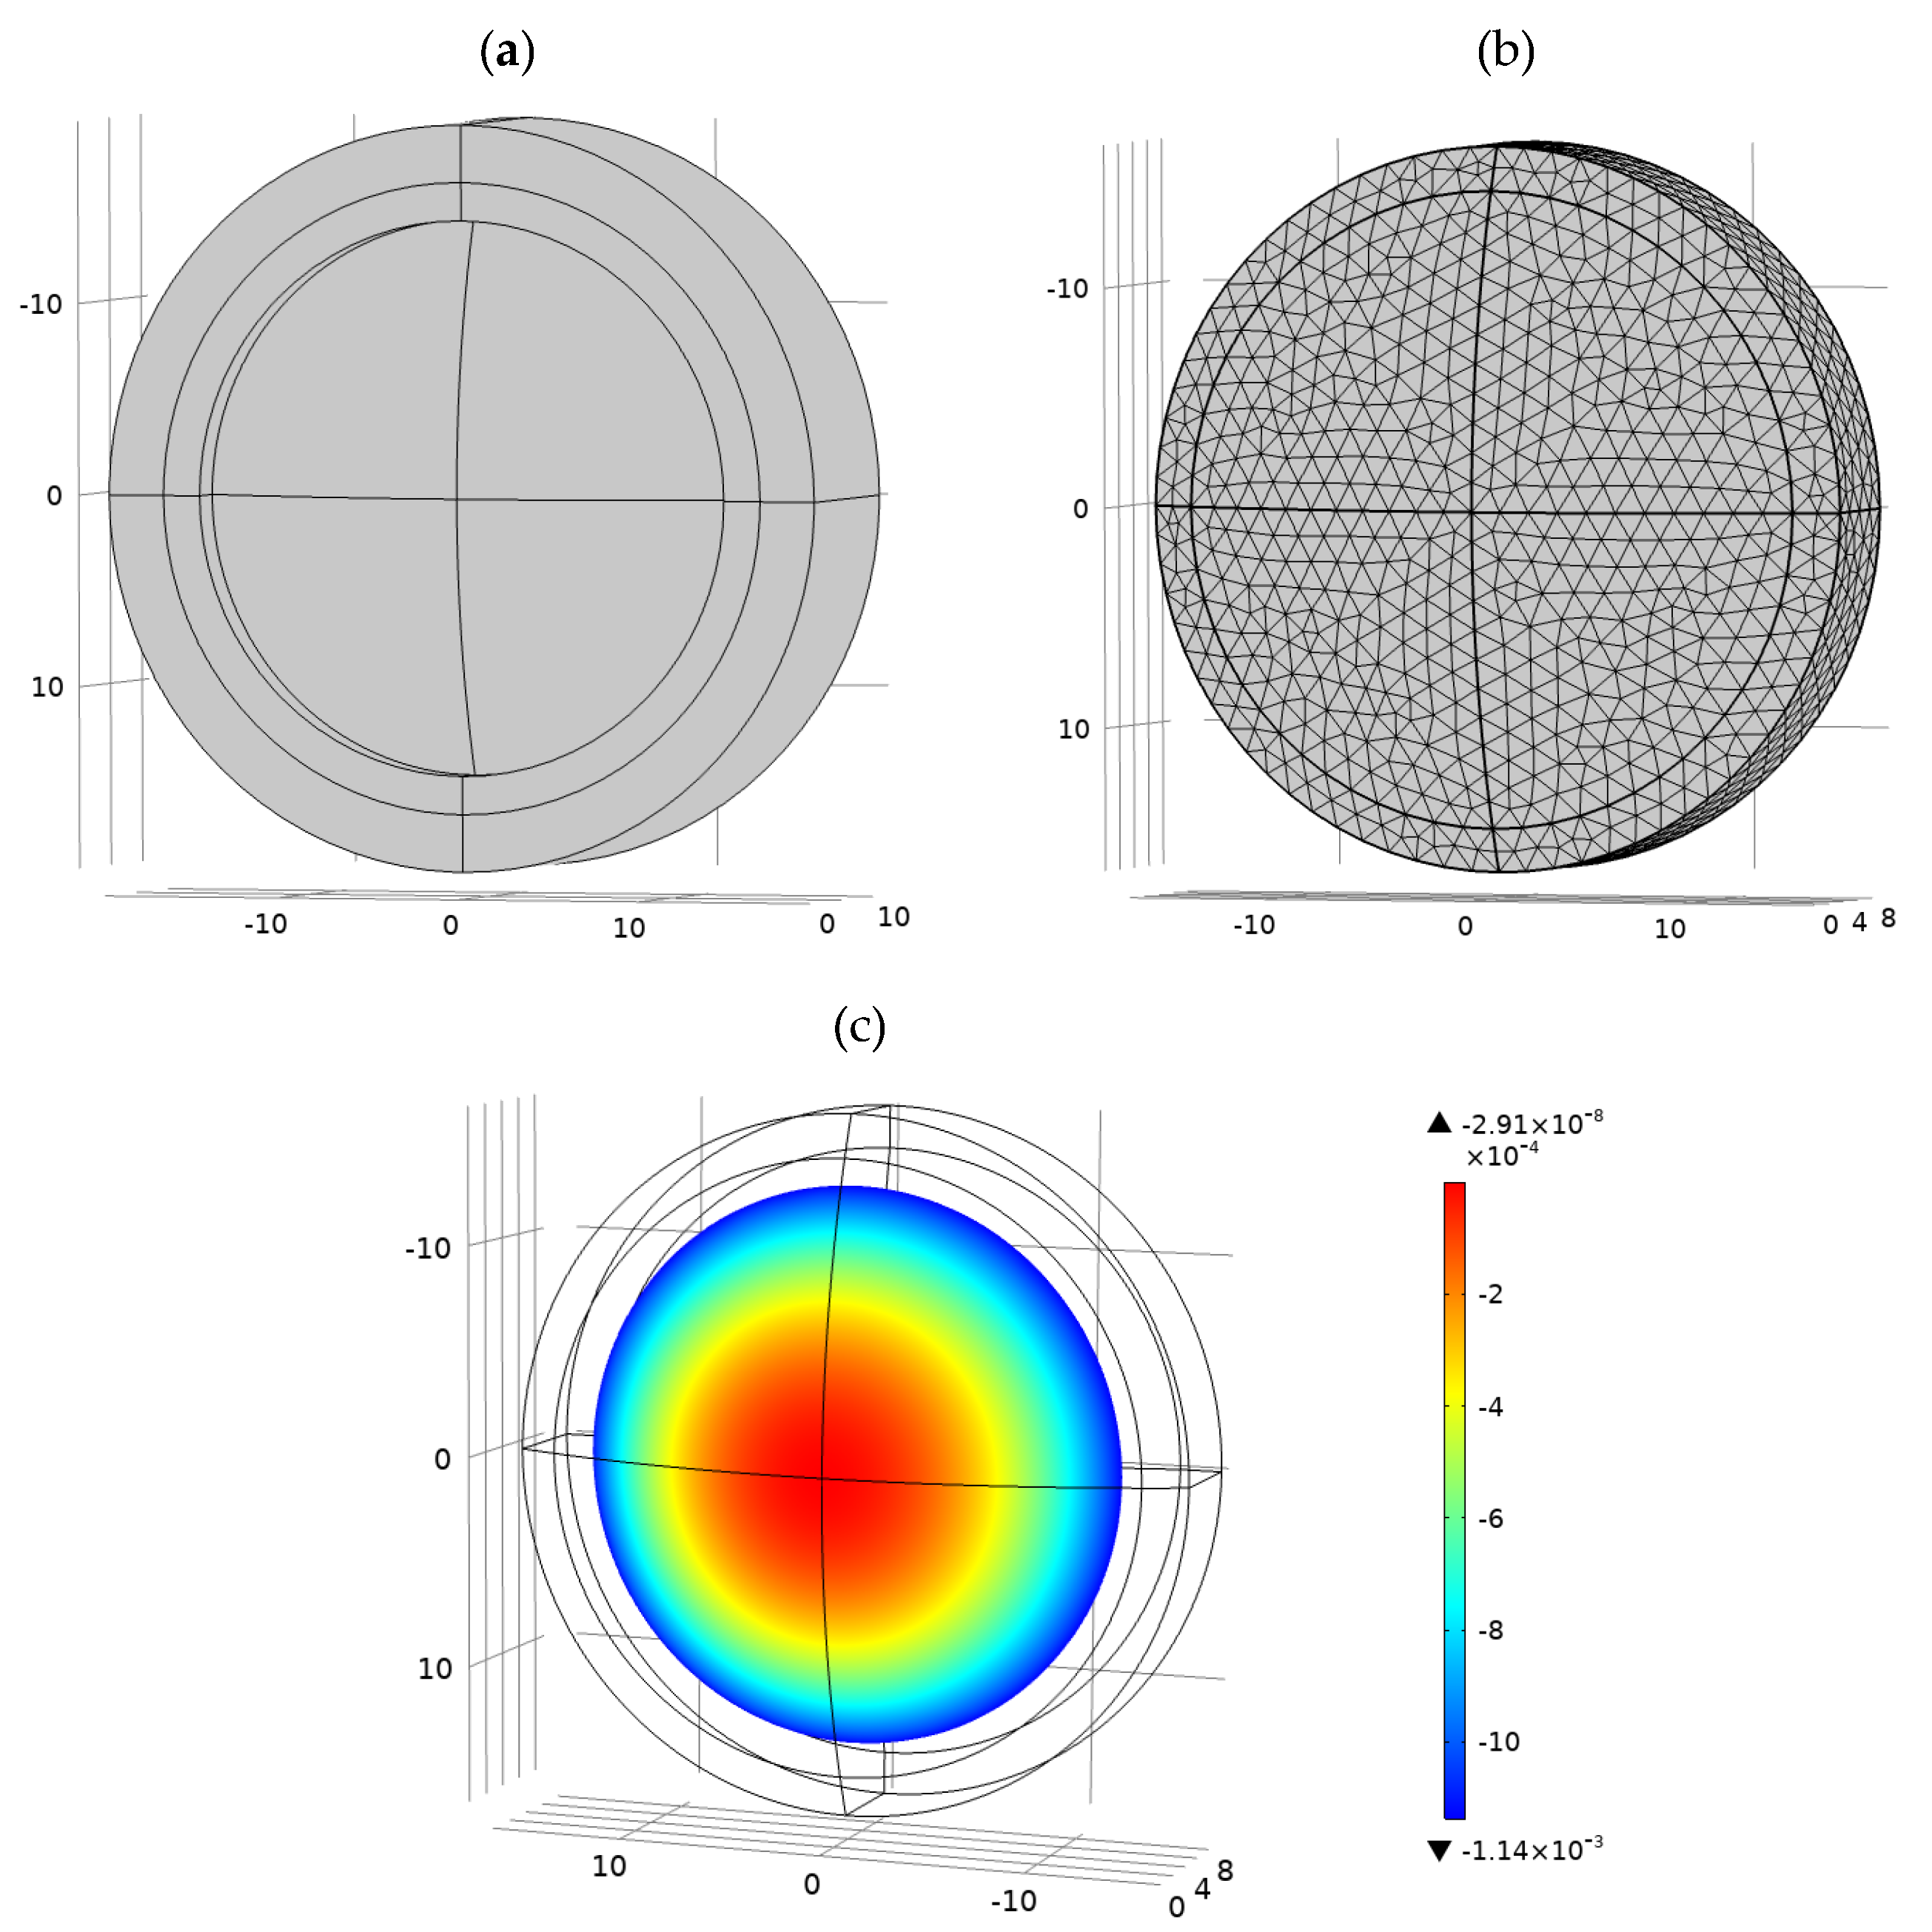
The flow chart of the passive athermal optical design method while considering thermal-induced surface deformation is shown in Figure 9. Initially, the first four design processes in Figure 9 are conventional passive athermal optical design methods. First, optical designers confirm design specifications and operating temperature. Second, they complete the optimization of the optical design at room temperature. Third, they set the lens thermal analysis conditions. Fourth, they generate several passive athermal design results without consideration of thermal-induced surface deformation through Envpik and Glassexpert macros of Code V.
Then, the optical designer needs to select the best passive athermal design results for the next stage of optimization, rather than finishing a similar Glassexpert traversal linkage optimization for all optical materials. The main reasons for this are the following: (1) it takes a long time for each parametric FEA, which would be longer if the traversal searches glass. (2) The conventional passive athermal design results provide some initial structures, and the final optimized results are consistent with the glass selection for the initial structure. It is feasible to carry out subsequent linkage optimization designs based on the best previous passive athermal design results.
Among the glass materials, some have nearly identical optical and thermo-optical properties, such as index, abbe number, index temperature drift, and thermal expansion coefficient, but they differ in their mechanical properties, such as Young’s modulus and Poisson’s ratio. Materials such as ZF4 and HZF4A in the CDGM glass library have these properties. Though the previous passive athermal design results of these two types of glass are approximate, there are differences between the two results when considering thermal-induced surface deformation. For these types of glass, we self-programmed a glass-compare macro in optical design software to list glass materials with similar optical properties but different mechanical properties, providing a different initial structure for subsequent automatic iterative optimization.
After that, the optical designers used MATLAB to link Code V and COMSOL for optical automatic iterative optimization for the consideration of thermal-induced surface deformation. They selected one result from the previous passive athermal design results as an initial structure and set the Zernike coefficients in multiple configurations by a self-programmed Zoomzernike macro, which converts the optical surface type to Standard Zernike type or Fringe Zernike type. Additionally, the normalized radius was assigned a value equal to the outside diameter of the lens.
During each automatic iterative optimization when considering thermal-induced surface deformation, the lens data, the optical machine material data, and the thermal analysis conditions were imported into MATLAB from optical design software and glass library. MATLAB assigns the data to parametric FEA and the thermal-induced stress deformation results of every optical surface are stored by number. The Fea-Fit-Zer Zoom macro is called up in MATLAB to transform the FEA results to Zernike coefficients. The optical design optimization function is called up in MATLAB and it is recommended that a single optimization is performed more than 50 times to ensure that the system is optimized to a local optimal solution. During the optimization process, the aperture of the lens may change. After each round of optimization, it is necessary to check whether the aperture of the lens exceeds the Zernike normalized radius; if so, it needs to be re-assigned, otherwise the Zernike coefficients will be inaccurate. During each automatic iteration of optimization, the original Zernike coefficients cannot characterize surface deformations of the optimized system; however, after several iterations of optimization, the value of Zernike coefficients stabilizes, and the optimization result is close to the true situation. The system is considered to be optimized when the difference between the error functions of the two optimizations is less than one. The program stores the design result after the final automatic iterative optimization so that designers can compare selections.
Compared to optical–mechanical–thermal integrated passive athermal design methods, we provide a passive athermal optical optimization method through which optical designers can reduce the deterioration of image quality caused by thermal-induced surface deformation.

3.3. Parametric FEA

In order to realize optical optimization through multiple iterations to eliminate the effects of thermal-induced surface deformation, each lens unit needs to be modeled parametrically based on lens data before each round of optical optimization, and the displacement of each node on the optical surface needs to be obtained after thermal stress deformation. An advantage of this approach is that an optical designer with basic knowledge of mechanics and thermodynamics can quickly and independently complete the optimized design, and the final iterative optimization is only performed through MATLAB with joint calls to FEA software and optical design software.
The parametric FEA model is composed of a single-lens assembly, and the lens is fixed by a retaining ring, including three parts: the lens, the retaining ring, and the lens chamber, as shown in Figure 10. In MATLAB, the optical design software and the glass material library are linked to obtain single-lens data, as shown in Table 5. The parameterized calculation methods of other component sizes based on optical data are shown in Table 5.
The parameter information is assigned to the preset FEA model through MATLAB. In the preset model, the thermal stress constraint conditions are set, and the maximum and minimum grid are automatically delineated according to the lens diameter. According to the set temperature, the node displacement results of each lens unit are obtained. The progress of parametric FEA is shown in Figure 11. The above process can be realized by calling optical design software and FEA software in MATLAB. This process requires to use the thermal-structure interaction modules and livelink for MATLAB modules in COMOSL. An optical designer only needs to load the generated optical design results into the MATLAB program to obtain the optical FEA results of each surface.

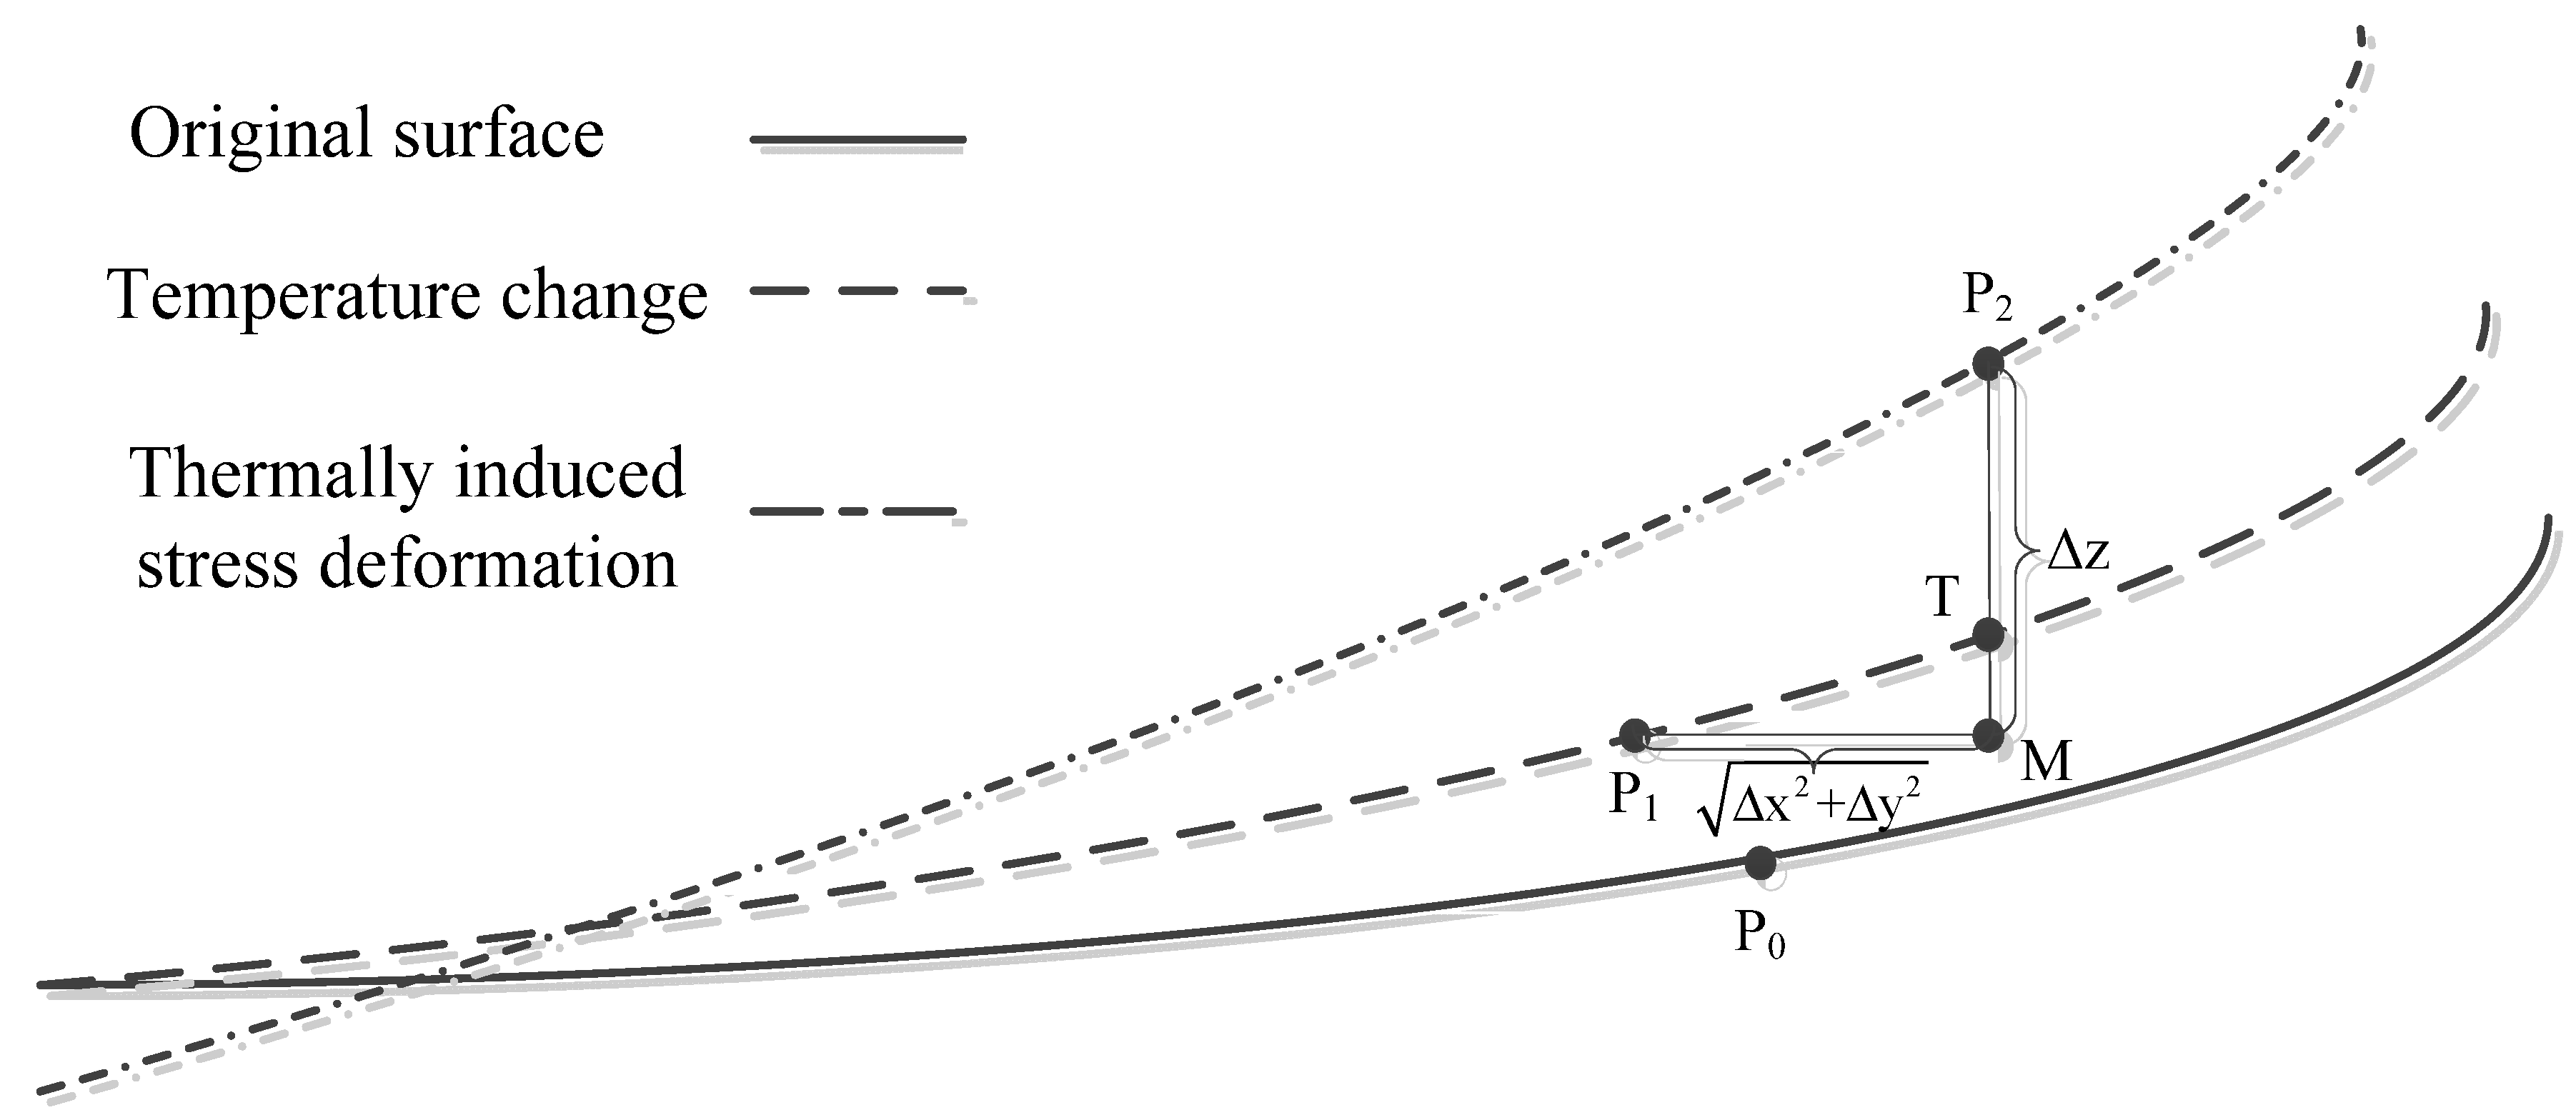
3.4. Transferring FEA Results to Zernike Surface Coefficients
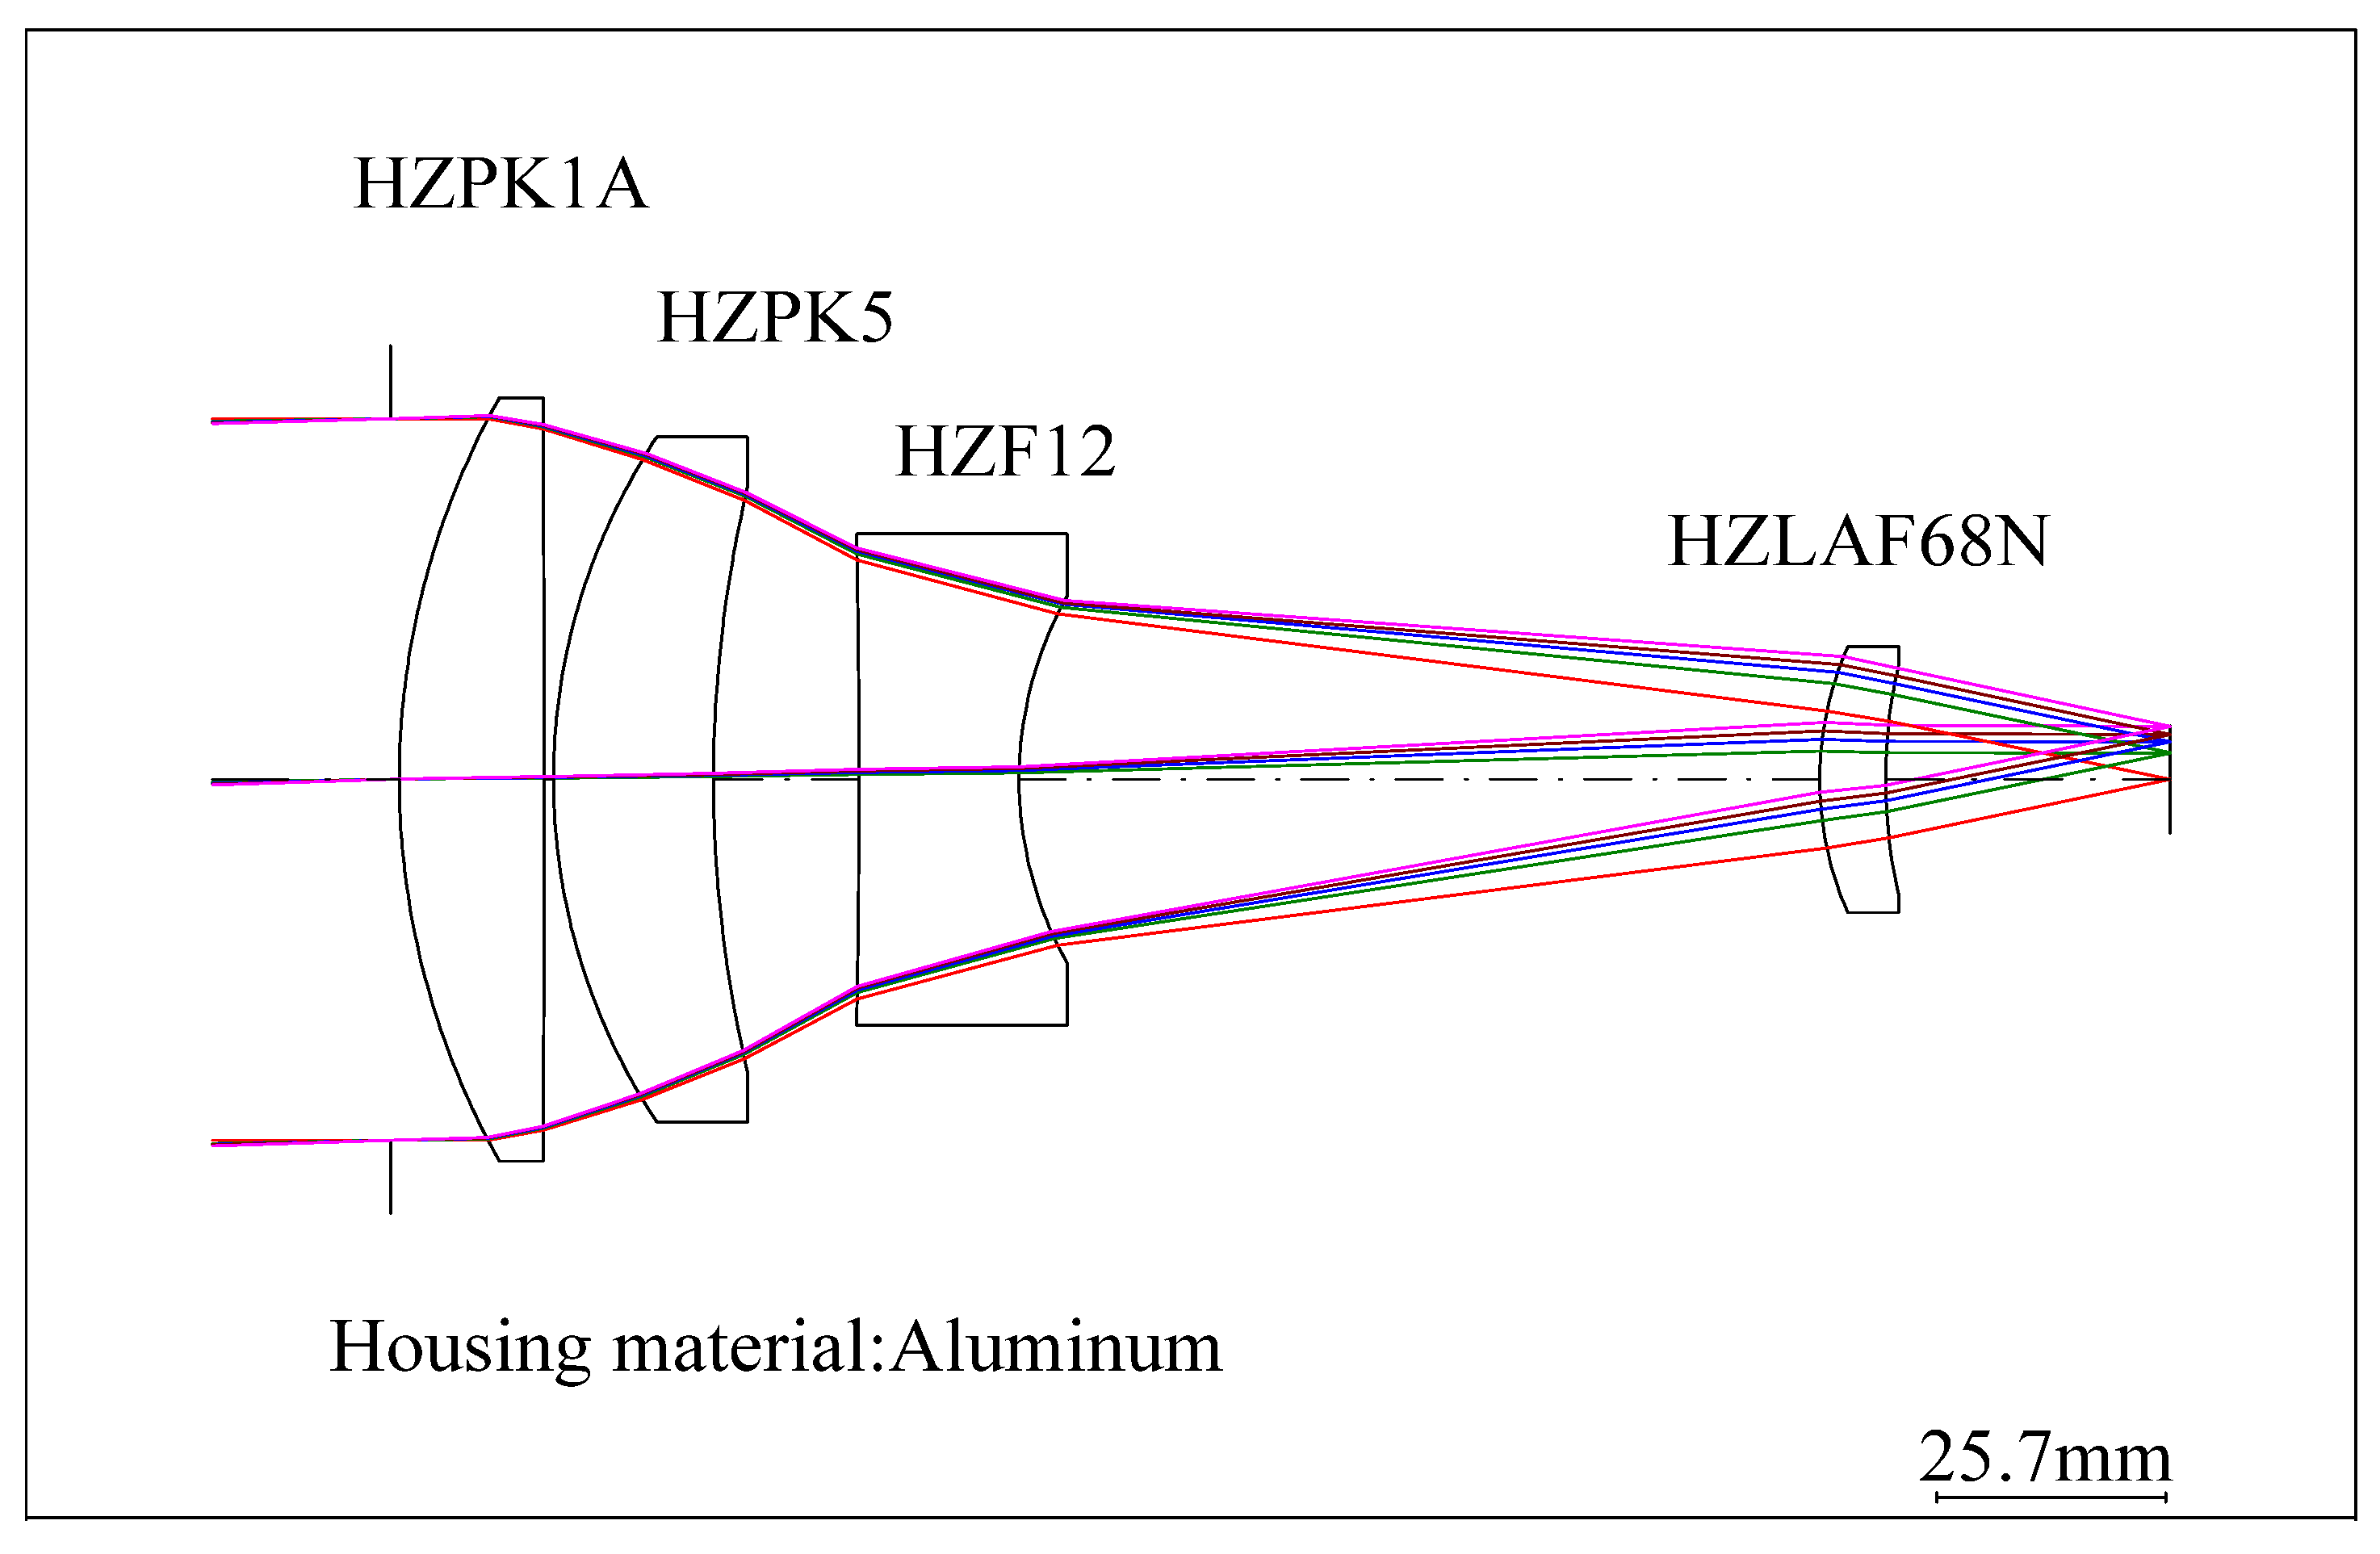
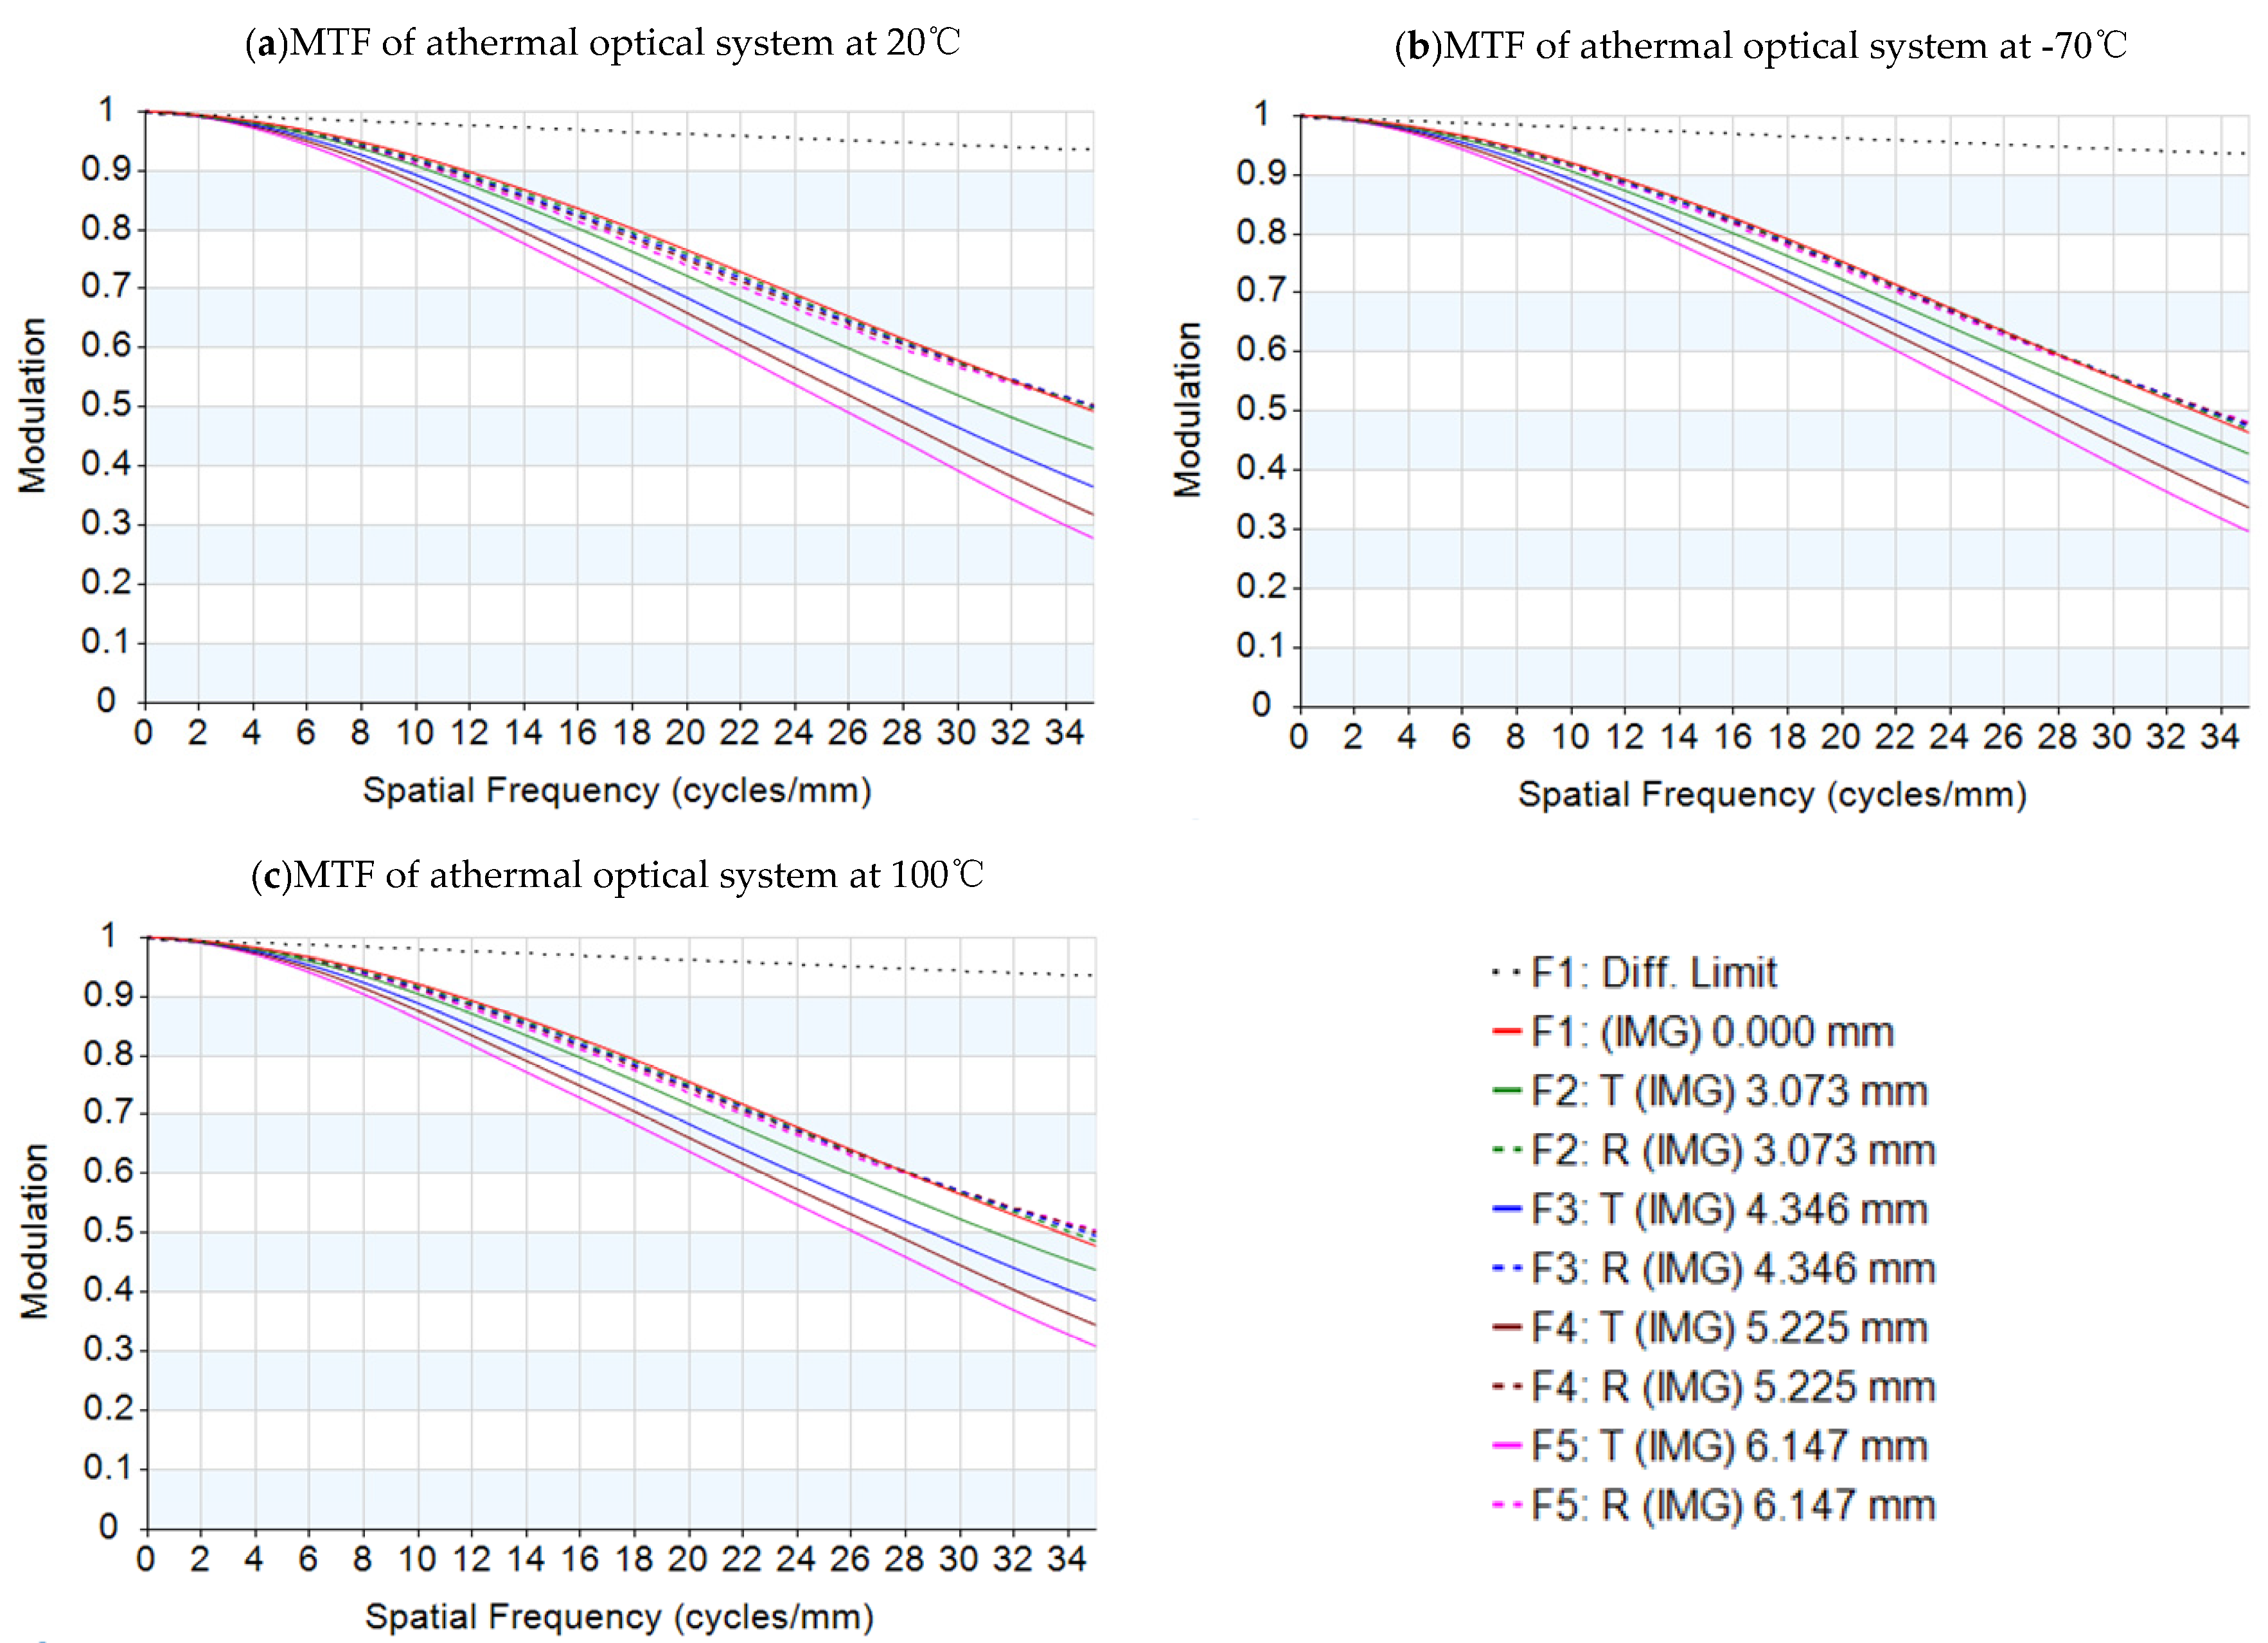
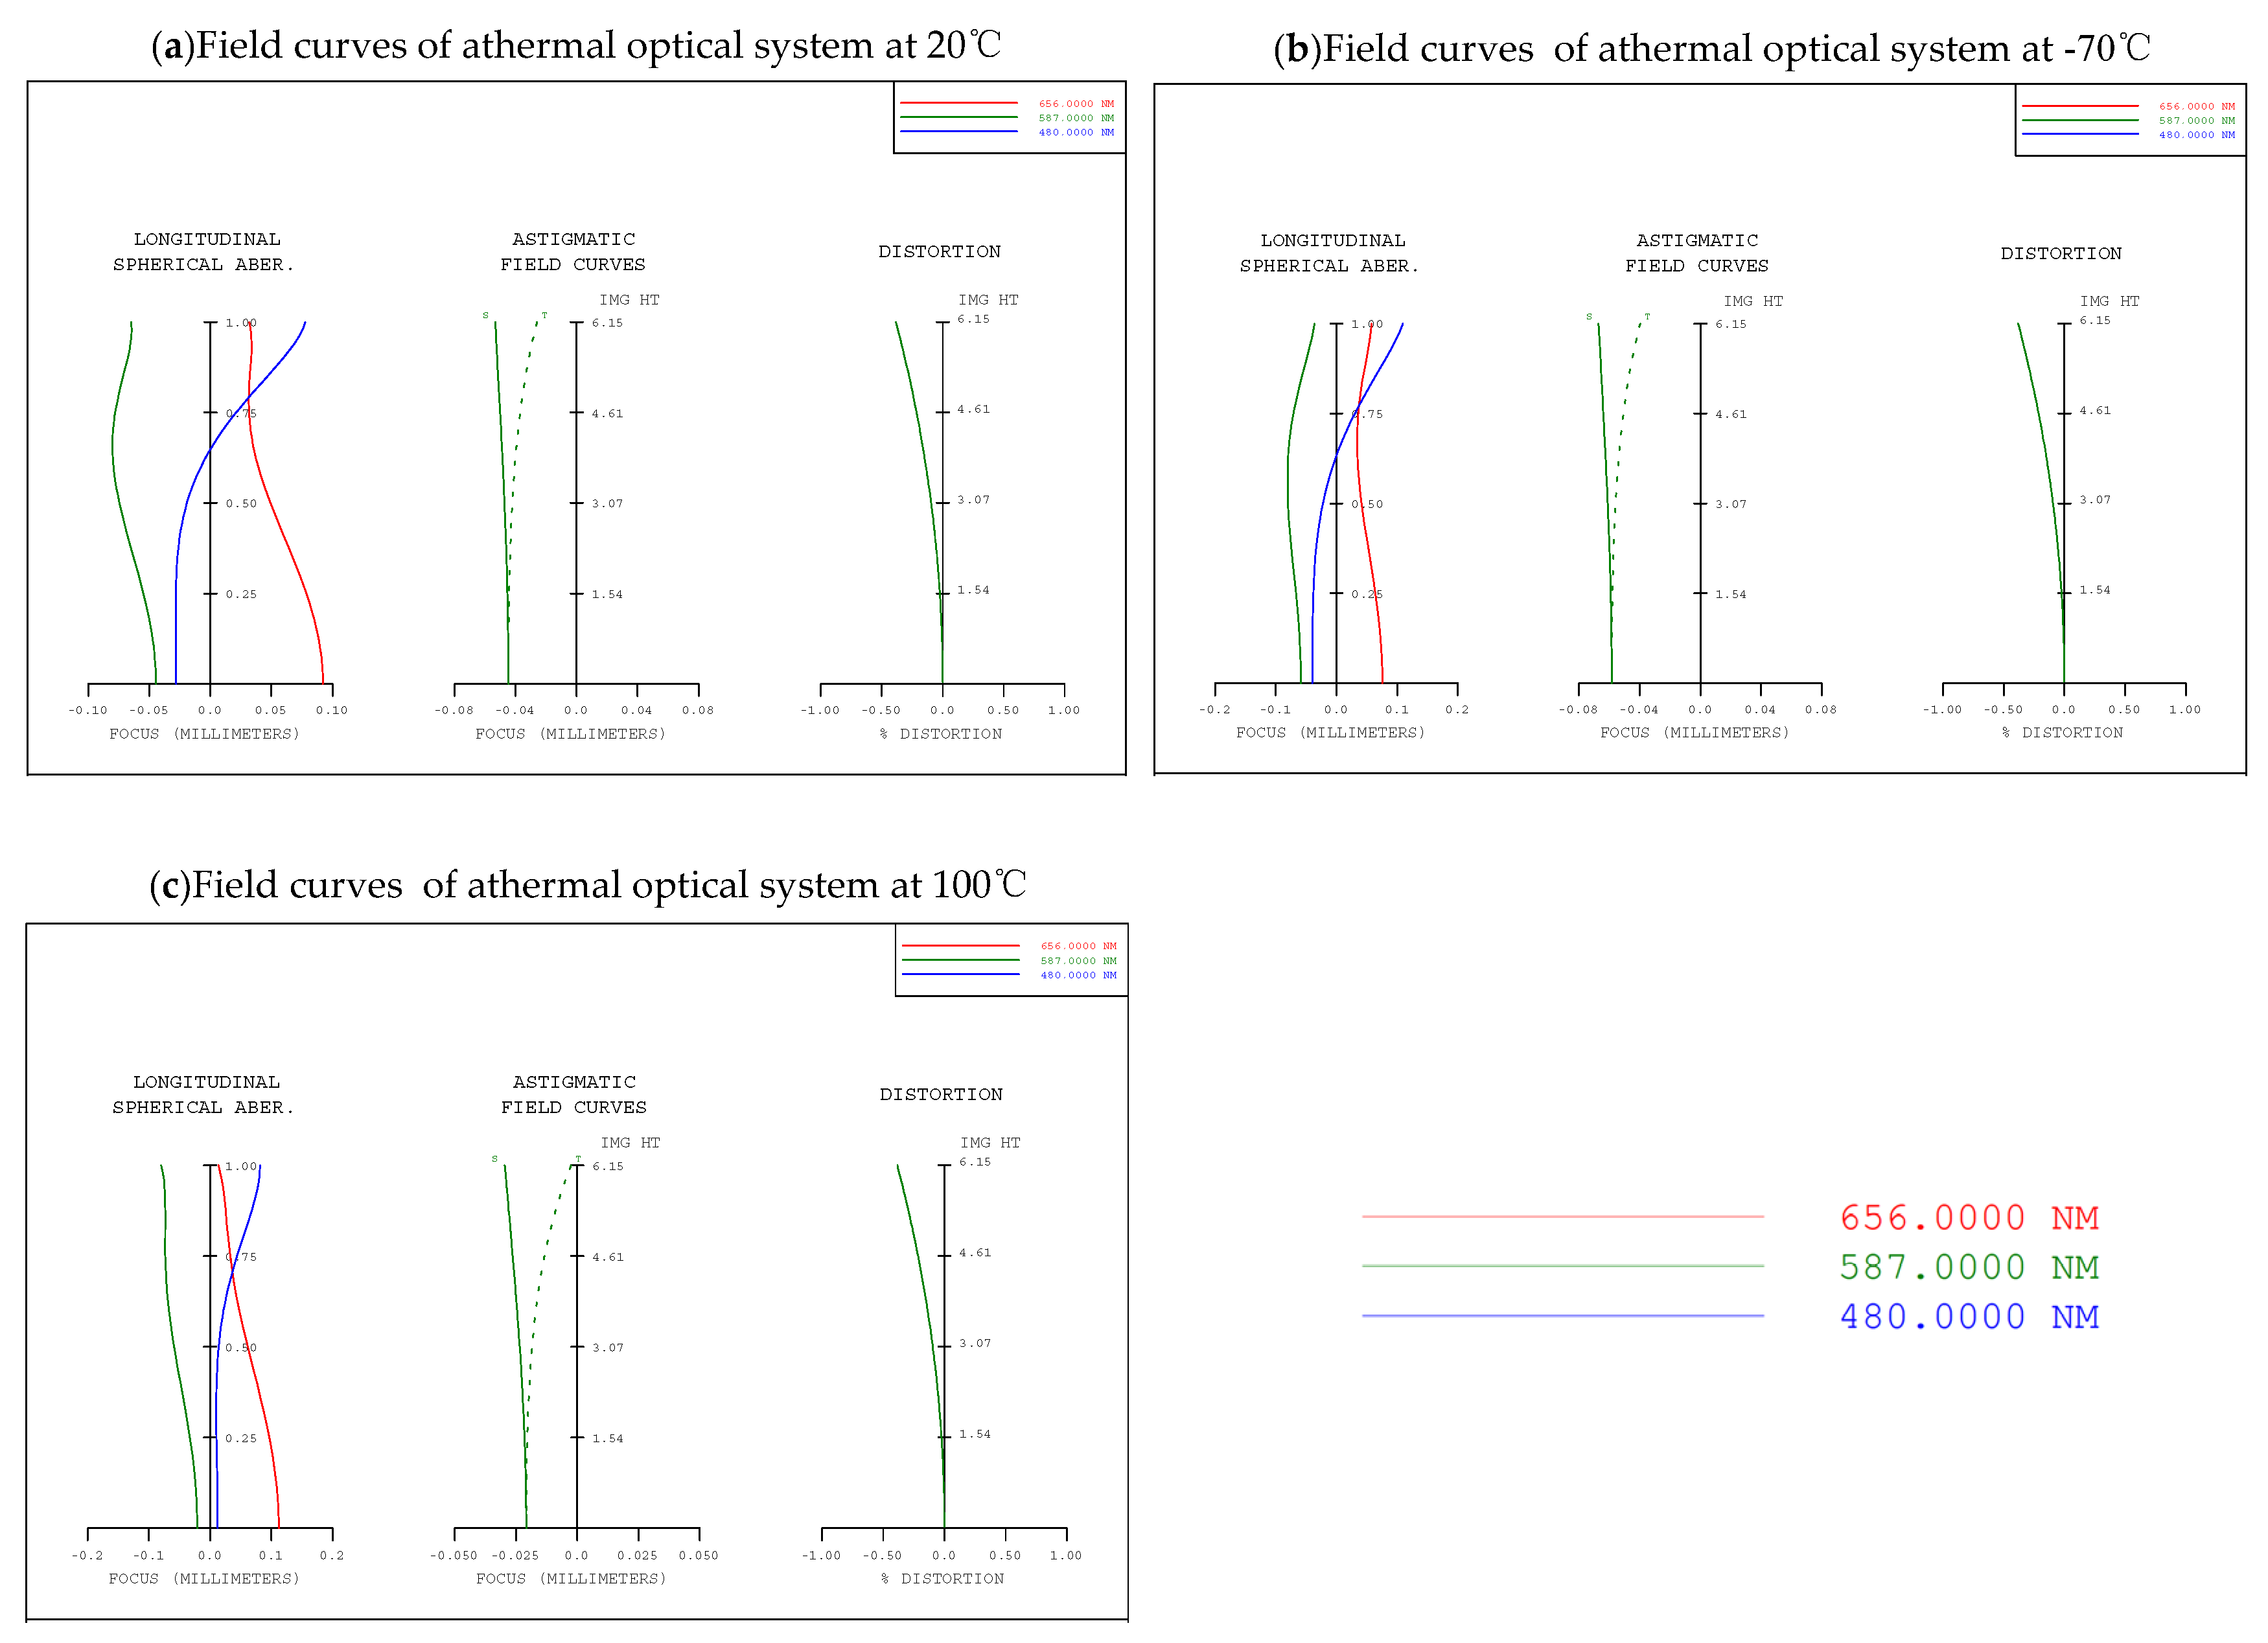
There is commercial software that can convert the FEA results of thermal-induced surface deformation into INT format that optical design software recognizes, such as Sigfit [14,15]. However, if one aims to simultaneously optimize the optical system under different temperature states, the INT surface assignment method cannot realize the assignment of different temperature configurations. Therefore, it is necessary to convert the optical surface type to the Standard Zernike or Fringe Zernike surface type, and to express the coefficient with zoom configurations. The above function can be realized through the self-edited Zoomzernike macro, and the normalized radius is the same as the outer aperture.
The FEA results are loaded into the self-programmed Fea-Fit-Zer-Zoom macro, which is used for Zernike fitting and assigns the Zernike coefficient. The data format of each node needs to be generated by FEA results, and it contains 9 columns, where x, y, z represent the original coordinates of each node; xα, yα, zα represent the coordinates of each node after temperature change; and Δx, Δy, Δz represent the coordinate changes in the nodes under thermal-induced stress. The Z-axis is specified as the optical axis direction in the conversion macro.
In the self-programmed macro function, Zernike fitting primarily uses the Zfrfit or Zerfit tool that comes with Code V to perform the least square method, which calculates the displacements in the Z direction as the same direction as the FEA along the optical axis. In Figure 12, P2T denotes the thermal-induced surface deformation in the Z direction, and P2M denotes the node displacement Δz calculated by FEA [14,15,16].
P 2 T = Δ z + T M
T M = s a g f ( x α , y α ) s a g f ( x α + Δ x , y α + Δ y )
The exact formula of P2T is shown in Equations (7) and (8), where sagf denotes the vector height value of the point.

4. Design Examples

The specifications of design example are shown in Table 1, and the method explained in Section 2 is used to design the passive athermal lens when considering thermal-induced surface deformation. After the conventional athermalization optimization design, six results are generated; the glass material combinations and error functions are shown in Table 6 for each result.
The self-programmed Glass-compare macro is used to find whether the glass materials among the six results have alternative materials with similar optical and thermo-optical properties; however, different mechanical properties are also sought. Among them, optical materials ZF12 and ZF52, with similar optical properties and different in mechanical properties, are available, but their thermo-optical properties are different with HZF12 and HZF52, so HZF12 and HZF52 are not replaced.
Result 1 in Table 6 is an example that demonstrates the iteration optimization process of an optical system considering thermal-induced surface deformation. Each surface sets a Fringe Zernike surface type and makes the normalized radius and Zernike coefficients with zoom configurations by a self-programmed Zoomzernike macro. Then, load the iterative optimization MATLAB program. After each round of optimization, the error function of the system will decrease. During the optimization progress, we monitored the system to see whether the out-aperture of each surface was beyond the normalization radius. The other design results in Table 6 were iteratively optimized following the process described above, from which the optical designer selected the best result. The iterative optimization process of result 1 in Table 6 is shown in Table 7. The final optimization MTF result of the first result in Table 6, considering thermal-induced surface deformation, is shown in Figure 13. Comparing graph (b) in Figure 13 with Figure 6, it is clear that there is a significant improvement in image quality in the optical system that considers thermal-induced surface deformation. The wavefront analysis results of different temperatures are shown in Table 8. Comparing the wavefront analysis results in Table 8 at low temperature with Table 4, it is also clear that the image quality of the system has been improved. Through this method, all the above optimization work can be completed independently by optical designers with basic knowledge of mechanics and thermodynamics.

5. Discussion and Conclusions

In this paper, we propose a passive athermal optical design method that considers thermal-induced surface deformation. Section 2 showed how surface deformation due to axial and radial stress caused by a mismatch in thermal expansion coefficients between glass and mechanical materials can degrade image quality. This method takes into account the effect of thermal-induced surface deformation and completes the optimization compared to conventional passive athermal optical design methods [8,9,10,11]. In contrast to the optical–mechanical–thermal integrated analysis [6,7,12,13], this method provides an optical optimization approach without complex structural optimization and thermal control design. Our method begins with the passive athermal result without considering deformation as the initial result, and it automatically loads the thermal-induced surface deformation into each optimization iteration through parametric FEA and Zernike coefficient fittings. After several iterations, the optimization results are close to the real state, and they allow the final optical system to consider thermal-induced surface deformation to maintain suitable image quality over all operating temperatures. The theoretical and design examples indicate that our method can effectively reduce degradations in image quality under the condition of thermal-induced surface deformation.
A deficit in this study is the parametric FEA. There are many different ways of fixing lens. In this article we only use the retaining ring fixation as an example to demonstrate the parametric FEA process. Even this fixation, the realistic tolerance gaps between lenses and mechanical components are not easily characterized in the simulation. In addition, the parametric FEA method are unable to analyze aspherical surfaces and glued lenses. Further research into these questions would be a useful way of improving the accuracy of our optimization results.
Finally, our method provides an optical optimization approach for optical designers with basic knowledge of mechanics and thermodynamics to complete independently when considering thermal-induced surface deformations. The results optimized by this method significantly reduce the influence of this issue and demonstrate better temperature adaptability.

Author Contributions

Conceptualization, T.L.; methodology, T.L. and C.W.; software, T.L. and C.W.; writing—original draft preparation, T.L.; writing—review and editing, Z.L. and F.H.; funding acquisition, Y.Y.; All authors have read and agreed to the published version of the manuscript.

Funding

This research received no external funding.

Data Availability Statement

Data are available from the authors on request.

Conflicts of Interest

The authors declare no conflict of interest.

References

  1. Jamieson, T.H. Thermal effects in optical systems. Opt. Eng. 1981, 20, 156–160. [Google Scholar] [CrossRef]
  2. Nasyrov, A.R. Methods of athermalization of optical systems in thermal imaging devices. J. Opt. Technol. 2017, 84, 205–206. [Google Scholar] [CrossRef]
  3. An, X.Q.; Wang, Q.; Song, B. Athermal design of compact uncooled optical system with large relative aperture. Laser Infrared 2015, 45, 795–799. [Google Scholar] [CrossRef]
  4. Cheng, X.M.; Yang, Y.K.; Hao, Q. Analysis of the effects of thermal environment on optical systems for navigation guidance and control in supersonic aircraft based on empirical equations. Sensors 2016, 16, 1717. [Google Scholar] [CrossRef] [PubMed] [Green Version]
  5. Sun, W.S.; Huang, C.M.; Lin, J.S. Discussion of temperature, TV distortion, and lateral color of a 4 megapixel DLP projector lens. OSA Contin. 2019, 2, 3188–3203. [Google Scholar] [CrossRef]
  6. Xie, N.; Cui, Q.F.; Sun, L.; Wang, J.F. Optical athermalization in the visible waveband using the 1+Σ method. Appl. Opt. 2019, 58, 635–641. [Google Scholar] [CrossRef] [PubMed]
  7. Michels, G.J.; Genberg, V.L. Analysis of thermally loaded transmissive optical elements. In Proceedings of the Optical Modeling and Performance Predictions VI, San Diego, CA, USA, 27 September 2013. [Google Scholar] [CrossRef]
  8. Lim, T.Y.; Kim, Y.S.; Park, S.C. Graphical selection of optical materials using an expanded athermal glass map and considering the housing material for an athermal and achromatic design. J. Opt. Soc. Korea 2015, 19, 531–536. [Google Scholar] [CrossRef] [Green Version]
  9. Lim, T.Y.; Park, S.C. Achromatic and athermal lens design by redistributing the element powers on an athermal glass map. Opt. Express 2016, 24, 18049–18058. [Google Scholar] [CrossRef] [PubMed]
  10. Rogers, J.R. An optically athermalized lens covering a 200-degree temperature range. In Proceedings of the International Conference on Space Optics-ICSO 2018, Chania, Greece, 9–12 July 2019. [Google Scholar] [CrossRef] [Green Version]
  11. Sahin, F.E. Long-range, high-resolution camera optical design for assisted and autonomous driving. Photonics 2019, 6, 73. [Google Scholar] [CrossRef] [Green Version]
  12. Lin, S.; Wang, H.; Liu, Y.; Xue, Y.; Xiang, B.; Liu, J.; Xie, Y.; Liu, M.; Wu, L. Athermalization for the supporting structure of space camera primary and secondary mirrors. In Proceedings of the Third International Conference on Photonics and Optical Engineering, Xi’an, China, 24 January 2019. [Google Scholar] [CrossRef]
  13. Zhang, G.; Zhao, H.; Chen, Y.; Zhang, G.; Zhang, Z.; Peng, J.; Zhao, Z.; Yan, A. Optimization thermal design method for space cameras based on thermo-optical analysis and Taguchi method. Opt. Eng. 2020, 59, 075101. [Google Scholar] [CrossRef]
  14. Juergens, R.C.; Coronato, P.A. Improved method for transfer of FEA results to optical codes. In Proceedings of the Novel Optical Systems Design and Optimization VI, San Diego, CA, USA, 6 November 2003. [Google Scholar] [CrossRef]
  15. Coronato, P.A.; Juergens, R.C. Transferring FEA results to optics codes with Zernikes: A review of techniques. In Proceedings of the Optomechanics 2003, San Diego, CA, USA, 27 October 2003. [Google Scholar] [CrossRef]
  16. Doyle, K.B.; Genberg, V.L.; Michels, G.J.; Bisson, G.R. Optical modeling of finite element surface displacements using commercial software. In Proceedings of the Optical Modeling and Performance Predictions II, San Diego, CA, USA, 24 August 2005. [Google Scholar] [CrossRef]
Figure 1. Layout of the athermal visible lens without considering thermal-induced surface deformation.
Photonics 08 00396 g001
Figure 2. MTF graphs of the passive athermal visible lens with temperatures: (a) 20 °C, (b) −70 °C, and (c) 100 °C.
Photonics 08 00396 g002
Figure 3. Field curves graphs of the passive athermal visible lens with temperatures: (a) 20 °C, (b) −70 °C, and (c) 100 °C.
Photonics 08 00396 g003
Figure 4. The structural profile of the optical system.
Photonics 08 00396 g004
Figure 5. FEA model of the optical system.
Photonics 08 00396 g005
Figure 6. MTF graph of the athermal visible lens at −70 °C considering thermal-induced surface deformation.
Photonics 08 00396 g006
Figure 7. Field curves graphs of the athermal visible lens at −70 °C considering thermal-induced surface deformation.
Photonics 08 00396 g007
Figure 8. Single lens example.
Photonics 08 00396 g008
Figure 9. Flow of passive athermal optical design methods considering thermal-induced surface deformation.
Photonics 08 00396 g009
Figure 10. Single-lens FEA unit.
Photonics 08 00396 g010
Figure 11. Parametric FEA progress: (a) parametric modeling; (b) meshing; (c) surface displacement cloud map.
Photonics 08 00396 g011
Figure 12. Zernike fitting deformation data processing method.
Photonics 08 00396 g012
Figure 13. MTF graphs of the lens after iteration optimization with temperatures: (a) 20 °C, (b) −70 °C, and (c) 100 °C.
Photonics 08 00396 g013
Table 1. Lens specifications.
ParametersValue
Focal length200 mm
Wavelength480 nm–656 nm
Temperature range−70 °C to 100 °C
Detector size9.6 mm × 7.68 mm
Housing materialAluminum (αh = 230 × 10−6/°C)
Table 2. Lens data.
Table 2. Lens data.
Surface NumberRadius
mm
Thickness
mm
MaterialAperture
mm
STO-1.0-83.22
291.734116.3192HZPK1A84.05
3−6251.05941.0-81.98
472.925418.0HZPK575.26
5150.629716.3414-66.28
6−1564.988618.0HZF1253.48
744.248889.9915-41.30
838.94017.3875HZLAF68N28.34
960.341731.9604-25.68
Image---12.29
Table 3. Wavefront analysis results of the passive athermal visible lens with different temperatures.
Temperature
Status
Normalized
Field
RMS
(waves@587nm)
P–V
(waves@587nm)
00.7962.627
20 °C0.50.8773.180
10.9803.311
00.7452.428
−70 °C0.50.8333.010
10.9433.126
00.7232.383
100 °C0.50.8072.924
10.9143.158
Table 4. Wavefront analysis results of the athermal visible lens at −70 °C considering thermal-induced surface deformation.
Temperature StatusNormalized FieldRMS
(waves@587nm)
P–V
(waves@587nm)
01.6295.226
−70 °C0.51.6975.964
11.7786.155
Table 5. Parametric data.
Parameter NameParameter MeaningParametric Modeling Calculation Method
R1Radius 1R1 = Radius 1
R2Radius 2R2 = Radius 2
CTCenter thicknessCT = Center thickness
CAClear apertureCA = Clear aperture
OAOuter apertureOA = Outer aperture
Fixed surfaceFixed surfaceFront or back
LLRetaining ring widthdefault: LL = OA/20 or customize
LRRetaining ring thicknessdefault: LR = OA/20 or customize
HLLens room mounting widthdefault: LL = OA/15 or customize
HRLens room mounting thicknessdefault: LR = OA/18 or customize
ALLens room widthdefault: AL = lens edge thickness + HL + LL + 2 mm or customize
ARLens room thicknessdefault: AR = OA/7 or customize
TClearance between lens and lens holderdefault: T = 0 or customize
House material informationYoung’s modulus, Thermal expansion coefficient, Poin’s ratioAssignment
Retaining ring material informationYoung’s modulus, Thermal expansion coefficient, Poisson’s ratioAssignment
Glass material informationYoung’s modulus, Thermal expansion coefficient, Poisson’s ratioAssignment
Table 6. Glass selection and error functions of conventional athermalization results.
ResultGlass 1Glass 2Glass 3Glass 4Error Function
1HZPK1AHZPK5HZF12HZLAF68N48.5786
2HZPK1AHZPK5HZF12HZLAF53B48.6393
3HZPK2AHZPK5HZF12DZLAF52LA52.1341
4HFK61HZPK5HZF12DZLAF52LA82.9771
5HZPK5HZPK5HZF12DZLAF52LA92.6081
6HZK9BHZPK5HZF52HZLAF75A98.1187
Table 7. Iterative optimization process for result 1 in Table 6.
Optimization Iteration RoundError Function BeforeError Function AfterExceed the Normalized Radius
1111.0783.60No
285.1968.85No
364.4562.44No
461.3359.73No
559.8856.83No
656.8356.72No
Table 8. Wavefront analysis results of the lens after iteration optimization with different temperatures.
Temperature StatusNormalized FieldRMS
(waves@587nm)
P–V
(waves@587nm)
00.9913.272
20 °C0.51.0843.911
11.2444.274
01.1074.412
−70 °C0.51.1764.897
11.4005.595
00.8812.901
100 °C0.50.9813.539
11.1403.891
Publisher’s Note: MDPI stays neutral with regard to jurisdictional claims in published maps and institutional affiliations.

