Article

Sensitivity Enhanced Refractive Index Fiber Sensor Based on Long-Range Surface Plasmon Resonance in SiO2-Au-TiO2 Heterostructure

1
Fujian Key Laboratory of Light Propagation and Transformation, College of Information Science and Engineering, Huaqiao University, Xiamen 361021, China
2
Department of Electrical and Electronic Engineering, Southern University of Science and Technology, Shenzhen 518055, China
3
School of Electrical and Electronic Engineering, Nanyang Technological University, 50 Nanyang Avenue, Singapore 639798, Singapore
*
Author to whom correspondence should be addressed.
Photonics 2021, 8(9), 379; https://doi.org/10.3390/photonics8090379
Submission received: 29 July 2021 / Revised: 3 September 2021 / Accepted: 6 September 2021 / Published: 9 September 2021
(This article belongs to the Special Issue Novel Specialty Optical Fibers and Applications)

Abstract

:
Long-range surface plasmon resonance (LRSPR), generated from a coupled plasmon polariton in a thin metal slab sandwiched by two dielectrics, has attracted more and more attention due to its merits, such as longer propagation and deeper penetration than conventional single-interface surface plasmon resonance. Many useful applications related to light–medium interaction have been demonstrated based on the LRSPR effect, especially in the sensing area. Here, we propose and demonstrate an LRSPR-based refractive index sensor by using a SiO 2 -Au-TiO 2 heterostructure, in which a D-shaped honeycomb-microstructure optical fiber (MOF) is designed as the silica substrate and then deposited with a gold film and thin-layer titanium dioxide (TiO 2 ). By using the full-vector finite-element method (FEM), this heterostructure is numerically investigated and demonstrated to excite LRSPR without a buffer layer, which is usually necessary in previous LRSPR devices. Through comprehensive discussion about the influence of structural parameters on the resonant wavelength, the excitation of the LRSPR in the proposed heterostructure is revealed to be highly related to the effective refractive index of MOF’s fundamental core mode, which is mainly determined by the MOF’s pitch, the thicknesses of the silica web and the planar-layer silica. Moreover, the thin-layer TiO 2 plays an important role in significantly enhancing the resonance and the sensitivity to analyte’s refractive index as well, when it is coated on the top of the Au film rather than between the metal and waveguide. Finally, the proposed LRSPR sensor based on SiO 2 -Au-TiO 2 heterostructure shows an ultra-high wavelength sensitivity of 20,100 nm/RIU and the corresponding minimum resolution is as low as 4.98 × 10 7 RIU. Thus, the proposed LRSPR device offers considerable potential for sensing applications in biomedical and biochemical areas.

1. Introduction

With the rapid development of multi-disciplinary science and technology in recent years, optical measurement methods and tools play significant roles in many areas, especially in chemistry, biology, medicine, and so on. As a representative, surface plasmon resonance (SPR) based technology is receiving increasing attention thanks to its remarkably high sensitivity and accuracy. Surface plasmon—also called surface plasmon polariton (SPP)—refers to a quantum of charge density oscillations at the interface between a metal and a dielectric, and propagates along the interface. It can be excited through photon–electron coupling resonance, when the wave vector of incident light from the dielectric matches the wave vector of SPP. From the light transmission point of view, such coupling resonance is accompanied by the energy transference from incident light to SPP, generating a narrow-band resonant peak in the spectrum. The oscillations are very sensitive to any perturbation of the metal’s boundary, especially when the thickness of metal layer is as thin as several tens of nanometers. It indicates that the SPR-based devices are intrinsically suitable for high-sensitivity detection [1,2,3,4].
For further enhancing their performance and functions, SPR-based devices with multi-layer heterostructures arouse researchers’ considerable interest. For example, bimetallic layers are widely proposed to improve the sensitivity and stability of SPR biosensors [5,6,7]. A layer made of metal oxide, such as indium tin oxide (ITO) [8], tin oxide (SnO 2 ) [9], titanium dioxide (TiO 2 ) [10], hafnium oxide (HfO 2 ) [11], tantalum oxide (Ta 2 O 5 ) [12], and so forth, is commonly used as an adhesive layer to strengthen the attachment of a metal film on a substrate, or deposited on top of the metal layer to protect metal from oxidization. Besides, some metal oxide films are demonstrated to have the capability to enhance sensitivity [8,12,13,14,15], or can even be used as the sensing layer by means of lossy mode resonance [16,17]. Moreover, 2D materials, such as graphene [18], molybdenum disulfide (MoS 2 ) [19], tungsten disulfide (WS 2 ) [20] and so forth, provide more choice and fascinating properties for SPR-based devices [20].
From the physics point of view, multi-layer structured systems extend the concept of SPR to a broader realm. Considering a typical three-layer heterostructure, that is, a dielectric–metal–dielectric system, SPP might be excited at both metallic–dielectric interfaces and interact with each other to give rise to two coupled modes, if the separation between two interfaces is close to the decay length of single-interface SPP and the effective refractive indices of two dielectrics are comparable. Based on the symmetry of the transverse electric field, these two coupled modes are distinguished as the symmetric mode and the asymmetric mode [21]. Compared with the conventional single-interface SPP, the symmetric mode features lower attenuation, longer propagating distance and deeper penetration—termed long-range surface plasmon polariton (LRSPP) mode—while the asymmetric one is denoted as short-range surface plasmon polariton (SRSPP) mode due to its contrary characteristics. Hence, the devices based on long-range surface plasmon resonance (LRSPR) promise to offer a better performance than conventional single-interface SPR based devices for applications in biomedical or chemical measurement [21,22,23,24]. As for the applications related to liquid analytes, a buffer layer (e.g., Teflon, Cytop, MgF 2 ) with a similar material refractive index (RI) to the analyte is usually necessary to balance the RI gap between the analyte and waveguide and then facilitate the generation of LRSPR [25,26]. Alternatively, by properly designing the waveguide structure, some microstructured optical fibers (MOFs) find another approach to achieving LRSPR excitation in a wide wavelength range without a buffer layer [27].
In this paper, an LRSPR refractive index sensor based on a SiO 2 -Au-TiO 2 heterostructure is proposed and theoretically investigated. This heterostructure is composed of a D-shaped honeycomb-structure silica MOF coated with a thin-layer of Au and a TiO 2 film sequentially. By designing the specialty MOF with a high air-filling-ratio cladding and suitable core size, the effective refractive index ( n eff ) of the fundamental core mode is comparable with the material RI of aqueous analyte. Therefore, the LRSPP mode in the proposed heterostructure is directly achieved without the assistance of an additional buffer layer. Furthermore, the structural parameters, including the cladding pitch, the thicknesses of silica web, the flatten silica layer, the Au layer and the TiO 2 film, are discussed in detail. Based on the wavelength interrogation method, the sensing performance of the different heterostructures (i.e., SiO 2 -Au-TiO 2 and SiO 2 -TiO 2 -Au) is compared within the analyte’s RI range from 1.33 to 1.39. The results illustrate that the sensor based on the SiO 2 -Au-TiO 2 configuration has higher sensitivity and its maximum and average sensitivities reach 20,100 nm/RIU and 11,586 nm/RIU, respectively. The corresponding minimum resolution is as low as 4.98 × 10 7 RIU.

2. Structural and Theoretical Modeling

The cross-section of the proposed sensor is depicted in Figure 1a. The pure silica D-shaped MOF plays the role as a substrate with a waveguide, in which the microstructured cladding consists of five-layer hexagonal air holes with the honeycomb-structure arrangement and the central air hole is replaced by a silica rod. This hexagonal-air-holes structure provides a very high air-filling ratio. It not only significantly lowers the n eff of the MOF’s core mode but also reduces the optical field to spread in air-holes cladding, resulting in a strong interaction of the light between the waveguide and metal film. The flattened side of the D-shaped MOF can be treated as a very thin layer of silica and provides a planar surface, on which a layer of gold and a very thin-film of TiO 2 are coated sequentially. Gold is a commonly-used plasma material in many SPR devices due to its high resonance shift capability and chemical stability. The TiO 2 film is deposited on the gold layer to increase the electromagnetic field extension from the metal film to the analyte, enhancing the interaction of the evanescent wave with the analyte [28]. It is noteworthy that most of the planar-layer silica connects with the air holes directly, where the electromagnetic field tends to be partially reflected to the metal film because of the considerable RI difference at the silica–air interface. To mimic the scenario of practical sensing, the proposed device is surrounded by a liquid analyte which is usually viewed as another dielectric layer.
The numerical simulation and analysis were implemented by using a full-vector finite-element method (FEM), which was provided by COMSOL Multiphysics. As an example, the initial model parameters included the MOF’s pitch size ( Λ = 2600 nm), the thickness of the silica web (d = 500 nm), the thickness of the planar-layer silica ( t SiO 2 = 150 nm), the thickness of the gold layer ( t Au = 70 nm), and the thickness of the TiO 2 film ( t TiO 2 = 3 nm). The diameters of the MOF’s outer cladding, analyte and perfectly-matched layer (PML) are respectively set to 36 μ m, 40 μ m, and 43 μ m.
The background material of the MOF is fused silica, and the refractive index of SiO 2 is calculated by the following Sellmeier equation as mentioned in [29]:
n SiO 2 = 1 + 0.691663 λ 2 λ 2 0.004679 + 0.407943 λ 2 λ 2 0.013512 + 0.897479 λ 2 λ 2 97.934003 ,
where λ denotes the wavelength of the incident light and its unit is micrometer.
The complex dielectric permittivity of gold is described by the Drude–Lorentz model [30]:
ε Au = ε ω D 2 ω ω + i γ D Δ ε · Ω L 2 ω 2 Ω L 2 + i Γ L ω ,
where ω is the angular frequency of transmitted light; ε , ω D , and γ D stand for the permittivity at high frequency, the plasma frequency and the damping coefficient, respectively; Ω L and Γ L are the oscillator strength and the spectral width of the Lorentz oscillators, respectively; Δ ε is a weighting factor. Their values are listed as follows: ε = 5.9673 , ω D / 2 π = 2113.6 THz, γ D / 2 π = 15.92 THz, Ω L / 2 π = 650.07 THz, Γ L / 2 π = 104.86 THz, and Δ ε = 1.09 [31].
The refractive index of TiO 2 can be defined by the given equation [3]:
n TiO 2 = 5.913 + 2.441 × 10 7 λ 2 0.803 × 10 7 .
The RI of air is fixed at 1.0, while that of the analyte keeps a constant value for wavelength sweep and then changes from 1.33 to 1.39 for discussing the sensing performance. The material RI of the PML is set to be the same as that of the analyte.
Regarding the feasibility of device fabrication, the specialty MOF can be fabricated by the stack and draw technique, which is similar to the fabrication of a side-channel MOF [32]. Then, the planar surface for coating metal film can be exposed by fiber post-processing methods, such as etching or side polish [33,34,35,36,37]. The deposition of Au and TiO 2 films is usually achieved by using thermal evaporation or sputtering techniques [2]. The practical scheme for wavelength interrogation of the proposed LRSPR sensor could be similar to that of the experimental setup for conventional SPR fiber sensors [35]. As shown in Figure 1b, the D-shaped MOF with the LRSPR sensor head is spliced with two single-mode fibers (SMFs) and is then connected with a broadband light source and an optical spectrum analyzer (OSA), respectively. The output spectrum is recorded by the OSA, and then transferred to a computer for data processing.
In order to achieve accurate enough results, the maximum element size of the meshes in the TiO 2 film and the gold layer are respectively set to be 1 nm and 10 nm, whereas the mesh size in the silica web and MOF’s core are less than 50 nm. With frequency domain mode analysis, a series of complex eigenvalues ( N eff ) are simulated. Each eigenvalue corresponds to a specific mode. The real part of a complex eigenvalue ( Re N eff ) represents the effect refractive index ( n eff ) of the corresponding mode, whereas its imaginary part ( Im N eff ) determines the confinement loss α ( λ ) [30,36]:
α ( λ ) = 8.686 × 2 π λ Im N eff × 10 4 ,
where λ is the wavelength in micrometers.
Based on the aforementioned method and the parameters of the example model, the dispersion and confinement loss curves of the y-polarized core mode and LRSPP mode are calculated and plotted in Figure 2a. The blue and red solid line curves stand for the n eff of y-polarized core mode and LRSPP mode, respectively. Moreover, the loss spectra of the core mode and LRSPP mode are respectively illustrated as the red and blue dot curves. From this figure, it is noteworthy that the dispersion curve of the core mode declines more steeply than that of the LRSPP mode. This abnormal dispersion phenomenon is different from that in conventional SPR devices and might be essentially related to the mode field distribution of the LRSPP mode. The pictures shown in Figure 2c,f illustrate the electric field distribution of the MOF’s core mode and LRSPP mode at the wavelength of 1900 nm, respectively. For further in-depth analysis, the field distribution along y-axis of the LRSPP mode is plotted as shown in Figure 2b. We find that most of electric field of the LRSPP mode distributes in the analyte region. Thus, the n eff of LRSPP mode will be close to the material RI of analyte according to effective-medium theory [38,39]. It changes more slowly than that of the MOF’s core mode, which is simultaneously determined by the material dispersion of silica and the MOF’s waveguide dispersion [39]. Moreover, there is a break around the wavelength of 1925 nm in their dispersion curves, in which the avoided-crossing phenomenon occurs. As the pictures show in Figure 2c–e, the electric field of the core mode is transferred step-by-step from the core region to the analyte with the increment of wavelength, indicating a conversion from the core mode to the LRSPP mode. On the other hand, the LRSPP mode is transformed into the core mode gradually as the pictures show in Figure 2f–h. The attenuation spectrum consists of the confinement loss of the core mode before the avoided-crossing point and that of the converted “core mode” after the avoided-crossing point, as the blue dot curve shows in Figure 2a. It has a narrow-band peak with a wavelength of 1925 nm, which corresponds to the strongest mode coupling.
Based on the wavelength interrogation method, the performance of the sensor can be evaluated by the “so-called” wavelength sensitivity S λ [40]:
S λ = Δ λ peak Δ n a , nm / RIU ,
where Δ λ peak is the resonant wavelength shift and Δ n a is the variation of analyte RI.
Additionally, the resolution (R) and figure of merit (FOM) are widely used to further evaluate the performance of SPR-based fiber sensors. They are respectively defined as follows [41,42]:
R = Δ λ min S λ , ( RIU )
FOM = S λ FWHM , ( RIU 1 ) ,
where Δ λ min for the minimum detectable wavelength of an OSA. It is usually set to 0.01 nm [42]; FWHM is the abbreviation of full width half maximum.

3. Discussion

By tracking the change of the LRSPR peak, the influence of the structural parameters on the prosed sensor is analyzed in detail as follows. In order to maintain consistency, except for the discussed parameter, other parameters are kept the same as those in the example model in Section 2.

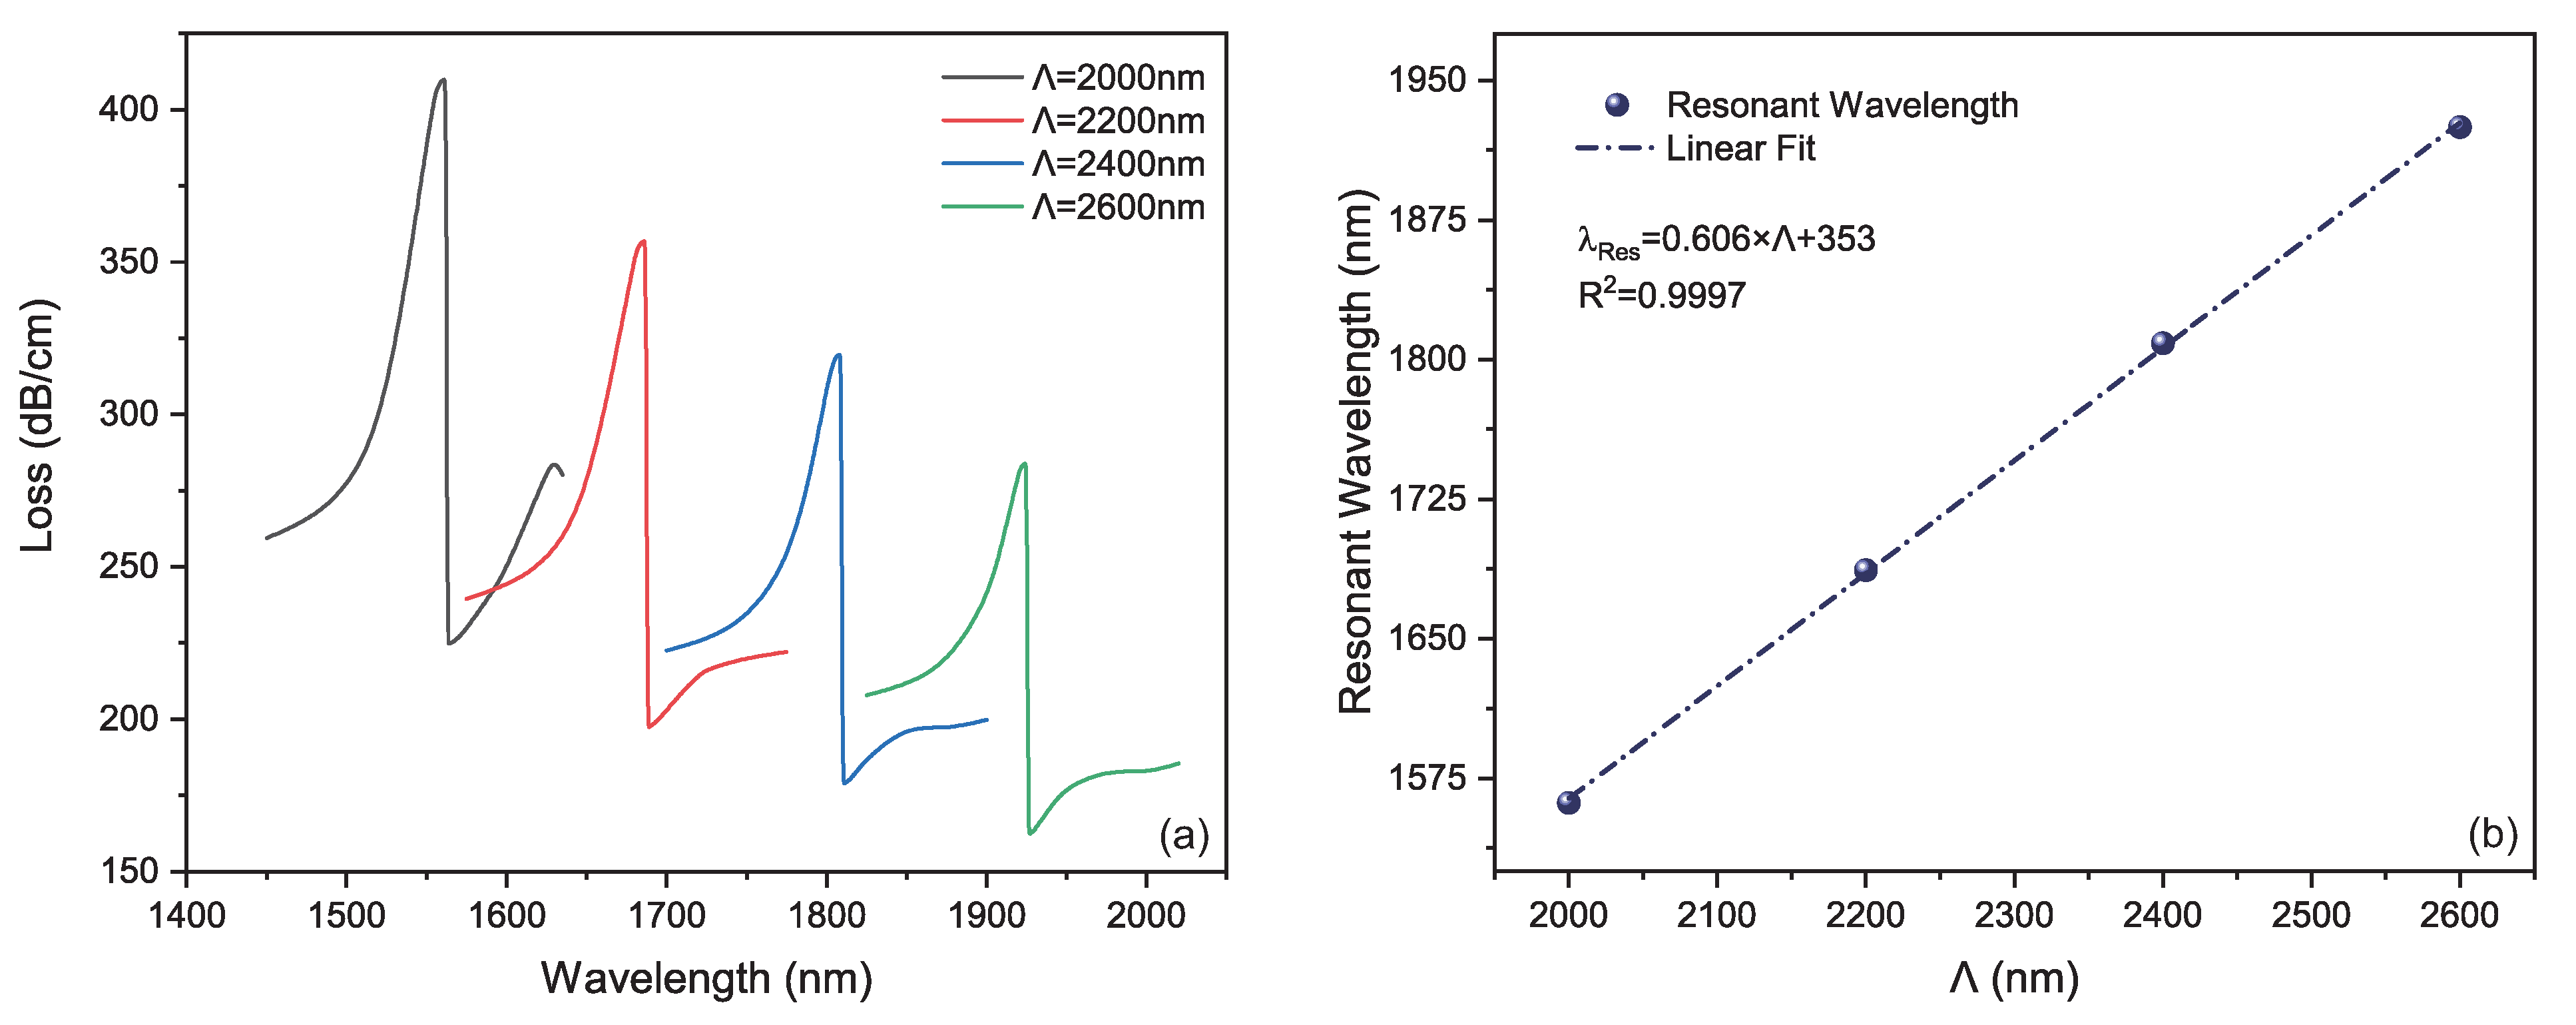
3.1. Influence of MOF’s Pitch on LRSPR

Firstly, the pitch Λ of the D-shaped MOF is increased from 2000 nm to 2600 nm with the step of 200 nm, while the other parameters remain from the initial model. As shown in Figure 3a, with the increases of pitch, the resonant wavelength shifts towards the longer wavelengths. Actually, the core size is mainly determined by the pitch; the increase of pitch is equivalent to the increase of the core diameter. Hence, the n eff of the core mode at each wavelength decreases accordingly, while the corresponding n eff of the LRSPP mode is hardly affected and still around the value of the analyte’s RI. This means that the phase-matching condition can only be fulfilled at the longer wavelength if the MOF’s pitch is increasing. By extracting the resonant wavelengths under different pitches and then fitting linearly, as shown in Figure 3b, the dependence of the resonant wavelength on the MOF’s pitch is highly linear.

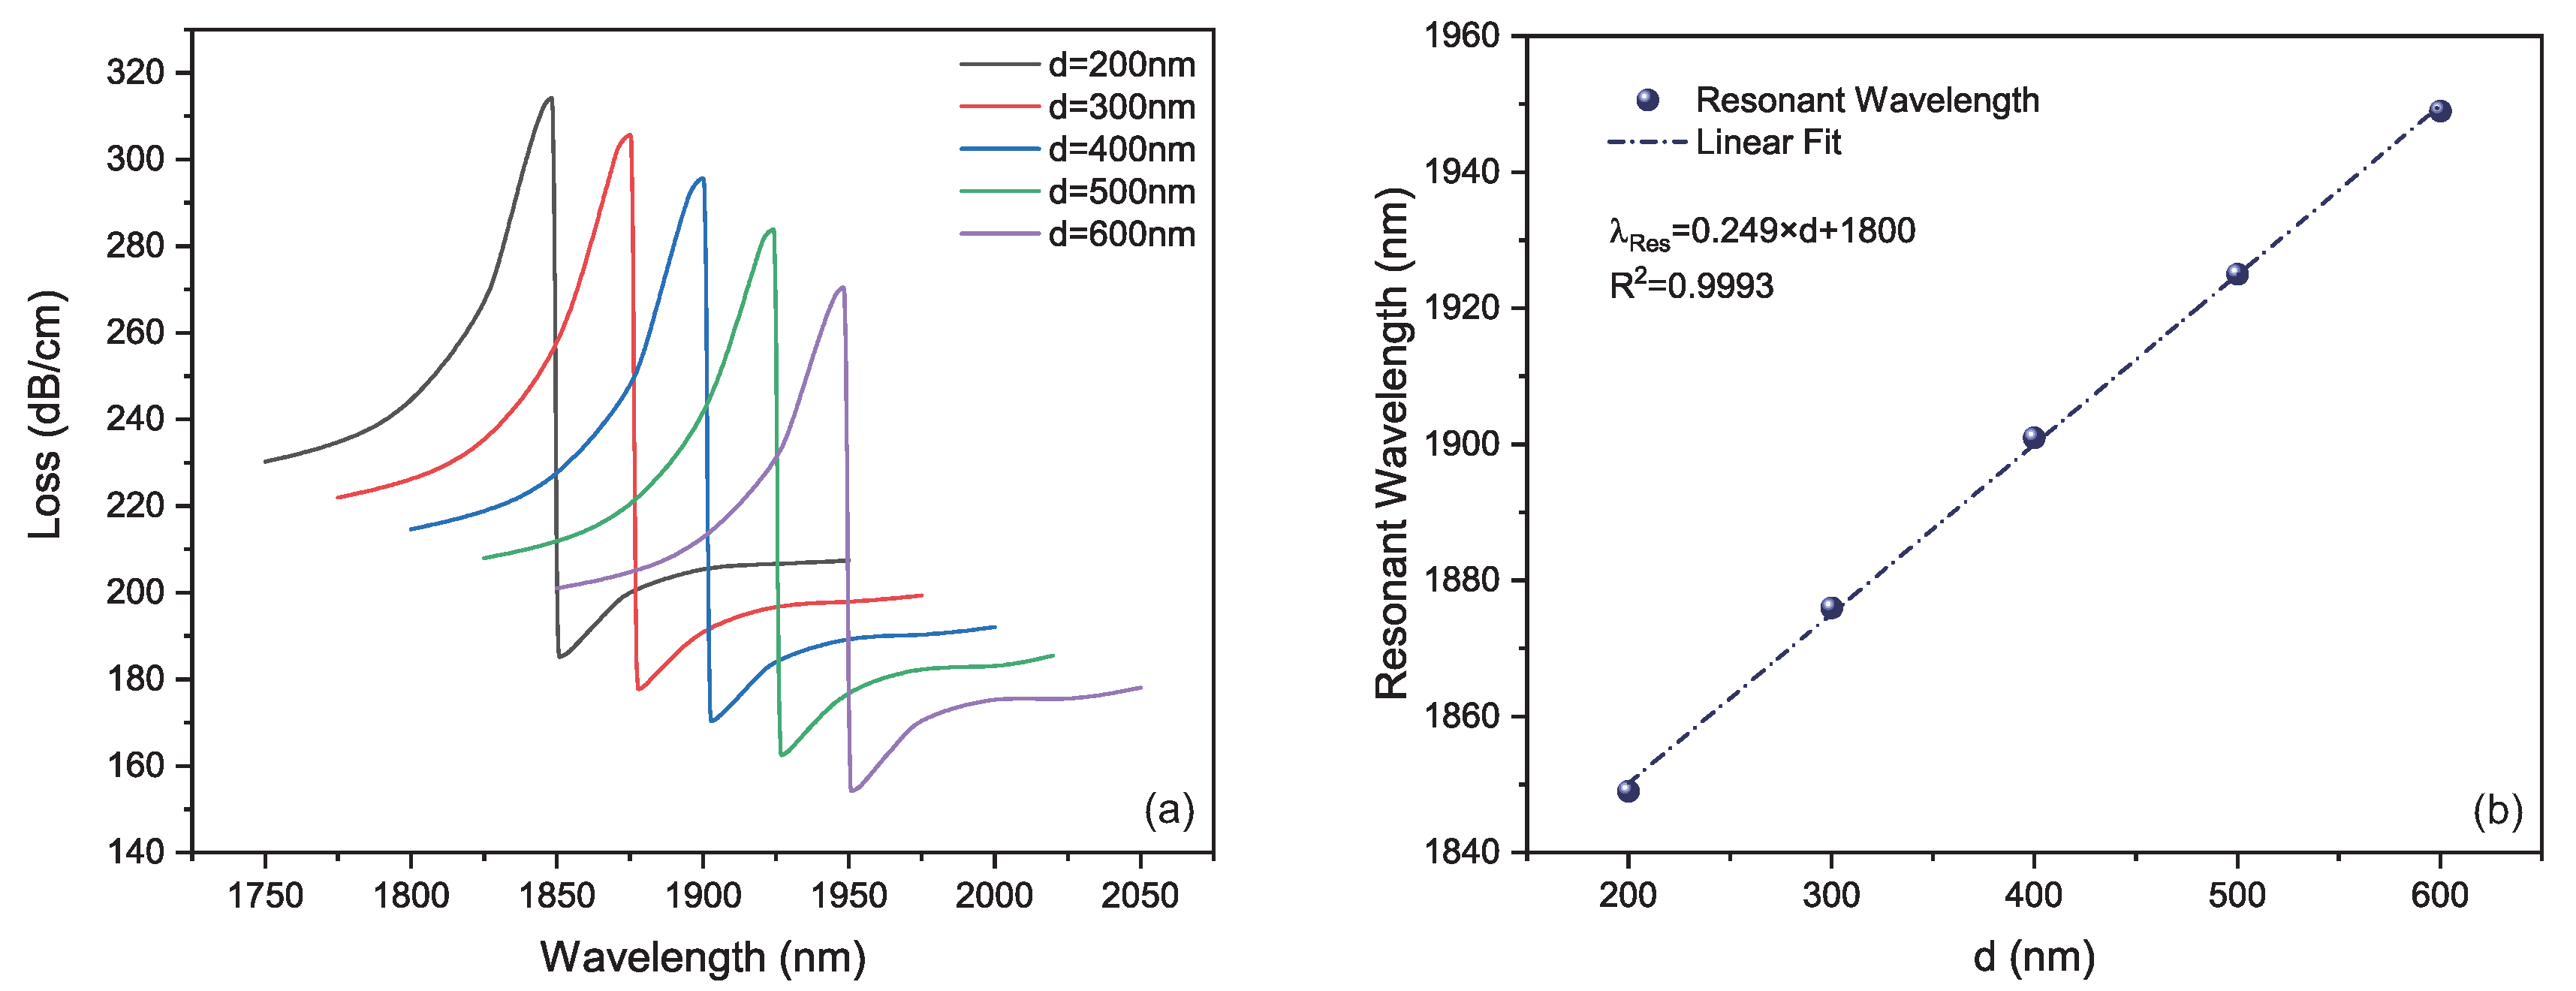
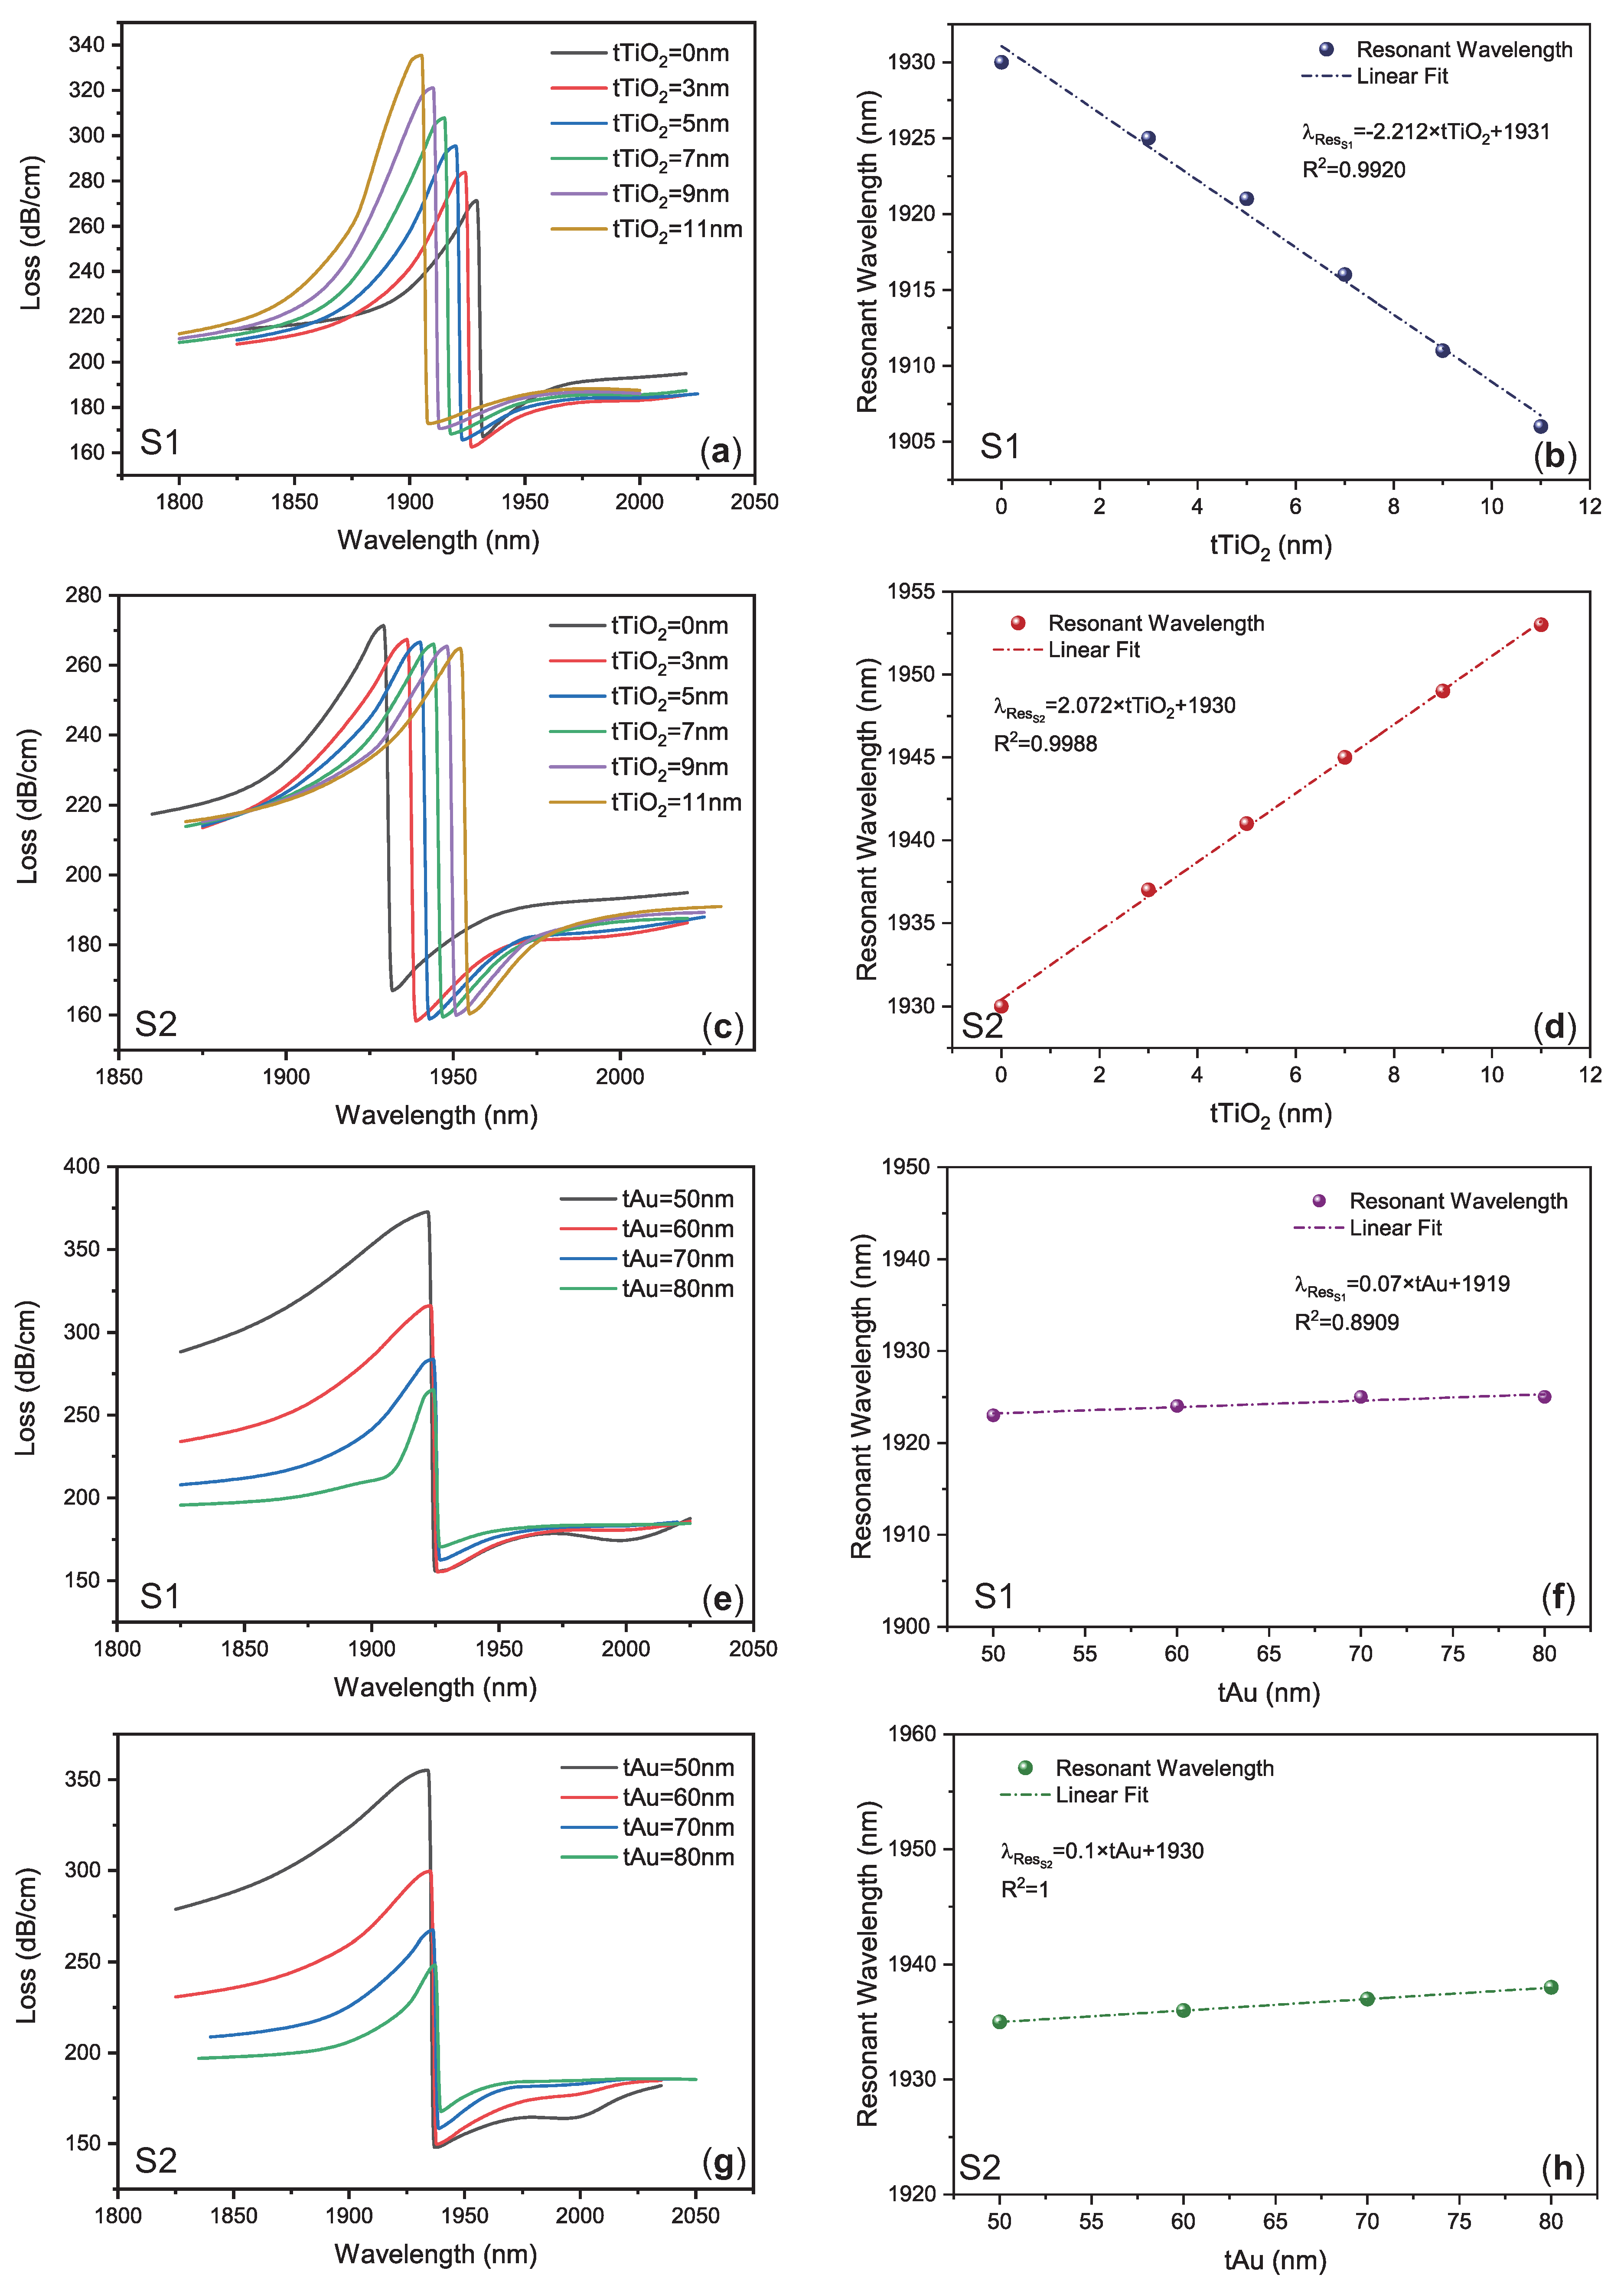
3.2. Influence of Silica-Web Thickness on LRSPR

Secondly, how the LRSPR peak wavelength is affected by the silica-web thickness d is evaluated by varying the thickness from 200 nm to 600 nm with a step of 100 nm. With the increment of silica-web thickness, the resonant wavelength shifts to the longer wavelength as shown in Figure 4a. Similar to the pitch, the influence of silica-web thickness on the resonant wavelength is also related to the fiber’s core size. As silica-web thickness increases, the core size will increase accordingly, resulting in the red shift of the LRSPR peak. The tendency of the resonant wavelength with respect to the silica-web thickness is almost linear, as shown in Figure 4b.

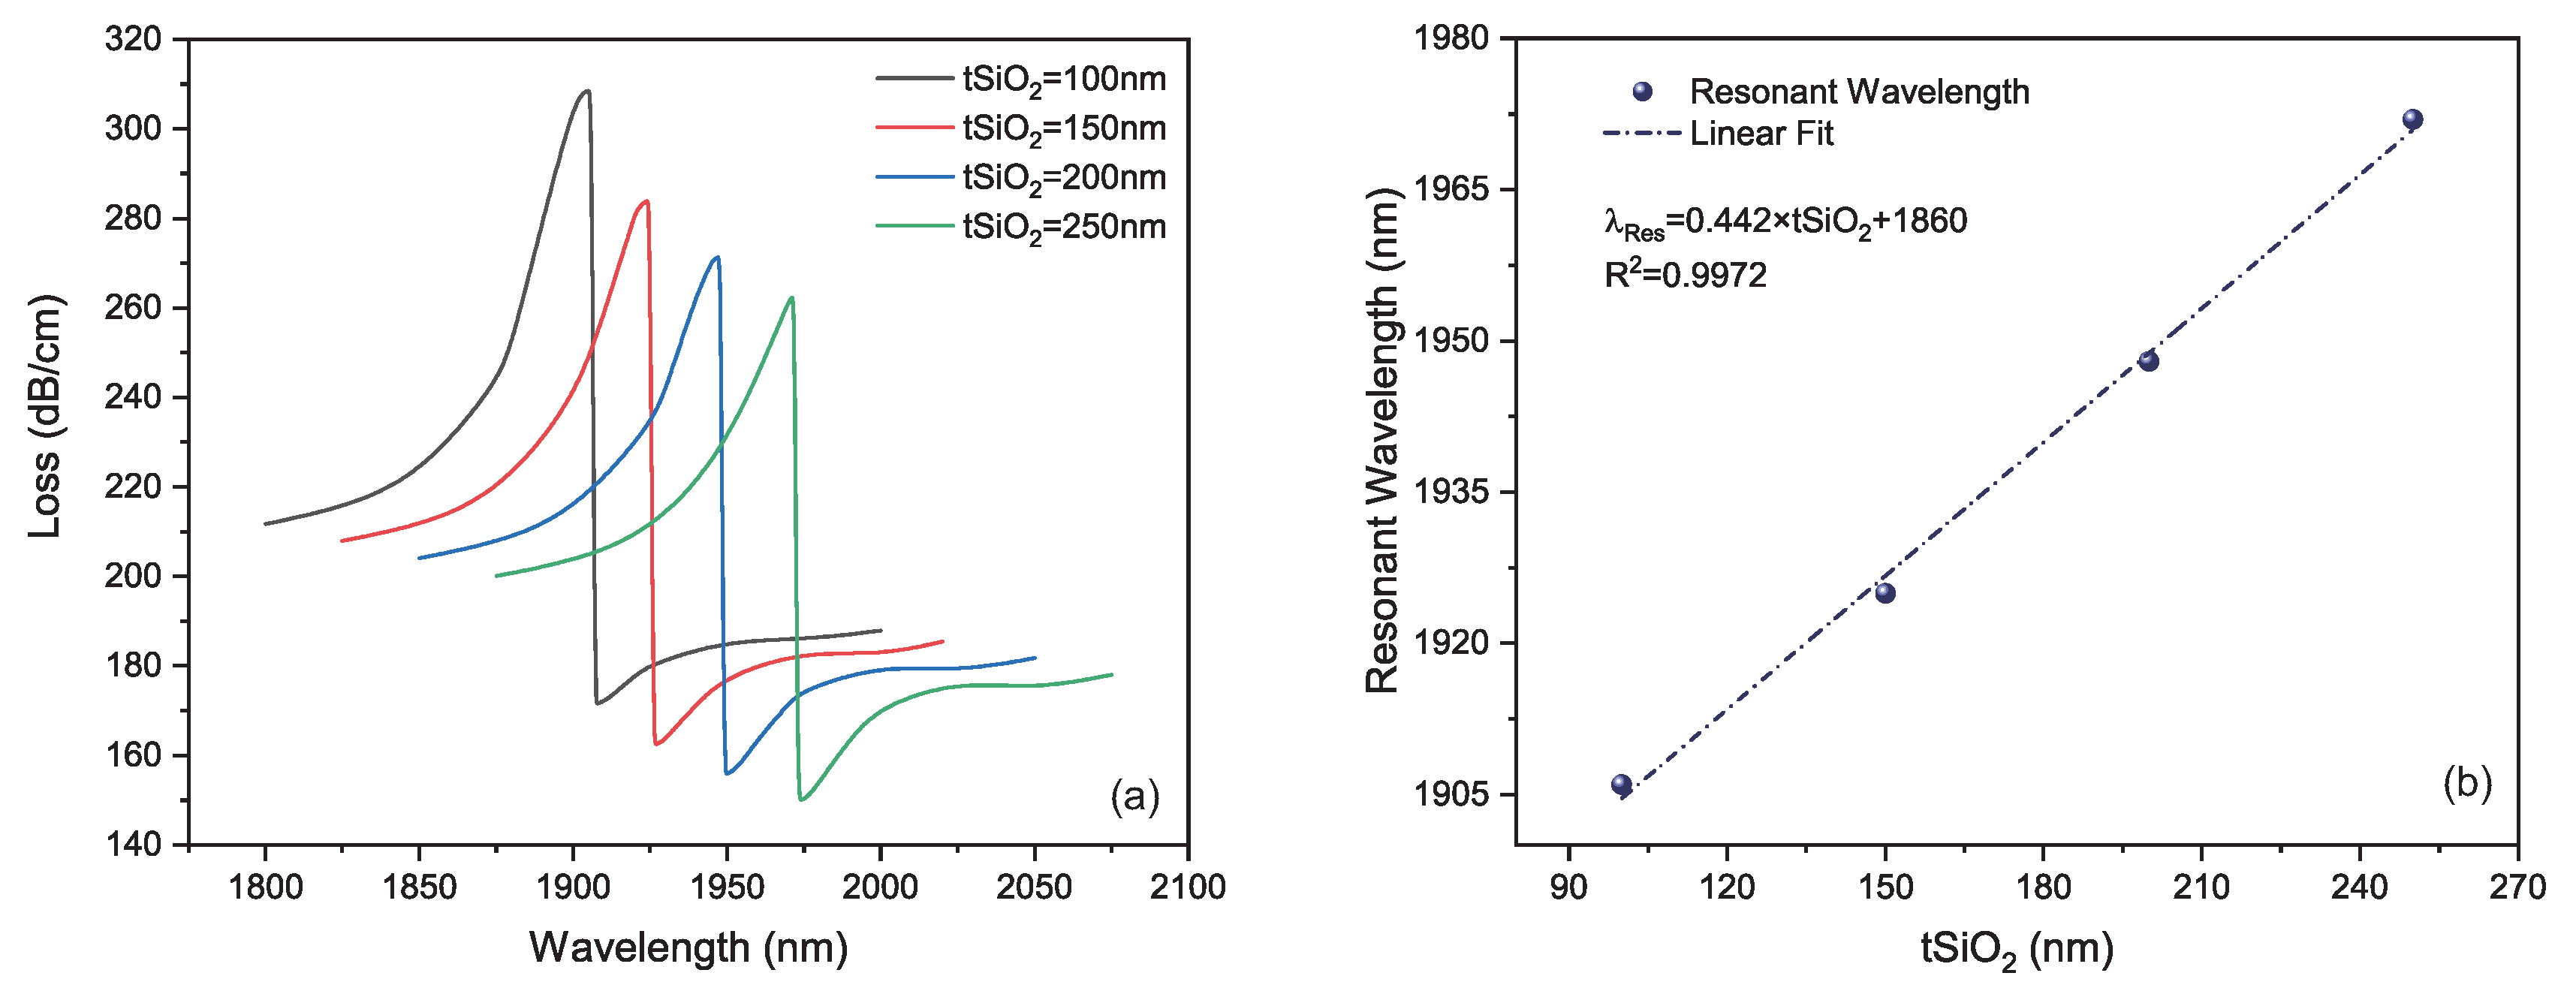
3.3. Influence of Planar-Silica Thickness on LRSPR
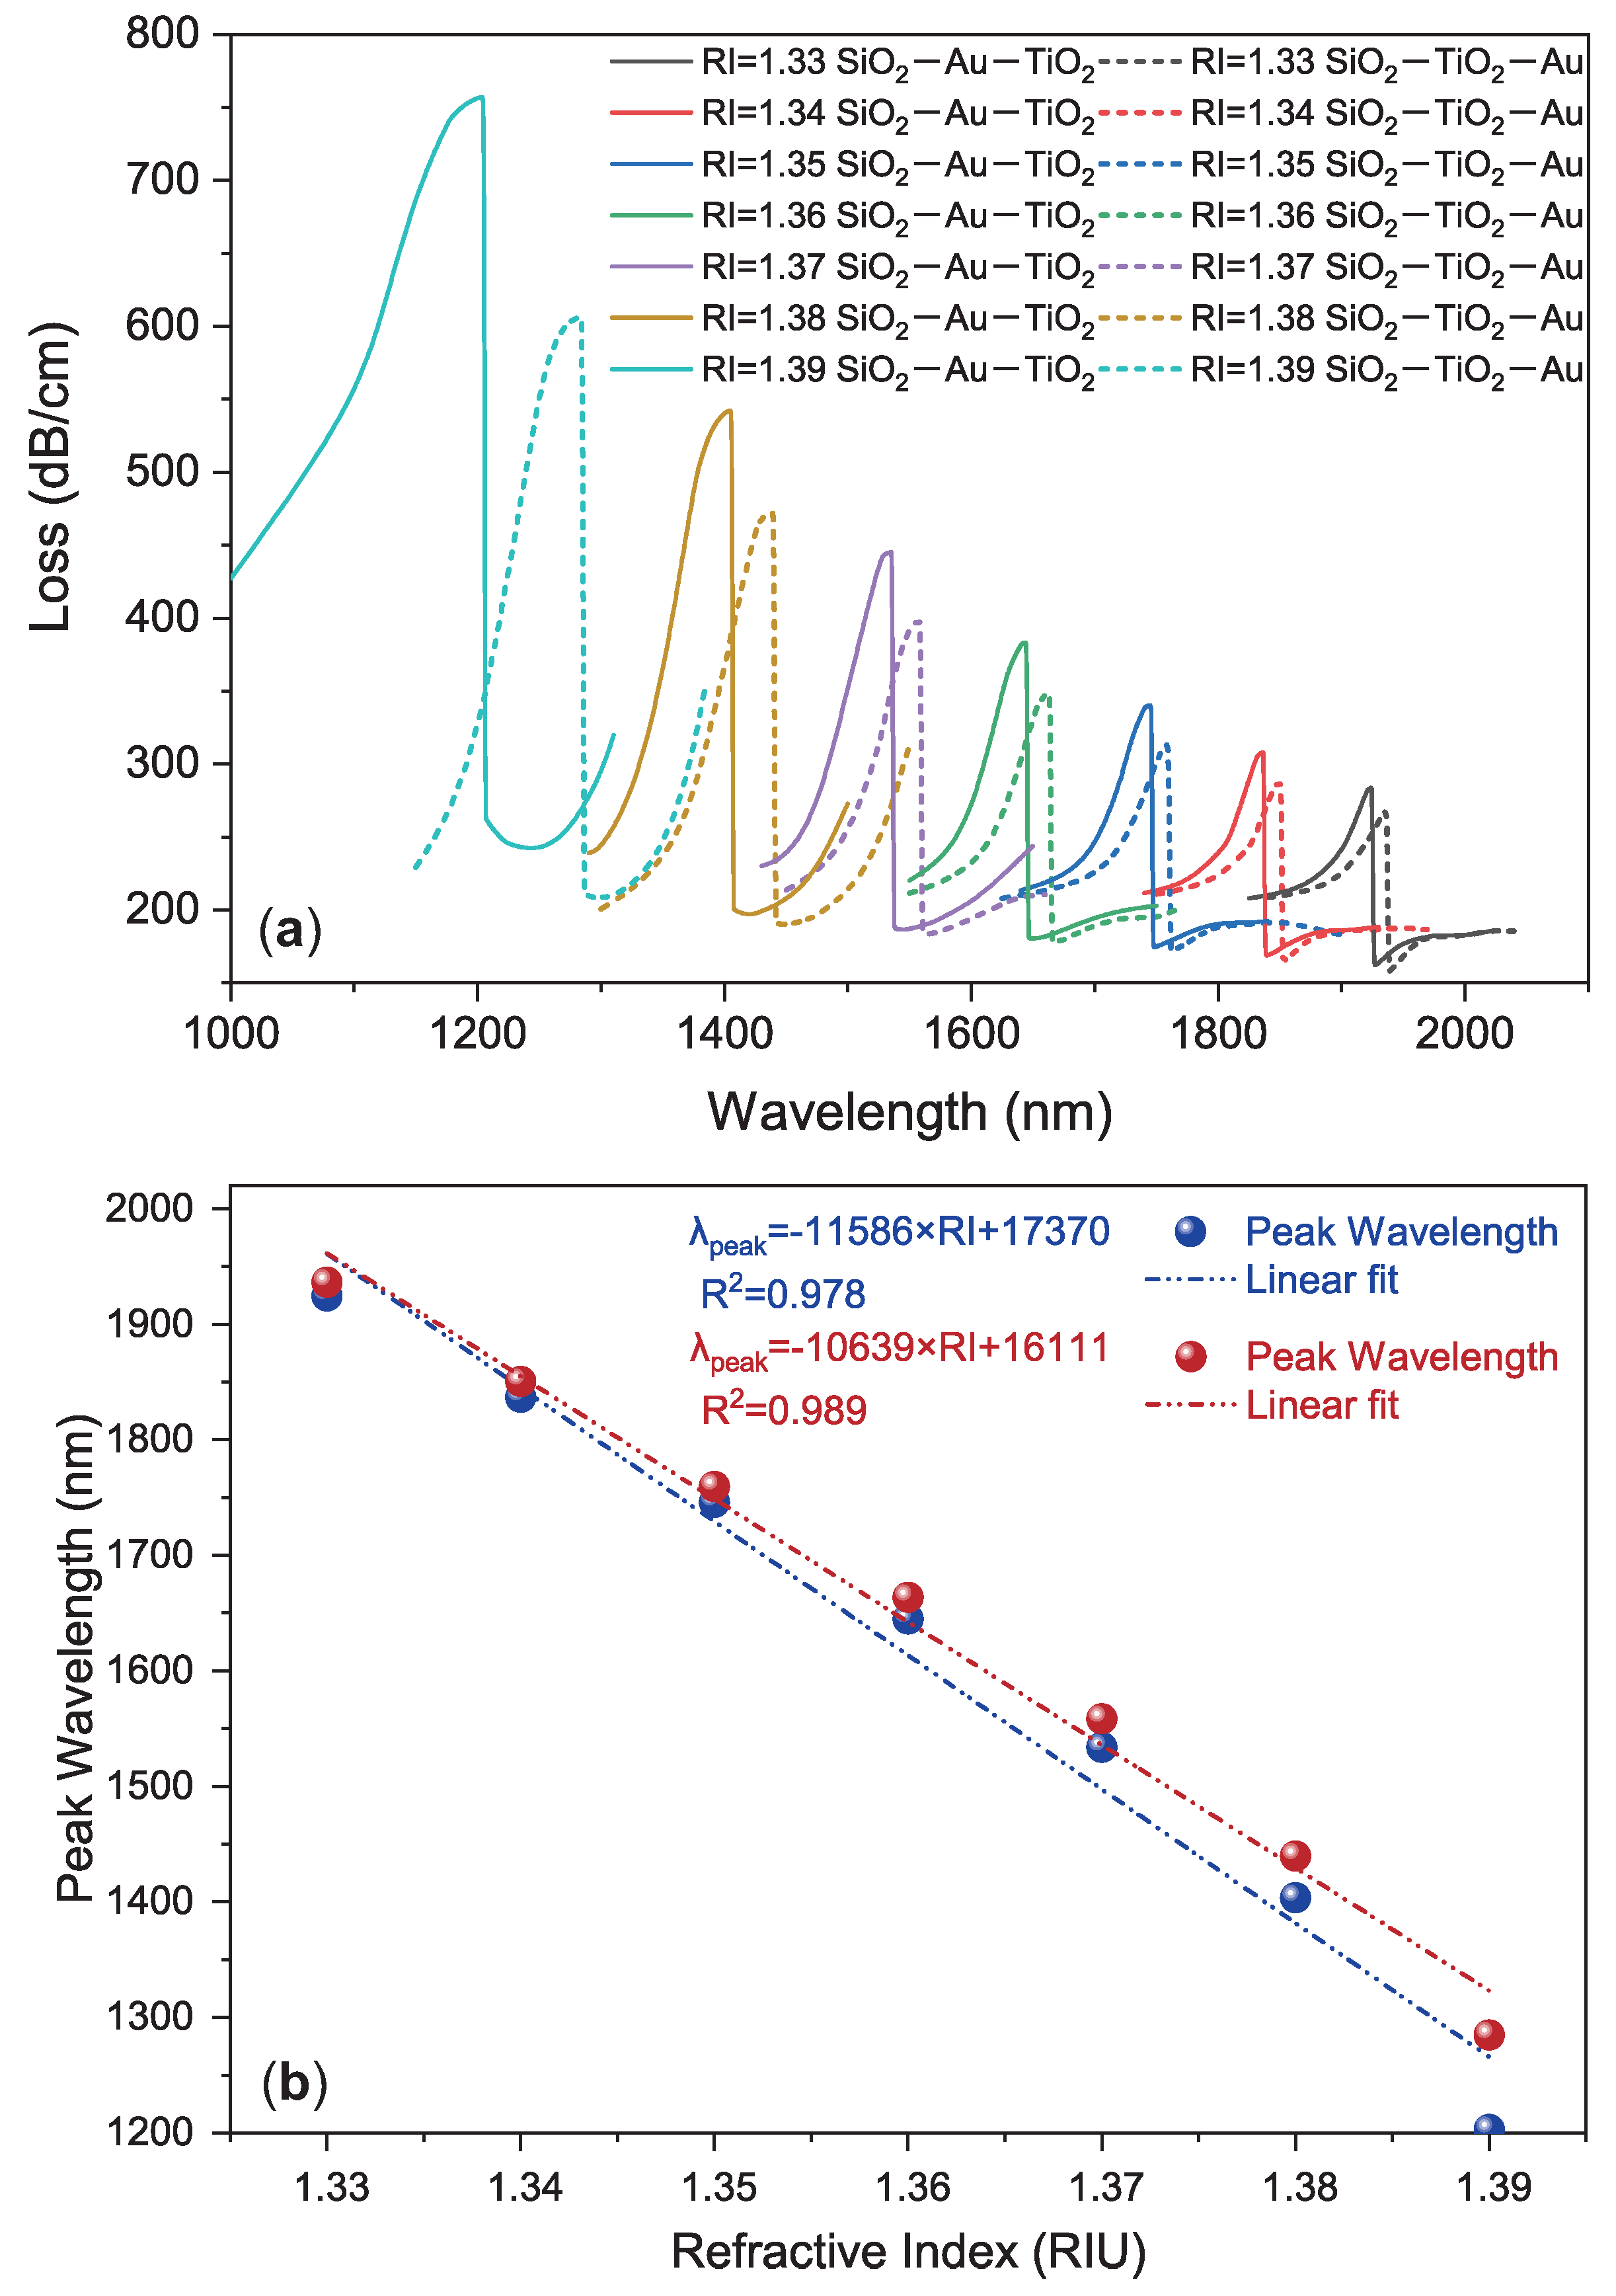
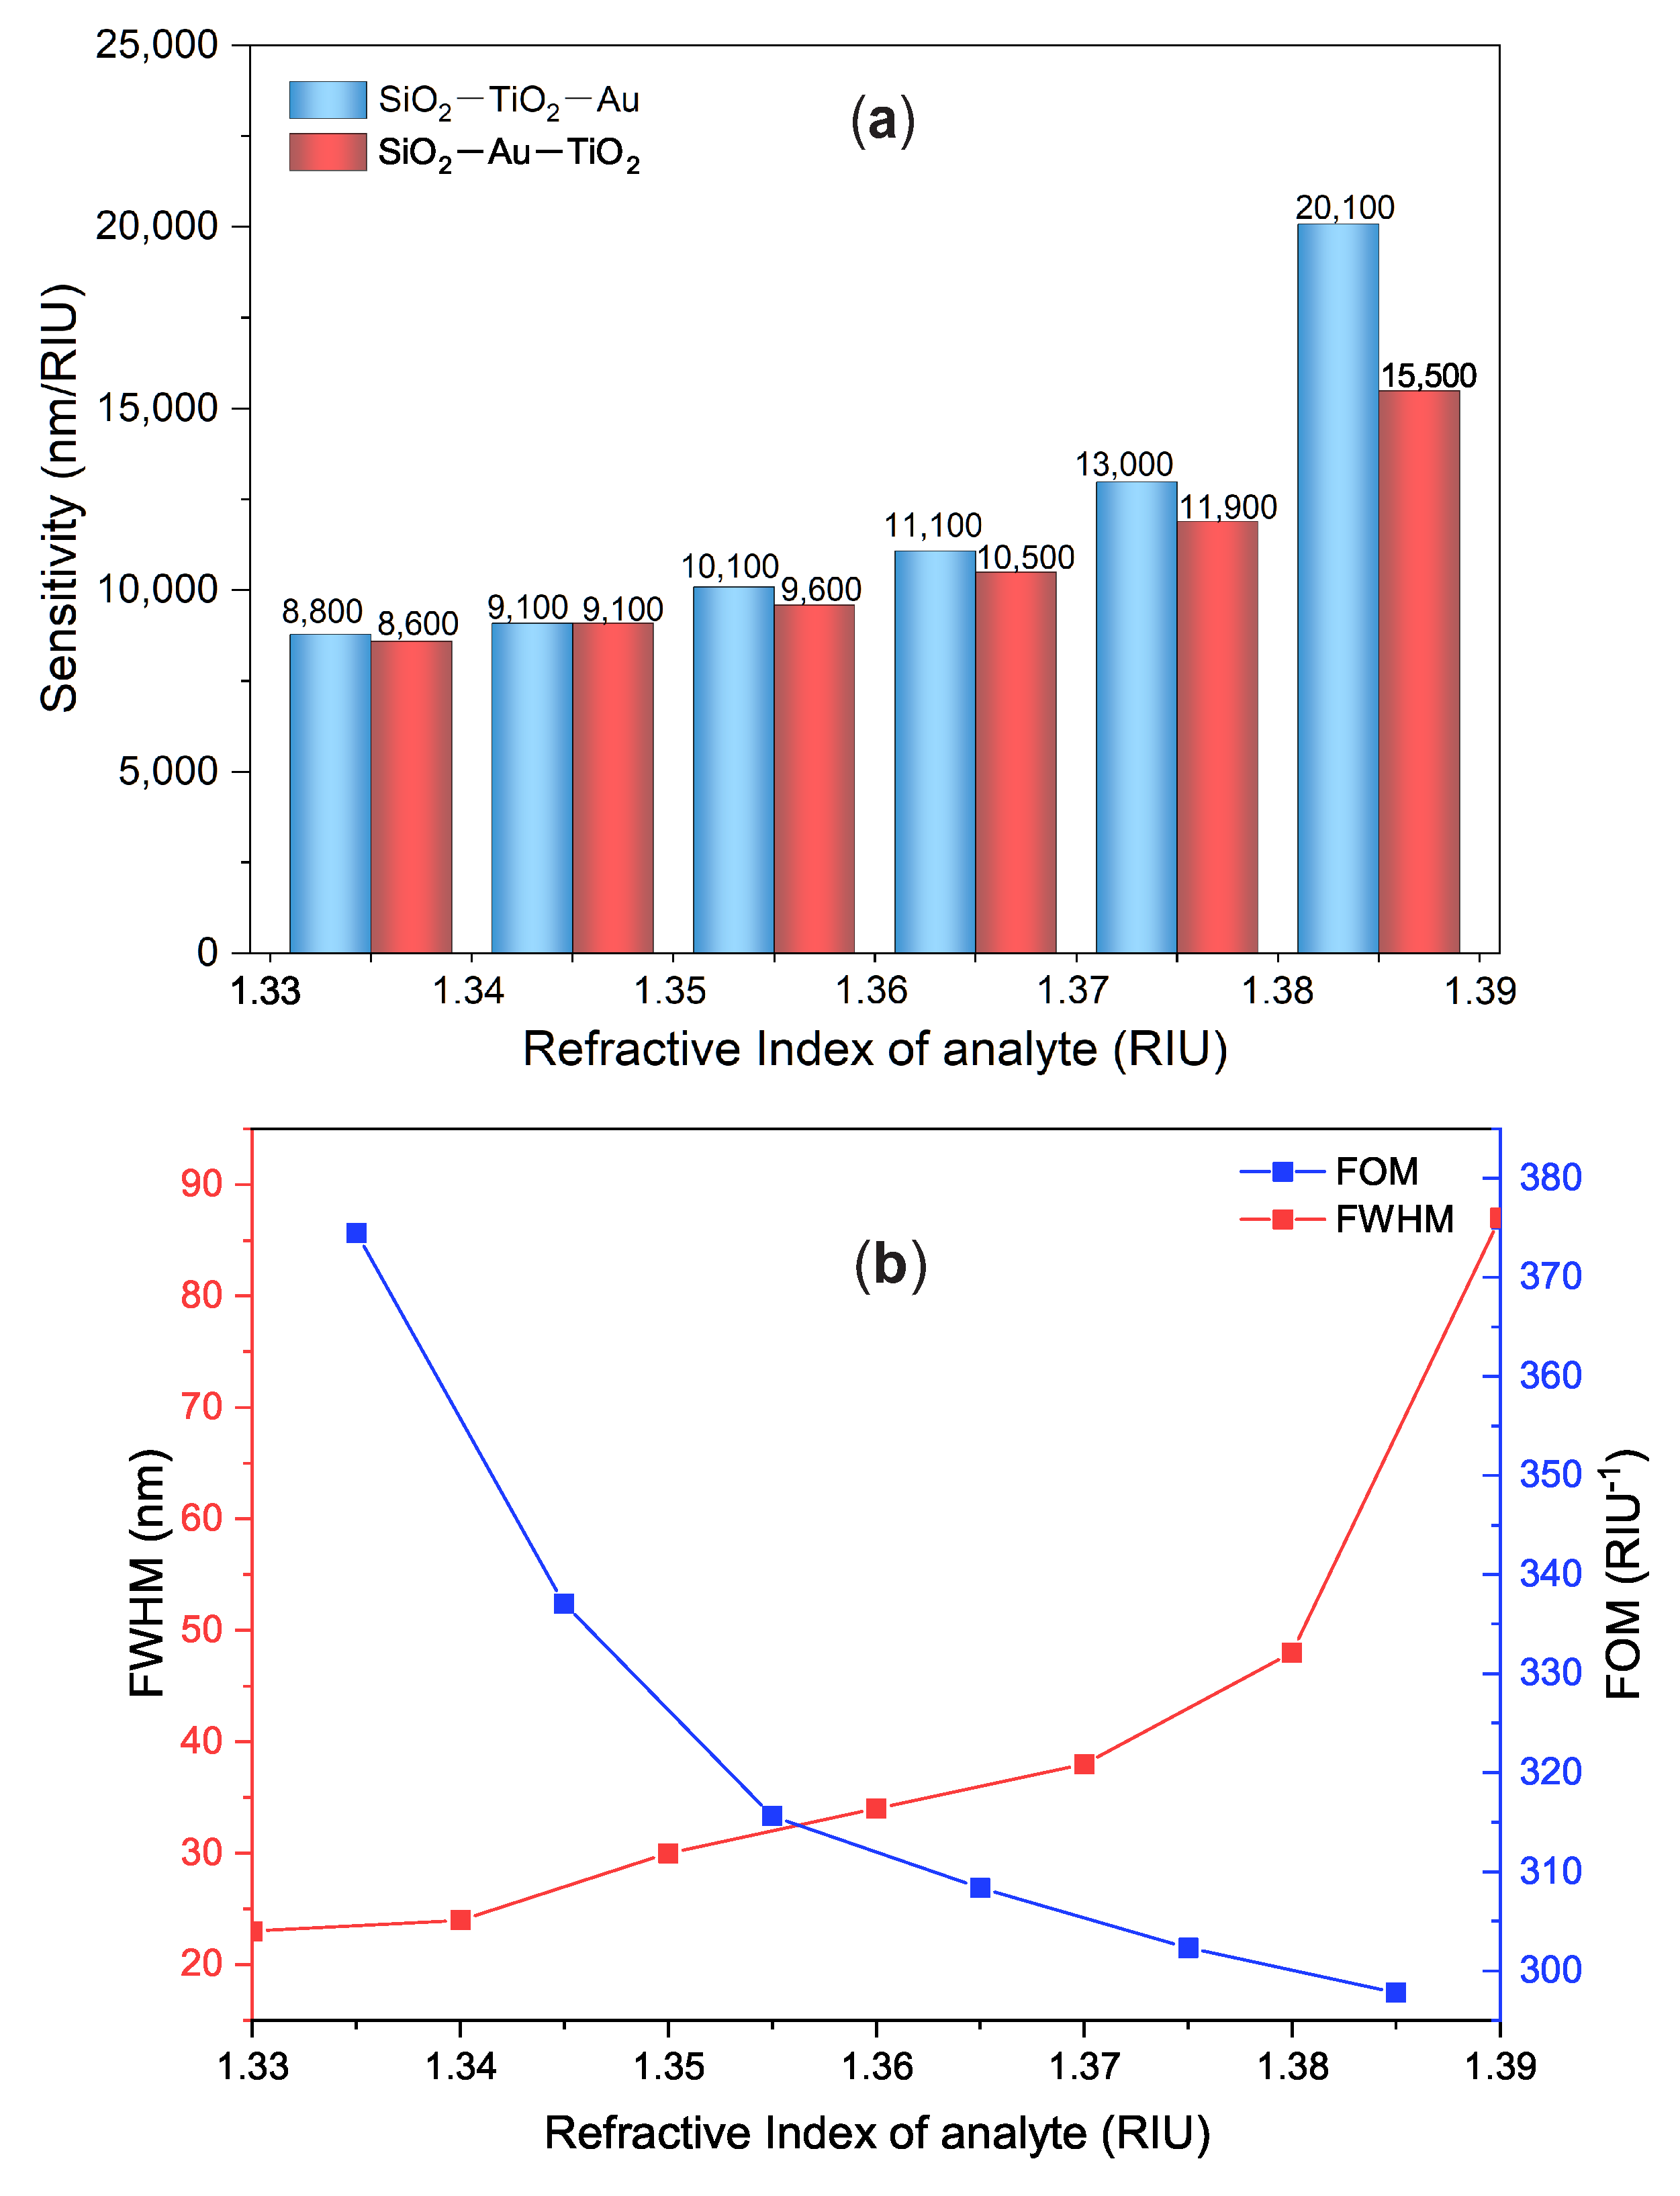
In our proposed model, the planar silica layer acts not only as the flat plane for depositing gold film, but also contributes to the LRSPR excitation. Figure 5a shows that the resonant peak shifts to the shorter wavelength as the thickness of planar-layer silica decreases from 250 nm to 100 nm with a step of 50 nm. The wavelength of the resonant peak shows a linear relationship with respect to the thickness of the planar-layer silica, as shown in Figure 5b. The impact of the planar-silica thickness on the resonance can be attributed to the variation of the MOF’s core size as well. In other words, when the thickness of the planar silica is decreased but the MOF’s pitch and silica-web thickness are fixed, the core size will still decrease accordingly, causing the blue shift of the LRSPR peak. Moreover, the FWHM becomes larger as the thickness of the silica layer decreases, which means the FWHM can be tuned by changing the thickness of the planar-layer silica.

3.4. Comparison between SiO 2 -Au-TiO 2 and SiO 2 -TiO 2 -Au Heterostructures

In order to figure out how a thin-layer dielectric affects the LRSPR resonance, we designed the device with different heterostructures: SiO 2 -Au-TiO 2 and SiO 2 -TiO 2 -Au. They are respectively denoted as S1 and S2 in short. In the first design, that is, S1, the Au film is deposited on the surface of the planar-layer silica and then coated with a layer of TiO 2 to protect the metal film. In S2, on the contrary, the planar-layer silica of D-shaped fiber is first coated with the TiO 2 layer and then plated with the gold film. Here, the TiO 2 layer is considered an adhesive layer between the waveguide and gold film to enhance the attachment of the metal film on waveguide surface. For the convenience of comparison, the parameters of the waveguide are fixed as follows: Λ = 2600 nm, d = 500 nm, t SiO 2 = 150 nm.
As shown in Figure 6a,c, both these heterostructures can be used to excite LRSPR, but the resonant wavelengths in S1 and S2 show a different tendency. By increasing the thickness of the TiO 2 layer from 0 to 11 nm, the resonant wavelength of the LRSPR sensor made of the S1 structure shifts towards the shorter wavelengths as shown in Figure 6b, whereas the LRSPR peak wavelength of the S2 configuration moves to the longer wavelength, as shown in Figure 6d, when the TiO 2 layer is becoming thicker. Based on effective medium theory, the TiO 2 layer can be treated as a part of a waveguide in the S2 configuration. It will help to increase the n eff of the core mode since the material RI of TiO 2 is higher than that of SiO 2 for the same wavelength. This indicates that the resonance occurs at longer wavelengths as the thickness of the TiO 2 layer increases. On the contrary, the contribution of the TiO 2 layer lies in increasing the n eff of LRSPP mode in the S1 heterostructure, pushing the phase matching towards the shorter wavelength. Moreover, the amplitude of the resonant peak in the S1 structure is enhanced as well with the assistance of the TiO 2 layer.
Figure 6e,g illustrates the influence of the Au-film thickness on the LRSPR in two heterostructures. As shown, the resonant peaks in both S1 and S2 configurations shift very slightly when the thickness of Au film is increased from 50 nm to 80 nm. Their corresponding dependence of the peak wavelength is no more than 1 nm when the thickness of the Au film varies 10 nm. From the device fabrication point of view, the requirement of the coating process for the proposed sensor will not be as critical as it is for conventional SPR devices. Meanwhile, as the the thickness of the Au film increases, the resonance coupling between the upper and lower parts of the gold layer is weakened, leading to the decrement of the FWHM and amplitude in both heterostructures.
A further comparison of sensing performance between S1 and S2 heterostructures is addressed by following the variation of their resonant peak wavelengths under different analytes. The thicknesses of the Au film and the TiO 2 layer are set to 70 nm and 3 nm, respectively. By increasing the analyte’s RI from 1.33 to 1.39, as shown in Figure 7a, the resonant peaks of both heterostructures undergo blue shifts. However, it is apparent that the wavelength shifts in S1 are larger than those in S2. This indicates that the sensor based on the S1 heterostructure has a higher sensitivity to ambient RI than does the S2 based sensor. Their average sensitivities within the RI range from 1.33 to 1.39, as the linearly fitting curves show in Figure 7b, are about 11,586 nm/RIU and 10,639 nm/RIU, respectively. The corresponding average resolutions are about 8.63 × 10 7 RIU and 9.40 × 10 7 RIU, respectively, based on Equation (6).
Additionally, their wavelength sensitivities are recalculated piecewise based on Equation (5), as the bar chart shown in Figure 8a. Both of them increase monotonically for higher RI interval. The maximum sensitivity reaches 20,100 nm/RIU for S1 based sensor, while that of S2 based sensor is about 15,500 nm/RIU. The corresponding minimum resolutions are about 4.98 × 10 7 RIU and 6.45 × 10 7 RIU, respectively. The LRSPR sensor based on SiO 2 -Au-TiO 2 heterostructure is found with a superior performance as a RI sensor. Its FWHM and FOM are calculated and plotted in Figure 8b. In the Figure, the FWHM is defined as the average of the FWHMs of adjacent two resonant peaks as shown in red curve and the corresponding FOMs are drawn as well and shown as the blue curve. The highest FOM is of 374 RIU 1 , achieved in the RI range of 1.33–1.34.

3.5. Sensing Performance Comparison with Previous LRSPR-Based Fiber Sensors

Finally, the performance of the proposed LRSPR sensor is compared with those recently-reported LRSPR-based fiber sensors. As shown in Table 1, the LRSPR sensor proposed in this work exhibits a very competitive performance. It has advantages such as higher sensitivity, higher FOM and lower resolution.

4. Conclusions

In summary, an LRSPR sensor based on a SiO 2 -Au-TiO 2 heterostructure on a D-shaped MOF is proposed and numerically investigated. The specialty D-shaped silica MOF is designed with a honeycomb structure, which is arranged with hexagonal air holes and a solid silica core. By means of advanced fiber fabrication and post-processing techniques, part of the cladding is removed and then a plane silica surface is generated due to surface tension during the fiber drawing. Then, the planar surface of the D-shaped MOF is coated in a layer of Au film followed by a thin-layer TiO 2 film, forming the SiO 2 -Au-TiO 2 heterostructure. In this heterostructure, a strong LRSPR is achieved when the n eff of the fundamental core mode is comparable with the material RI of the analyte. Based on a series of detailed discussions about the structural parameters, the resonant wavelength is highly related to the MOF’s core size but is affected trivially by the thickness of the Au film. Furthermore, through the comparison between SiO 2 -Au-TiO 2 and SiO 2 -TiO 2 -Au heterostructures, the former shows higher wavelength sensitivity with the analyte’s RI varying from 1.33 to 1.39. Its maximum and average sensitivities reach 20,100 nm/RIU and 11,586 nm/RIU, respectively. The corresponding minimum resolution is as low as 4.98 × 10 7 RIU. Finally, compared with the LRSPR based RI sensor reported recently, our design is characterized by high sensitivity and low resolution. Therefore, the proposed LRSPR sensor might find significant potential for high-sensitivity detection in biomedicine and biochemical fields.

Author Contributions

Conceptualization, Z.W. and W.B.; methodology, Z.W.; software, X.S. and P.P.S.; formal analysis, Z.W. and W.B.; investigation, Z.W. and W.B.; resources, X.S., P.P.S. and J.P.; writing—original draft preparation, W.B. and Z.W.; writing—review and editing, Z.W. and W.B.; supervision, Z.W., X.S., P.P.S. and J.P.; project administration, Z.W.; funding acquisition, Z.W. and J.P. All authors have read and agreed to the published version of the manuscript.

Funding

This work is partially supported by National Natural Science Foundation of China (11774102), the Scientific Research Funds and Promotion Program for Young and Middle-aged Teacher in Science and Technology Research of Huaqiao University (ZQN-YX504, 17BS412).

Institutional Review Board Statement

Not applicable.

Informed Consent Statement

Not applicable.

Conflicts of Interest

The authors declare no conflict of interest.

References

  1. Rahman, M.S.; Anower, M.S.; Hasan, M.R.; Hossain, M.B.; Haque, M.I. Design and numerical analysis of highly sensitive Au-MoS2-graphene based hybrid surface plasmon resonance biosensor. Opt. Commun. 2017, 396, 36–43. [Google Scholar] [CrossRef]
  2. Noman, A.A.; Haque, E.; Hossain, M.A.; Hai, N.H.; Namihira, Y.; Ahmed, F. Sensitivity enhancement of modified D-shaped microchannel PCF-based surface plasmon resonance sensor. Sensors 2020, 20, 6049. [Google Scholar] [CrossRef] [PubMed]
  3. Rifat, A.A.; Ahmed, R.; Mahdiraji, G.A.; Adikan, F.R.M. Highly sensitive D-shaped photonic crystal fiber-based plasmonic, biosensor in visible to Near-IR. IEEE Sens. J. 2017, 17, 2776–2783. [Google Scholar] [CrossRef]
  4. Shui, X.; Gu, Q.; Jiang, X.; Si, G. Surface plasmon resonance sensor based on polymer liquid-core fiber for refractive index detection. Photonics 2020, 7, 123. [Google Scholar] [CrossRef]
  5. Zynio, S.; Samoylov, A.; Surovtseva, E.; Mirsky, V.; Shirshov, Y. Bimetallic layers increase sensitivity of affinity sensors based on surface plasmon resonance. Sensors 2002, 2, 62–70. [Google Scholar] [CrossRef] [Green Version]
  6. Kashyap, R.; Chakraborty, S.; Zeng, S.; Swarnakar, S.; Kaur, S.; Doley, R.; Mondal, B. Enhanced Biosensing activity of bimetallic surface plasmon resonance sensor. Photonics 2019, 6, 108. [Google Scholar] [CrossRef] [Green Version]
  7. Ong, B.H.; Yuan, X.; Tjin, S.C.; Zhang, J.; Ng, H.M. Optimised film thickness for maximum evanescent field enhancement of a bimetallic film surface plasmon resonance biosensor. Sens. Actuators B Chem. 2006, 114, 1028–1034. [Google Scholar] [CrossRef]
  8. Liu, C.; Wang, J.; Wang, F.; Su, W.; Yang, L.; Lv, J.; Fu, G.; Li, X.; Liu, Q.; Sun, T.; et al. Surface plasmon resonance (SPR) infrared sensor based on D-shape photonic crystal fibers with ITO coatings. Opt. Commun. 2020, 464, 125496. [Google Scholar] [CrossRef]
  9. Gonzalez-Valencia, E.; Villar, I.D.; Torres, P. Novel Bloch wave excitation platform based on few-layer photonic crystal deposited on D-shaped optical fiber. Sci. Rep. 2021, 11, 11266. [Google Scholar] [CrossRef]
  10. Shafkat, A.; Rashed, A.N.Z.; El-Hageen, H.M.; Alatwi, A.M. The effects of adding different adhesive layers with a micro-structure fiber sensor based on surface plasmon resonance: A Numerical Study. Plasmonics 2021, 16, 819–832. [Google Scholar] [CrossRef]
  11. Wang, X.; Wang, Q.; Song, Z.; Qi, K. Simulation of a microstructure fiber pressure sensor based on lossy mode resonance. AIP Adv. 2019, 9, 095005. [Google Scholar]
  12. Takagi, K.; Watanabe, K. Near infrared characterization of hetero-core optical fiber SPR sensors coated with Ta2O5 film and their applications. Sensors 2012, 12, 2208–2218. [Google Scholar] [CrossRef] [PubMed] [Green Version]
  13. Sharma, A.K.; Dominic, A.; Kaur, B.; Popescu, V.A. Fluoride fiber sensor with huge performance enhancement via optimum radiative damping at Ag–Al2O3–Graphene heterojunction on silicon. J. Light. Technol. 2019, 37, 5641–5646. [Google Scholar] [CrossRef]
  14. Azad, S.; Sadeghi, E.; Parvizi, R.; Mazaheri, A.; Yousefi, M. Sensitivity optimization of ZnO clad-modified optical fiber humidity sensor by means of tuning the optical fiber waist diameter. Opt. Laser Technol. 2017, 90, 96–101. [Google Scholar] [CrossRef]
  15. Hosoki, A.; Nishiyama, M.; Igawa, H.; Seki, A.; Choi, Y.; Watanabe, K. A surface plasmon resonance hydrogen sensor using Au/Ta2O5/Pd multi-layers on hetero-core optical fiber structures. Sens. Actuators B Chem. 2013, 185, 53–58. [Google Scholar] [CrossRef]
  16. Del Villar, I.; Zamarreno, C.R.; Hernaez, M.; Arregui, F.J.; Matias, I.R. Lossy mode resonance generation with indium-tin-oxide-coated optical fibers for densing applications. J. Light. Technol. 2010, 28, 111–117. [Google Scholar] [CrossRef] [Green Version]
  17. Kaur, D.; Sharma, V.K.; Kapoor, A. High sensitivity lossy mode resonance sensors. Sens. Actuators B Chem. 2014, 198, 366–376. [Google Scholar] [CrossRef]
  18. Paul, A.K.; Mollah, M.A.; Hassan, M.Z.; Gomez-Cardona, N.; Reyes-Vera, E. Graphene-coated highly sensitive photonic crystal fiber surface plasmon resonance sensor for aqueous solution: Design and numerical analysis. Photonics 2021, 8, 155. [Google Scholar] [CrossRef]
  19. Zeng, S.; Hu, S.; Xia, J.; Anderson, T.; Dinh, X.; Meng, X.; Coquet, P.; Yong, K. Graphene–MoS2 hybrid nanostructures enhanced surface plasmon resonance biosensors. Sens. Actuators B Chem. 2015, 207, 801–810. [Google Scholar] [CrossRef]
  20. Sharma, A.K.; Kaur, B.; Popescu, V.A. On the role of different 2D materials/heterostructures in fiber-optic SPR humidity sensor in visible spectral region. Opt. Mater. 2020, 102, 109824. [Google Scholar] [CrossRef]
  21. Berini, P. Long-range surface plasmon polaritons. Adv. Opt. Photonics 2009, 1, 484–588. [Google Scholar] [CrossRef]
  22. Jing, J.; Wang, Q.; Zhao, W.; Wang, B. Long-range surface plasmon resonance and its sensing applications: A review. Opt. Laser Eng. 2019, 112, 103–118. [Google Scholar] [CrossRef]
  23. Liu, F.; Li, Y.; Wan, R.; Huang, Y.; Feng, X.; Zhang, W. Hybrid coupling between long-range surface plasmon polariton mode and dielectric waveguide mode. J. Light. Technol. 2011, 29, 1265–1273. [Google Scholar] [CrossRef]
  24. Berini, P. Plasmon-polariton modes guided by a metal film of finite width bounded by different dielectrics. Opt. Express 2000, 7, 329–335. [Google Scholar] [CrossRef] [PubMed]
  25. Vala, M.; Robelek, R.; Bocková, M.; Wegener, J.; Homola, J. Real-time label-free monitoring of the cellular response to osmotic stress using conventional and long-range surface plasmons. Biosens. Bioelectron. 2013, 40, 417–421. [Google Scholar] [CrossRef]
  26. Vala, M.; Etheridge, S.; Roach, J.A.; Homola, J. Long-range surface plasmons for sensitive detection of bacterial analytes. Sens. Actuators B Chem. 2009, 139, 59–63. [Google Scholar] [CrossRef]
  27. Chen, X.; Bu, W.; Wu, Z.; Zhang, H.; Shum, P.P.; Shao, X.; Pu, J. Near-infrared long-range surface plasmon resonance in a D-shaped honeycomb microstructured optical fiber coated with Au film. Opt. Express 2021, 29, 16455–16468. [Google Scholar] [CrossRef]
  28. Wang, H.; Rao, W.; Luo, J.; Fu, H. A dual-channel surface plasmon resonance sensor based on dual-polarized photonic crystal fiber for ultra-wide range and high sensitivity of refractive index detection. IEEE Photonics J. 2021, 13, 1–11. [Google Scholar]
  29. Hossain, M.A.; Namihira, Y.; Islam, M.A.; Razzak, S.M.A.; Hirako, Y.; Miyagi, K.; Kaijage, S.F.; Higa, H. Tailoring supercontinuum generation using highly nonlinear photonic crystal fiber. Opt. Laser Technol. 2012, 44, 1889–1896. [Google Scholar] [CrossRef]
  30. Sehmi, H.S.; Langbein, W.; Muljarov, E.A. Optimizing the Drude-Lorentz model for material permittivity: Method, program, and examples for gold, silver, and copper. Phys. Rev. B 2017, 95, 115444. [Google Scholar] [CrossRef] [Green Version]
  31. Vial, A.; Grimault, A.; Macias, D.; Barchiesi, D.; De la Chapelle, M.L. Improved analytical fit of gold dispersion: Application to the modeling of extinction spectra with a finite-difference time-domain method. Phys. Rev. B 2005, 71, 85411–85416. [Google Scholar] [CrossRef]
  32. Zhang, N.; Humbert, G.; Gong, T.; Shum, P.P.; Li, K.; Auguste, J.; Wu, Z.; Hu, D.J.J.; Luan, F.; Dinh, Q.X.; et al. Side-channel photonic crystal fiber for surface enhanced Raman scattering sensing. Sens. Actuators B Chem. 2016, 223, 195–201. [Google Scholar] [CrossRef]
  33. Zhang, N.M.Y.; Li, K.; Shum, P.P.; Yu, X.; Zeng, S.; Wu, Z.; Wang, Q.J.; Yong, K.T.; Wei, L. Hybrid graphene/gold plasmonic fiber-optic biosensor. Adv. Mater. Technol. 2017, 2, 1600185. [Google Scholar] [CrossRef]
  34. Wu, T.; Shao, Y.; Wang, Y.; Cao, S.; Cao, W.; Zhang, F.; Liao, C.; He, J.; Huang, Y.; Huang, M.; et al. Surface plasmon resonance biosensor based on gold-coated side-polished hexagonal structure photonic crystal fiber. Opt. Express 2017, 25, 20313–20322. [Google Scholar] [CrossRef] [Green Version]
  35. Xie, Q.; Chen, Y.; Li, X.; Yin, Z.; Wang, L.; Geng, Y.; Hong, X. Characteristics of D-shaped photonic crystal fiber surface plasmon resonance sensors with different side-polished lengths. Appl. Opt. 2017, 56, 1550–1555. [Google Scholar] [CrossRef]
  36. Zhang, N.M.Y.; Hu, D.J.J.; Shum, P.P.; Wu, Z.; Li, K.; Huang, T.; Wei, L. Design and analysis of surface plasmon resonance sensor based on high-birefringent microstructured optical fiber. J. Opt. 2016, 18, 65005. [Google Scholar] [CrossRef]
  37. Klantsataya, E.; François, A.; Ebendorff-Heidepriem, H.; Hoffmann, P.; Monro, T. Surface plasmon scattering in exposed core optical fiber for enhanced resolution refractive index sensing. Sensors 2015, 15, 25090–25102. [Google Scholar] [CrossRef] [Green Version]
  38. Morales-Luna, G.; Herrera-Domínguez, M.; Pisano, E.; Balderas-Elizalde, A.; Hernandez-Aranda, R.I.; Ornelas-Soto, N. Plasmonic biosensor based on an effective medium theory as a simple tool to predict and analyze refractive index changes. Opt. Laser Technol. 2020, 1314, 106332. [Google Scholar] [CrossRef]
  39. Tuniz, A.; Wieduwilt, T.; Schmidt, M.A. Tuning the effective PT phase of plasmonic eigenmodes. Phys. Rev. Lett. 2019, 123, 213903. [Google Scholar] [CrossRef] [PubMed] [Green Version]
  40. Haque, E.; Hossain, M.A.; Ahmed, F.; Namihira, Y. Surface plasmon resonance sensor based on modified D-shaped photonic crystal fiber for wider range of refractive index detection. IEEE Sens. J. 2018, 18, 8287–8293. [Google Scholar] [CrossRef]
  41. Dong, J.; Zhang, Y.; Wang, Y.; Yang, F.; Hu, S.; Chen, Y.; Zhu, W.; Qiu, W.; Guan, H.; Lu, H.; et al. Side-polished few-mode fiber based surface plasmon resonance biosensor. Opt. Express 2019, 27, 11348–11360. [Google Scholar] [CrossRef] [PubMed]
  42. Momota, M.R.; Hasan, M.R. Hollow-core silver coated photonic crystal fiber plasmonic sensor. Opt. Mater. 2018, 76, 287–294. [Google Scholar] [CrossRef]
  43. Zhao, X.; Zhang, X.; Zhu, X.; Shi, Y. Long-range surface plasmon resonance sensor based on the GK570/Ag coated hollow fiber with an asymmetric layer structure. Opt. Express 2019, 27, 9550–9560. [Google Scholar] [CrossRef]
  44. Gomez-Cardona, N.; Reyes-Vera, E.; Torres, P. High sensitivity refractive index sensor based on the excitation of long-range surface plasmon polaritons in H-shaped optical fiber. Sensors 2020, 20, 2111. [Google Scholar] [CrossRef] [Green Version]
  45. Jing, J.; Li, S.; Wang, X.; Zhu, Q.; Meng, F.; Wang, Q. A D-type fiber based symmetrical long-range surface plasmon resonance sensor with high quality factor. Measurement 2019, 140, 395–406. [Google Scholar] [CrossRef]
  46. Ahmed, K.; AlZain, M.; Abdullah, H.; Luo, Y.; Vigneswaran, D.; Faragallah, O.; Eid, M.; Rashed, A. Highly sensitive twin resonance coupling refractive index sensor based on gold- and MgF2-coated nano metal films. Biosensors 2021, 11, 104. [Google Scholar] [CrossRef] [PubMed]
Figure 1. (a) Cross-sectional schematic structure of the D-shaped LRSPR refractive index sensor with SiO 2 -Au-TiO 2 structure. (b) Diagram for the experimental setup for sensor characterization. Λ denotes the pitch of MOF’s air-hole cladding; d denotes the thickness of silica web; t Au denotes the thickness of gold film; t TiO 2 denotes the thickness of the tin oxide film; t SiO 2 denotes the thickness of the planar silica layer; PML: perfectly-matched layer; OSA: optical spectrum analyzer.
Photonics 08 00379 g001
Figure 2. (a) Dispersion relationship (solid lines) and attenuation spectra (dot lines) of the core mode (blue), LRSPP mode (red). (b) The electric field profile along y axis of the LRSPP mode at 1900 nm. (ce) and (fh) are the electric field distributions of the core mode and LRSPP mode at the wavelength of 1900 nm, 1925 nm and 1950 nm, respectively. They illustrate the mode conversion around the avoided-crossing region. The red arrows in (ch) denote the directions of electric field.
Photonics 08 00379 g002
Figure 3. (a) The variation of loss spectrum with respect to different pitches of honeycomb structure cladding ( d = 500 nm, t SiO 2 = 150 nm, t Au = 70 nm, t TiO 2 = 3 nm, n a = 1.33 ). (b) The resonant wavelength and the corresponding linear fitting under different pitches of honeycomb structure cladding.
Photonics 08 00379 g003
Figure 4. (a) The variation of loss spectrum with respect to the change of the silica-web thickness ( Λ = 2600 nm, t SiO 2 = 150 nm, t Au = 70 nm, t TiO 2 = 3 nm, n a = 1.33 ); (b) The dependence between the resonant wavelength and the thickness of the silica web.
Photonics 08 00379 g004
Figure 5. (a) The variation of loss spectrum with respect to the change of the thickness of planar-layer silica ( Λ = 2600 nm, d = 500 nm, t Au = 70 nm, t TiO 2 = 3 nm, n a = 1.33 ); (b) The relationship between the resonant wavelength and the thickness of the planar-layer silica.
Photonics 08 00379 g005
Figure 6. (ad) The variation of loss spectrum and the corresponding peak wavelength with respect to the change of the thickness of TiO 2 film in S1 and S2, respectively ( Λ = 2600 nm, t SiO 2 = 150 nm, d = 500 nm, t Au = 70 nm, n a = 1.33 ). (eh) The variation of loss spectrum and the corresponding peak wavelength with respect to the change of the thickness of gold film in S1 and S2, respectively ( Λ = 2600 nm, t SiO 2 = 150 nm, d = 500 nm, t TiO 2 = 3 nm, n a = 1.33 ).
Photonics 08 00379 g006
Figure 7. (a) The variation of loss spectrum of two heterostructures with respect to the change of the analyte’s RI. (b) The wavelength sensitivities to analyte’s RI for S1 and S2 heterostructures.
Photonics 08 00379 g007
Figure 8. (a) The wavelength sensitivities of S1 and S2 heterostructures in each step of analyte’s RI; (b) The calculated FWHWs and FOMs of S1 and S2 in each step of analyte’s RI.
Photonics 08 00379 g008
Table 1. Comparison of the performance of the proposed sensor with recently reported LRSPR sensors.
DescriptionRI Range S λ (nm/RIU)Resolution (RIU)FOM (RIU 1 )Ref.
GK570/silver in hollow fiber1.4772–1.511612,500 0.8 × 10 5 150[43] (Experiment)
Liquid-core PTFE-based POF 31.325–1.3516,750 5.97 × 10 6 310.6[4] (Simulation)
H-shaped MOF with DMDW1.33–1.397540 1.3 × 10 5 280[44] (Simulation)
D-type LRSPR sensor with high Q1.33–1.383500.6 2.86 × 10 7 107.52[45] (Experiment)
Dual-channel fiber with Au/TiO 2 1.39–1.4313,200 7.58 × 10 6 363[28] (Simulation)
Gold-and MgF 2 -Coated RI sensor1.32–1.3827,959 3.70 × 10 5 [46] (Simulation)
This work1.33–1.3920,100 4.98 × 10 7 374(Simulation)
Publisher’s Note: MDPI stays neutral with regard to jurisdictional claims in published maps and institutional affiliations.

