1. Introduction
After the Fukushima Daiichi nuclear power plant (FDNPP) accident (2011), large quantities of radionuclides were released into the environment [
1,
2,
3]. In a large-scale nuclear accident, surveying and characterizing radionuclides of interest, including their activity and geographic/topological distributions, are essential for understanding the stabilization and decontamination of radionuclides [
4]. Monitoring of the dispersed radionuclides during decontamination and after decontamination decisions is also required to assess the decontamination processes.
Surveys of contaminated areas can be divided into aerial and ground-based monitoring of radionuclides [
5]. Aerial surveys can quickly detect radionuclides over wide areas, but generally have low precision compared to ground surveys [
6]. Ground surveys include the use of backpack detectors, vehicle-deployed detecting systems, and so on. Most commercialized ground surveying systems use inorganic scintillators, such as NaI:Tl, or typical survey meters, such as a Geiger–Muller (GM) counter [
7]. However, these detectors are poor at surveying wide areas because they have either a large volume or have difficulty in obtaining the correct geometry over contaminated areas, as they can only provide point data. In this case, contaminated areas can be mapped through data from measured points and the kriging method, which interpolates the data of unsampled positions through weighted linear estimations using neighboring data [
8,
9].
Consequently, a detector for ground surveys should be able to cover large areas and small volumes with high spatial resolution in addition to detecting radiation accurately. In this respect, plastic scintillation optical fiber (PSOF) has many advantages, such as its good flexibility, long length usability, high water resistance, cost-effectiveness in manufacturing, and lack of interference from electromagnetic fields. Additionally, it is possible to improve the detection sensitivity by fabricating a bundle-type PSOF detector [
7,
10,
11]. A PSOF detector can provide one-dimensional data on the contaminated area, enabling faster measurements than conventional point-measuring detectors. A PSOF detector was used in the in situ surface contamination surveys to evaluate the surface dose rate in forest areas after the FDNPP accident [
12]. In addition, a PSOF detector was used to measure the radiocesium concentration—a quick and direct technique—at the bottom of the irrigation ponds in Fukushima. Generally, the radiocesium concentration in sediment is assessed by measuring a sample in a laboratory. With this method, however, the sample becomes radioactive waste, and distribution assessment over the entire pond becomes impossible [
13]. Monitoring data measured by PSOF detectors were used to assess the ecological half-life of the radiocesium concentration in the sediment of five ponds in Fukushima from 2013 to 2019 [
14].
To estimate the position of a gamma-ray source using a PSOF detector, several methods have been used in previous studies. When a gamma ray interacts with a PSOF, scintillation light is emitted in the 4π direction, which is transmitted to both ends of the PSOF through the phenomenon of total internal reflection. Based on the position of the gamma-ray source, aside from the center of the PSOF, there should be a difference in the transmitted path of the scintillation light as it reaches both ends of the PSOF. The gamma-ray source position can be estimated by measuring the time, height of pulse, or power difference in the transmitted path [
15,
16,
17]. Generally, spatial resolution is conventionally quantified as the full width at half maximum (FWHM) of the line spread function (LSF), which describes the graph of the count distribution in a line perpendicular to the radioactive source.
Soramoto et al. [
15], Emoto et al. [
18], Nohtomi et al. [
19], Chichester et al. [
20], and Gamo et al. [
21] estimated the position of the gamma-ray source using the time difference method. Previous experimental results for spatial resolution showed that the FWHMs were in the range of 3.29–9.12% of the total length of the PSOF. Imai et al. [
16] and Sutton et al. [
7,
22] used the difference in signal height to estimate the position of the gamma-ray source. The FWHMs were 3.67–4.70% of the total length of the PSOF. Normally, using the power and height difference of scintillation light, it can be difficult to accurately determine the position of a gamma-ray source because the attenuation coefficient can be easily changed in the emission spectrum of the PSOF [
23]. Because the dose in the contaminated area is continuously inhomogeneous, it is very important to improve the spatial resolution of the PSOF detector.
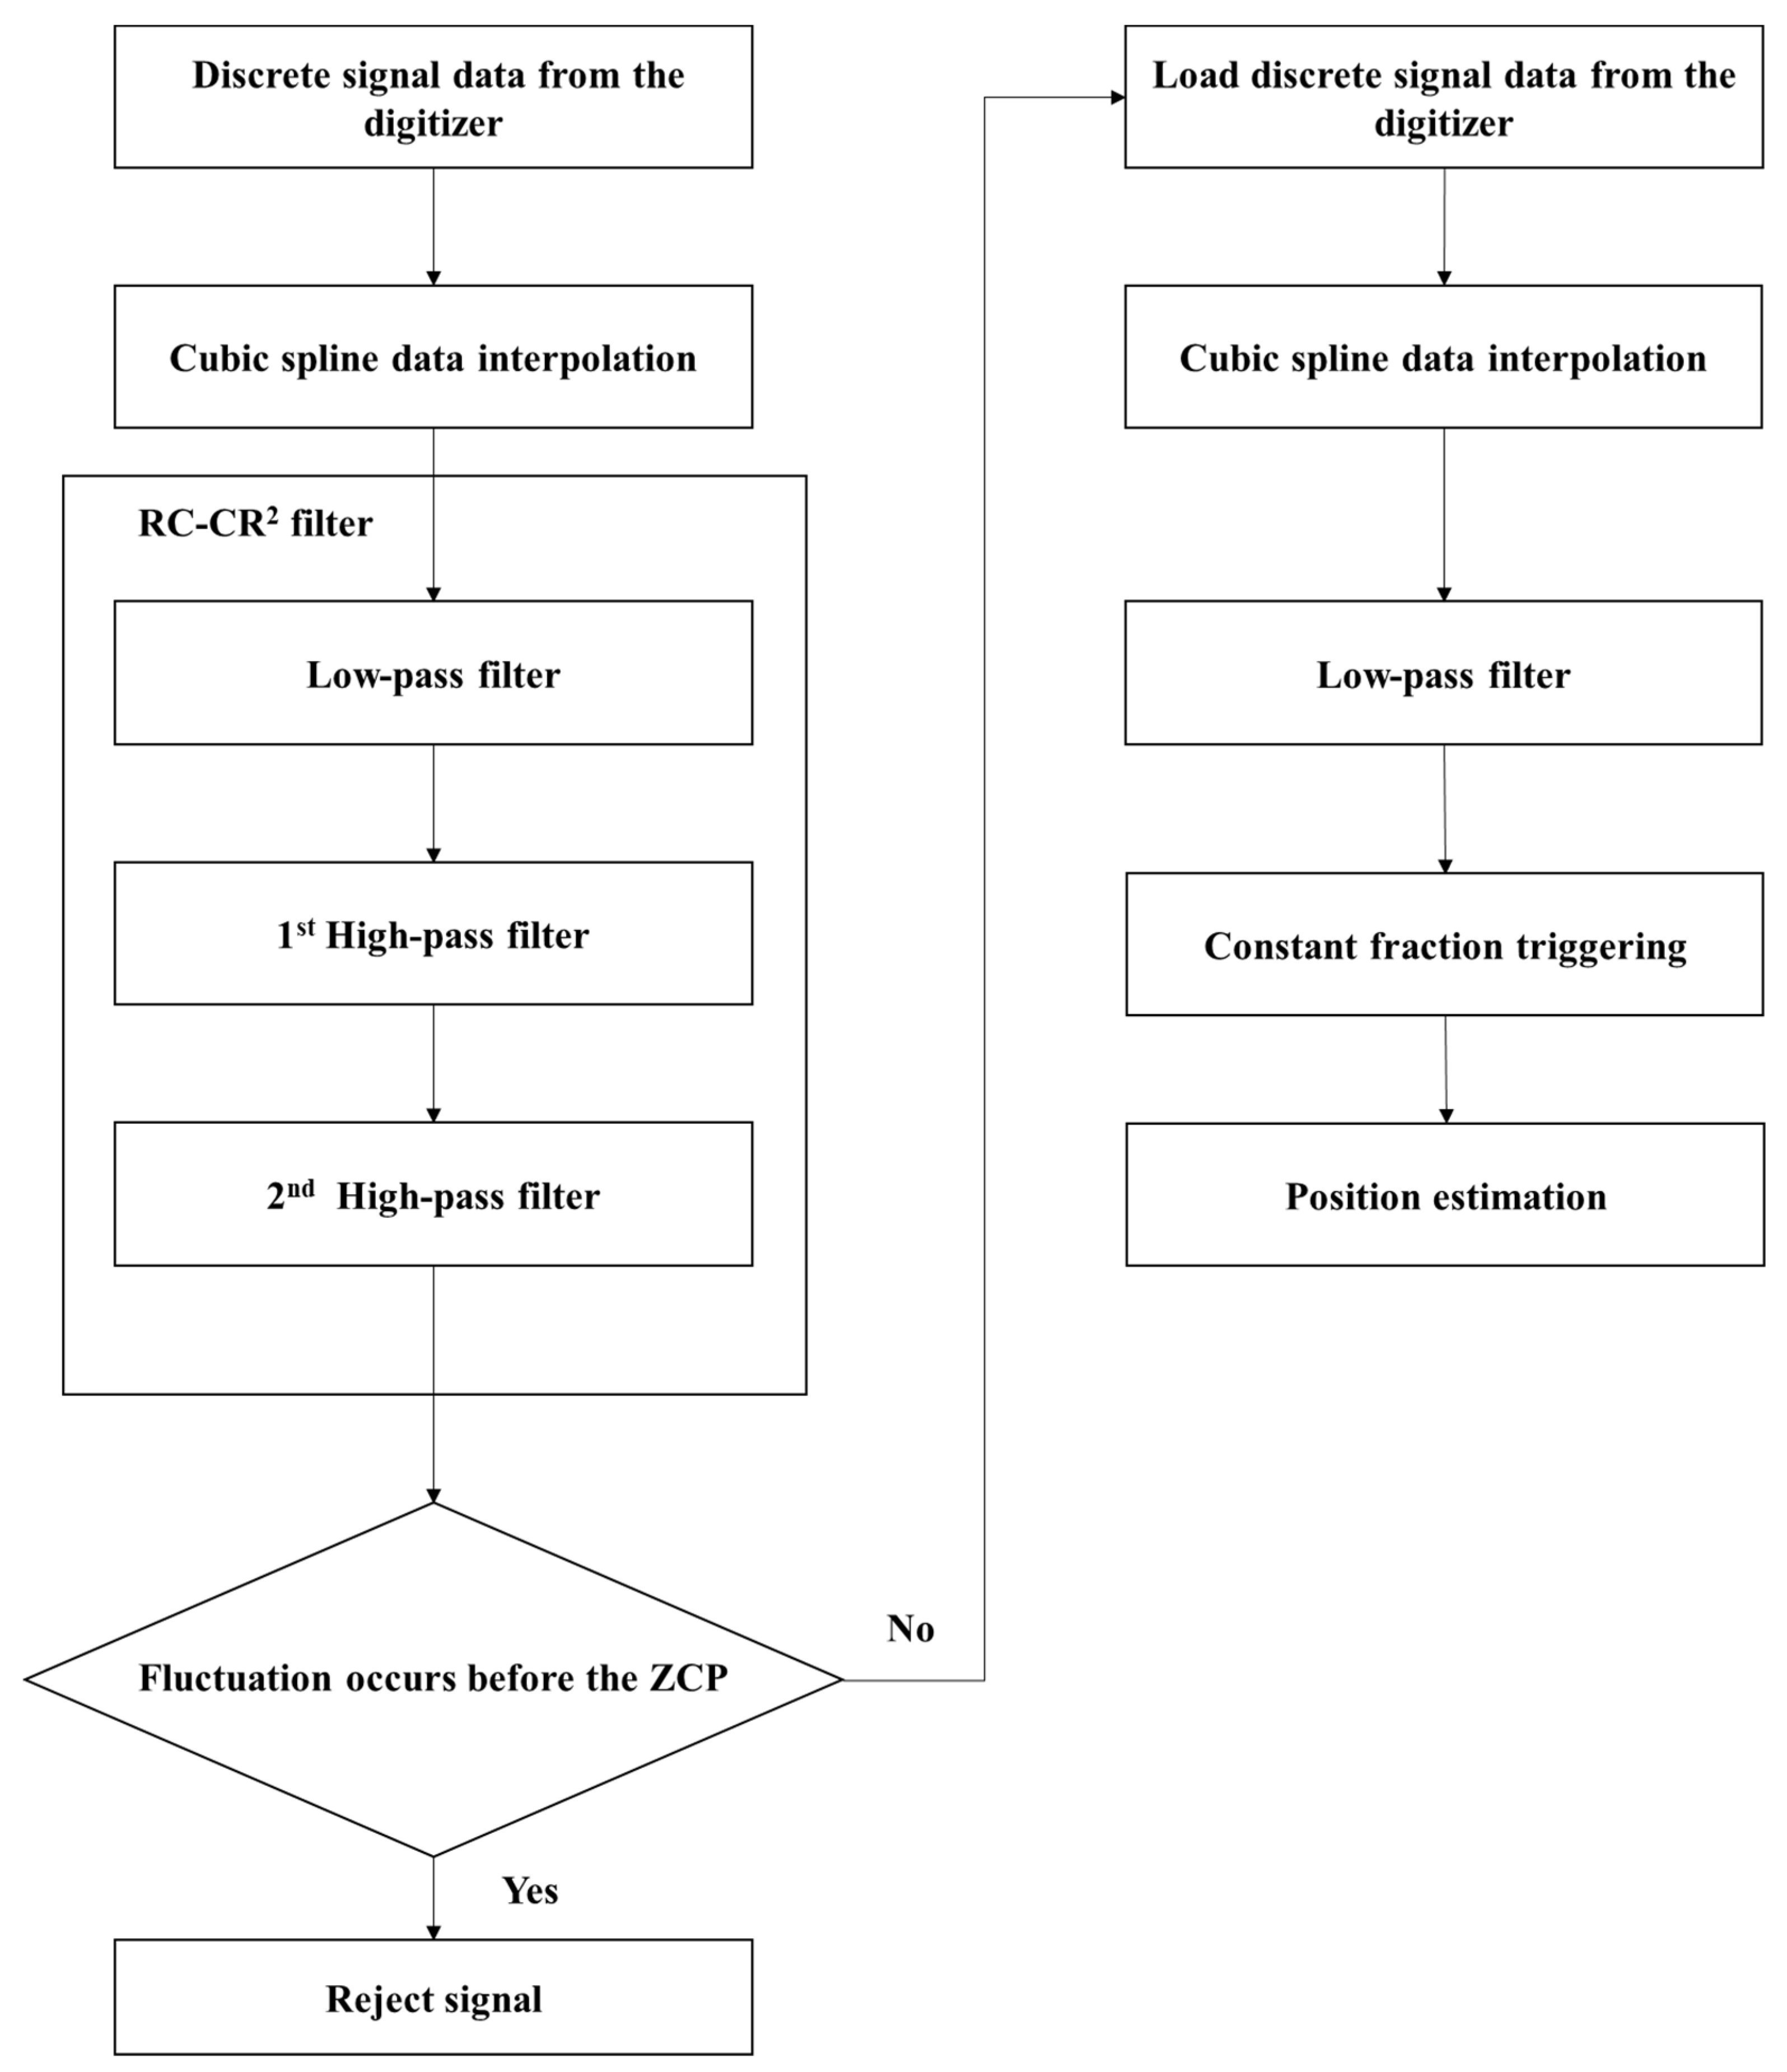
In this study, to enhance the spatial resolution of the PSOF detector, our research focused on three points. First, we reduced the transit time spread (TTS) using a high-timing-response photomultiplier tube (PMT) and a multi-cladded PSOF bundle detector. The transit time difference is the time delay between the scintillation light pulses measured with PMTs at both ends of the PSOF. The fluctuation of this transit time is referred to as the TTS, which is inversely proportional to the square root of the number of photoelectrons per pulse in the PMT [
24]. We selected a PMT with a small TTS and fabricated a bundle-type detector with seven PSOFs to improve the amount of high-sensitivity scintillation light generated. Second, an RC-CR
2 filter was designed and used to remove noise signals during the rise time. Third, the signal data acquired from the digitizer were made comparable to the original signal using cubic spline interpolation to improve the accuracy of the data. Finally, we measured the best FWHMs to obtain the highest spatial resolution using our proposed PSOF bundle detector. We obtained a spatial resolution of 10.69 cm, which was 2.13% of the 5 m length of the PSOF.
2. Materials and Methods
The position-sensitive PSOF bundle detector consisted of a sensing probe, two PMTs (H6533, Hamamatsu Photonics), two fast amplifiers (A1424, CAEN), and a digitizer (DT5742, CAEN). To increase the quantity of scintillation light, the sensing probe was made up of seven PSOFs (SCSF-78, Kuraray) of diameter 2.0 mm and length 5 m. These PSOFs emitted blue light with a peak wavelength of 450 nm and had a multi-cladded structure. The trapping efficiency of a multi-cladded PSOF is 5.4%, which is higher than that of a single-cladded PSOF. Both the inner and outer cladding thicknesses were 0.04 mm, that is, 2% of the PSOF diameter. The materials of the core and the inner and outer cladding were polystyrene (PS), polymethyl methacrylate (PMMA), and fluorinated polymer (FP), respectively. The refractive indices of the PS, PMMA, and FP were 1.59, 1.49, and 1.42, respectively, and the numerical aperture (NA) was 0.72. The NA denotes the light-gathering power, that is, more light can be guided by a PSOF with a higher NA [
25]. The physical properties of the PSOF and the technical specifications for the PMT are listed in
Table 1 and
Table 2.
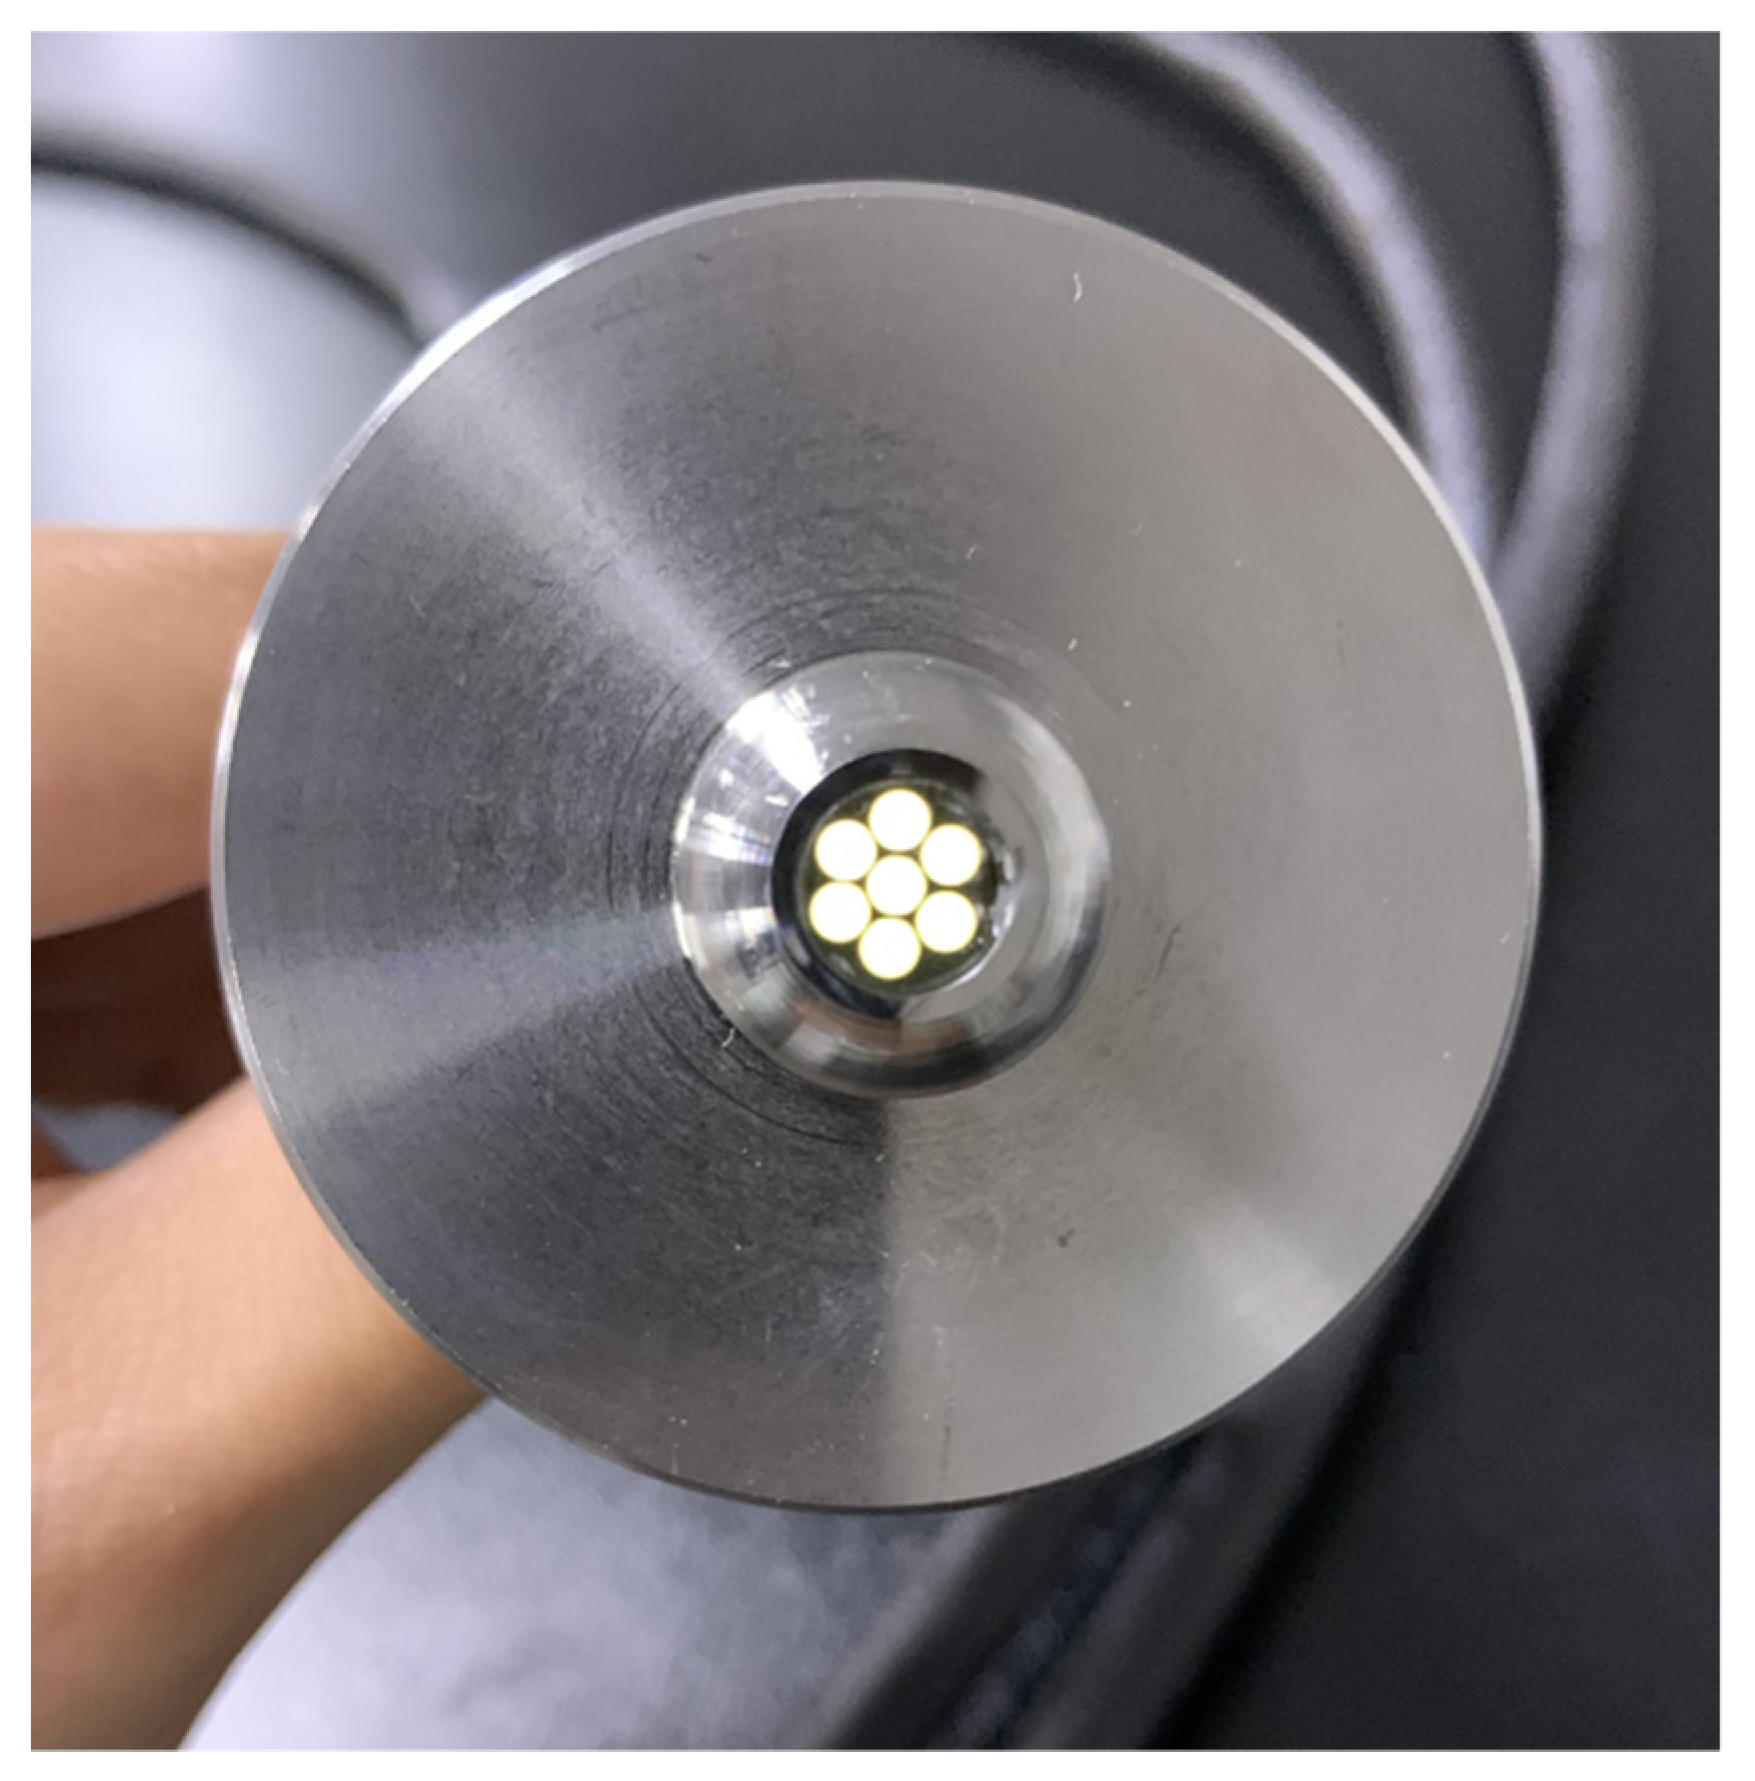
Seven multi-cladded PSOFs were bundled together and packed within a light-tight, flexible black shrink tube of thickness 1.68 mm. Both ends of the sensing probe were polished with various sizes and types of polishing pads. A photograph of the end of the sensing probe after polishing is shown in
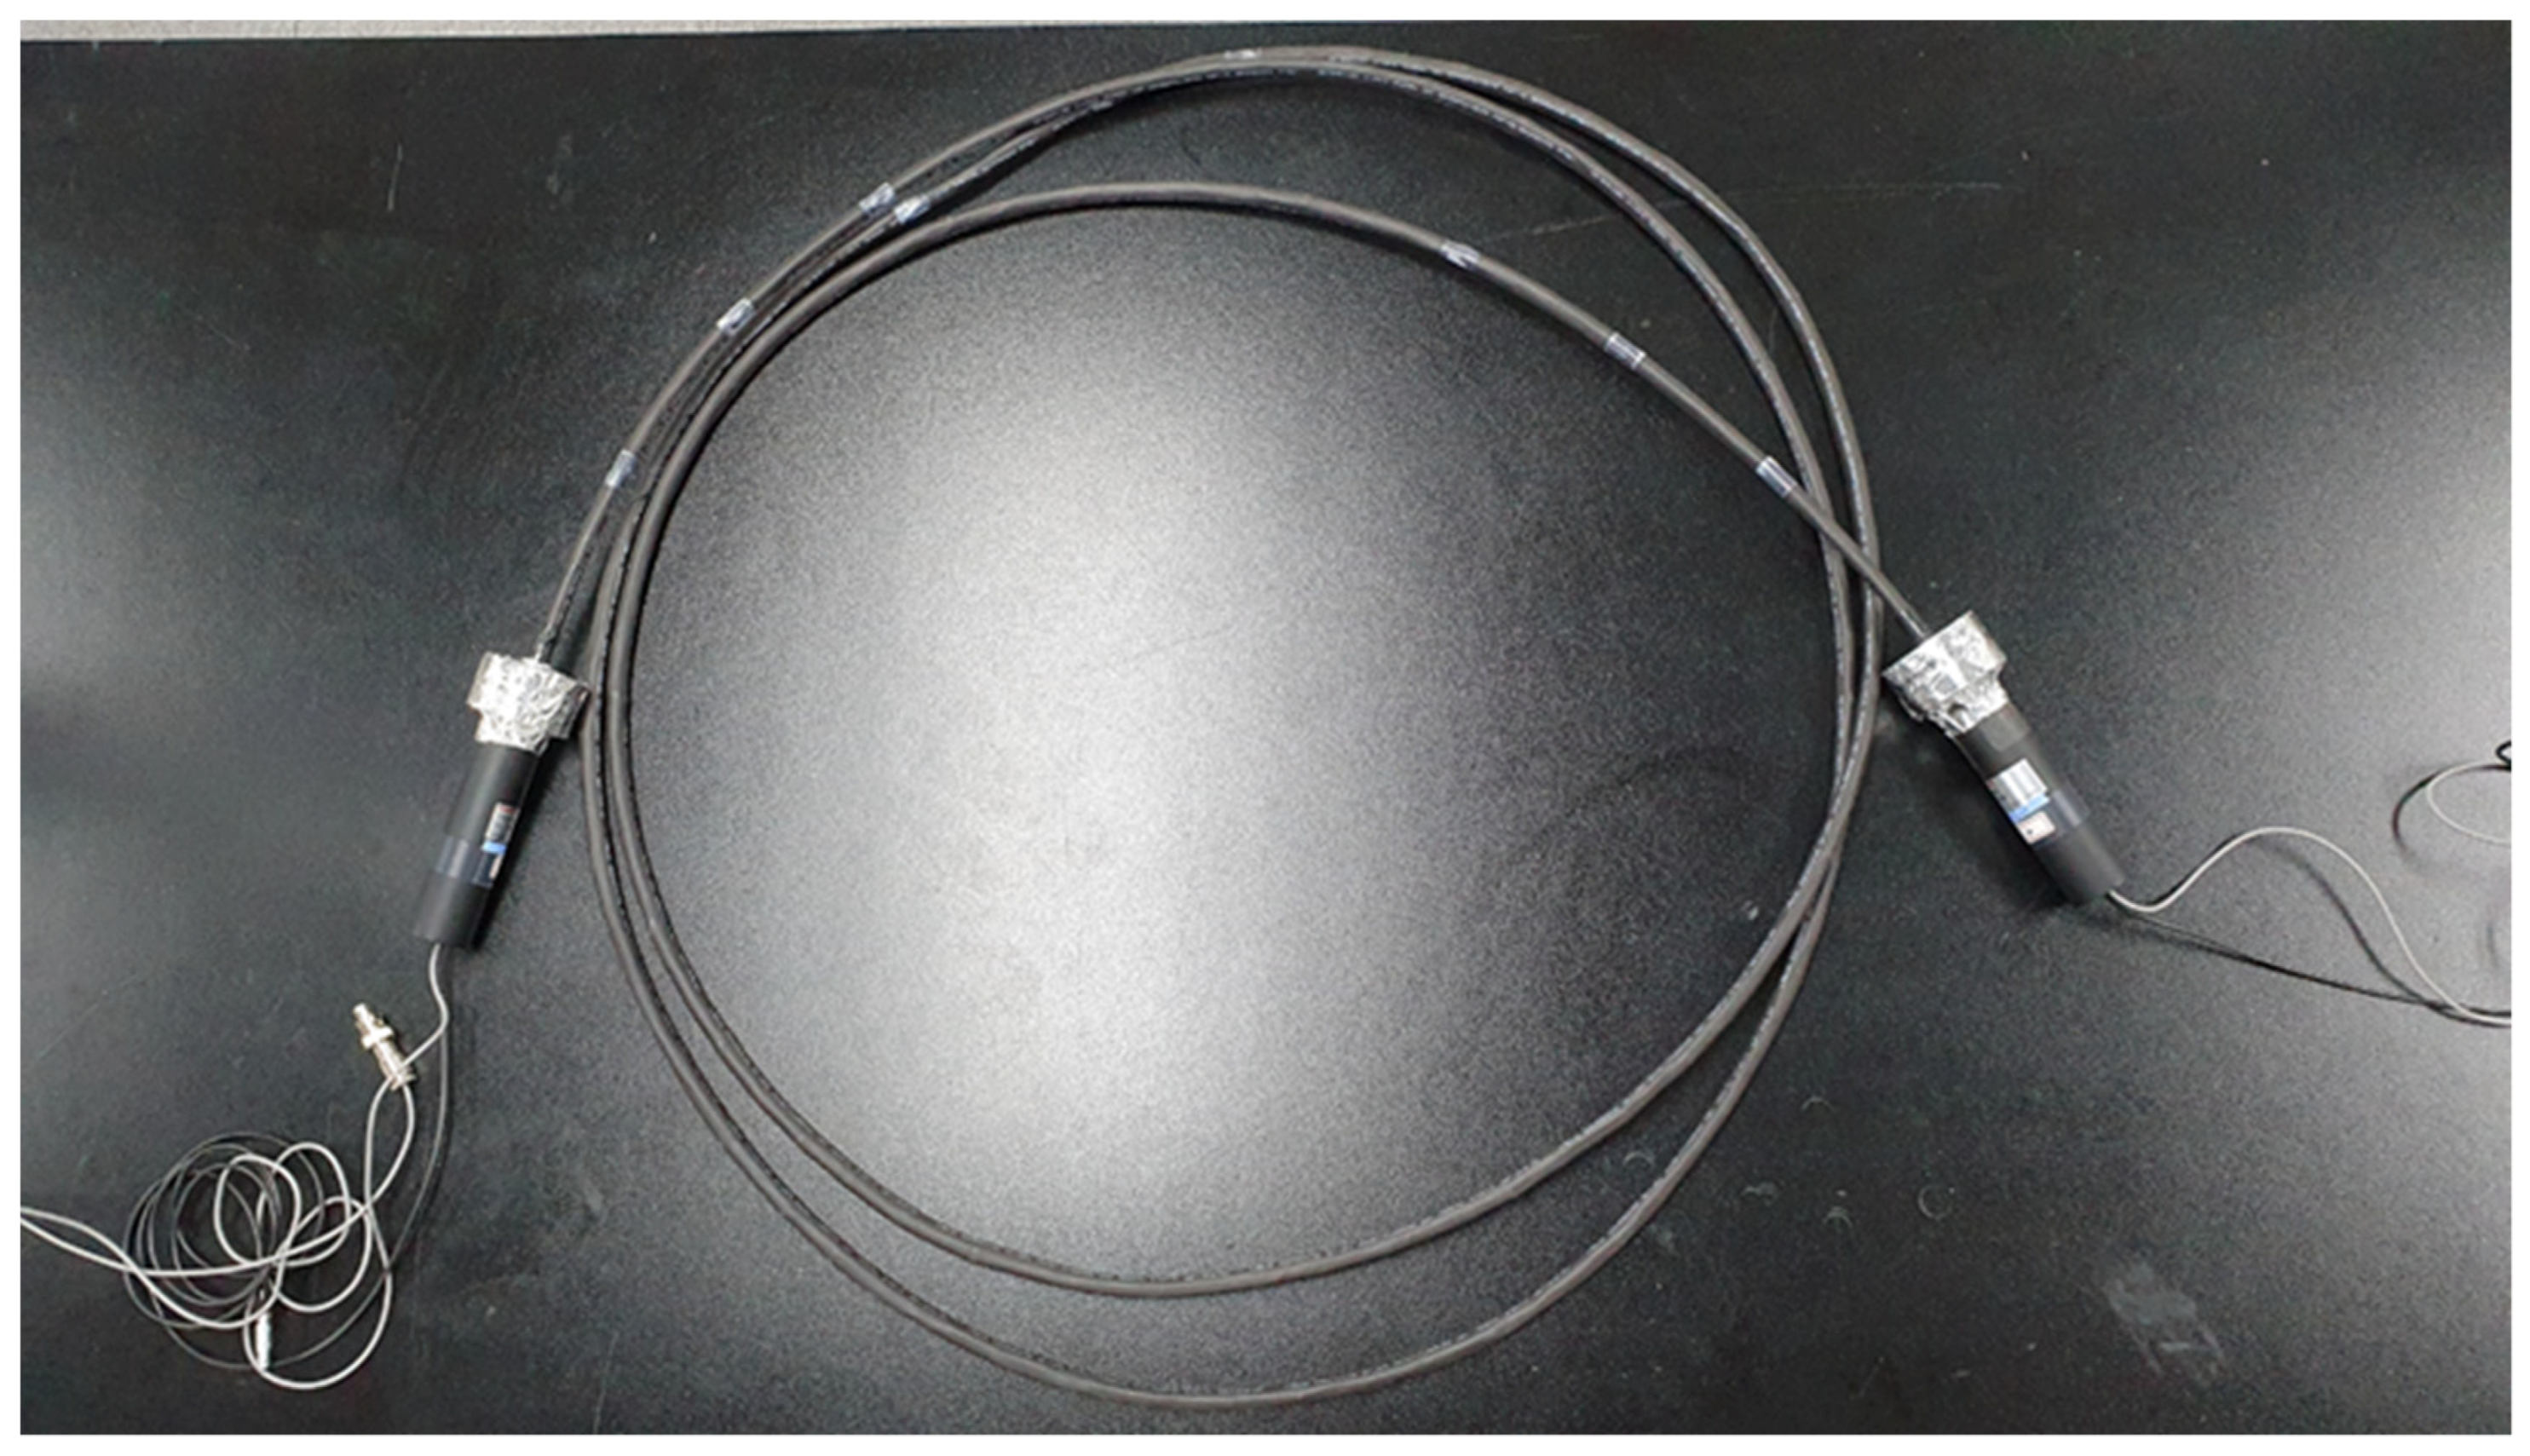
Figure 1. The PSOF bundle could be optically coupled with silicone-rubber-based optical interfaces (EJ-560, Eljen Technology, Sweetwater, UK) to the windows of the PMTs.
Figure 2 shows a photograph of the assembly after combining the sensing probe and the PMTs.
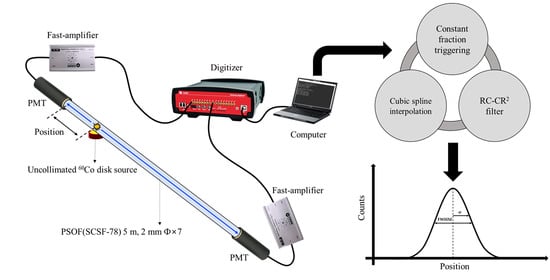
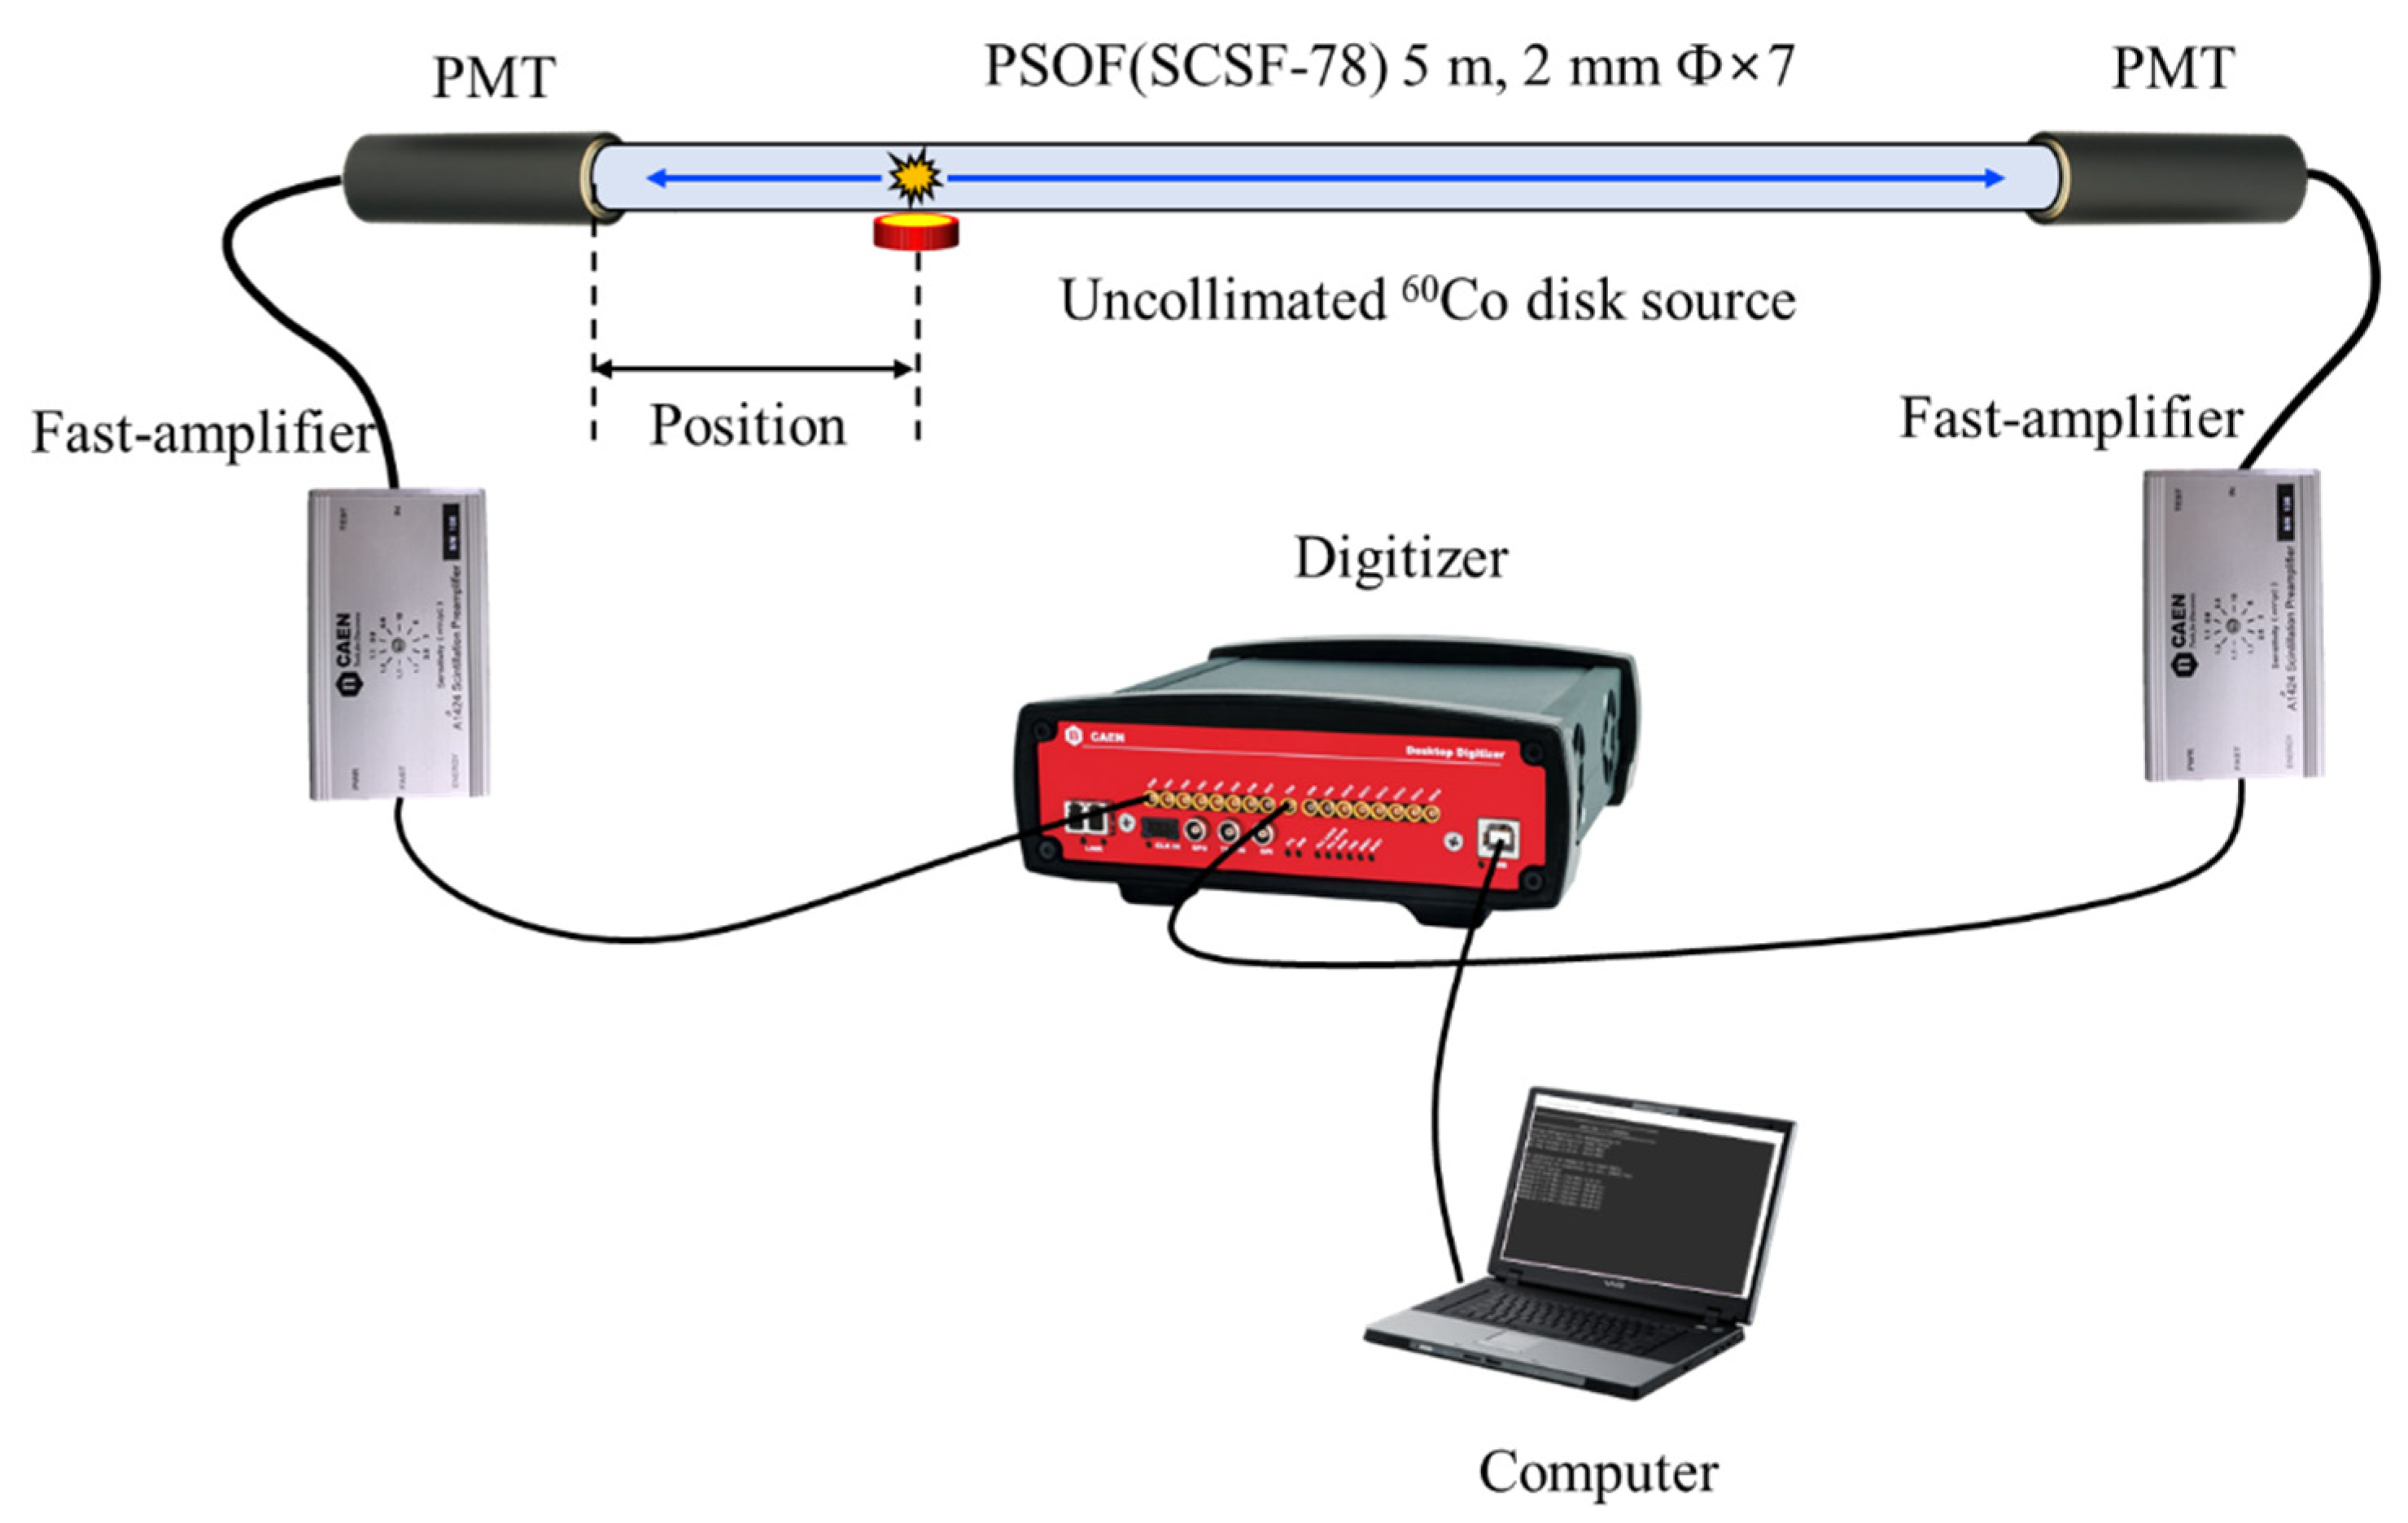
Figure 3 shows the overall experimental setup. The
60Co uncollimated source was placed close under the PSOF, as shown in
Figure 3. The scintillation light generated from the PSOF was transmitted to two PMTs, which were placed at both ends of the PSOF bundle as light-measuring devices. The output current signals of the PMTs were amplified using a fast amplifier and sampled using a digitizer. A digitizer with a sampling rate of 5 GS/s was used to obtain signal data close to the original data generated from the PMTs. Moreover, cubic spline interpolation was applied to improve the accuracy of the signal data acquired by the digitizer [
26]. The values at query points were based on cubic interpolation of the values of neighboring data points [
27]. The signal data obtained using cubic spline interpolation provided the position of the gamma-ray source after applying a digital signal processing approach designed using MATLAB.
The cubic-spline-interpolated signal data passing through the RC-CR
2 filter were emulated using MATLAB. The RC-CR
2 filter consisted of one low-pass filter and two high-pass filters. The low-pass filter removed high-frequency noise, and the high-pass filters restored the baseline and removed high-frequency fluctuations [
28]. The cut-off frequencies used of the RC and CR
2 filters were 5.02 × 10
8 and 4.39 × 10
8 Hz, respectively, which are in the signal processing. The signals passing through the RC-CR
2 filter were converted into a bipolar signal because the high-pass filter was a differentiator that generated an output in proportion to the rate of change of the input signal [
29]. We measured the light signals that had proper rise and decay times when they were higher than a threshold level. If the bipolar signal generated after passing RC-CR
2 filter has fluctuations, there should be much noise in the rise time. Therefore, we can reject this kind of signal that has noises in order to estimate the exact position. The signal data corresponding to the bipolar signals with fluctuations were deleted before passing the zero-crossing point (ZCP).
For all the signal data acquired by the digitizer, signals with noise during the rise time were removed by the RC-CR
2 filter, and the gamma-ray source position was estimated through constant fraction triggering (CFT). Generally, leading-edge triggering using a constant threshold value causes timing errors because of the walk effect, and even coincident signals of differing heights exhibit a walk effect. In the case of CFT, the threshold value is proportional to the height of the signal, and walk-free triggering is possible when the rise time of the signals is constant [
30].
The position of the gamma-ray source can be estimated from the time differences of the trigger signals.
Figure 4 shows a flow chart of the digital signal processing approach designed in MATLAB. The PMT used in the position-sensitive PSOF bundle detector had a short rise time of 0.7 ns, and the rejected signals using the RC-CR
2 filter in this experiment were only in the range of 1.5–3.6% of the total number of signals acquired by the digitizer. As an uncollimated gamma-ray source, solid-disc-type
60Co was used to evaluate the performance of the proposed PSOF bundle detector. The energies of the
60Co source were 1.33 and 1.17 MeV, and its radioactivity was 41.8 µCi.
3. Results
The FWHMs were used to evaluate the spatial resolution of the position-sensitive PSOF bundle detector. The standard deviation value was obtained by fitting the position data acquired through a digital signal processing method. The standard deviation corresponds to the half-width of the peak at approximately 60% of the full height in Gaussian distribution [
30].
As an initial experiment, we measured the FWHMs to determine the optimum measurement time at the center of the PSOF bundle sensing probe, where a
60Co gamma-ray source was placed. To estimate the exact position of a radioactive source, the optimum measurement time should be determined. The FWHM can also be varied according to measurement times due to the lack of data or noises generated. The FWHMs were measured differently according to measurement times, as listed in
Table 3. The optimum measurement time of the proposed position-sensitive PSOF bundle detector was determined by the shortest FWHM value, which was 10.86 cm for 60 s.
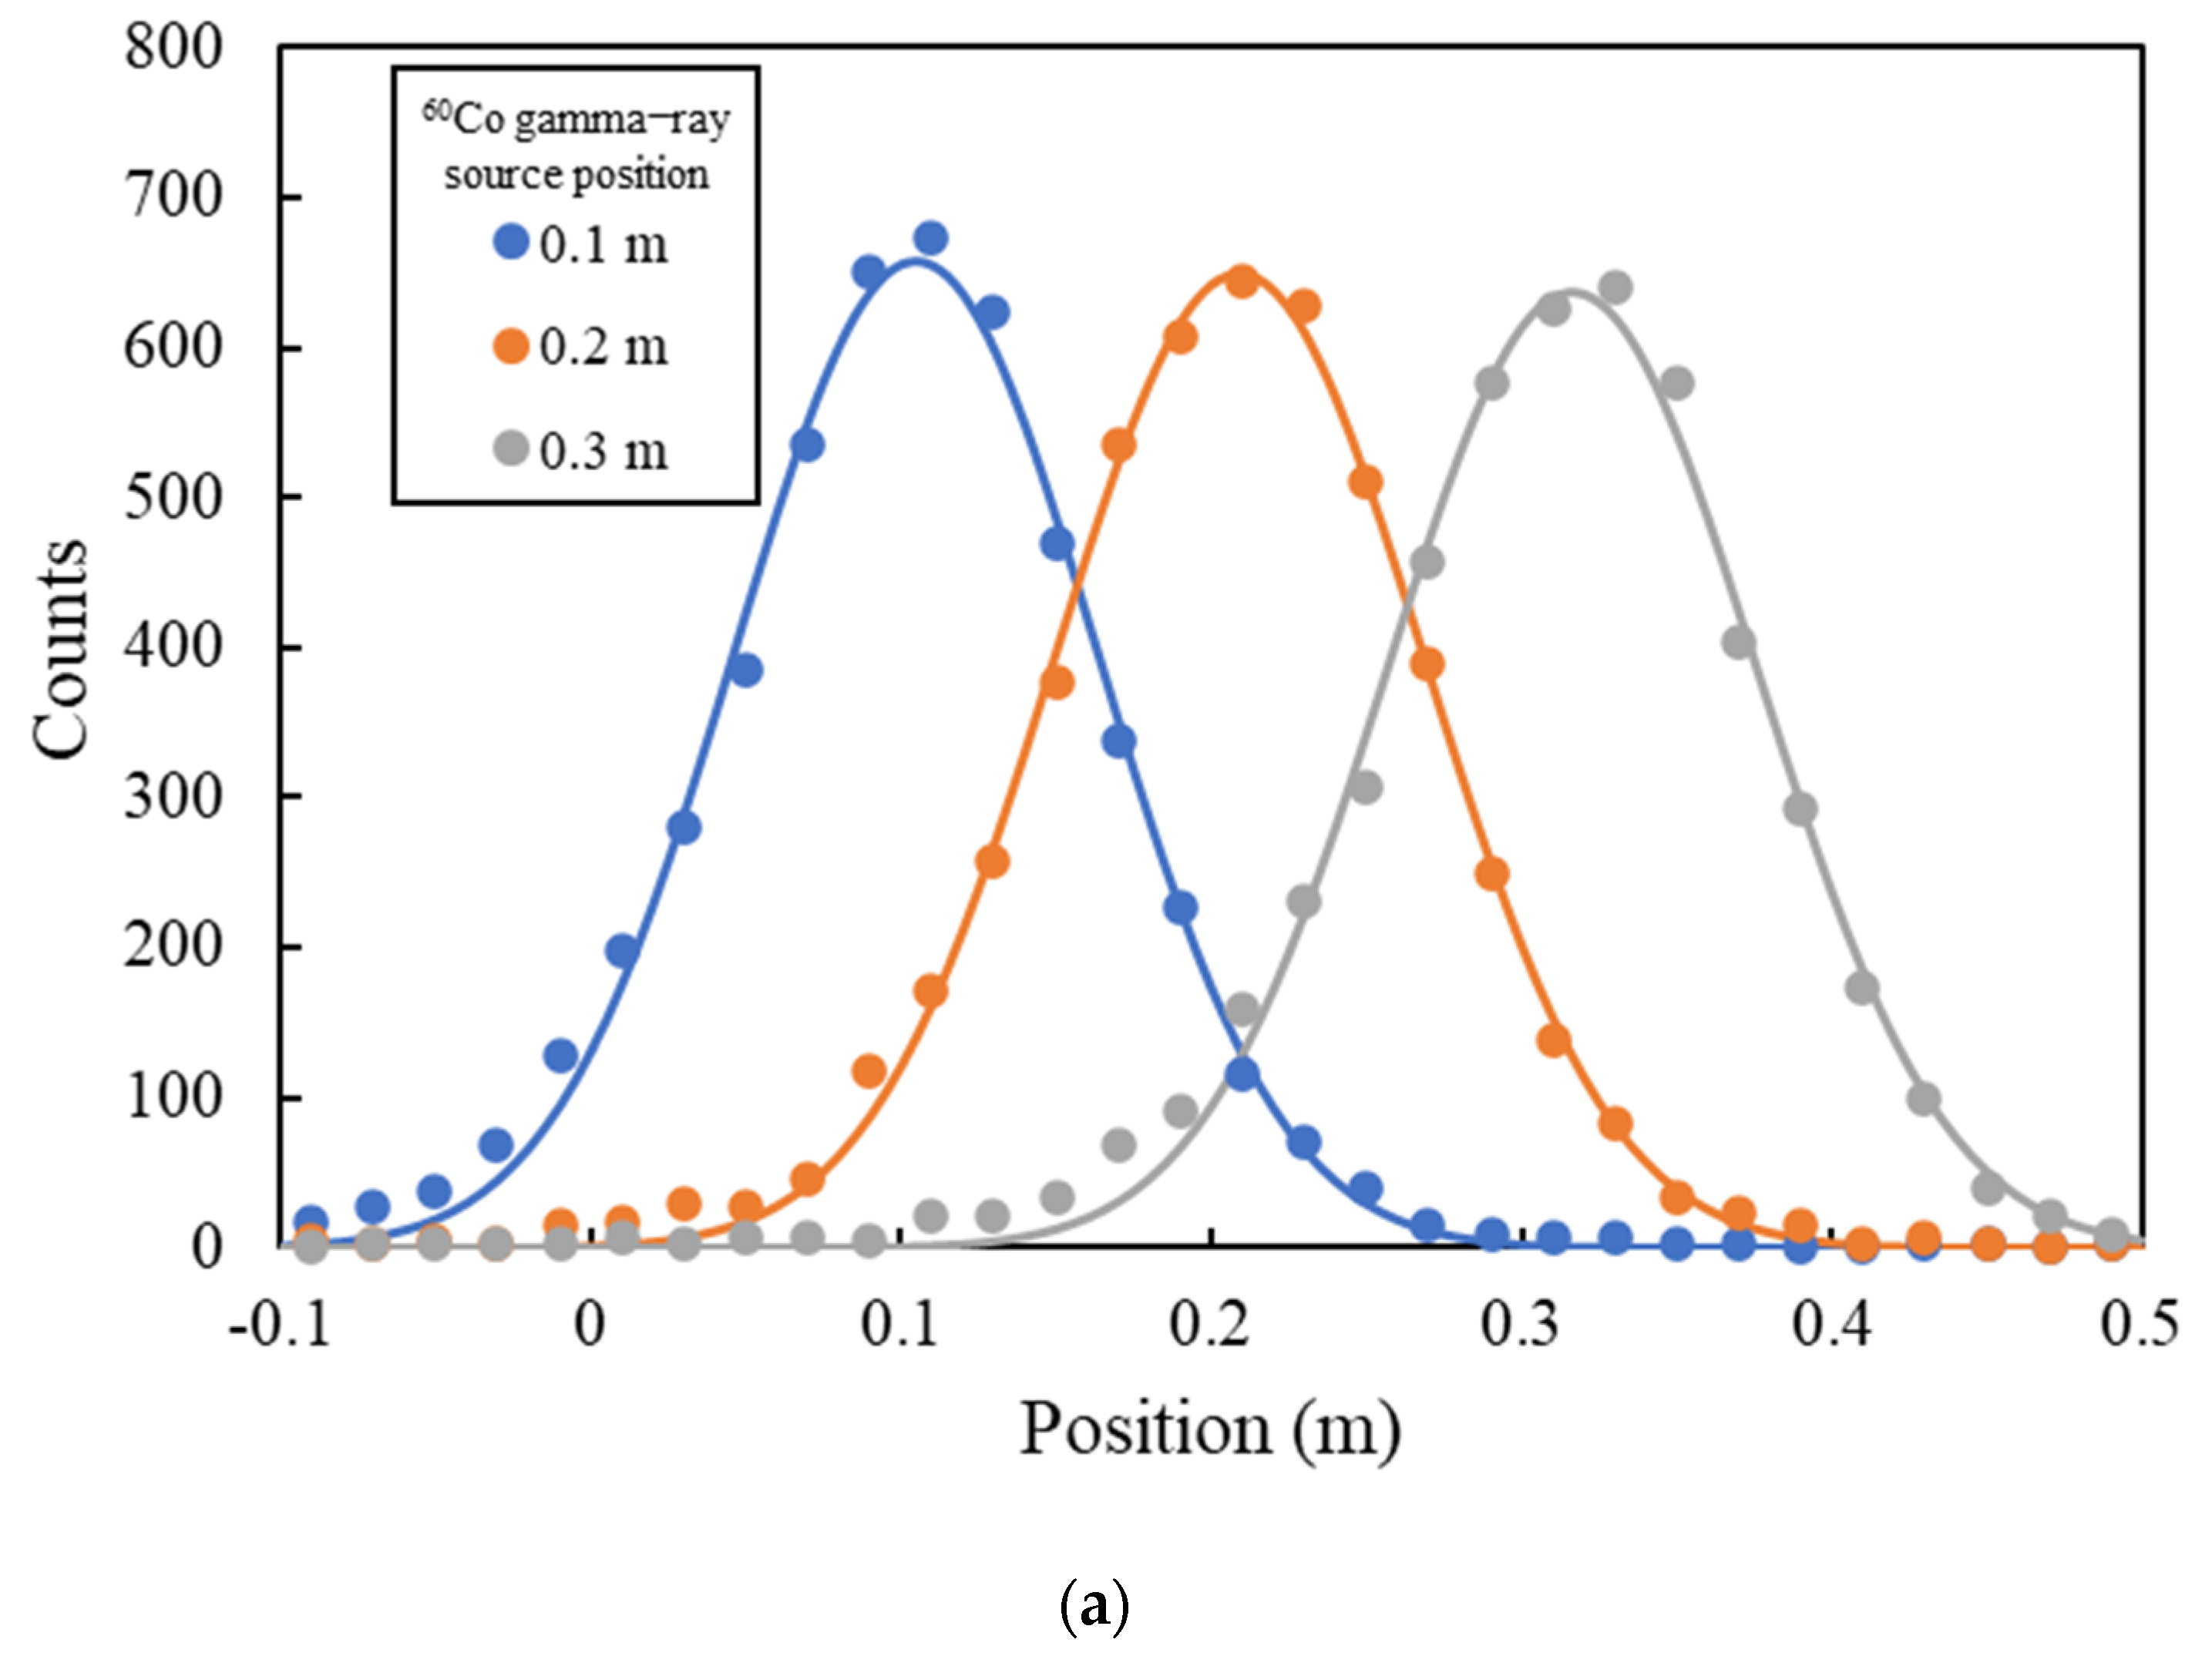
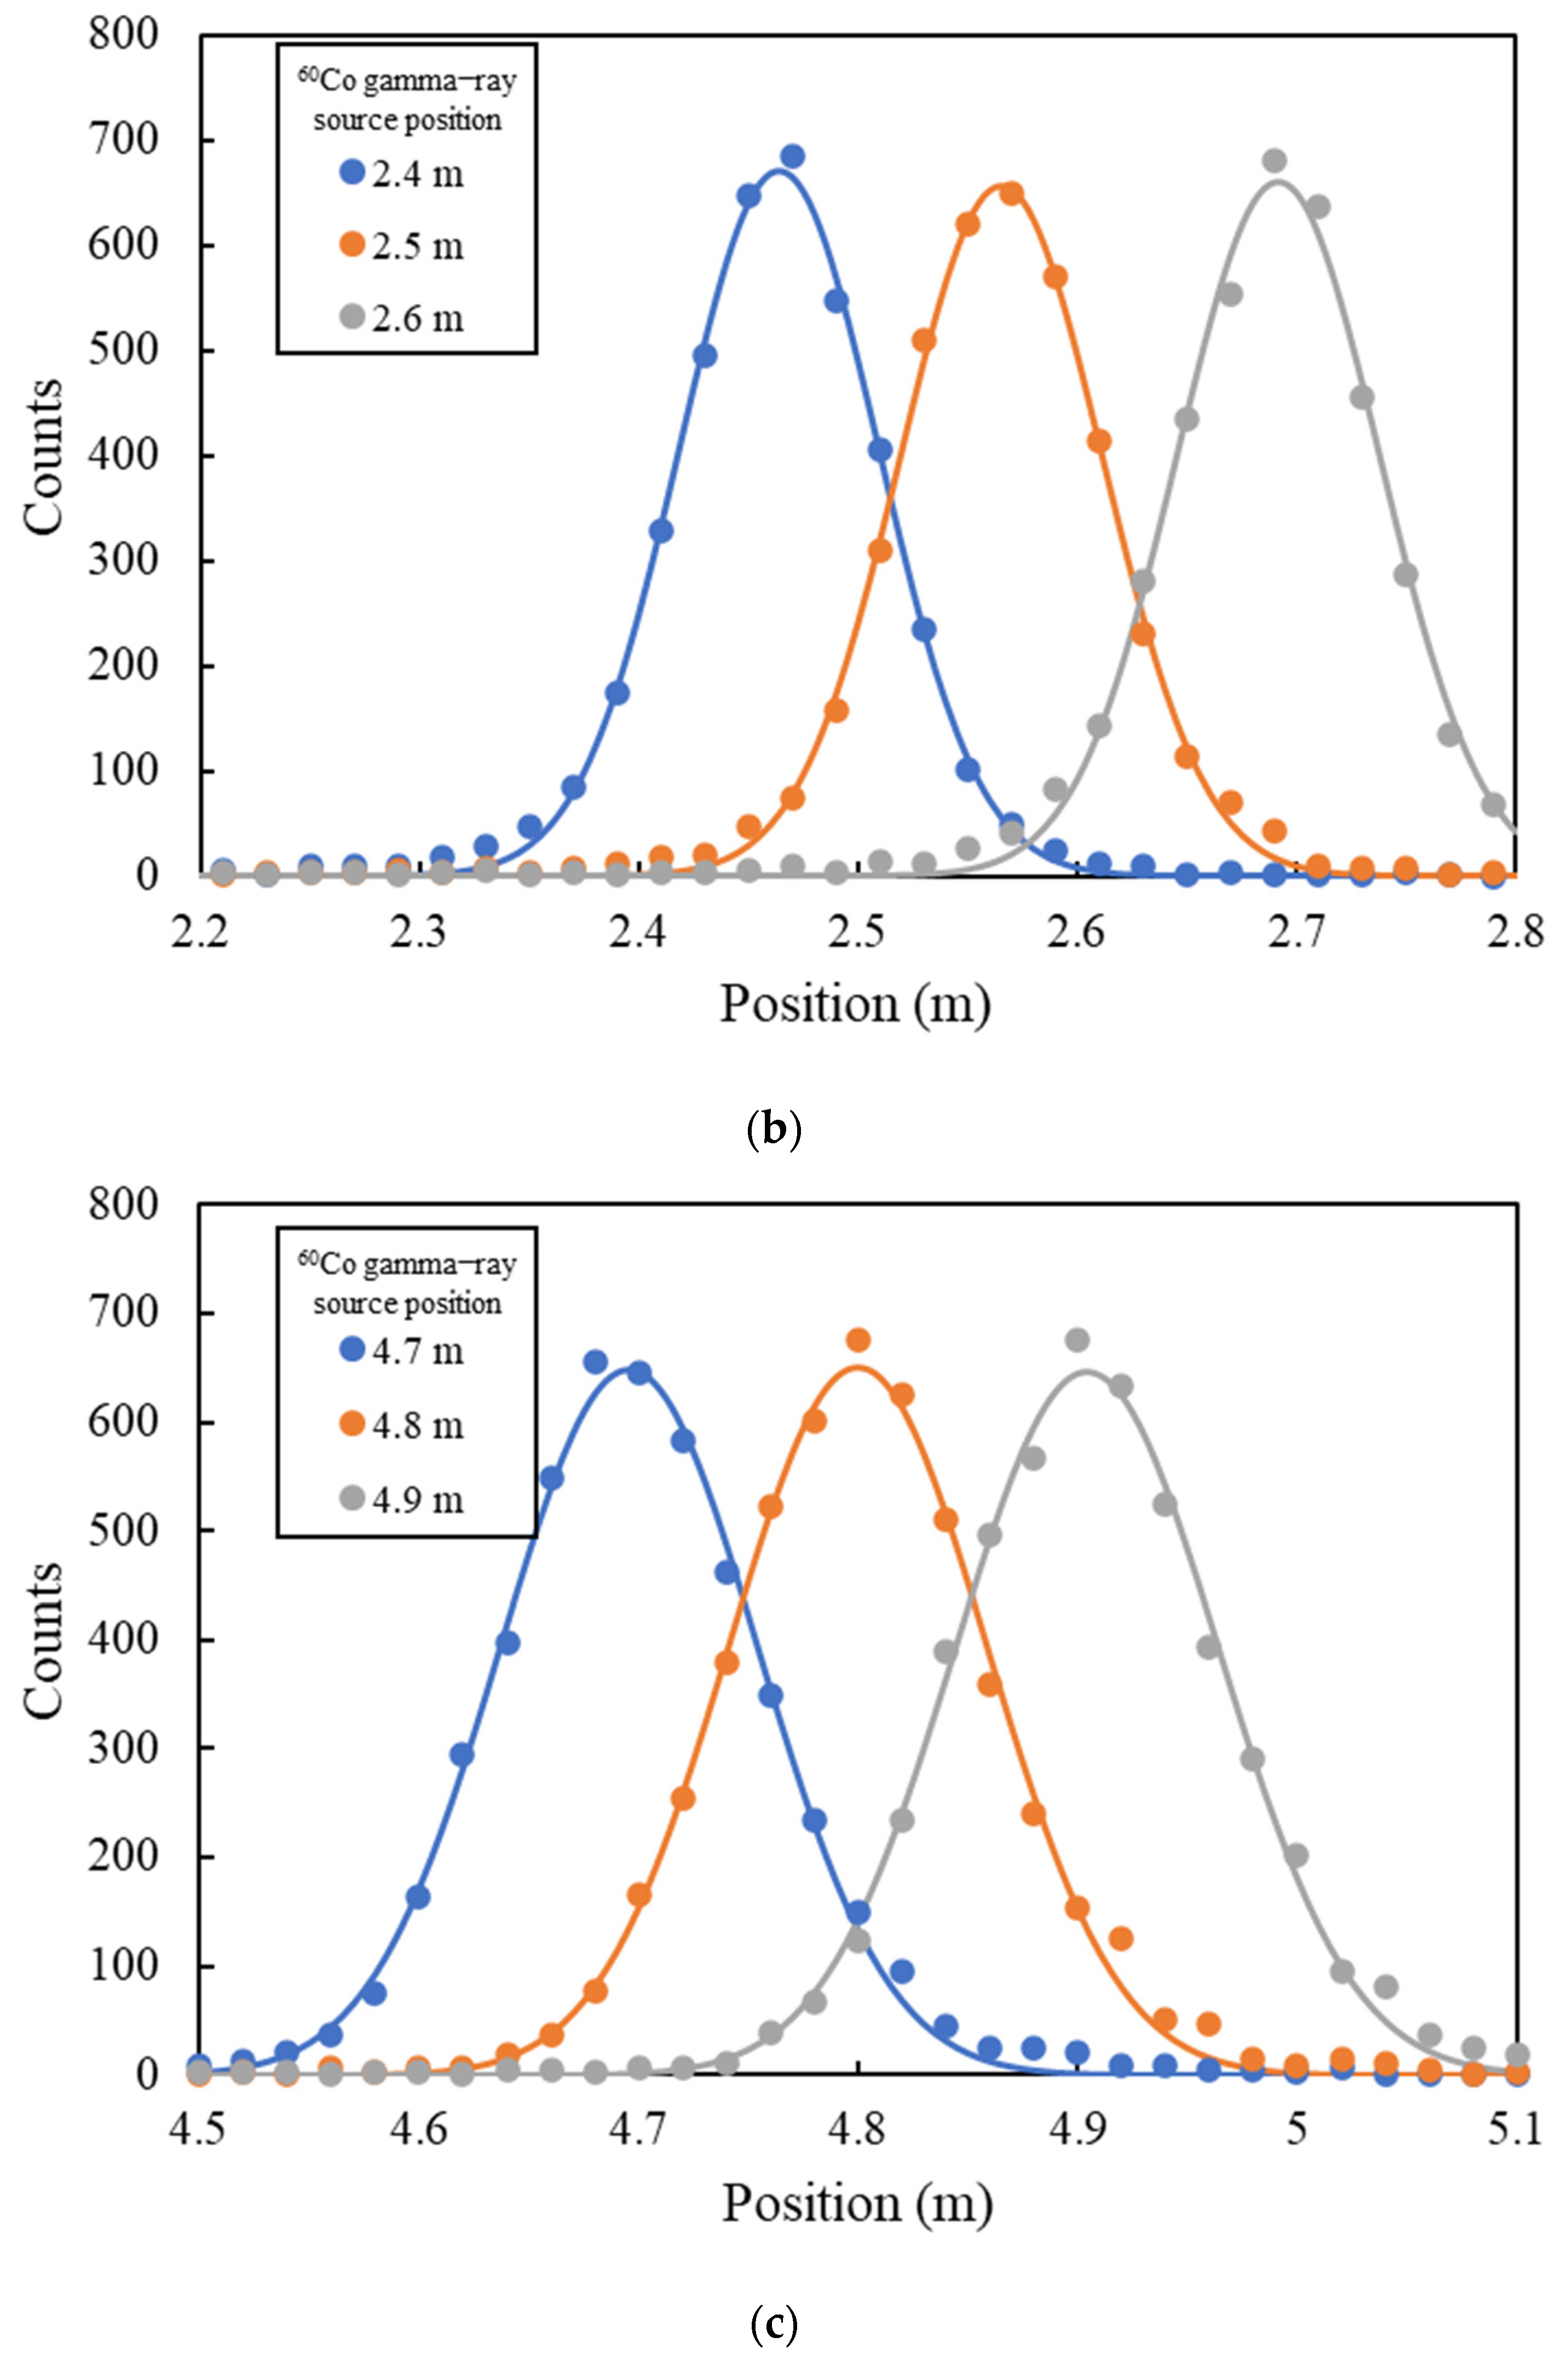
Figure 5 shows the position spectra and fitted Gaussian curves for the positions of the
60Co sources, which were placed at 0.1, 0.2, 0.3, 2.4, 2.5, 2.6, 4.7, 4.8, and 4.9 m along the PSOF bundle. For example, the blue points in
Figure 5a show the position data measured using the PSOF bundle detector and the blue curve shows the fitted Gaussian curve for measuring the FWHM that can determine the spatial resolution of the detector. To evaluate the position sensitivity of the entire PSOF bundle sensing probe, the FWHMs were measured at three positions—at both ends and in the middle of the sensing probe at intervals of 0.1 m. The overall experimental results are listed in
Table 4. The data indicate that the actual and measured positions were different. The calculated position errors and measured FWHMs of the curves are also listed in
Table 4. The position errors for the total length of the PSOF were in the very small range of 0.092–1.828%.
The measured FWHMs of the proposed PSOF bundle detector were in the range of 13.75–14.15 cm at both ends and 10.69–10.86 cm in the middle of the sensing probe. Normally, the scintillation light generated by the interaction of gamma rays and the PSOF is attenuated as it is transmitted by total internal reflections along the PSOF. Moreover, the number of photoelectrons per pulse in a PMT is inversely proportional to the square root of the TTS. In the PSOF used in this study, the intensity of scintillation light decreased exponentially, and the attenuation length of the PSOF was approximately 4 m [
17]. In the case of the scintillation light, which was generated at the end of the PSOF, it could be transmitted from 4.7–4.9 m of the PSOF to reach the other side of the PMT. As the TTS in the PMT increased, the FWHM increased slightly because the transmitted length was longer than the attenuation length of the PSOF.
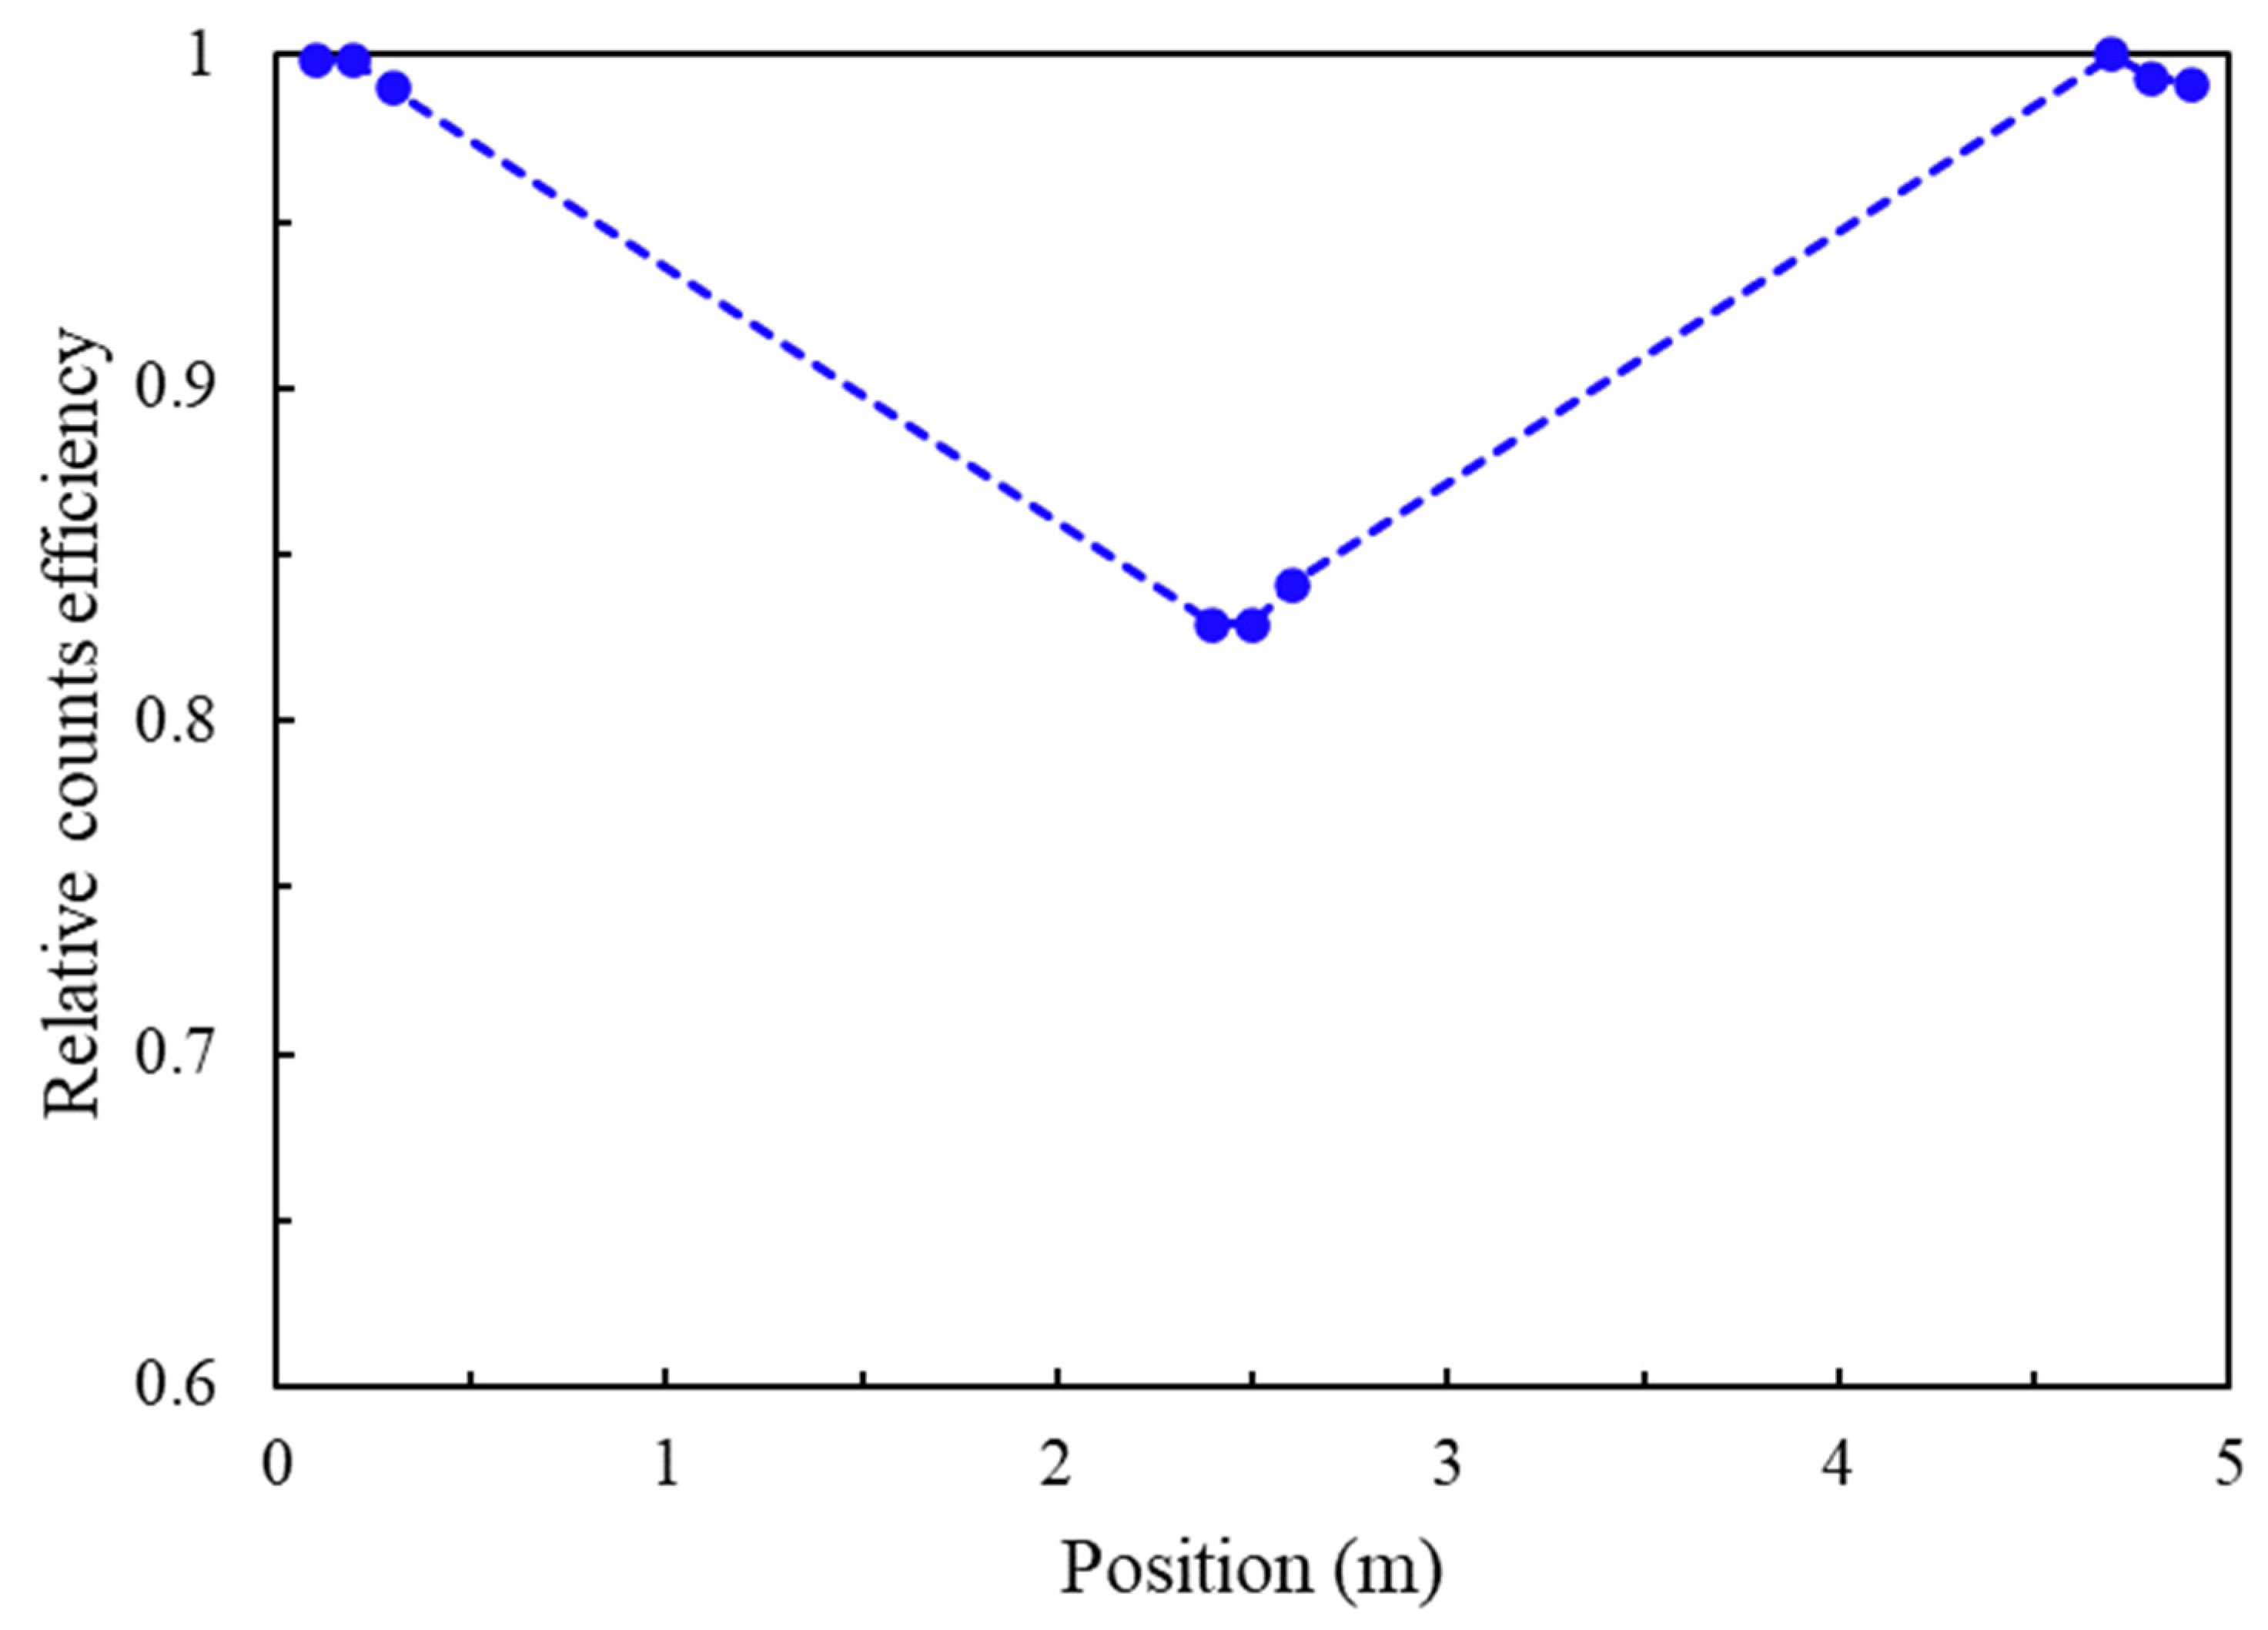
The relative efficiency was measured to evaluate the sensitivity of the position-sensitive PSOF bundle detector based on the location of the gamma source.
Figure 6 shows the relative efficiency of the POSF detector for the positions of the
60Co sources, which were placed at 0.1, 0.2, 0.3, 2.4, 2.5, 2.6, 4.7, 4.8, and 4.9 m along the PSOF bundle. Relative efficiency can be defined as the ratio of the counting rate in different locations relative to the maximum counting rate. Relative efficiency has values in the range of 0.991–1 at positions close to both ends and 0.829–0.868 at positions in the center of the PSOF bundle, respectively. A slightly lower relative efficiency was measured around the middle section of the position-sensitive PSOF bundle detector. When the gamma-ray source was located in the middle section, scintillation light pulses with low heights were attenuated and dispersed at both ends of the PSOF bundle. In addition, the relative efficiency was slightly reduced because these pulses could not be sampled by the digitizer due to its threshold. However, almost uniform counting rates were observed for the entire PSOF in the range of 0.829–1.0, which is a difference of only 17.1%. In Chichester’s experiment, relative efficiencies were measured for the PSOF (BCF series, Saint-Gobain); a difference of more than 50% was measured, and it was asymmetric if even longer PSOFs were used [
20]. Compared to the previous experiment, the uniformity of the relative efficiency along the entire length of the PSOF was improved in our study.
The measured FWHMs for the spatial resolutions of the position-sensitive PSOF detectors in previous studies are listed in
Table 5, in addition to our results. Although the FWHM is related to the total length of the PSOF, the best result was obtained in our study when compared to previous studies that used the same 5 m length for the PSOF detector. The ratios of the FWHM and the total length of the PSOF in each study are listed in
Table 5, and the smallest value of 2.13% was obtained in this study.
4. Discussion
A large-scale nuclear event or accident can contaminate a wide area. Therefore, there is a need for a fast and accurate technique to detect radionuclides and to measure the radiation dose distribution for decontamination. The conventional method for measuring gamma rays in a ground survey is to use scintillation detectors or GM counters, which require significant time to detect radionuclides over a wide area because they can only provide point data within the contaminated area.
Conversely, the PSOF detector can provide simultaneous one-dimensional measuring data, saving considerable time when surveying radioactivity in a contaminated area. There are a few methods for estimating the gamma-ray source position using the PSOF detector by measuring the time difference, height of pulse, or light power difference in the transmitted path of scintillation light. Using the time difference method, many researchers estimated the position of a gamma ray with FWHMs that were in the range of 3.29–9.12% of the total length of the PSOF [
4,
15,
16,
18,
19,
20,
21,
22]. Other researchers used the difference in signal height to estimate the positions of gamma-ray sources. The FWHMs measured by them were 3.67–4.70% of the total length of the PSOF. Another method for estimating the gamma-ray source position uses the light power and height difference measured at both ends of the PSOF. However, using this method, it can be difficult to accurately measure the position of the gamma-ray source because the attenuation coefficient can be easily changed with the wavelength in the PSOF.
In this study, we measured the shortest FWHM, which was 2.13% of the total length of the PSOF, using our proposed detector. Moreover, we obtained a much improved uniform counting rate, which was in the range of 0.829–1.0, compared to the previous studies.
5. Conclusions
In this study, a position-sensitive PSOF bundle detector was fabricated, and its performance was evaluated. The proposed PSOF bundle detector was composed of a multi-cladded PSOF bundle, two PMTs, two fast amplifiers, and a digitizer. To improve the spatial resolution of the proposed PSOF bundle detector, the TTS was reduced using high-timing-response PMTs and bundle-type PSOFs as a sensing probe, and an RC-CR2 filter was designed to remove noises. In addition, the accuracy of data acquired by the digitizer was improved by applying cubic spline interpolation. The spatial resolution of our proposed PSOF bundle detector was a significant improvement over the other PSOF detectors reported in previous studies. The shortest FWHM measured using our proposed PSOF bundle was approximately 10.69 cm using a 5 m long PSOF bundle—a better value than those reported in previous studies. In addition, the relative efficiency of the proposed detector was evaluated at several positions in the PSOF, and we confirmed that our detector exhibited more uniform counting rates (0.829–1.0) than those of other PSOF detectors.
The PSOF bundle detector proposed in this study can be used for fast and accurate detection of radionuclides over wide contaminated areas, not only due to nuclear power plant accidents, but also large-scale nuclear events or accidents, including the detonation of radiological dispersal devices (RDDs) and improvised nuclear devices (INDs). The proposed 5 m length of the PSOF bundle detector can be used with a vehicle to cover larger contaminated areas [
7].
In future studies, a PSOF bundle detector of 10 m or more will be fabricated, and a new signal processing will be applied to obtain higher spatial resolution. Moreover, a two-dimensional PSOF bundle detector will be fabricated to survey radionuclides over larger contaminated areas in shorter periods of time.


