A High Precision Fiber Optic Fabry–Perot Pressure Sensor Based on AB Epoxy Adhesive Film

 , ,
, ,
Abstract
:1. Introduction
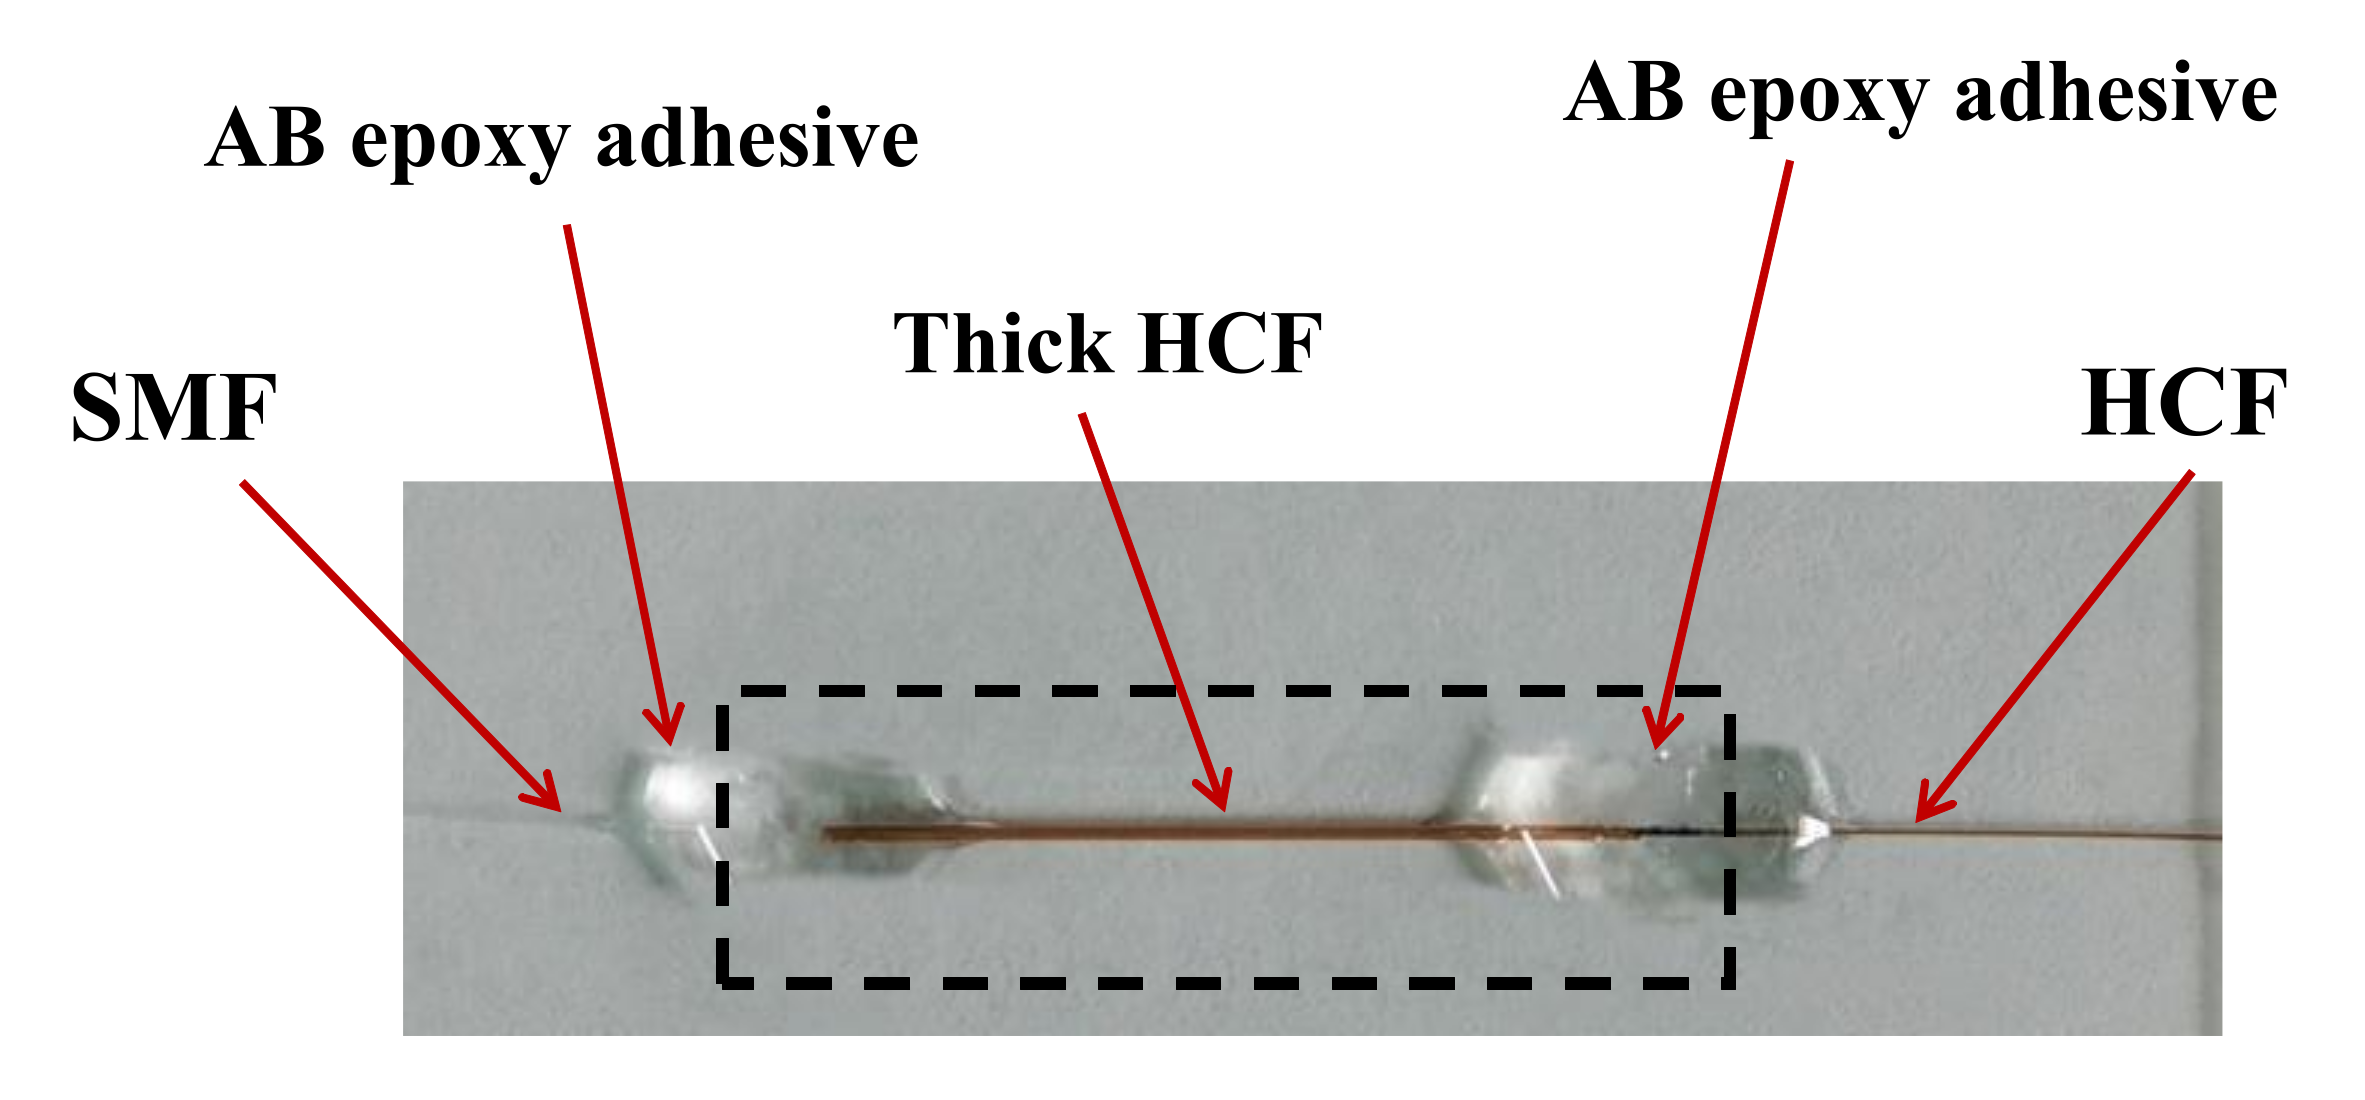
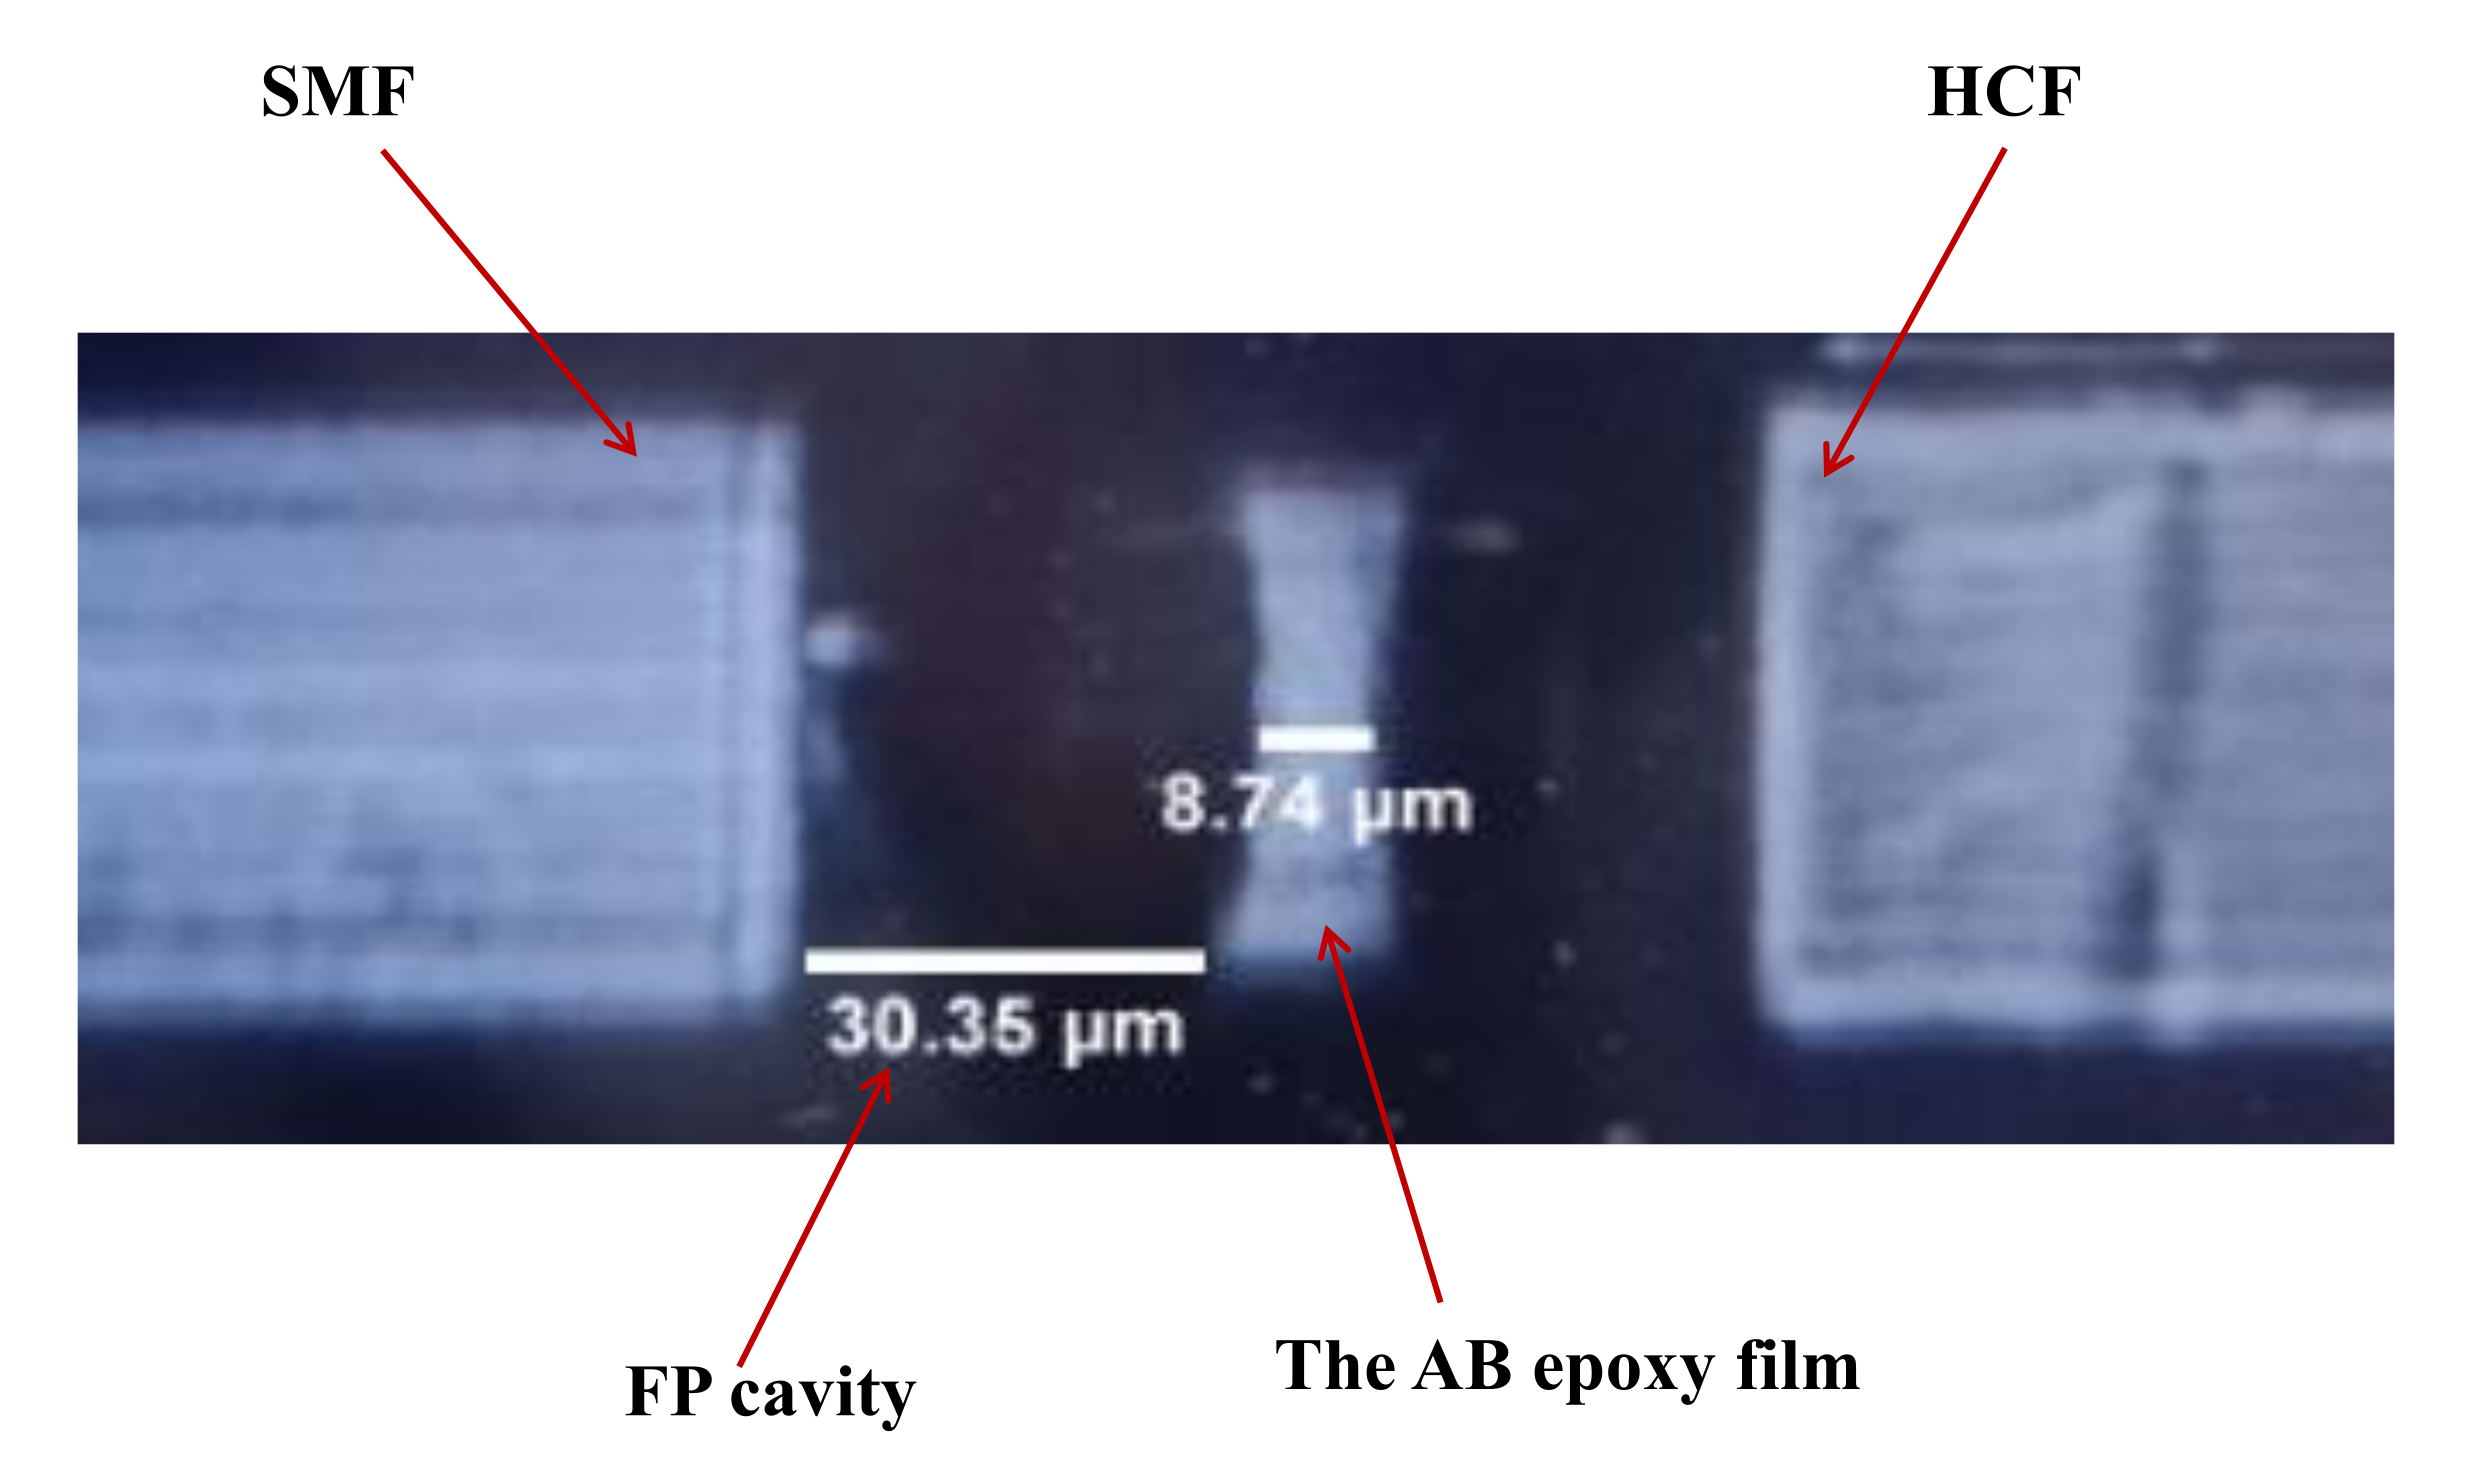
2. Fabrication and Principle
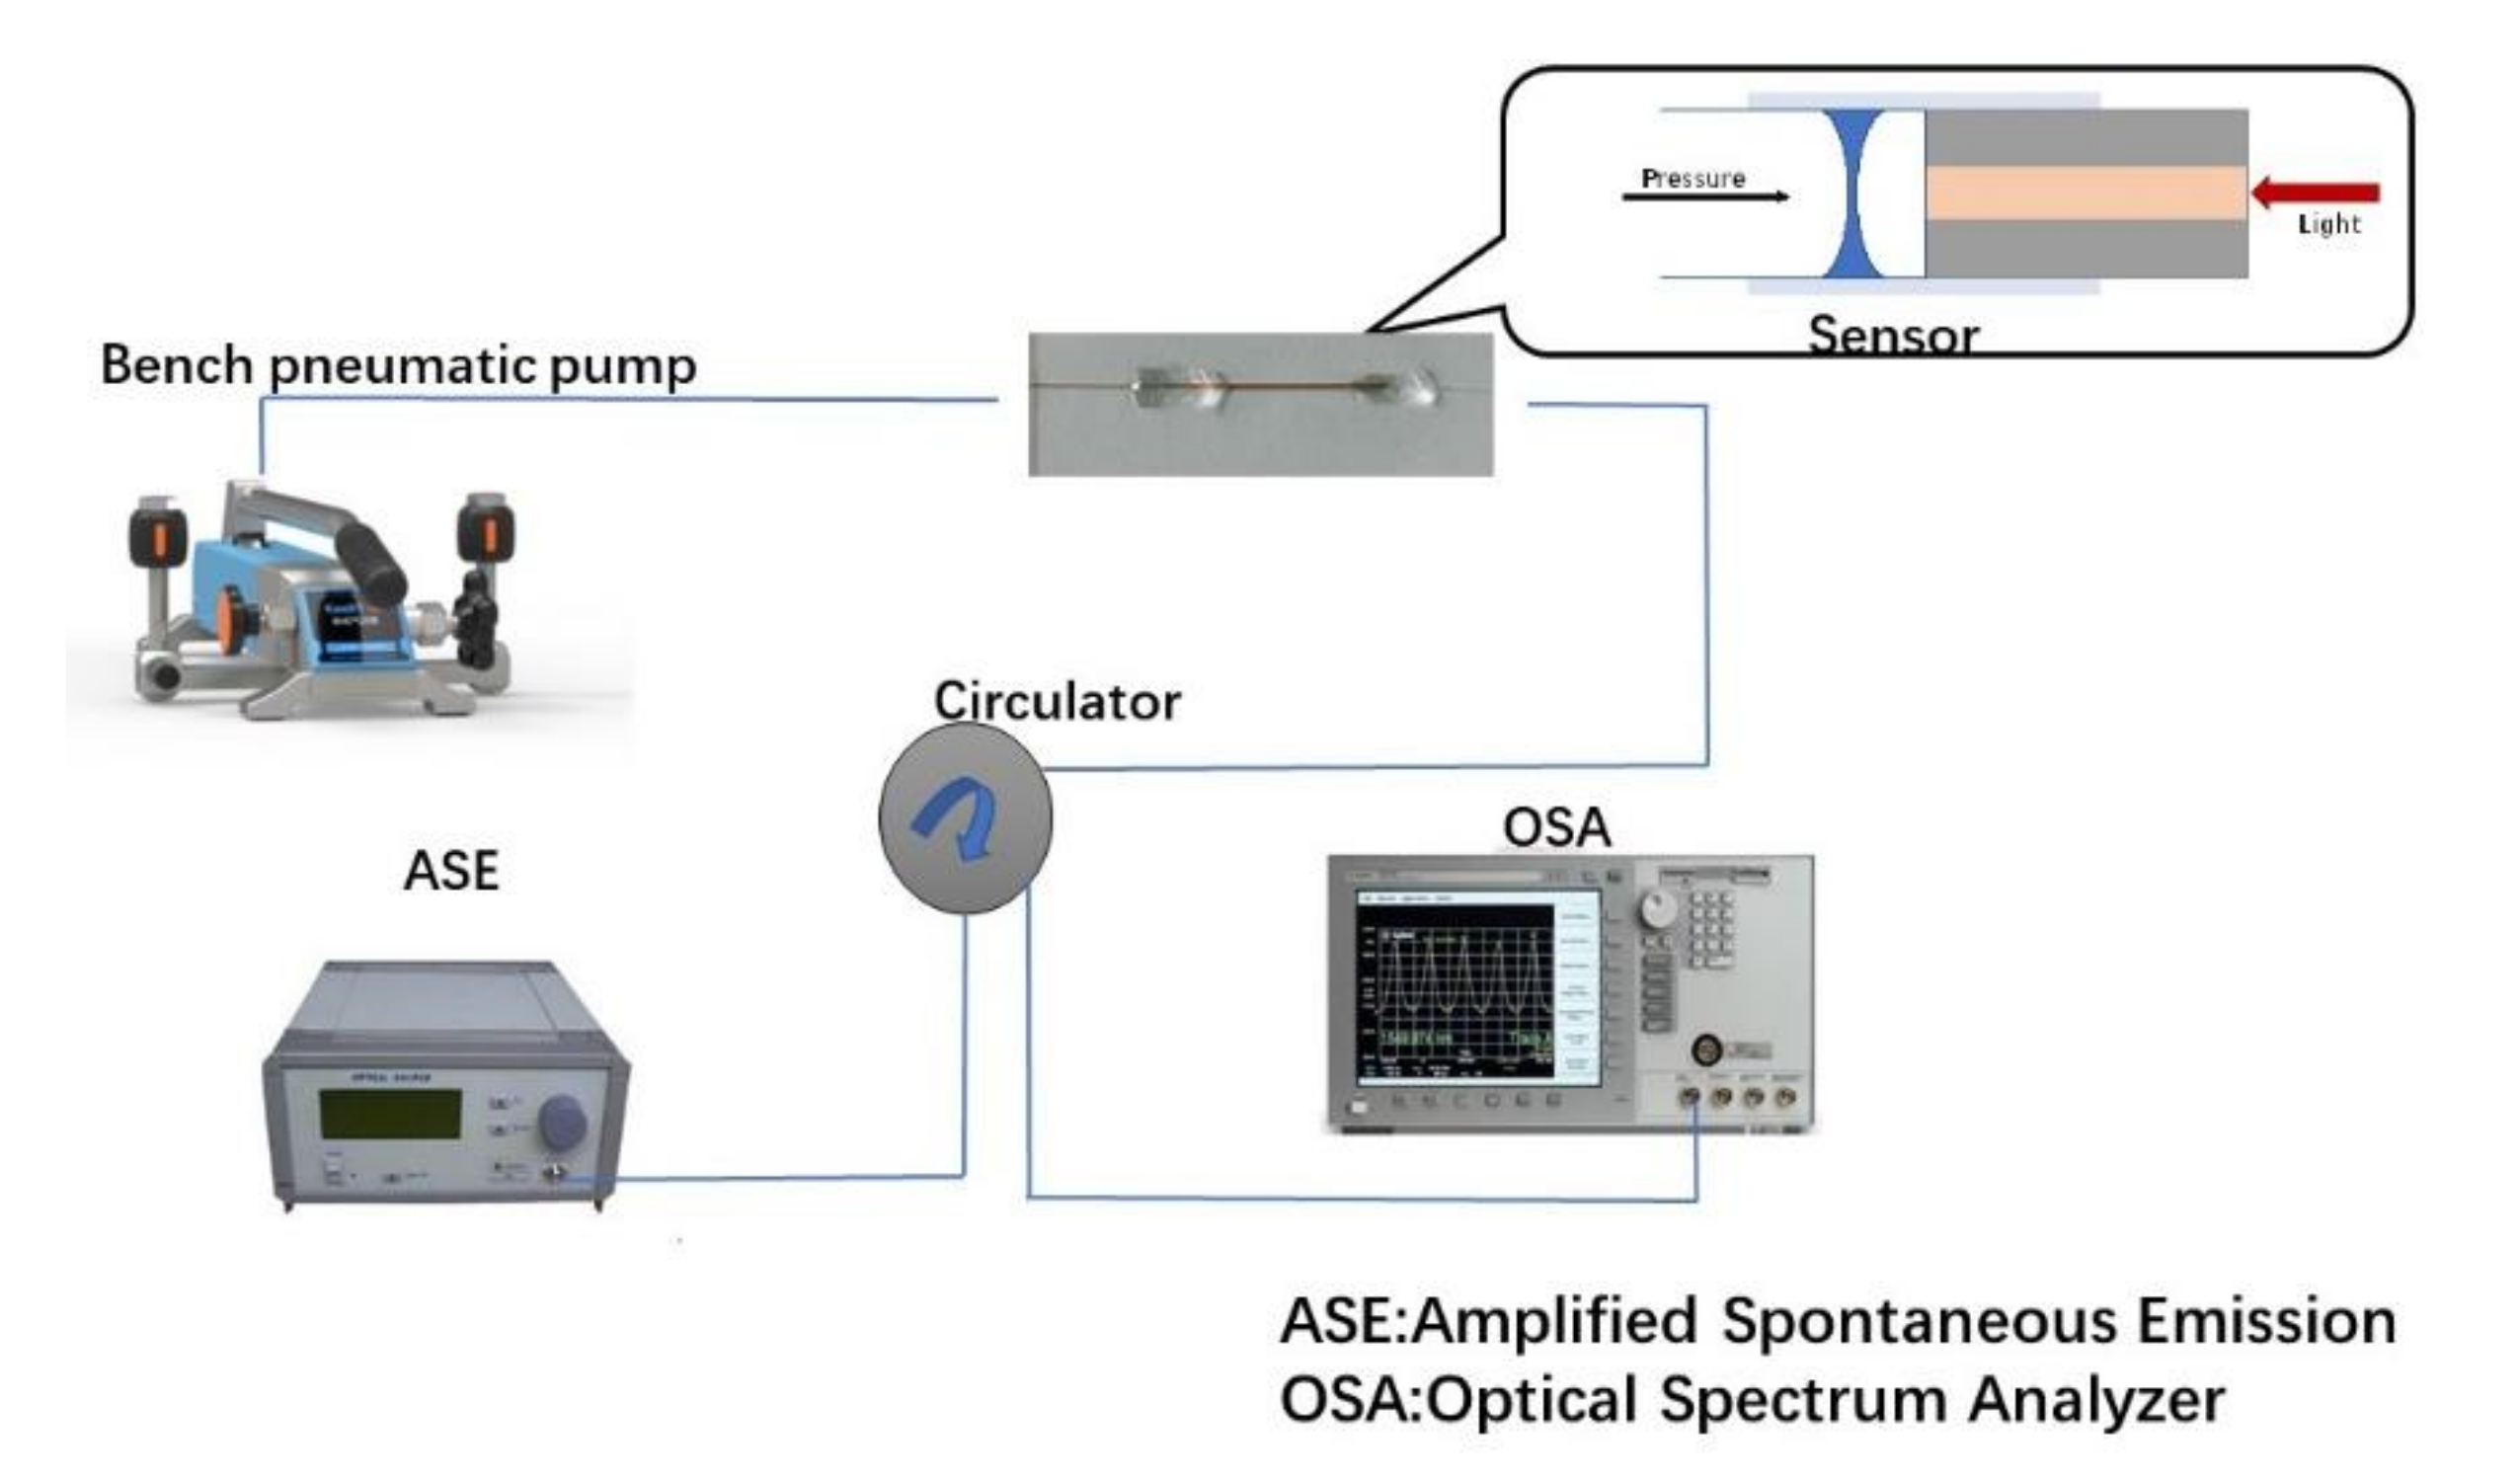
3. Testing and Analysis
4. Conclusions
Author Contributions
Funding
Institutional Review Board Statement
Informed Consent Statement
Data Availability Statement
Acknowledgments
Conflicts of Interest
References
- Gao, H.; Jiang, Y.; Zhang, L.; Cui, Y.; Jiang, J.; Jiang, L. Antiresonant mechanism based self-temperature-calibrated fiber optic Fabry–Perot gas pressure sensors. Opt. Express 2019, 27, 22181–22189. [Google Scholar] [CrossRef] [PubMed]
- Li, Z.; Zhang, Y.-X.; Zhang, W.-G.; Kong, L.-X.; Yan, T.-Y.; Geng, P.-C.; Wang, B. High-Sensitivity Gas Pressure Fabry–Perot Fiber Probe With Micro-Channel Based on Vernier Effect. J. Light. Technol. 2019, 37, 3444–3451. [Google Scholar] [CrossRef]
- Xu, F.; Ren, D.; Shi, X.; Li, C.; Lu, W.; Lu, L.; Lu, L.; Yu, B. High-sensitivity Fabry–Perot interferometric pressure sensor based on a nanothick silver diaphragm. Opt. Lett. 2012, 37, 133–135. [Google Scholar] [CrossRef] [PubMed]
- Quan, M.; Tian, J.; Yao, Y. Ultra-high sensitivity Fabry-Perot interferometer gas refractive index fiber sensor based on photonic crystal fiber and Vernier effect. Opt. Lett. 2015, 40, 4891–4894. [Google Scholar] [CrossRef] [PubMed]
- FFu, H.Y.; Tam, H.Y.; Shao, L.; Dong, X.; Wai, A.; Lu, C.; Khijwania, S.K. Pressure sensor realized with polarization-maintaining photonic crystal fiber-based Sagnac interferometer. Appl. Opt. 2008, 47, 2835–2839. [Google Scholar] [CrossRef]
- Martynkien, T.; Statkiewicz-Barabach, G.; Olszewski, J.; Wojcik, J.; Mergo, P.; Geernaert, T.; Sonnenfeld, C.; Anuszkiewicz, A.; Szczurowski, M.K.; Tarnowski, K.; et al. Highly birefringent microstructured fibers with enhanced sensitivity to hydrostatic pressure. Opt. Express 2010, 18, 15113–15121. [Google Scholar] [CrossRef] [PubMed]
- Li, Z.; Jia, P.; Fang, G.; Liang, H.; Liang, T.; Liu, W.; Xiong, J. Microbubble-based fiber-optic Fabry–Perot pressure sensor for high-temperature application. Appl. Opt. 2018, 57, 1738–1743. [Google Scholar] [CrossRef]
- Ge, Y.; Cai, K.; Wang, T.; Zhang, J. MEMS pressure sensor based on optical Fabry-Perot interference. Optik 2018, 165, 35–40. [Google Scholar] [CrossRef]
- Domingues, M.F.; Rodriguez, C.A.; Martins, J.; Tavares, C.; Marques, C.; Alberto, N.; André, P.; Antunes, P. Cost-effective optical fiber pressure sensor based on intrinsic Fabry-Perot interferometric micro-cavities—ScienceDirect. Opt. Fiber Technol. 2018, 42, 56–62. [Google Scholar] [CrossRef]
- Zhao, Y.; Chen, M.-Q.; Xia, F.; Lv, R.-Q. Small In-fiber Fabry-Perot low-frequency acoustic pressure sensor with PDMS diaphragm embedded in hollow-core fiber. Sens. Actuators A Phys. 2018, 270, 162–169. [Google Scholar] [CrossRef]
- Gao, H.; Wang, J.; Shen, J.; Zhang, S.; Xu, D.; Zhang, Y.; Li, C. Study of the Vernier Effect Based on the Fabry–Perot Interferometer: Methodology and Application. Photonics 2021, 8, 304. [Google Scholar] [CrossRef]
- Liao, C.; Liu, S.; Xu, L.; Wang, C.; Wang, Y.; Li, Z.; Wang, Q.; Wang, D.N. Sub-micron silica diaphragm-based fiber-tip Fabry–Perot interferometer for pressure measurement. Opt. Lett. 2014, 39, 2827–2830. [Google Scholar] [CrossRef] [Green Version]
- Yeo, T.; Sun, T.; Grattan, K. Fibre-optic sensor technologies for humidity and moisture measurement. Sens. Actuators A Phys. 2008, 144, 280–295. [Google Scholar] [CrossRef]
- Coulet, P.R.; Blum, L.J.; Gautier, S.M. Luminescence-based fibre-optic probes. Sens. Actuators B Chem. 1993, 11, 57–61. [Google Scholar] [CrossRef]
- He, L.; Pagneux, Q.; Larroulet, I.; Serrano, A.Y.; Pesquera, A.; Zurutuza, A.; Mandler, D.; Boukherroub, R.; Szunerits, S. Label-free femtomolar cancer biomarker detection in human serum using graphene-coated surface plasmon resonance chips. Biosens. Bioelectron. 2017, 89, 606–611. [Google Scholar] [CrossRef] [PubMed]
- Min, R.; Liu, Z.; Pereira, L.; Yang, C.; Sui, Q.; Marques, C. Optical fiber sensing for marine environment and marine structural health monitoring: A review. Opt. Laser Technol. 2021, 140, 107082. [Google Scholar] [CrossRef]
- Chen, M.Q.; Zhao, Y.; Xia, F.; Peng, Y.; Tong, R.J. High sensitivity temperature sensor based on fiber Air-Microbubble Fabry-Perot interferometer with PDMS-filled hollow-core fiber. Sens. Actuators A Phys. 2018, 275, 60–66. [Google Scholar] [CrossRef]
- Beheim, G.; Fritsch, K.; Poorman, R.N. Fiber-linked interferometric pressure sensor. Rev. Sci. Instrum. 1987, 58, 1655–1659. [Google Scholar] [CrossRef]
- Liu, S.; Yang, K.; Wang, Y.; Qu, J.; Liao, C.; He, J.; Li, Z.; Yin, G.; Sun, B.; Zhou, J.; et al. High-sensitivity strain sensor based on in-fiber rectangular air bubble. Sci. Rep. 2015, 5, 7624. [Google Scholar] [CrossRef] [PubMed] [Green Version]
- Donlagic, D.; Cibula, E. All-fiber high-sensitivity pressure sensor with SiO2 diaphragm. Opt. Lett. 2005, 30, 2071–2073. [Google Scholar] [CrossRef]
- Xu, B.; Wang, C.; Wang, D.N.; Liu, Y.; Li, Y.J.O.E. Fiber-tip gas pressure sensor based on dual capillaries. Opt. Express 2015, 23, 23484–23492. [Google Scholar] [CrossRef] [PubMed]
- Wang, X.; Xu, J.; Zhu, Y.; Cooper, K.L.; Wang, A. All-fused-silica miniature optical fiber tip pressure sensor. Opt. Lett. 2006, 31, 885–887. [Google Scholar] [CrossRef] [PubMed]
- Wang, T.; Ge, Y.; Ni, H.; Chang, J.; Zhang, J.; Ke, W. Miniature fiber pressure sensor based on an in-fiber confocal cavity. Optik 2018, 171, 869–875. [Google Scholar] [CrossRef]
- Oliveira, R.F.; Bilro, L.; Nogueira, R.; Rocha, A.M.M. Adhesive Based Fabry-Pérot Hydrostatic Pressure Sensor With Improved and Controlled Sensitivity. J. Lightwave Technol. 2019, 37, 1909–1915. [Google Scholar] [CrossRef]
- Luo, C.; Liu, X.; Liu, J.; Shen, J.; Li, H.; Zhang, S.; Hu, J.; Zhang, Q.; Wang, G.; Huang, M. An Optimized PDMS Thin Film Immersed Fabry-Perot Fiber Optic Pressure Sensor for Sensitivity Enhancement. Coatings 2019, 9, 290. [Google Scholar] [CrossRef] [Green Version]
- Zhang, S.; Shao, Z.; Liu, J.; Zong, M.; Shen, J.; Gao, H.; Wang, G.; Huang, M. An Optical Fiber Fabry—Perot Pressure Sensor with Optimized Thin Microbubble Film Shaping for Sensitivity Enhancement. Coatings 2020, 10, 358. [Google Scholar] [CrossRef] [Green Version]
- Wei, X.; Song, X.; Li, C.; Hou, L.; Li, Z.; Li, Y.; Ran, L. Optical Fiber Gas Pressure Sensor Based on Polydimethylsiloxane Microcavity. J. Lightwave Technol. 2021, 39, 2988–2993. [Google Scholar] [CrossRef]
- Rao, Y.-J.; Deng, M.; Duan, D.; Zhu, T. In-line fiber Fabry-Perot refractive-index tip sensor based on endlessly photonic crystal fiber. Sens. Actuators A Phys. 2008, 148, 33–38. [Google Scholar] [CrossRef]
- Osório, J.H.; Chesini, G.; Serrão, V.A.; Franco, M.A.R.; Cordeiro, C.M.B. Simplifying the design of microstructured optical fibre pressure sensors. Sci. Rep. 2017, 7, 1–9. [Google Scholar] [CrossRef] [Green Version]
- Hou, L.; Zhao, C.; Xu, B.; Mao, B.; Shen, C.; Wang, D.N. Highly sensitive PDMS-filled Fabry-Perot interferometer temperature sensor based on the Vernier effect. Appl. Opt. 2019, 58, 4858–4865. [Google Scholar] [CrossRef] [PubMed]
- Zhao, C.; Hou, L.; Kang, J.; Mao, B.; Shen, C.; Jin, S. High-sensitivity hydraulic pressure sensor based on Fabry-Perot interferometer filled with polydimethylsiloxane film. Rev. Sci. Instrum. 2019, 90, 095002. [Google Scholar] [CrossRef] [PubMed]
- Zhe, Z.; He, J.; Liao, C.; Jian, T.; Wang, Y. A novel fabrication method of fiber-tip Fabry-Perot interferometer for high-sensitivity gas-pressure measurements. In Proceedings of the 2017 16th International Conference on Optical Communications and Networks (ICOCN), Wuzhen, China, 7–10 August 2017. [Google Scholar]
- Liu, S.; Wang, Y.; Liao, C.; He, J.; Fu, C.; Yang, K.; Bai, Z.; Zhang, F. Nano silica diaphragm in-fiber cavity for gas pressure measurement. Sci. Rep. 2017, 7, 1–9. [Google Scholar] [CrossRef]
- Ma, J.; Ju, J.; Jin, L.; Jin, W. A Compact Fiber-Tip Micro-Cavity Sensor for High-Pressure Measurement. IEEE Photonics Technol. Lett. 2011, 23, 1561–1563. [Google Scholar] [CrossRef]
- Guo, X.; Zhou, J.; Du, C.; Wang, X. Highly Sensitive Miniature All-Silica Fiber Tip Fabry–Perot Pressure Sensor. IEEE Photonics Technol. Lett. 2019, 31, 689–692. [Google Scholar] [CrossRef]


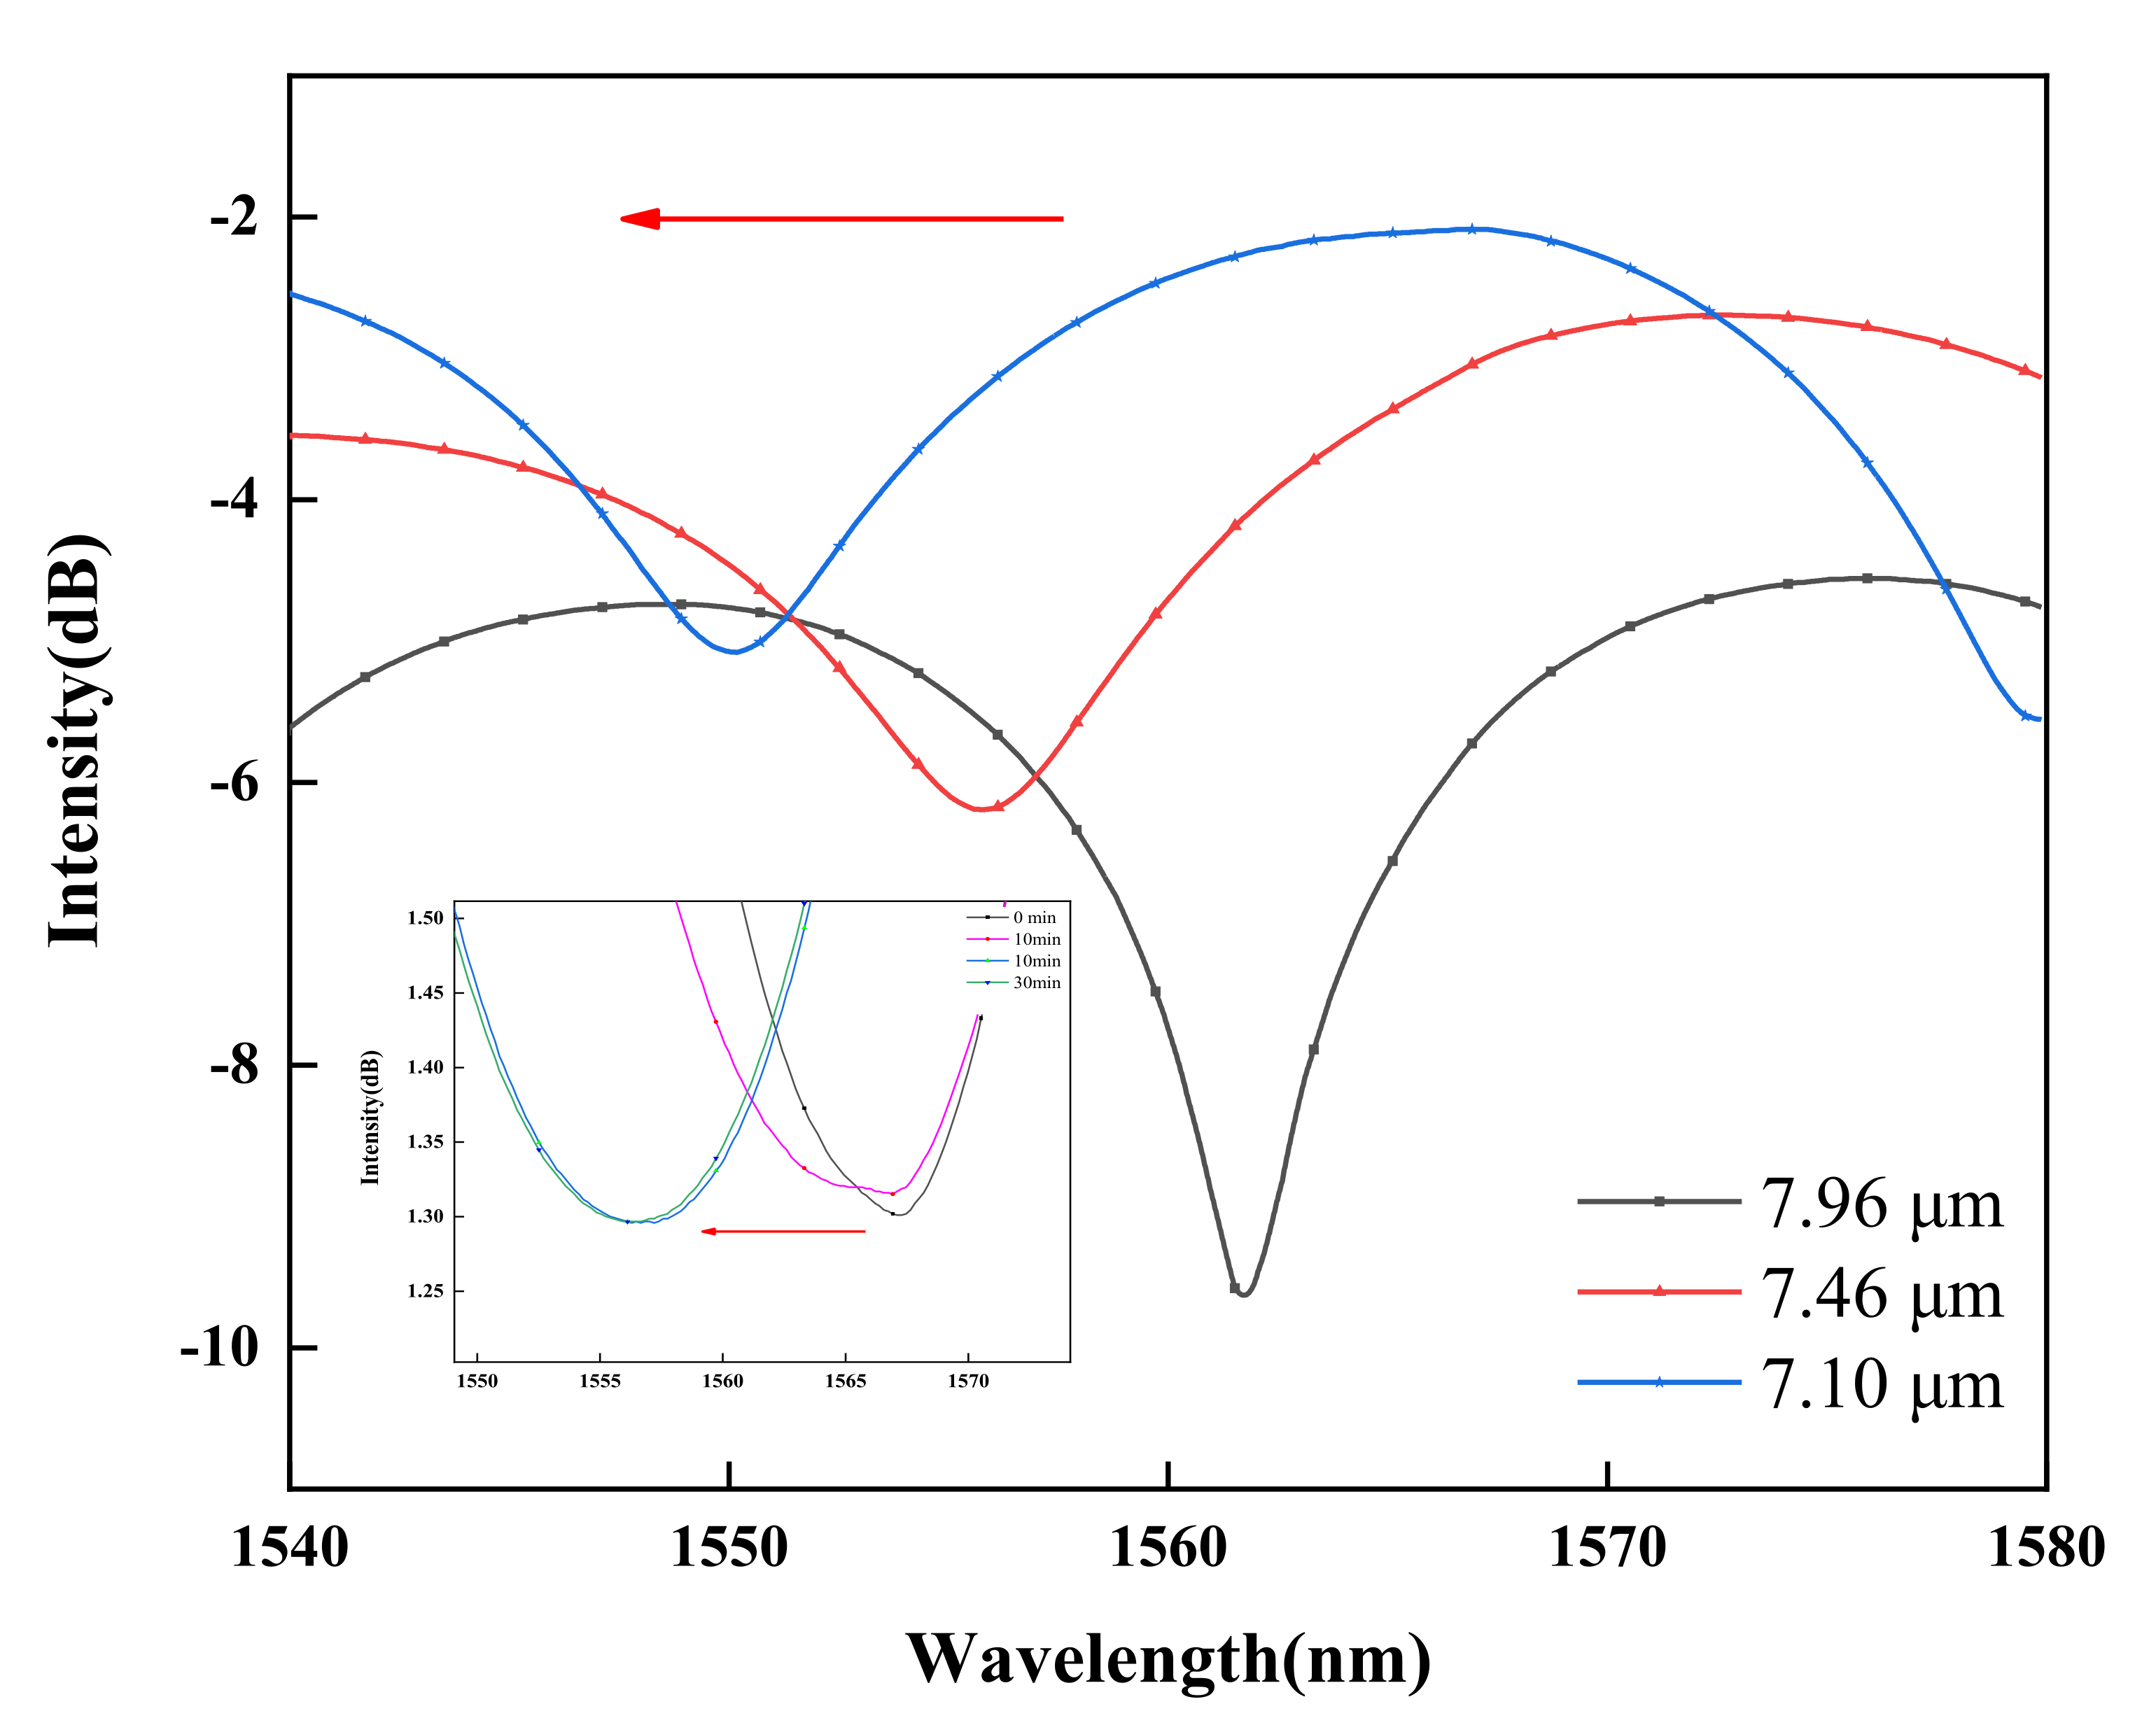
| Thickness | 7.96 μm | 7.46 μm | 7.10 μm |
| Pressure | 0–50 kPa | 0–10 kPa | 0–8 kPa |
| Sensitivity | 63.36 nm/MPa | 297 nm/MPa | 331.2 nm/MPa |
| Source (Time) | 2014 [12] | 2020 [26] | 2021 [27] | This paper |
| Materials | sub-micron silica | silicon microbubbles | PDMS | AB epoxy adhesive |
| Pressure range | 0–2000 kPa | 100–1600 kPa | 100–700 kPa | 10–70 kPa |
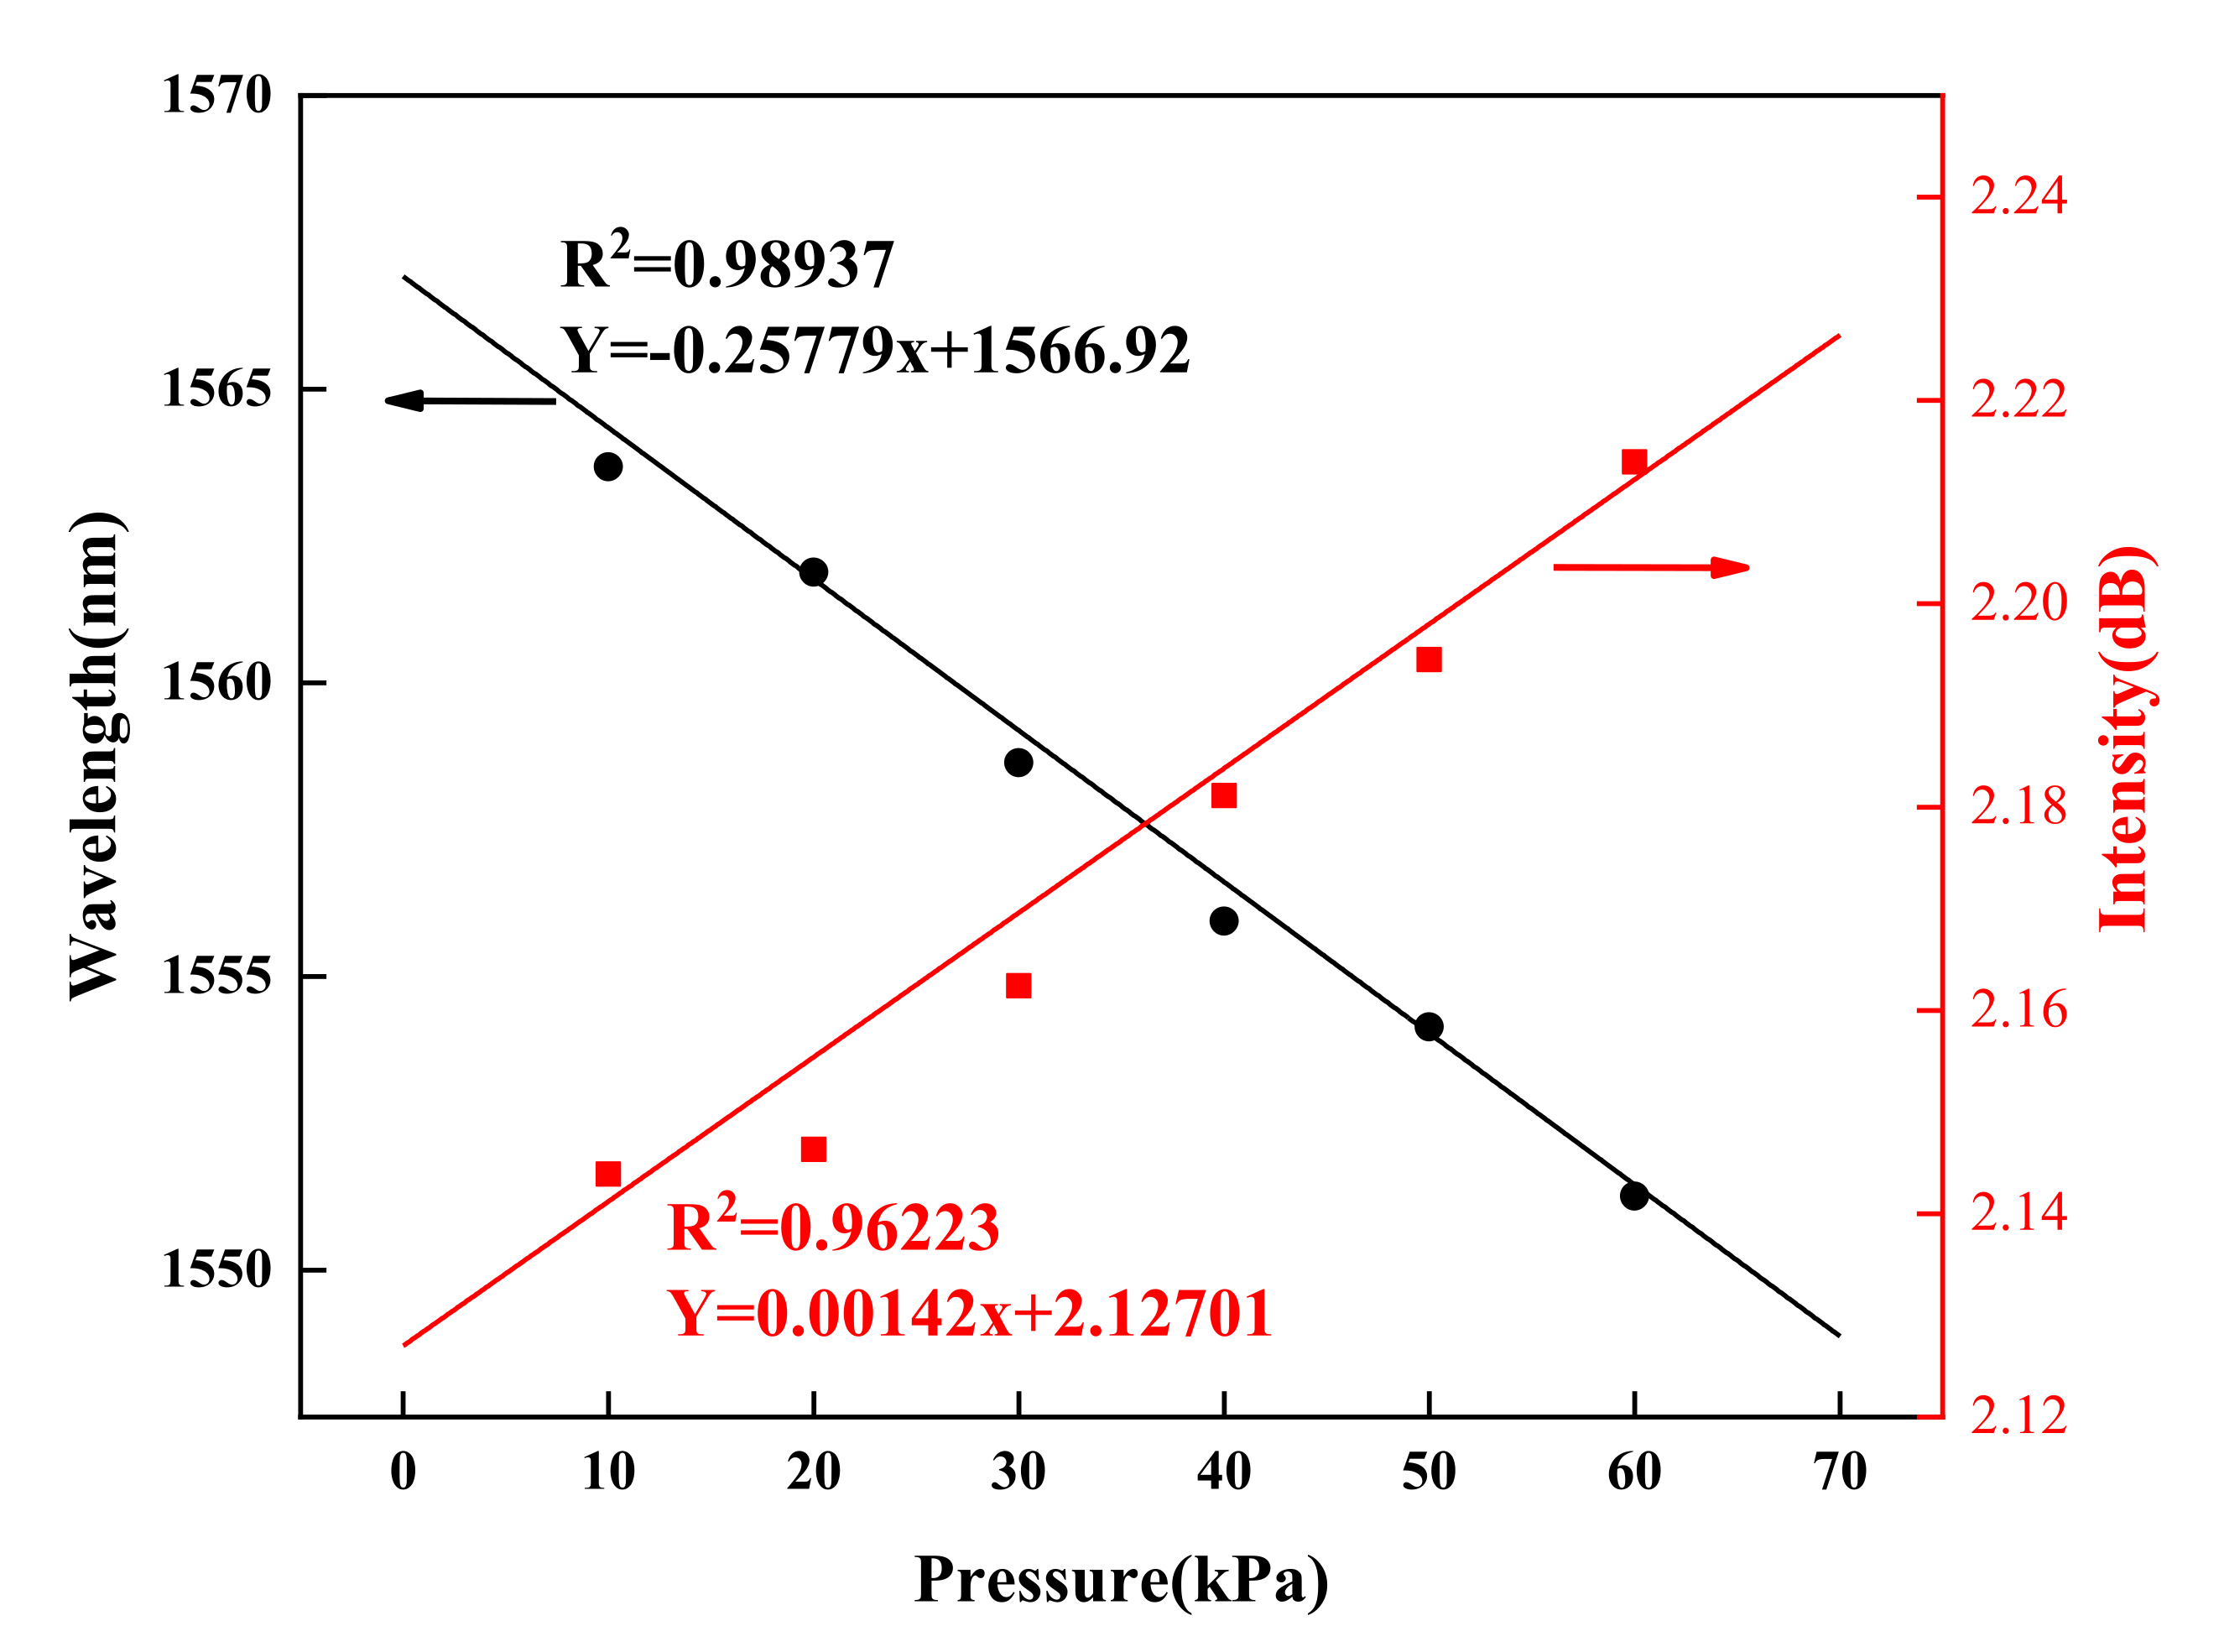
| Sensitivity | 1036 pm/MPa | 6790 pm/MPa | 52.143 nm/MPa | 257.79 nm/MPa |
Publisher’s Note: MDPI stays neutral with regard to jurisdictional claims in published maps and institutional affiliations. |
© 2021 by the authors. Licensee MDPI, Basel, Switzerland. This article is an open access article distributed under the terms and conditions of the Creative Commons Attribution (CC BY) license (https://creativecommons.org/licenses/by/4.0/).
Share and Cite
Zhang, Y.; Zhang, S.; Gao, H.; Xu, D.; Gao, Z.; Hou, Z.; Shen, J.; Li, C. A High Precision Fiber Optic Fabry–Perot Pressure Sensor Based on AB Epoxy Adhesive Film. Photonics 2021, 8, 581. https://doi.org/10.3390/photonics8120581
Zhang Y, Zhang S, Gao H, Xu D, Gao Z, Hou Z, Shen J, Li C. A High Precision Fiber Optic Fabry–Perot Pressure Sensor Based on AB Epoxy Adhesive Film. Photonics. 2021; 8(12):581. https://doi.org/10.3390/photonics8120581
Chicago/Turabian StyleZhang, Yanan, Shubin Zhang, Haitao Gao, Danping Xu, Zhuozhen Gao, Zheyu Hou, Jian Shen, and Chaoyang Li. 2021. "A High Precision Fiber Optic Fabry–Perot Pressure Sensor Based on AB Epoxy Adhesive Film" Photonics 8, no. 12: 581. https://doi.org/10.3390/photonics8120581