Communication

Tracing Evolution of Angle-Wavelength Spectrum along the 40-m Postfilament in Corridor Air

by
Daria V. Mokrousova
1,2,
Dmitrii V. Pushkarev
1,2,*,
Nikolay A. Panov
1,2,3,
Irina A. Nikolaeva
1,3,
Daniil E. Shipilo
1,
Nikita A. Zhidovtsev
3,
Georgy E. Rizaev
1,2,
Daria S. Uryupina
2,3,
Arnaud Couairon
4,
Aurélien Houard
5,
Dmitry V. Skryabin
6,
Andrey B. Savel’ev
1,3,
Olga G. Kosareva
1,3,
Leonid V. Seleznev
1,2 and
Andrey A. Ionin
1
1
P. N. Lebedev Physical Institute of the Russian Academy of Sciences, 53 Leninskiy Prospect, 119991 Moscow, Russia
2
V. E. Zuev Institute of Atmospheric Optics SB RAS, 1 Academician Zuev Square, 634055 Tomsk, Russia
3
Faculty of Physics, Lomonosov Moscow State University, Leninskie Gory, 119991 Moscow, Russia
4
CPHT, CNRS, Ecole Polytechnique, Institut Polytechnique de Paris, Route de Saclay, F-91128 Palaiseau, France
5
LOA, ENSTA Paris, CNRS, Ecole Polytechnique, Institut Polytechnique de Paris, 828 Bd des Maréchaux, F-91762 Palaiseau, France
6
Department of Physics, University of Bath, Bath BA2 7AY, UK
*
Author to whom correspondence should be addressed.
Photonics 2021, 8(10), 446; https://doi.org/10.3390/photonics8100446
Submission received: 12 September 2021 / Revised: 3 October 2021 / Accepted: 11 October 2021 / Published: 15 October 2021
(This article belongs to the Special Issue Optical Solitons: Current Status)

Abstract

:
Postfilamentation channel resulting from filamentation of freely propagating 744-nm, 5-mJ, 110-fs pulse in the corridor air is examined experimentally and in simulations. The longitudinal extension of postfilament was determined to be 55–95 m from the compressor output. Using single-shot angle-wavelength spectra measurements, we observed a series of red-shifted maxima in the spectrum, localized on the beam axis with the divergence below 0.5 mrad. In the range 55–70 m, the number of maxima and their red-shift increase with the distance reaching 1 μm, while the pulse duration measured by the autocorrelation technique is approximately constant. Further on, for distances larger than 70 m and up to 95 m, the propagation is characterized by the suppressed beam divergence and unchanged pulse spectrum. The pulse duration increases due to the normal air dispersion.

1. Introduction

Nonlinear propagation of a collimated high-power ultrashort laser pulse in ambient air [1] results in the beam collapse [2,3] and filamentation [4,5,6]. During filamentation, the laser radiation localizes into single or multiple filaments due to the dynamic equilibrium between Kerr self-focusing and defocusing in the self-induced plasma [7,8,9,10,11,12]. Applications of filamentation in air include atmospheric remote sensing [13,14,15,16,17,18], triggering and guiding of high-voltage discharges [19,20,21,22], lightning control [23,24,25], filament-induced breakdown spectroscopy [26,27,28,29].
The filament in air produced by Ti:sapphire laser pulses is characterized by the key parameters such as the clamped intensity of about 100 TW/cm2 [30,31,32], plasma density of 10 16 10 17 cm−3 [33,34] and diameter of ∼100 μm [4,35]. By the filament we mean spatio-temporally localized light structure accompanied by plasma channel. Therefore, the filament length is equal to the plasma length. The light channel induced by the same femtosecond pulse can be much longer than the plasma channel and it can reach tens to hundreds of meters [36,37,38]. Within extended light channels the bursts of plasma separated by the light channels were detected up to 1.5 km [36]. More than fifteen-meter uninterrupted light channels formed by sub-terawatt ultraviolet pulse were reported in [39]. In the case of 60-GW 744-nm pulse filamentation in the 100-m corridor, the plasma channel was only 0.5 m long [40].
Filamentation is accompanied by significant broadening of the angle-wavelength spectrum [4,5,6]. The initially ∼20-nm-width spectrum of the ∼800-nm pulse was reported to expandto ∼15 μm [41] in the infrared and to ∼250 nm in the ultraviolet [42] ranges. One or several separated Raman humps were formed in the infrared part of the spectrum [43,44]. The angular distribution of femtosecond pulse in the filament is represented by shorter wavelengths propagating at larger angles. For a single filament the color rings surround the beam propagation axis [5,6]. In opposite, the infrared wing of the spectrum tends to converge towards the axis producing a light bullet [45,46,47]. In the temporal domain the pulse is self-compressed down to ∼10 fs pulse in atmospheric pressure gases and in the collimated beam geometry [48,49].
The angle-wavelength spectrum of the pulse in the air filament has been studied on a several-meter propagation path under loose focusing and allowed the authors of [45,47] to experimentally observe the conical blue-shifted as well as the infrared on-axis part of the spectrum. In [45] the measurements were conducted with averaging over 50 laser shots, while in [47] each angle-wavelength spectrum was taken in single laser shot, which allowed clear observation of Stockes-shifted on-axis humps in the spectrum. In the case of the long-range filamentation an essential fraction of the light channel is represented by postfilament, characterized by the intensity of a few TW/cm2, the lack of detectable plasma and low angular divergence [38,50]. The unprecedently long high-intensity zone causes nonlinear transformation of supercontinuum produced in the plasma channel into multiple infrared spectral humps [40], the angular distribution of which is not known as for now. The nonlinear pulse transformation in the collimated beam geometry makes it possible to explicitly observe angular redistribution of the new wavelengths born in the plasma channel. The information on directionality of the infrared humps in the postfilament is important for remote sensing applications.
In this work we launch 5-mJ, 110-fs, 744-nm pulse onto a 100 m path in air in a single-filament regime and experimentally study single-shot angle-wavelength spectra of the postfilament. We observed the localized spectral maxima spanned till 1 μm with angular divergence of about 0.5 mrad. The number of maxima increases from one to about five as the distance increases from 55 to 70 m. The autocorrelation traces show the constant pulse duration within the same 55–70 m range. In order to locate the postfilament on the propagation path we recorded transverse fluence distributions at the distances 40–150 m from the laser system output and showed that the Kerr nonlinearity keeps the self-cleaned beam with almost the same radius below 1 mm from 55 to 95 m. Numerical ( t , r ) + z simulations on a 100-m path reproduce angle-wavelength spectra and autocorrelation traces in agreement with the experiment.

2. Materials And Methods
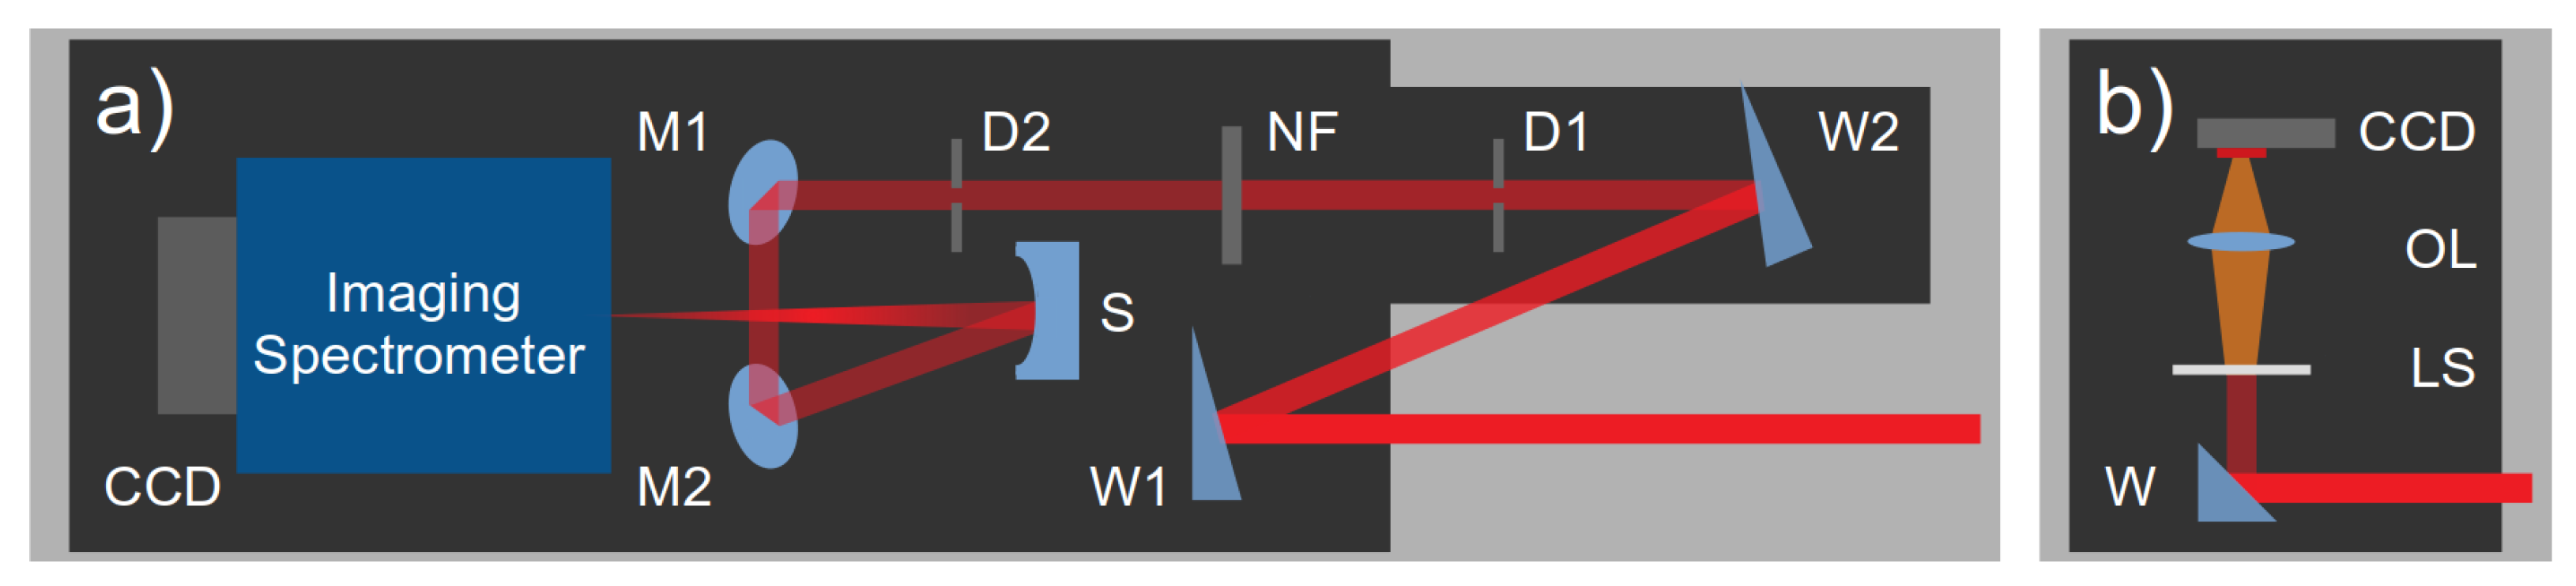
2.1. Experiment

In the experiment we used pulses from commercial Ti:Sapphire laser system (Avesta ltd.) with central wavelength of 744 nm, duration of about 110 fs (at e 1 level) and energy of ∼5 mJ. The initial beam diameter was 8 mm (full width at e 1 of fluence maximum). After the set of high-reflective mirrors, the last of which was located at a distance of about z = 11 m from the laser system output, the beam propagated freely inside the corridor up to the distance of z = 95 m. At this distance the comparatively low-intensity beam was reflected by another high-reflective mirror without damaging it. Thus, the propagation path was elongated to 150 m available for measurements.
The beam was initially elliptic with the eccentricity of 0.65 ± 0.05 due to the presence of the off-axis telescope in the laser system. The telescope introduced wavefront astigmatism and caused different divergence along the vertical and horizontal beam axes. The average geometrical divergence of the beam was equivalent to the focal distance of about 50 m. The described beam configuration combined with our laser pulse duration and energy enabled us to avoid self-focusing collapse within the first 11 m of the optical path in the corridor. Figure 1 represents the initial angle-wavelength spectrum of laser radiation (a) and transverse fluence distribution (b) at the beginning of the corridor path.
The transverse fluence distribution in our beam was taken with the CCD-camera Ophir Spiricon SP620U. As the beam diameter eventually was larger than the size of our CCD camera matrix, we used the visualization system based on the luminescence phenomenon (Figure 2b). The laser beam hit the screen (LS) and the luminescence of this screen was projected to the CCD surface (CCD) by the objective lens (OL). We used the preliminary performed calibration of this screen luminescence to obtain the transverse fluence distribution from the luminescence data. In order to attenuate laser radiation and prevent the screen from damage, we sent the Fresnel reflection of the beam from the front face of the wedge (W) to this luminescent screen. To attenuate the light efficiently, we chose the reflection angle to be close to the Brewster’s one. Therefore, small deviations in the angle of incidence led to the essential change in the reflection coefficient. That is why the comparison between the fluence values obtained from the experimentally measured beam profiles at different distances was not possible. The distance between the wedge and the luminescent screen was about 5 cm. The propagation of this attenuated beam led to the beam core divergence, so the values of the beam radius are slightly overestimated in the experimental data. The described beam divergence explains the fact that the minimum beam diameter of ∼1 mm measured by us is larger than the filament core diameter of less than ∼200 μm [51]. At each distance we took 32 profiles (see examples in Figure 3) and for each realization found vertical and horizontal beam radius. From these data we calculated average value and standard deviation that are shown in Figure 4.
In order to characterize spectra at different distances along the postfilament, we used spectrometer Avesta ASP-150 (Avesta Project Ltd.) and imaging spectrometer SOLAR Laser Systems M150i equipped with the CCD-camera TheImagingSource dmk33GX249 (12 bit/px). The scheme of the angle-wavelength spectra measurement setup is shown in Figure 2a. The glass wedge W1 terminates nonlinear beam propagation at a desired distance. Wedges W1 and W2 direct the beam to the spectrometer. We aligned the beam using two diaphragms D1 and D2 and removed them before the measurements so as to ensure the same propagation geometry inside the spectrometer through all the sets of data collection. After attenuation by neutral density filters NF, the beam was directed by aluminium-coated 2-inch mirrors M1 and M2 to the centre of the spherical mirror S. Such geometry provides the least angle of incidence and thus the smallest aberrations. Imaging spectrometer’s slit was in the focus of the spherical mirror S, and the beam was aligned to enter the spectrometer perpendicular to the plane of the entrance slit.
Imaging spectrometer provides angle- and wavelength-resolved intensity distribution in a single laser shot, therefore, being a powerful tool for filamentation studies. However, our opportunities to employ this technique were limited by the following two factors. On the one hand, there was a part of our propagation path extended from 50 to 60 m where we were unable to measure the angle-wavelength spectra without damaging the first glass wedge. On the other hand, starting from 100 m, the beam size started growing noticeably and did not fit into the angle-wavelength measurement setup. Therefore, we were able to obtain the angle-wavelength spectra only in the limited range of distances from 60 m to 95 m (Figure 5, right column, Figure 6) and before the collapse at 13 m (Figure 1a).
To complete our studies with the data from shorter (as compared with 60 m) and longer distances (up to 150 m), we recorded spectra without angular resolution. The beam was reflected from a glass plate and directed to the spectrometer. The spectrometer entrance slit was aligned with the brightest spot in the transverse distribution so as to detect the part of the beam, which experienced the strongest nonlinear transformation. At each distance, we recorded 10 to 20 spectra and processed them to extract the wavelength with the brightest red-shifted separated maximum (hump) (Figure 7).
The autocorrelation functions were obtained using autocorrelator Avesta ASF 20 CrossCorrel. The laser beam reflected from a glass wedge was directed to the autocorrelator entrance. As the beam wandering in the transverse direction took place, we chose only the shots with the autocorrelation function located near the centre of the autocorrelator’s CCD matrix (i.e., the ones with the best alignment).

2.2. Simulations

Numerical simulations are based on the Forward Maxwell Equation (FME) [52,53,54], a paraxial carrier-wave-resolved propagation equation for the time-domain Fourier harmonics E ^ ( ω , r , z ) of the electric field E ( t , r , z ) :
E ^ ( ω ) z = i k ( ω ) + Δ 2 k ( ω ) E ^ ( ω ) 2 π c J ^ ( ω ) ,
where t is the time, ω is the angular frequency, r is the transverse coordinate, z is the propagation distance, k ( ω ) = ω n ( ω ) / c is a wave number, n ( ω ) is the refractive index of air, c is the speed of light in vacuum, and Δ = r 1 / r ( r / r ) .
As the energy of the laser pulse is moderate, and we observe formation of a single filament, the simulations were carried out in axially-symmetrical ( t , r ) + z geometry in the experimental conditions for the linearly polarized input field:
E ( t , r , z = 0 ) = E 0 exp r 2 2 a 0 2 t 2 2 τ 0 2 cos ( ω 0 t )
where E 0 is the electric field amplitude corresponding to the energy of 6 mJ, 2 τ 0 = 108   fs is pulse duration; the input beam diameter is 2 a 0 = 8   mm .
The nonlinear current in Equation (1) J ( t ) = J free + J abs + P inst / t + P rot / t includes free electron J free ( t ) and absorption J abs ( t ) currents, the third-order instantaneous P inst ( t ) and delayed P rot polarization, see the details in Ref. [55]. Technical details about the grids used can be found in Ref. [40].

3. Results And Discussion

3.1. Postfilament Length

Figure 3 shows transverse fluence distributions of the pulse in the corridor within the distance range z = 40 –150 m from the compressor output. Within the distance range 13–40 m the beam contracts due to self-focusing. This contraction is accompanied by significant increase of the beam eccentricity due to the initial ellipticity and astigmatic phase (compare Figure 1b and Figure 3, z = 40 m). Moreover, self-focusing causes faster beam collapse along the shorter ellipse axis due to the higher intensity gradient along it, that additionally increases beam eccentricity while approaching the nonlinear focus. Between 40 and 55 m, the initially elliptical beam transforms to the axially symmetrical one [56]. It is a manifestation of spatial mode self-cleaning process [57]. Indeed, the initial pulse peak power of ∼50 GW exceeds the critical power for self-focusing by a factor of 5, which is enough for elliptical beam self-focusing but insufficient for the second filament formation [58]. In the range of distances 50–60 m, the average beam radius r (Figure 4) abruptly decreases from ∼1.5 to ∼1 mm. We associate this radius decrease with the presence of the nonlinear focus and formation of a short single filament and the corresponding ∼0.5-m plasma channel [40] at ∼55 m. The presence of plasma is evidenced by the conical emission in the angle-wavelength spectra (Figure 5, z = 65 m, and Figure 6). The uncertainties of the beam radius, estimated as a standard deviation over 32 laser shots, constitute 50% for z < 55 m and 30% in the range of distances z = 55 –63 m. The ∼50% error values are due to the significant scattering of the collapsing beam radius induced by ∼5% fluctuation of the initial pulse energy. The variation of the nonlinear focus position, estimated from Marburger equation [3], reached ∼3 m.
At the distance z = 65 m the beam radius r reached its minimum of r min = ( 0.55 ± 0.10 ) mm and preserved this size till about 95 m (Figure 4). The circular beam profile obtained due to self-cleaning in the filament was preserved up to 130 m (Figure 3). The uncertainty of the radius r was below 20% in this range of distances (Figure 4). So, behind the nonlinear focus located at z 55 m, a low-divergent light channel with the length of ∼40 m was formed. Reduced uncertainties of the beam radius for z > 55 m indicate that the effect of the initial pulse energy fluctuations on the pulse propagation is limited as compared with the initial stage of the filament formation.
Let us estimate the postfilament length as the zone after the collapse at z 55 m, where the beam radius reached its minimum value r min within the error, and till z 95 m, where the beam started to diverge again. This part of the path covering 55–95 m of the propagation without divergence is marked by yellow in Figure 4. The beam radius within the postfilament zone is smaller than r p f = 1 mm. The corresponding diffraction length is l d = 2 π r p f 2 / λ 8.5 m, where λ = 744 nm is the central laser wavelength. The 40-m postfilament is much longer than l d .
The angular divergence of the postfilamentation channel at distances from 65 to 95 m is given by the best linear fit slope coefficient γ = ( 8 ± 2 ) × 10 6 rad (Figure 4, blue line). This divergence is in reasonable agreement with the postfilament channel divergence reported in [50]. To estimate the divergence of such a beam in the case of linear propagation, we took a Gaussian beam with the waist radius (parameter w 0 ) of 0.55 mm (Figure 4, red line). This Gaussian beam has an asymptotic divergence of γ 8 × 10 4 rad. The difference between ‘linear’ (Gaussian beam) and ‘nonlinear’ (postfilamentation channel) divergence is about two orders of magnitude. The suppressed divergence of the beam in the postfilament results from the interplay between linear diffration/dispersion and nonlinearity. The latter can be instantaneous and delayed third-order response owing to relatively high, though, below the ionization threshold intensity in the postfilament equal to ∼1 TW/cm2 [50].

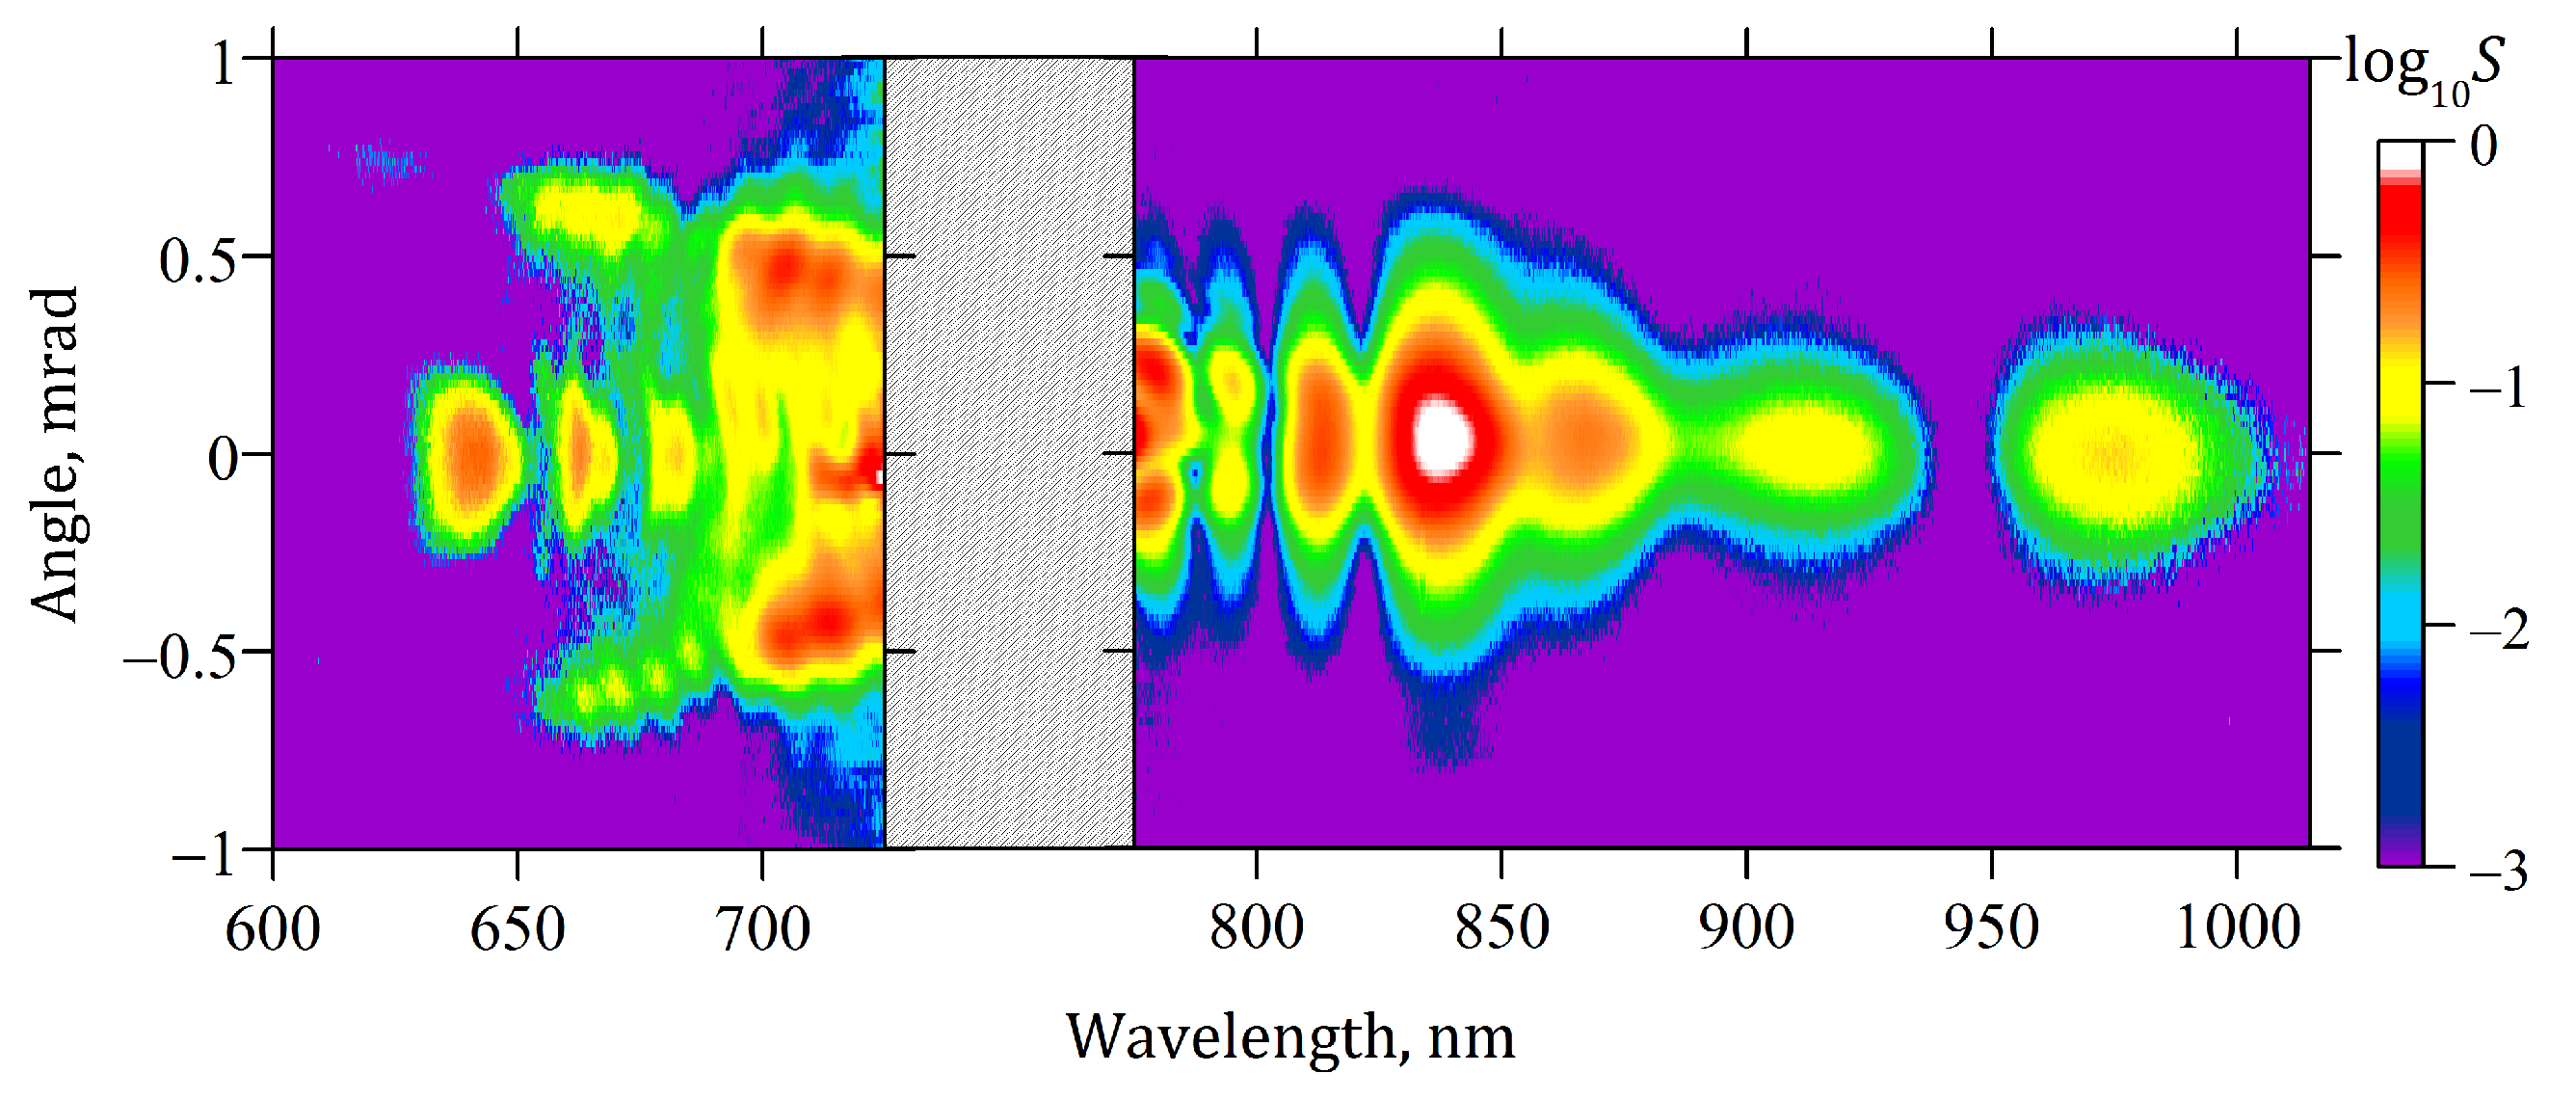
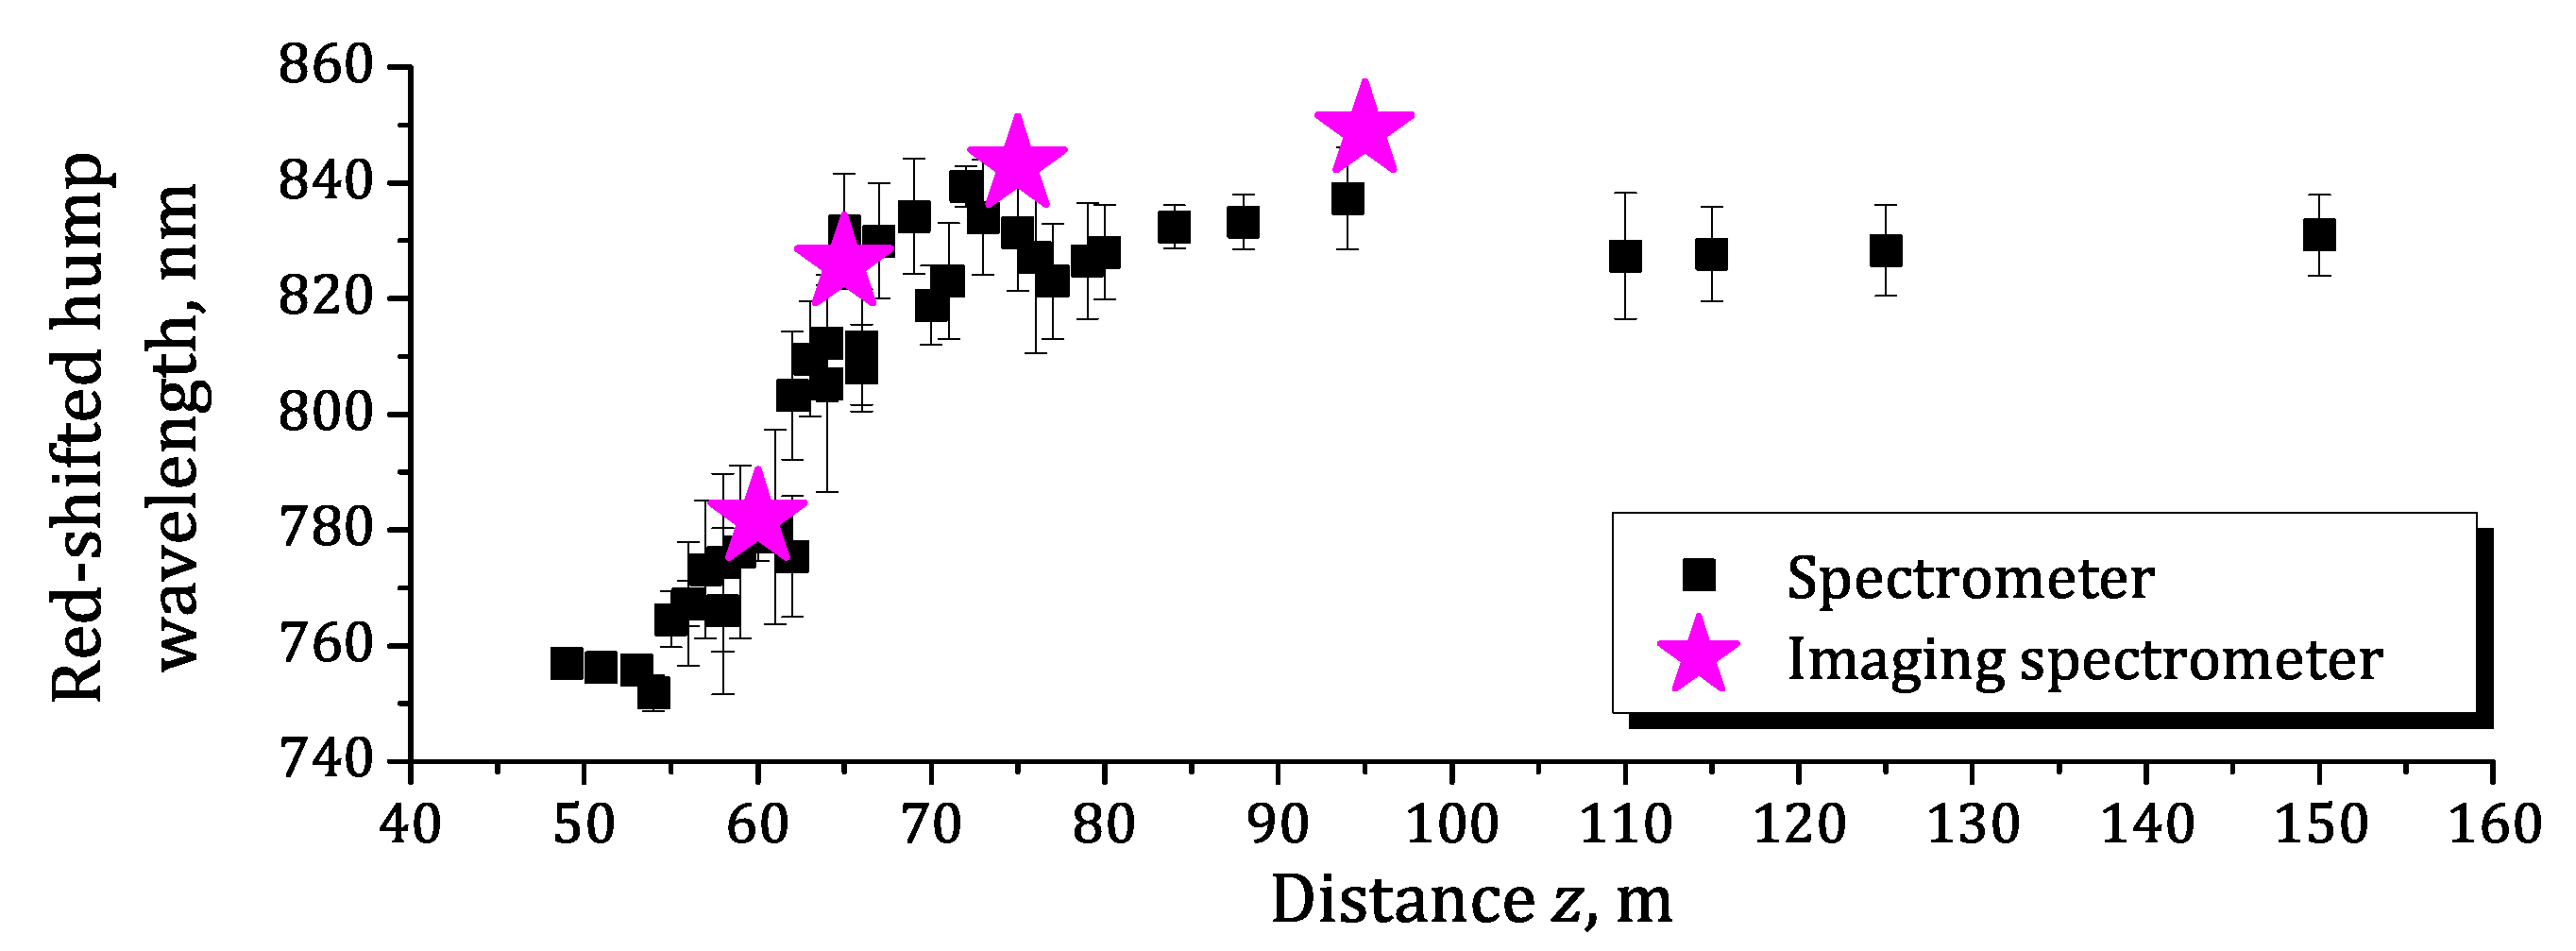
3.2. Angle-Wavelength Spectra

Filamentation of a femtosecond pulse in air is accompanied by supercontinuum generation [4,5,6]. The angle-wavelength spectrum of the supercontinuum is essentially asymmetrical even in the case of our short ∼0.5-m plasma channel [40] followed by long 40-m postfilament (Figure 5). The conical emission [6] due to the nonlinear ionization of air molecules is clearly seen in the short-wavelength side of the spectrum (see Figure 5, right column, z = 65 m). The presence of the conical emission is clearly seen in the left panel of Figure 6, where the fundamental wavelength is blocked allowing us to enhance the low-intensity supercontinuum. In the experiment, the divergent short-wavelength components were recorded up to the propagation distance z = 65 m. At larger distance they escaped the imaging spectrometer entrance aperture.
The long-wavelength components of the supercontinuum propagate along the beam axis [47,59] and, hence, are clearly seen in the experiment through all the postfilament channel (Figure 5). They emerge after the nonlinear focus ( z = 60 m), then shift further into the infrared range. Within the range z = 60 –75 m the infrared wing of the spectrum continues to broad producing the Raman humps [40]. The most pronounced spectrum modulation is obtained in both experiment and simulations at z = 75 m. The modulated spectra remain almost unchanged up to the end of the postfilament at z = 95 m.
It is worth mentioning, that the angle-wavelength spectral measurements for the case of focused filamentation geometry were conducted in [47], reporting the formation of the Raman humps series on the filament axis. The central wavelength of the humps increased with propagation, and, in addition, formation of the off-axis red-shifted components was observed. In the present work, on the contrary, the angle-frequency spectra taken at z = 75 and 95 m shown that the long-wavelength components stay on the propagation axis with the overall angular divergence 0.5 mrad. Thus, we have explicitly shown in the experiment that red-shifted humps are located in the axis.
In the current experiment the angle-wavelength spectra (Figure 5, right column), only humps with the wavelengths 850 nm were observed due to the limited dynamic range of the detector, while the simulations predict the presence of humps with lower spectral intensity at larger wavelengths as well. In order to detect the low-intensity radiation at higher wavelengths, we changed (by spectrometer grating rotation) the central wavelength of the detected range, so that the most intense part of the radiation (at about 740 nm) could not enter the CCD. This procedure allowed us to reduce the number of ND filters before the spectrometer (see Figure 2a) and observe the spectral components that otherwise were not seen. The same procedure was carried out in order to get the blue part of spectrum in details. Figure 6 demonstrates an angle-wavelength spectrum at z = 65 m composed of two separately measured spectra, one of which includes the shorter-wavelength side of the supercontinuum only, while the other one shows the result of measuring the long-wavelength side only. These measurements confirm that the postfilament spectrum reaches at least 1 μm and is represented by several more humps after the brightest one, in agreement with the simulations. Detection of the longer-wavelength components is constrained by the detection limit of silicon-based CCD. As for the blue wing of the spectrum, we clearly observed conical emission with the pronounced dependence of wavelength on the angle, proving the presence of plasma during prior beam propagation. On the axis we observed a couple of humps, the furthest of which is shifted for more than 100 nm from the 744 nm driver.
As mentioned earlier, the angular divergence of conical emission soon leads to its escaping our imaging spectrometer, so we cannot see it in the angle-wavelength spectra. However, the absence of conical emission at z = 75 m and further on indicates that beam refocusing did not take place on our propagation path.
Stars in Figure 7 represent the spectral position of the brightest Raman humps λ S estimated from the measured angle-wavelength spectra shown in Figure 5. Since the adjustment of the imaging spectrometer is complicated on the 100-m path, we demonstrate the wavelength λ S only at four propagation distances z. The adjustment of the spectrometer Avesta ASP-150 (non-imaging) is much easier, so we recorded the pulse spectra at 39 positions along the propagation direction z, with the step as small as 1 m in the range where the spectrum changes most rapidly. The dependence λ S ( z ) found from the spectra without angular resolution is shown in Figure 7 by squares. It is in excellent agreement with the estimation from the angle-wavelength spectra.
Figure 7 shows, that the formation of the Raman humps starts at the beginning of the postfilament z = 55 m and stops at z = 65 –70 m. For z > 70 m the intensity is too low for new Raman humps to emerge; however, exceptionally low radiation divergence is maintained for further 25 m due to the Kerr nonlinearity. Therefore, the 40-m postfilament can be divided into two zones. In the first one from ∼55 to ∼70 m (we called it the Stokes zone in our previous work [40]), the infrared components of the spectrum experience significant nonlinear transformation, which includes the spectral broadening and the splitting of the spectrum into several Raman humps. In the second zone from 70 to 95 m, the spectrum stabilizes and remains almost unchanged till the end of the postfilament. The beam does not diverge in that zone due to the Kerr nonlinearity.

3.3. Estimations of Pulse Duration on the ∼100-m Path

Filamentation in the collimated beam geometry results in the pulse self-compression down to ∼10 fs in the vicinity of the nonlinear focus [48,49]. The actual duration of the compressed pulse should be measured by using FROG or SPIDER technique. However, the application of such fine methods on a ∼100-m path is complicated. So, we used the autocorrelation measurements. An autocorrelation method cannot provide the information on the shortest pulse in the high-intensity region, however it is suitable for our study of a relatively long pulse duration in the postfilament.
Figure 8a,b shows the experimentally measured intensity autocorrelation functions (black dots) and the ones (red curves) calculated from the on-axis light field distributions [Figure 8c,d] obtained in ( t , r ) + z carrier-wave-resolved numerical simulations at several propagation distances z. We found doubled root-mean-squared (rms) width of the autocorrelation functions τ a from the experiment and simulations. The uncertainties of τ a estimated from the experimental results come from the asymmetry of the measured autocorrelation functions.
The measured dependence τ a ( z ) agrees with the simulated one [cf. black circles with red curve in Figure 8e]. Indeed, till the nonlinear focus, the measured autocorrelation function has a nice bell shape in agreement with the simulated one [ z = 37 m, Figure 8a]. Its doubled rms width τ a is 108 fs and coincides with the full width at e 1 level of maximum of the initial pulse with Gaussian temporal profile.
The shortest pulse was formed in the filament at 55 m. It can be seen as the local minimum in the rms pulse duration. However, the rms duration estimated from the autocorrelation functions drops down to ∼50 fs only and does not represent the duration of the self-compressed pulse. In the simulations, at z = 55 m, the pulse is compressed down to 8 fs, see the inset in Figure 8e.
After the filament termination at z 55 m the doubled rms width of autocorrelation function τ a is almost unchanged with slightly non-monotonic variations yielding the maximum at z = 65 m and minimum at z = 73 m, Figure 8e. The rapid monotonic growth in the dependence τ a ( z ) starts from z 75 m. This evidences, that the third-order nonlinearity affects the pulse temporal transformation from 55 to 75 m. These first 15–20 m of the postfilament correspond to the notable transformation of the angle-wavelength spectra (see Figure 5). After stabilization of the spectrum at 70–75 m the rms pulse duration undergoes monotonous increase mainly due to the material dispersion.

4. Conclusions

In conclusion, we experimentally studied the postfilament of the femtosecond pulse (5 mJ, 110 fs, 744 nm) on ∼100-m air path in spectral, spatial and time domains. We traced (for the first time to the best of our knowledge) the angle-wavelength spectrum evolution in postfilament obtained without external focusing on the 100-meter-long path in air. Single-shot measurements allowed us to resolve a series of Stokes humps on the filament axis. Our results include spectra (without angular resolution), autocorrelation functions, transverse beam profile measurements, and numerical simulations.
The postfilament with minimal beam divergence and beam radius below 1 mm starts from the beam collapse at z 55 m and continues till z 95 m. The instantaneous and delayed Kerr nonlinearities balance the beam diffraction during ∼40 m, and allow the beam to propagate for approximately five diffraction lengths with almost the same radius and self-cleaned shape, lowering beam divergence by two orders of magnitude in comparison with linear propagation.
Through measurements of the angle-wavelength spectra, we have shown that the Raman humps propagate on the beam axis, have a unimodal angular shape and emerge during the first 15–20 m of the postfilament (Stokes zone covering the range from ∼55 to ∼70 m). The pulse duration measured by autocorrelator remains constant within the experimental error in the Stokes zone. From z = 70 –75 m, the spectrum stops changing, and the pulse broadens due to material dispersion in air.
So, the Kerr nonlinearity governs the spectral/temporal composition of the pulse, the transverse beam distribution in the postfilament regime and continues to influence the Stokes side of the spectrum, which was originally produced in the filament plasma channel. At the same time, the beam radius keeps its minimal value, diffraction is not detectable, and one could make a cautious conclusion about the formation of the spatial quasi-soliton.

Author Contributions

Conceptualization, D.V.M., D.V.P., D.V.S. and O.G.K.; methodology, A.B.S., D.S.U., A.H., L.V.S. and D.V.P.; numerical simulation, I.A.N., D.E.S., N.A.P. and O.G.K.; data acquisition, D.V.P., G.E.R., A.H., A.C. and L.V.S.; resources, L.V.S., A.B.S. and A.A.I.; data processing, N.A.Z., I.A.N. and D.V.M.; writing—original draft preparation, D.V.M.; writing—review and editing, D.V.P., D.V.M., N.A.P., D.E.S., L.V.S. and O.G.K.; visualization, I.A.N. and D.V.M.; project administration, O.G.K.; funding acquisition, L.V.S. and A.A.I. All authors have read and agreed to the published version of the manuscript.

Funding

This research was funded by Russian Science Foundation grant number 21-12-00109.

Institutional Review Board Statement

Not applicable.

Informed Consent Statement

Not applicable.

Data Availability Statement

Data underlying the results presented in this paper are not publicly available at this time but may be obtained from the authors upon reasonable request.

Acknowledgments

The authors sincerely thank See Leang Chin (Laval University, COPL) for fruitful discussions and supportive guidance, Andrey Koribut (LPI) for taking part in processing beam transverse profiles. I.A.N. acknowledges support from Foundation for the Advancement of Theoretical Physicsand Mathematics (21-2-10-55-1).

Conflicts of Interest

The authors declare no conflict of interest.

References

  1. Diels, J.C.; Rudolph, W. Ultrashort Laser Pulse Phenomena; Elsevier: Amsterdam, The Netherlands, 2006. [Google Scholar]
  2. Chiao, R.Y.; Garmire, E.; Townes, C.H. Self-trapping of optical beams. Phys. Rev. Lett. 1964, 13, 479. [Google Scholar] [CrossRef]
  3. Marburger, J.H. Self-focusing: Theory. Prog. Quantum Electron. 1975, 4, 35–110. [Google Scholar] [CrossRef]
  4. Braun, A.; Korn, G.; Liu, X.; Du, D.; Squier, J.; Mourou, G. Self-channeling of high-peak-power femtosecond laser pulses in air. Opt. Lett. 1995, 20, 73. [Google Scholar] [CrossRef] [PubMed]
  5. Nibbering, E.; Curley, P.; Grillon, G.; Prade, B.; Franco, M.; Salin, F.; Mysyrowicz, A. Conical emission from self-guided femtosecond pulses in air. Opt. Lett. 1996, 21, 62–64. [Google Scholar] [CrossRef]
  6. Kosareva, O.; Kandidov, V.; Brodeur, A.; Chien, C.; Chin, S. Conical emission from laser–plasma interactions in the filamentation of powerful ultrashort laser pulses in air. Opt. Lett. 1997, 22, 1332–1334. [Google Scholar] [CrossRef]
  7. Chin, S.L.; Hosseini, S.A.; Liu, W.; Luo, Q.; Théberge, F.; Aközbek, N.; Becker, A.; Kandidov, V.P.; Kosareva, O.G.; Schroeder, H. The propagation of powerful femtosecond laser pulses in optical media: Physics, applications, and new challenges. Can. J. Phys. 2005, 83, 863. [Google Scholar] [CrossRef]
  8. Couairon, A.; Mysyrowicz, A. Femtosecond filamentation in transparent media. Phys. Rep. 2007, 441, 47–189. [Google Scholar] [CrossRef]
  9. Kandidov, V.P.; Shlenov, S.A.; Kosareva, O.G. Filamentation of high-power femtosecond laser radiation. Quantum Electron. 2009, 39, 205. [Google Scholar] [CrossRef]
  10. Chin, S.; Wang, T.J.; Marceau, C.; Wu, J.; Liu, J.; Kosareva, O.; Panov, N.; Chen, Y.; Daigle, J.F.; Yuan, S.; et al. Advances in intense femtosecond laser filamentation in air. Laser Phys. 2012, 22, 1–53. [Google Scholar] [CrossRef]
  11. Chin, S.L. Femtosecond Laser Filamentation; Springer: Berlin/Heidelberg, Germany, 2010; Volume 55. [Google Scholar]
  12. Kasparian, J.; Wolf, J.P. Physics and applications of atmospheric nonlinear optics and filamentation. Opt. Express 2008, 16, 466–493. [Google Scholar] [CrossRef] [Green Version]
  13. Chin, S.L.; Brodeur, A.; Petit, S.; Kosareva, O.G.; Kandidov, V.P. Filamentation and supercontinuum generation during the propagation of powerful ultrashort laser pulses in optical media (white light laser). J. Nonlinear Opt. Phys. Mater. 1999, 8, 121–146. [Google Scholar] [CrossRef]
  14. Kasparian, J.; Rodriguez, M.; Méjean, G.; Yu, J.; Salmon, E.; Wille, H.; Bourayou, R.; Frey, S.; André, Y.B.; Mysyrowicz, A.; et al. White-Light Filaments for Atmospheric Analysis. Science 2003, 301, 61–64. [Google Scholar] [CrossRef] [PubMed]
  15. Gravel, J.F.; Luo, Q.; Boudreau, D.; Tang, X.; Chin, S. Sensing of halocarbons using femtosecond laser-induced fluorescence. Anal. Chem. 2004, 76, 4799–4805. [Google Scholar] [CrossRef]
  16. Luo, Q.; Xu, H.; Hosseini, S.; Daigle, J.F.; Théberge, F.; Sharifi, M.; Chin, S. Remote sensing of pollutants using femtosecond laser pulse fluorescence spectroscopy. Appl. Phys. B 2006, 82, 105–109. [Google Scholar] [CrossRef]
  17. Daigle, J.F.; Méjean, G.; Liu, W.; Théberge, F.; Xu, H.; Kamali, Y.; Bernhardt, J.; Azarm, A.; Sun, Q.; Mathieu, P.; et al. Long range trace detection in aqueous aerosol using remote filament-induced breakdown spectroscopy. Appl. Phys. B 2007, 87, 749–754. [Google Scholar] [CrossRef]
  18. Chin, S.; Xu, H.; Luo, Q.; Théberge, F.; Liu, W.; Daigle, J.; Kamali, Y.; Simard, P.; Bernhardt, J.; Hosseini, S.; et al. Filamentation “remote” sensing of chemical and biological agents/pollutants using only one femtosecond laser source. Appl. Phys. B 2009, 95, 1–12. [Google Scholar] [CrossRef]
  19. Comtois, D.; Chien, C.Y.; Desparois, A.; Génin, F.; Jarry, G.; Johnston, T.W.; Kieffer, J.C.; La Fontaine, B.; Martin, F.; Mawassi, R.; et al. Triggering and guiding leader discharges using a plasma channel created by an ultrashort laser pulse. Appl. Phys. Lett. 2000, 76, 819–821. [Google Scholar] [CrossRef]
  20. Rodriguez, M.; Sauerbrey, R.; Wille, H.; Woeste, L.; Fujii, T.; André, Y.B.; Mysyrowicz, A.; Klingbeil, L.; Rethmeier, K.; Kalkner, W.; et al. Triggering and guiding megavolt discharges by use of laser-induced ionized filaments. Opt. Lett. 2002, 27, 772–774. [Google Scholar] [CrossRef]
  21. Arantchouk, L.; Point, G.; Brelet, Y.; Prade, B.; Carbonnel, J.; André, Y.B.; Mysyrowicz, A.; Houard, A. Large scale tesla coil guided discharges initiated by femtosecond laser filamentation in air. J. Appl. Phys. 2014, 116, 013303. [Google Scholar] [CrossRef]
  22. Theberge, F.; Daigle, J.F.; Kieffer, J.C.; Vidal, F.; Chateauneuf, M. Laser-guided energetic discharges over large air gaps by electric-field enhanced plasma filaments. Sci. Rep. 2017, 7, 1–8. [Google Scholar] [CrossRef] [Green Version]
  23. Chin, S.L.; Miyazaki, K. A comment on lightning control using a femtosecond laser. Jpn. J. Appl. Phys. 1999, 38, 2011. [Google Scholar] [CrossRef]
  24. Kasparian, J.; Ackermann, R.; André, Y.B.; Méchain, G.; Méjean, G.; Prade, B.; Rohwetter, P.; Salmon, E.; Stelmaszczyk, K.; Yu, J.; et al. Electric events synchronized with laser filaments in thunderclouds. Opt. Express 2008, 16, 5757–5763. [Google Scholar] [CrossRef] [Green Version]
  25. Produit, T.; Walch, P.; Herkommer, C.; Mostajabi, A.; Moret, M.; Andral, U.; Sunjerga, A.; Azadifar, M.; André, Y.B.; Mahieu, B.; et al. The laser lightning rod project. Eur. Phys. J. Appl. Phys. 2021, 91, 10504. [Google Scholar] [CrossRef]
  26. Stelmaszczyk, K.; Rohwetter, P.; Méjean, G.; Yu, J.; Salmon, E.; Kasparian, J.; Ackermann, R.; Wolf, J.P.; Woste, L. Long-distance remote laser-induced breakdown spectroscopy using filamentation in air. Appl. Phys. Lett. 2004, 85, 3977. [Google Scholar] [CrossRef]
  27. Tzortzakis, S.; Anglos, D.; Gray, D. Ultraviolet laser filaments for remote laser-induced breakdown spectroscopy (LIBS) analysis: Applications in cultural heritage monitoring. Opt. Lett. 2006, 31, 1139–1141. [Google Scholar] [CrossRef]
  28. Xu, H.; Simard, P.; Kamali, Y.; Daigle, J.F.; Marceau, C.; Bernhardt, J.; Dubois, J.; Châteauneuf, M.; Théberge, F.; Roy, G.; et al. Filament-induced breakdown remote spectroscopy in a polar environment. Laser Phys. 2012, 22, 1767–1770. [Google Scholar] [CrossRef]
  29. Abdul Kalam, S.; Balaji Manasa Rao, S.V.; Jayananda, M.; Venugopal Rao, S. Standoff femtosecond filament-induced breakdown spectroscopy for classification of geological materials. J. Anal. At. Spectrom. 2020, 35, 3007–3020. [Google Scholar] [CrossRef]
  30. Kasparian, J.; Sauerbrey, R.; Chin, S. The critical laser intensity of self-guided light filaments in air. Appl. Phys. B 2000, 71, 877–879. [Google Scholar] [CrossRef]
  31. Kosareva, O.; Liu, W.; Panov, N.; Bernhardt, J.; Ji, Z.; Sharifi, M.; Li, R.; Xu, Z.; Liu, J.; Wang, Z.; et al. Can we reach very high intensity in air with femtosecond PW laser pulses? Laser Phys. 2009, 19, 1776–1792. [Google Scholar] [CrossRef]
  32. Mitryukovskiy, S.I.; Liu, Y.; Houard, A.; Mysyrowicz, A. Re-evaluation of the peak intensity inside a femtosecond laser filament in air. J. Phys. B At. Mol. Opt. Phys. 2015, 48, 094003. [Google Scholar] [CrossRef]
  33. Tzortzakis, S.; Prade, B.; Franco, M.; Mysyrowicz, A.; Huller, S.; Mora, P. Femtosecond laser-guided electric discharge in air. Phys. Rev. E 2001, 64, 057401. [Google Scholar] [CrossRef] [PubMed] [Green Version]
  34. Chen, Y.H.; Varma, S.; Antonsen, T.; Milchberg, H. Direct measurement of the electron density of extended femtosecond laser pulse-induced filaments. Phys. Rev. Lett. 2010, 105, 215005. [Google Scholar] [CrossRef] [PubMed]
  35. Chen, Y.; Théberge, F.; Kosareva, O.; Panov, N.; Kandidov, V.P.; Chin, S.L. Evolution and termination of a femtosecond laser filament in air. Opt. Lett. 2007, 32, 3477–3479. [Google Scholar] [CrossRef] [PubMed]
  36. Durand, M.; Houard, A.; Prade, B.; Mysyrowicz, A.; Durécu, A.; Moreau, B.; Fleury, D.; Vasseur, O.; Borchert, H.; Diener, K.; et al. Kilometer range filamentation. Opt. Express 2013, 21, 26836–26845. [Google Scholar] [CrossRef] [PubMed] [Green Version]
  37. Méchain, G.; D’Amico, C.; André, Y.B.; Tzortzakis, S.; Franco, M.; Prade, B.; Mysyrowicz, A.; Couairon, A.; Salmon, E.; Sauerbrey, R. Range of plasma filaments created in air by a multi-terawatt femtosecond laser. Opt. Commun. 2005, 247, 171–180. [Google Scholar] [CrossRef]
  38. Méchain, G.; Couairon, A.; André, Y.B.; D’Amico, C.; Franco, M.; Prade, B.; Tzortzakis, S.; Mysyrowicz, A.; Sauerbrey, R. Long-range self-channeling of infrared laser pulses in air: A new propagation regime without ionization. Appl. Phys. B 2004, 79, 379–382. [Google Scholar] [CrossRef]
  39. Shipilo, D.E.; Panov, N.A.; Sunchugasheva, E.S.; Mokrousova, D.V.; Shutov, A.V.; Zvorykin, V.D.; Ustinovskii, N.N.; Seleznev, L.V.; Savel’ev, A.B.; Kosareva, O.G.; et al. Fifteen meter long uninterrupted filaments from sub-terawatt ultraviolet pulse in air. Opt. Express 2017, 25, 25386–25391. [Google Scholar] [CrossRef]
  40. Kosareva, O.; Panov, N.; Shipilo, D.; Mokrousova, D.; Nikolaeva, I.; Mitina, E.; Koribut, A.; Reutov, A.; Rizaev, G.; Couairon, A.; et al. Postfilament supercontinuum on 100 m path in air. Opt. Lett. 2021, 46, 1125–1128. [Google Scholar] [CrossRef]
  41. Théberge, F.; Châteauneuf, M.; Ross, V.; Mathieu, P.; Dubois, J. Ultrabroadband conical emission generated from the ultraviolet up to the far-infrared during the optical filamentation in air. Opt. Lett. 2008, 33, 2515–2517. [Google Scholar] [CrossRef]
  42. Théberge, F.; Liu, W.; Luo, Q.; Chin, S. Ultrabroadband continuum generated in air (down to 230 nm) using ultrashort and intense laser pulses. Appl. Phys. B 2005, 80, 221–225. [Google Scholar] [CrossRef]
  43. Chen, Y.; Théberge, F.; Marceau, C.; Xu, H.; Aközbek, N.; Kosareva, O.; Chin, S. Observation of filamentation-induced continuous self-frequency down shift in air. Appl. Phys. B 2008, 91, 219–222. [Google Scholar] [CrossRef]
  44. Uryupina, D.; Panov, N.; Kurilova, M.; Mazhorova, A.; Volkov, R.; Gorgutsa, S.; Kosareva, O.; Savel’ev, A. 3D Raman bullet formed under filamentation of femtosecond laser pulses in air and nitrogen. Appl. Phys. B 2013, 110, 123–130. [Google Scholar] [CrossRef]
  45. Faccio, D.; Averchi, A.; Lotti, A.; Di Trapani, P.; Couairon, A.; Papazoglou, D.; Tzortzakis, S. Ultrashort laser pulse filamentation from spontaneous X Wave formation in air. Opt. Express 2008, 16, 1565–1570. [Google Scholar] [CrossRef] [Green Version]
  46. Panov, N.A.; Shipilo, D.E.; Andreeva, V.A.; Uryupina, D.S.; Savel’ev, A.B.; Kosareva, O.G.; Chin, S.L. Robust near-infrared light bullet in 800-nm femtosecond light filaments in air. Appl. Phys. B 2015, 120, 383–387. [Google Scholar] [CrossRef]
  47. Shipilo, D.; Pushkarev, D.; Panov, N.; Uryupina, D.; Andreeva, V.; Volkov, R.; Balakin, A.; Shkurinov, A.; Babushkin, I.; Morgner, U.; et al. Near-infrared conical emission from 800 nm filament in air. Laser Phys. Lett. 2017, 14, 035401. [Google Scholar] [CrossRef]
  48. Kosareva, O.; Panov, N.; Uryupina, D.; Kurilova, M.; Mazhorova, A.; Savel’ev, A.; Volkov, R.; Kandidov, V.; Chin, S. Optimization of a femtosecond pulse self-compression region along a filament in air. Appl. Phys. B 2008, 91, 35–43. [Google Scholar] [CrossRef]
  49. Uryupina, D.; Kurilova, M.; Mazhorova, A.; Panov, N.; Volkov, R.; Gorgutsa, S.; Kosareva, O.; Savel’ev, A.; Chin, S.L. Few-cycle optical pulse production from collimated femtosecond laser beam filamentation. J. Opt. Soc. Am. B 2010, 27, 667–674. [Google Scholar] [CrossRef]
  50. Daigle, J.F.; Kosareva, O.; Panov, N.; Wang, T.J.; Hosseini, S.; Yuan, S.; Roy, G.; Chin, S. Formation and evolution of intense, post-filamentation, ionization-free low divergence beams. Opt. Comm. 2011, 284, 3601–3606. [Google Scholar] [CrossRef]
  51. Ting, A.; Gordon, D.F.; Briscoe, E.; Peñano, J.R.; Sprangle, P. Direct characterization of self-guided femtosecond laser filaments in air. Appl. Opt. 2005, 44, 1474–1479. [Google Scholar] [CrossRef]
  52. Husakou, A.V.; Herrmann, J. Supercontinuum generation of higher-order solitons by fission in photonic crystal fibers. Phys. Rev. Lett. 2001, 87, 203901. [Google Scholar] [CrossRef] [Green Version]
  53. Kolesik, M.; Moloney, J.V. Nonlinear optical pulse propagation simulation: From Maxwell’s to unidirectional equations. Phys. Rev. E 2004, 70, 036604. [Google Scholar] [CrossRef]
  54. Panov, N.A.; Shipilo, D.E.; Saletsky, A.M.; Liu, W.; Polynkin, P.G.; Kosareva, O.G. Nonlinear transparency window for ultraintense femtosecond laser pulses in the atmosphere. Phys. Rev. A 2019, 100, 023832. [Google Scholar] [CrossRef] [Green Version]
  55. Panov, N.; Shipilo, D.; Nikolaeva, I.; Kompanets, V.; Chekalin, S.; Kosareva, O. Continuous transition from X-to O-shaped angle-wavelength spectra of a femtosecond filament in a gas mixture. Phys. Rev. A 2021, 103, L021501. [Google Scholar] [CrossRef]
  56. Kandidov, V.P.; Fedorov, V.Y. Properties of self-focusing of elliptic beams. Quantum Electron. 2004, 34, 1163. [Google Scholar] [CrossRef]
  57. Prade, B.; Franco, M.; Mysyrowicz, A.; Couairon, A.; Buersing, H.; Eberle, B.; Krenz, M.; Seiffer, D.; Vasseur, O. Spatial mode cleaning by femtosecond filamentation in air. Opt. Lett. 2006, 31, 2601–2603. [Google Scholar] [CrossRef] [PubMed]
  58. Kandidov, V.; Dormidonov, A.; Kosareva, O.; Akozbek, N.; Scalora, M.; Chin, S. Optimum small-scale management of random beam perturbations in a femtosecond laser pulse. Appl. Phys. B 2007, 87, 29–36. [Google Scholar] [CrossRef]
  59. Liu, W.; Hosseini, S.; Luo, Q.; Ferland, B.; Chin, S.; Kosareva, O.; Panov, N.; Kandidov, V. Experimental observation and simulations of the self-action of white light laser pulse propagating in air. New J. Phys. 2004, 6, 6. [Google Scholar] [CrossRef] [Green Version]
Figure 1. Experimentally measured initial (a) angle-wavelength spectrum and (b) transverse fluence distribution with its slice at x = 0 (white curve) at z = 13 m from the compressor output.
Photonics 08 00446 g001
Figure 2. (a) The angle-wavelength spectra measurement setup scheme (W1, W2—wedges, D1, D2—diaphragms, NF—neutral filter (attenuator), M1, M2—aluminium-coated mirrors, S—spherical mirror). (b) The transverse fluence profile measurement setup scheme (W—wedge, LS—luminescent screen, OL—objective lens.
Photonics 08 00446 g002
Figure 3. Experimentally measured transverse fluence distributions at different propagation distances z. White curves show their slice at x = 0 .
Photonics 08 00446 g003
Figure 4. The dependence of the average beam radius on the distance z (squares) and its linear fit in the range z = 65 –95 m (blue line). The green horizontal band shows the minimum value of the radius. Yellow rectangle is the range z = 55 –95 m, where the beam propagates in postfilamentation regime. Radius of Gaussian beam at e 1 with waist w 0 = 0.55 mm (red line) vs. z.
Photonics 08 00446 g004
Figure 5. The angle-wavelength spectra obtained in numerical simulations (left column) and in the experiment (right column) at the distances from 60 m to 95 m.
Photonics 08 00446 g005
Figure 6. The angle-wavelength spectrum obtained in the experiment in two separate shots for 500–725 nm and 775–1015 nm ranges at the distance 65 m.
Photonics 08 00446 g006
Figure 7. The dependence of the brightest red-shifted hump wavelength obtained by the spectrometer (black squares) and the imaging spectrometer (magenta stars) on the propagation distance. Error bars represent the standard deviation of the longest red shift over 10–20 realizations.
Photonics 08 00446 g007
Figure 8. (a,b) Intensity autocorrelation functions obtained in the experiment (black dots) and numerical simulations (red curves); (c,d) simulated on-axis temporal distributions of the light field at several z. (e) Evolution of the doubled root-mean-squared width τ a of autocorrelation function with distance z obtained in the simulations (red line) and the experiment (black circles). Inset in (e) shows simulated on-axis temporal distribution of the light field at z = 55 m corresponding to the local minimum of the red curve in (e).
Photonics 08 00446 g008
Publisher’s Note: MDPI stays neutral with regard to jurisdictional claims in published maps and institutional affiliations.

