Article

Objective User Visual Experience Evaluation When Working with Virtual Pixel-Based 3D System and Real Voxel-Based 3D System

Department of Optometry and Vision Science, University of Latvia, Jelgavas 1, LV-1004 Riga, Latvia
*
Author to whom correspondence should be addressed.
Photonics 2019, 6(4), 106; https://doi.org/10.3390/photonics6040106
Submission received: 19 September 2019 / Revised: 10 October 2019 / Accepted: 11 October 2019 / Published: 16 October 2019

Abstract

:
Volumetric display shows promising implications for healthcare related applications as an innovative technology that creates real three-dimensional (3D) image by illuminating points in three-dimensional space to generate volumetric images without image separation. We used eccentric photorefractometry to objectively study ocular performance in a practical environment by evaluating near work-induced refraction shift, accommodative microfluctuations, and pupil size for 38 young adults after viewing anaglyph, and volumetric 3D content for prolonged time. The results of our study demonstrate that participants who performed relative depth estimation task on volumetric 3D content were less likely to experience task-induced myopic refraction shift. For both 3D content types, we observed pupil constriction, that is possibly related to visual fatigue. For anaglyph 3D pupil constriction, onset was observed significantly sooner, compared to volumetric 3D. Overall, sustained work with 3D content, and small disparities or the fully eliminated possibility of accommodation-vergence conflict, not only minimizes near work-induced myopic shift, but also provide beneficial accommodation relaxation that was demonstrated in this study as hypermetropic shift for nearly half of participants.

1. Introduction

In the last decade, healthcare has experienced and implemented countless technological innovations, including various three-dimensional (3D) imaging techniques. A volumetric display is an innovative technology that creates real 3D image by illuminating points in three-dimensional space to generate volumetric images [1], that can be a valuable tool for healthcare professionals, when the detection of anatomical abnormalities is necessary. Understanding the capability of the human visual system, with respect to medical imaging, is crucial because it is possible to adapt and customize new imaging technologies to access balanced perceptual capacities. The visual system involves eye accommodation (ability to see clear image at various distances), convergence (ability to change position of visual axis to provide fixation of both eyes on the image placed at various distances), and pupil responses when 3D image is analyzed. Eye accommodation, vergence system, and pupil are neurologically linked and called near triad. Therefore, changes in one of these systems will alter and influence the response of another. Both, accommodation and convergence responses increase (and pupil diameter decreases) producing identical depth information if the stimulus approaches the viewer. However, the balanced interaction between near the triad can be interrupted when viewing stereoscopic images, because the real image and eye accommodation stimulus remain on the display surface. While, the convergence distance depends on the perceived depth of the virtual object–in front or behind a display depending on the binocular disparity given to the 3D object [2]. This mismatch between accommodation and convergence is one of the key factors leading to visual fatigue and asthenopic, perceptual, and ophthalmic problems in viewing the conventional stereoscopic displays [3,4]. Significance of this discrepancy grows as the distance between the viewer and a screen decreases [5]. Images produced by volumetric display are considered to be projected in true 3D space since the object possesses three physical dimensions (x, y, and z). Therefore, cues for accommodation and vergence system are consistent ensuring that the conflict between them are theoretically minimized. The aim of this study was to test ocular performance in the practical environment by evaluating the possibility of visual fatigue after prolonged near work, with volumetric 3D image, compared to anaglyph 3D. We focused on near work-induced refraction shift, accommodative microfluctuations, and pupil size as potential objective indicators for visual fatigue in 3D content users. The results are expected to provide objective measurements of reaction of visual system to extended use of 3D content.

1.1. Near Work-Induced Refraction Shifts

Refractive state of the eye characterizes the ability for the optical system to focus light properly to see clear image. Usually this is referred to far vision when eyes are in a relaxed state. For near distances and under normal circumstances, in young eyes, the power of the lens (along with the total eye refraction) will increase involuntarily on a reflex basis, in order to form the image on the retina. Previous studies with 2D stimuli showed that eye accommodation tends to remain in a partially constricted state for a short period of time after prolonged and continuous near work [6,7,8]. This phenomenon is called near work-induced transient myopia (NITM). NITM can be calculated as the post-task minus pre-task refraction state. The pre-task refraction represents baseline refraction in far and the post-task refraction represents the refraction far immediately after the near task [9]. More negative or less positive refraction indicates a myopic shift, and less negative or more positive refraction indicates hypermetropic shift. Myopic refraction shift has been observed for different near work durations, as brief as 10 min and as long as 6 h, while accommodative demands for the experimental conditions varied from 8 D to 2 D [6,10,11]. Previously reported amount of NITM in individuals without vision dysfunctions has been reported from 0.11 D to 0.90 D with a mean of about 0.30 D [6,7,12]. NITM has been mentioned as one of the main environmental factors that play a significant role in the development of late-onset myopia [13,14]. Myopia prevalence has reached epidemic levels in Asia and currently is increasing also in Europe [15,16], In scientific literature, attention and interest towards near work-induced changes in refraction has been decreasing with the time. The reason is partially because a lot has already been discovered and because NITM is a short-term effect. Most of the individuals who experience NITM remain asymptomatic and do not report any subjectively perceivable blur. We would like to take a fresh look at this phenomenon, because right now, the near work content has changed, firstly, from paper to digital format, and secondly, from 2D to 3D format. For conventional near work with 2D content, working distance and thereby accommodation demand is always constant. For virtual 3D, accommodation should be constant. Theoretically, since the demand for convergence is changing, it can influence accommodation response via near triad reflex. A real 3D situation, projected by a volumetric display, is more complex because it contains variable accommodation demands. The question is whether this, constantly changing accommodation demand, could cause visual fatigue or just the opposite—provide accommodation training.

1.2. Accommodative Microfluctuations

The accommodation response is constantly changing during steady fixation. These small temporal variations in the accommodative response are named accommodative microfluctuations. An expected, the amount of accommodative microfluctuations are below 0.50 D [17]. The behavior of accommodative fluctuations is complex and nonlinear in time [18]. The understanding of the role of accommodative microfluctuations is based on the description made by Alpern [19], and later supplemented by many other authors [20,21,22]. It has been proposed that microfluctuations play an important role in the eye accommodation control mechanism. Charman and Heron (2015) stated that it is an even-error cue for the correct direction and magnitude of accommodation stimulus; a fluctuation in one direction would tend to improve an out-of-focus image, while a fluctuation in the opposite direction would degrade the image [17].
Early studies revealed good resistance of accommodation to fatigue [23]. While, accommodative microfluctuations seem to be more easily affected, and have been suggested as one of the contributing factors for Digital Eye Strain (DES) [24]. It has been reported that the mean accommodative response is significantly increased during active cognitive tasks [25]. Accommodative microfluctuations has also been investigated in relation to cognitive demand [26,27]. Several studies [21,28,29] have shown an increase in accommodative microfluctuations with increasing accommodative demand. The magnitude of accommodative fluctuations, expressed as RMS, increases if the pupil size is smaller than 3 mm [30], target luminance is below 0.1 cd/m2 [22,31], and the eye focuses more accurately on targets of wider spectral bandwidth [32]. The numerous studies reported that the variability of accommodation is related to the baseline refractive error. Microfluctuations tend to be larger in myopes than in emmetropes [21,28]. The age dependency shows increased amount of microfluctuations, before the first decade of life [33], and a decreased amount, after age of 40 [34]. In the near triad, convergence makes an impact by stabilizing accommodation response. Therefore, the variability of the accommodation response at near viewing distances is reported to be smaller in binocular conditions compared to monocular conditions [35,36]. Microfluctuations are influenced by the viewing distance showing smaller fluctuations for far distance compared to near distance, where active accommodation focusing occurs [36]. Most of the previously mentioned studies have investigated accommodative microfluctuations for conventional 2D stimuli. Along with advances and the availability of 3D imaging technologies, it is important to understand the influence of new technologies on accommodative microfluctuations. Accommodative microfluctuations have been studied after stereoscopic 3D viewing and no difference were found compared to 2D viewing [37,38]. We would like to expand the knowledge about other 3D types, by analyzing accommodative microfluctuations, after work with volumetric 3D content.

1.3. Pupil Size

The function of the pupil is to control the amount of light entering the eye. Pupillary diameter is controlled by two muscles: M. sphincter pupillae contracts the pupil, which is primarily under the control of the parasympathetic nervous system; M. dilatator pupillae dilates the pupil, which is primarily under the control of the sympathetic nervous system. The nervous system continuously alters pupil diameter for optimal visual performance [39]. Pupillary response represents the balance of autonomous nervous activity. Pupil size reflects mental activity, as well as the whole body condition, including excitement, tiredness, sleepiness, and fatigue [4]. Pupil size measurements and light reflex examinations play an important role in a clinical setting, because it can help to diagnose many ocular, neurological, and intracranial pathologies in a non-invasive way [40]. Pupil measurements have been one of the methods for general fatigue evaluation, since the early 60’s, and have been around mostly because of its relatively inexpensive and non-invasive measurement techniques, compared to other psychological methods (EEG, fMRI, MEG) [41]. Today pupillometry is widely used among neuroscience and psychological research groups to study not only fatigue, but fundamental cognitive mechanisms, memory load, attention, emotions. Pupil size is considered an important factor in visual discomfort because of its active role in oculomotor balance via reflex of near triad [42]. The previous analysis of pupil size and virtual 3D content showed that accommodative pupil constriction is more affected by depth fixation in the real world than in the virtual 3D condition [43]. We will use pupil size changes as an indirect indicator of possible fatigue to see if there is a relationship with subjectively perceived task difficulty, during work with 3D content.

2. Materials and Methods

2.1. Participants

The study included 38 young adults (Caucasians, mean age 24 ± 3 years). They all were emmetropic (spherical equivalent −0.50 D to +0.50 D with acceptable physiological astigmatism at less than −0.75 D). The inclusion criteria were visual acuity 20/25 or better in each eye at distance and near, no strabismus, no pharmacological agents used within last month, and stereoacuity of 80 s of arc or better (Titmus test). Participants were randomized into two groups: The first group (Volumetric 3D group, 19 participants) performed relative distance estimation task presented on volumetric display; the second group performed the same task adapted for the conventional computer display using anaglyph technique (Anaglyph 3D group, 19 participants). There was no statistically significant difference between the groups based on age, stereoacuity, baseline refraction, and baseline pupil size (see Table 1). All participants provided written informed consent. The study was approved by the University of Latvia ethics committee and was performed in accordance with the Declaration of Helsinki.

2.2. Instrumentation and Stimuli

We used an eccentric infrared photorefractor PowerRef 3 (Plusoptix GmbH, Nuremberg, Germany), based on dynamic photosciascopy principle, that uses infrared video technique with bright pupil analysis. This is improved version of PowerRef II that was widely used in vision research [28,44,45,46], but had several limitations. PowerRef II system did not provide individual calibration, measured refraction was more hypermetropic (mean ± SD; 0.59 ± 0.42 D), and data was not measured at the device manual specified frequency of 25 Hz [47]. Its successor PowerRef 3 provides continuous stream of data at higher frequency (binocular, 50 Hz). Therefore, PowerRef 3 is potentially more appropriate for eye accommodation studies, but it still might require calibration for accurate estimation of refraction, if individuals from other ethnicities than Caucasians are tested [48]. Technical measurement range limitations for PowerRef 3 is 4.0 to 8.0 mm with 0.1 mm step for pupil size and +5.00 D to −7.00 D with 0.01 D step for eye refraction and accommodation measurements. This device provides quantitative, objective, non-invasive and repeatable measurements of eye accommodation, pupil, and basic gaze measurements.
The stimulus we used for relative depth estimation task was four circles (diameter of each circle: 0.5°; line width: 20% of size) where one of them appeared closer. All participants performed a four-alternative forced-choice psychophysical procedure. The task was to distinguish between four circles and to find the target circle that appeared closer (stereoscopic crossed disparity effect). The answer was given by pressing the appropriate arrow button on the keyboard (left, right, up, or down). The stimulus size was adapted for each segment’s depth in volumetric 3D and for various viewing distances in anaglyph 3D conditions. Thus, the angular size of each circle was constant to limit monocular clues and minimize size effect. In three sessions, different distances between stimuli (1.9°, 3.8°, and 7.6°) were used to increase the task difficult. Before each stimulus, a fixation cross (size: 0.5°) was demonstrated for 1 s in the center of the screen and participants were asked to maintain their gaze on the fixation cross.

2.2.1. Volumetric 3D Imaging

For real voxel-based 3D system, the stimuli were presented on a multi-planar volumetric display, consisting of 20 polymer-dispersed liquid crystal screens 39.5 cm wide and 29.5 cm tall. The distance between the two sequential screens was 5.04 mm, the width of each screen was 1.1 mm. X, Y, Z resolution was 1024 × 768 pixels per layer providing a volumetric resolution of 15 million voxel, with a refresh rate of 60 Hz. We divided our stimulus presentation blocks in four depth segments starting from front of the screen I, II, III, and IV. Thus, each segment consisted of 5 screen planes. Volumetric display was always at constant 45 cm distance (see Figure 1) measured from the front plate of the volumetric display to the frontal part of the eyes. If the stimuli were presented on the more distant screens, the stimulus appeared farther away.

2.2.2. Anaglyph 3D Imaging

We used the anaglyph technique (also called binocular stereoscopic 3D method) for virtual pixel-based 3D system. The stimuli were presented on a LED-Lit Dell™ UltraSharp U2312HM display (width 53 cm, height 30 cm, resolution 1920 × 1080 px, refresh rate 76 Hz). We used stereopsis the from binocular disparity, where depth cue was created by presenting different images for each eye with the classical stereoscopic 3D imaging method—the anaglyph technique. Passive stereo glasses were used with chromatically opposite colored red-cyan filters that allowed each eye to perceive only those parts of the image that was permeated by the filter. This allows slightly different images to be presented to the left and right eye. For anaglyph technique, we adjusted display distance according to expected stimulus appearance in the middle plane of each segment in volumetric display: Segment I (plane 3) = 46.22 cm, segment II (plane 8) = 49.29 cm, segment III (plane 13) = 52.36 cm, segment IV (plane 18) = 55.43 cm. Experimental setup for anaglyph technique was made as equal as possible to volumetric imaging, but there were few limitations that are described further in the Discussion.

2.3. Experimental Procedure

The whole experiment was performed in a dark room (4 lx, Konica Minolta T-10). All participants were adapted to the dark for five minutes prior to work with the displays. Chin and forehead rest was used to stabilize and control head movements. Baseline far and near refraction state, and pupil size, were registered in 3 repeated measurements (10 s each) before starting the work with volumetric 3D or anaglyph 3D, and after approximately 10 min long Session 1, Session 2, and Session 3. The participants were instructed to look at the center of the Maltese cross (size 2°, distance 5 m for far and 20 cm for near) and keep it clear during measurements. After completing the whole procedure (all sessions), participants were asked to rest in a dark room and avoid any near work for 5 min. Then post-task measurement of refraction and pupil size (only at far distance) was taken. Each session consisted of stimuli presentation in four depth segments (for volumetric 3D: planes 3, 8, 13, and 18; for anaglyph 3D adjusted distances: 46.22, 49.29, 52.36, and 55.43 cm). The distance between stimuli (four circles) was 1.9° for all depth segments in Session 1, 3.8° in Session 2, and 7.6° in Session 3. There were no breaks between the three sessions, only two 10 s measurements after each session. The task difficulty was evaluated subjectively with 5-point Likert scale after work with each display segments. The evaluation results were averaged separately for Session 1, Session 2, and Session 3.

2.4. Data Analysis

Data were filtered offline to remove measurement artifacts associated with blinks. The blinks were removed automatically from the data, using the Microsoft Excel macro procedure, described previously by Horwood and Riddell (2008). In that study, the data correction considered both data during blink and recovery from the blink (0.2 s) [49]. After eliminating blinks, we had 480 ± 20 data points for each measurement. The number and length of fixation breaks over the measurement was not analyzed.
Equation (1) was used to calculate the amount of refraction shift,
Refraction   shift   =   Refraction   after   session   ( n )     Baseline   refraction
where n is the mean far refraction value in each session (Session 1, Session 2, Session 3) or post-task measurement.
The magnitude of the accommodative microfluctuations was expressed as a root mean square (RMS) deviation calculated from Equation (2),
RMS   deviation   =   1 n i   =   1 n ( x i x ¯ ) 2
where n is the number of refraction values measured during 10 s, xi is each individual refraction value and x ¯ is the mean refraction value.
The pupil size was characterized as the horizontal pupil diameter for each participant and described as a mean value from the right and the left eye.

Statistical Analysis

The statistical analysis was performed using R Statistical Software version 3.5.1. (Foundation for Statistical Computing, Vienna, Austria). A shift in accommodative microfluctuations and pupil size was evaluated using three-way mixed design ANOVA, based on within-subjects factors distance (near and far) and session (baseline, Session 1, Session 2, and Session 3), and between-subjects factor 3D type (anaglyph and volumetric). The normal distribution of the variables was tested using visual histogram and probability graphs. A two-way mixed design ANOVA (factors session and 3D type) was applied to compare the baseline and post-task measurements. Mauchly’s test of sphericity was conducted for the within-subjects factors and Greenhouse-Geisser correction was used for the degrees of freedom where the sphericity assumption was violated. Post hoc Bonferroni adjusted pairwise comparison t-tests were performed for closer analysis of interactions. One-way ANOVA analysis was performed to analyze the refraction shift in Session 1, Session 2, and Session 3. The chi-squared test of association was used to evaluate refraction shift type distribution. The statistical significance was set at p < 0.05.

3. Results

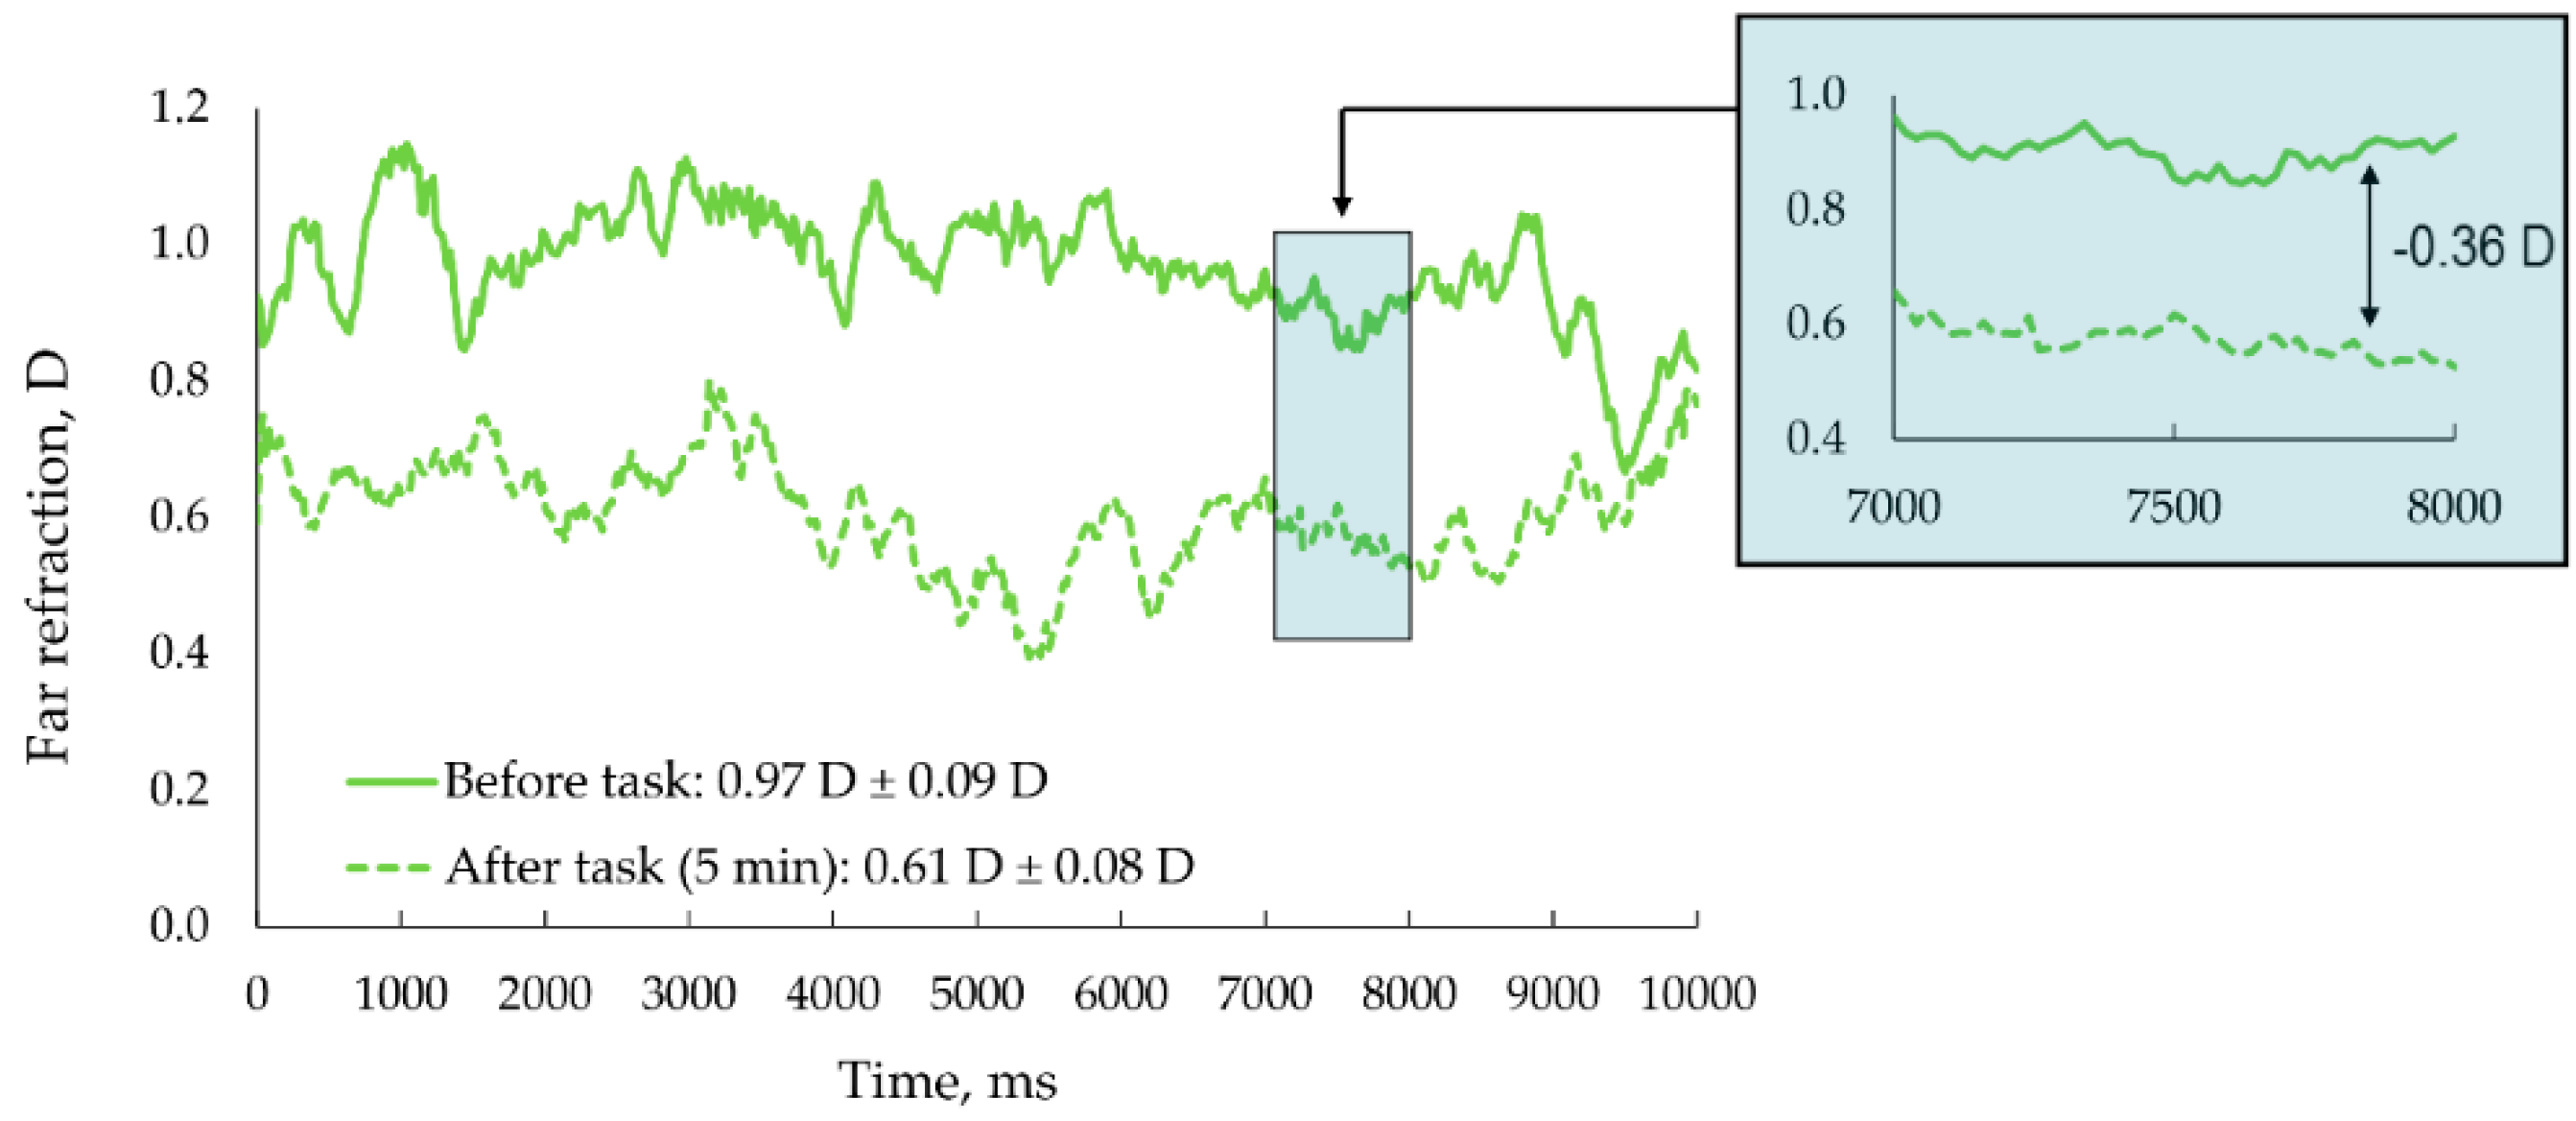
3.1. Near Work-Induced Refraction Shifts

One-way repeated measures ANOVA demonstrated that the differences between refraction shifts after Session 1, Session 2, and Session 3 were not statistically significant (F2,150 = 0.32, p = 0.73). Therefore, we used the mean refraction shift that was calculated from all three sessions (task shift). Post-task refraction shift was analyzed separately. Three categories for refraction shift analysis were identified: myopic shift (≤−0.05 D), hypermetropic shift (≥0.05 D), and clinically non-significant shift (>−0.05 D and <0.05 D) which was removed from the analysis. Figure 2 shows an example of 10 s measurement data where accommodation microfluctuations are well seen and an example of myopic 0.36 D post task refraction shift is observed.
We analyzed the percentage of eyes experiencing the specific refraction shift type, to understand the distribution of changes, as well as the mean amount of the changes, in order to estimate the size of the effect (except for clinically non-significant shifts) in each category. First, we were interested in whether the refraction shift type distribution was different for volumetric 3D and anaglyph 3D (see Table 2). We performed a two-way Chi-square test of association between the variables screen type (volumetric or anaglyph) and refraction shift type (myopic or hypermetropic) for each of the three conditions (baseline, task shift, and post-task shift). The results show that task shift compared to post task shift were more hypermetropic for volumetric 3D and more myopic shifts along with less hypermetropic shifts occurred for anaglyph 3D (χ21, N = 54 = 5.47, p = 0.02). There was no statistically significant association for distribution between screen type and shift type in other combinations: task shift versus baseline (χ21, N = 59 = 0.14, p = 0.71) and post-task versus baseline (χ21, N = 58 = 1.07, p = 0.30). The distribution of clinically non-significant shifts for volumetric 3D and anaglyph 3D were 24% and 21% for task shift and 21% and 27% for post task shift.
Secondly, we were interested in whether the mean values of the refraction shift (baseline versus task) differ between the groups of volumetric 3D and anaglyph 3D and between the refraction shift direction. The average amount of the hypermetropic shift was +0.22 ± 0.14 D for volumetric 3D and +0.22 ± 0.15 D for anaglyph 3D. The average amount of myopic shift was −0.19 ± 0.17 D for volumetric 3D and −0.16 ± 0.06 D for anaglyph 3D. Two-way ANOVA analysis for the difference between the absolute values of each three conditions (baseline, task, post-task) revealed neither, 3D type nor refraction shift amount, as statistically significant factor (3D type: Baseline versus task: F1,56 = 0.102, p = 0.75; task versus post-task: F1,51 = 0.827, p = 0.37; baseline vs. post-task: F1,55 = 0.155, p = 0.67); task type: baseline versus task: F1,56 = 1.275, p = 0.26; task versus post-task: F1,51 = 0.161, p = 0.690; baseline vs. post-task: F1,55 = 0.504, p = 0.48).

3.2. Accommodative Microfluctuations
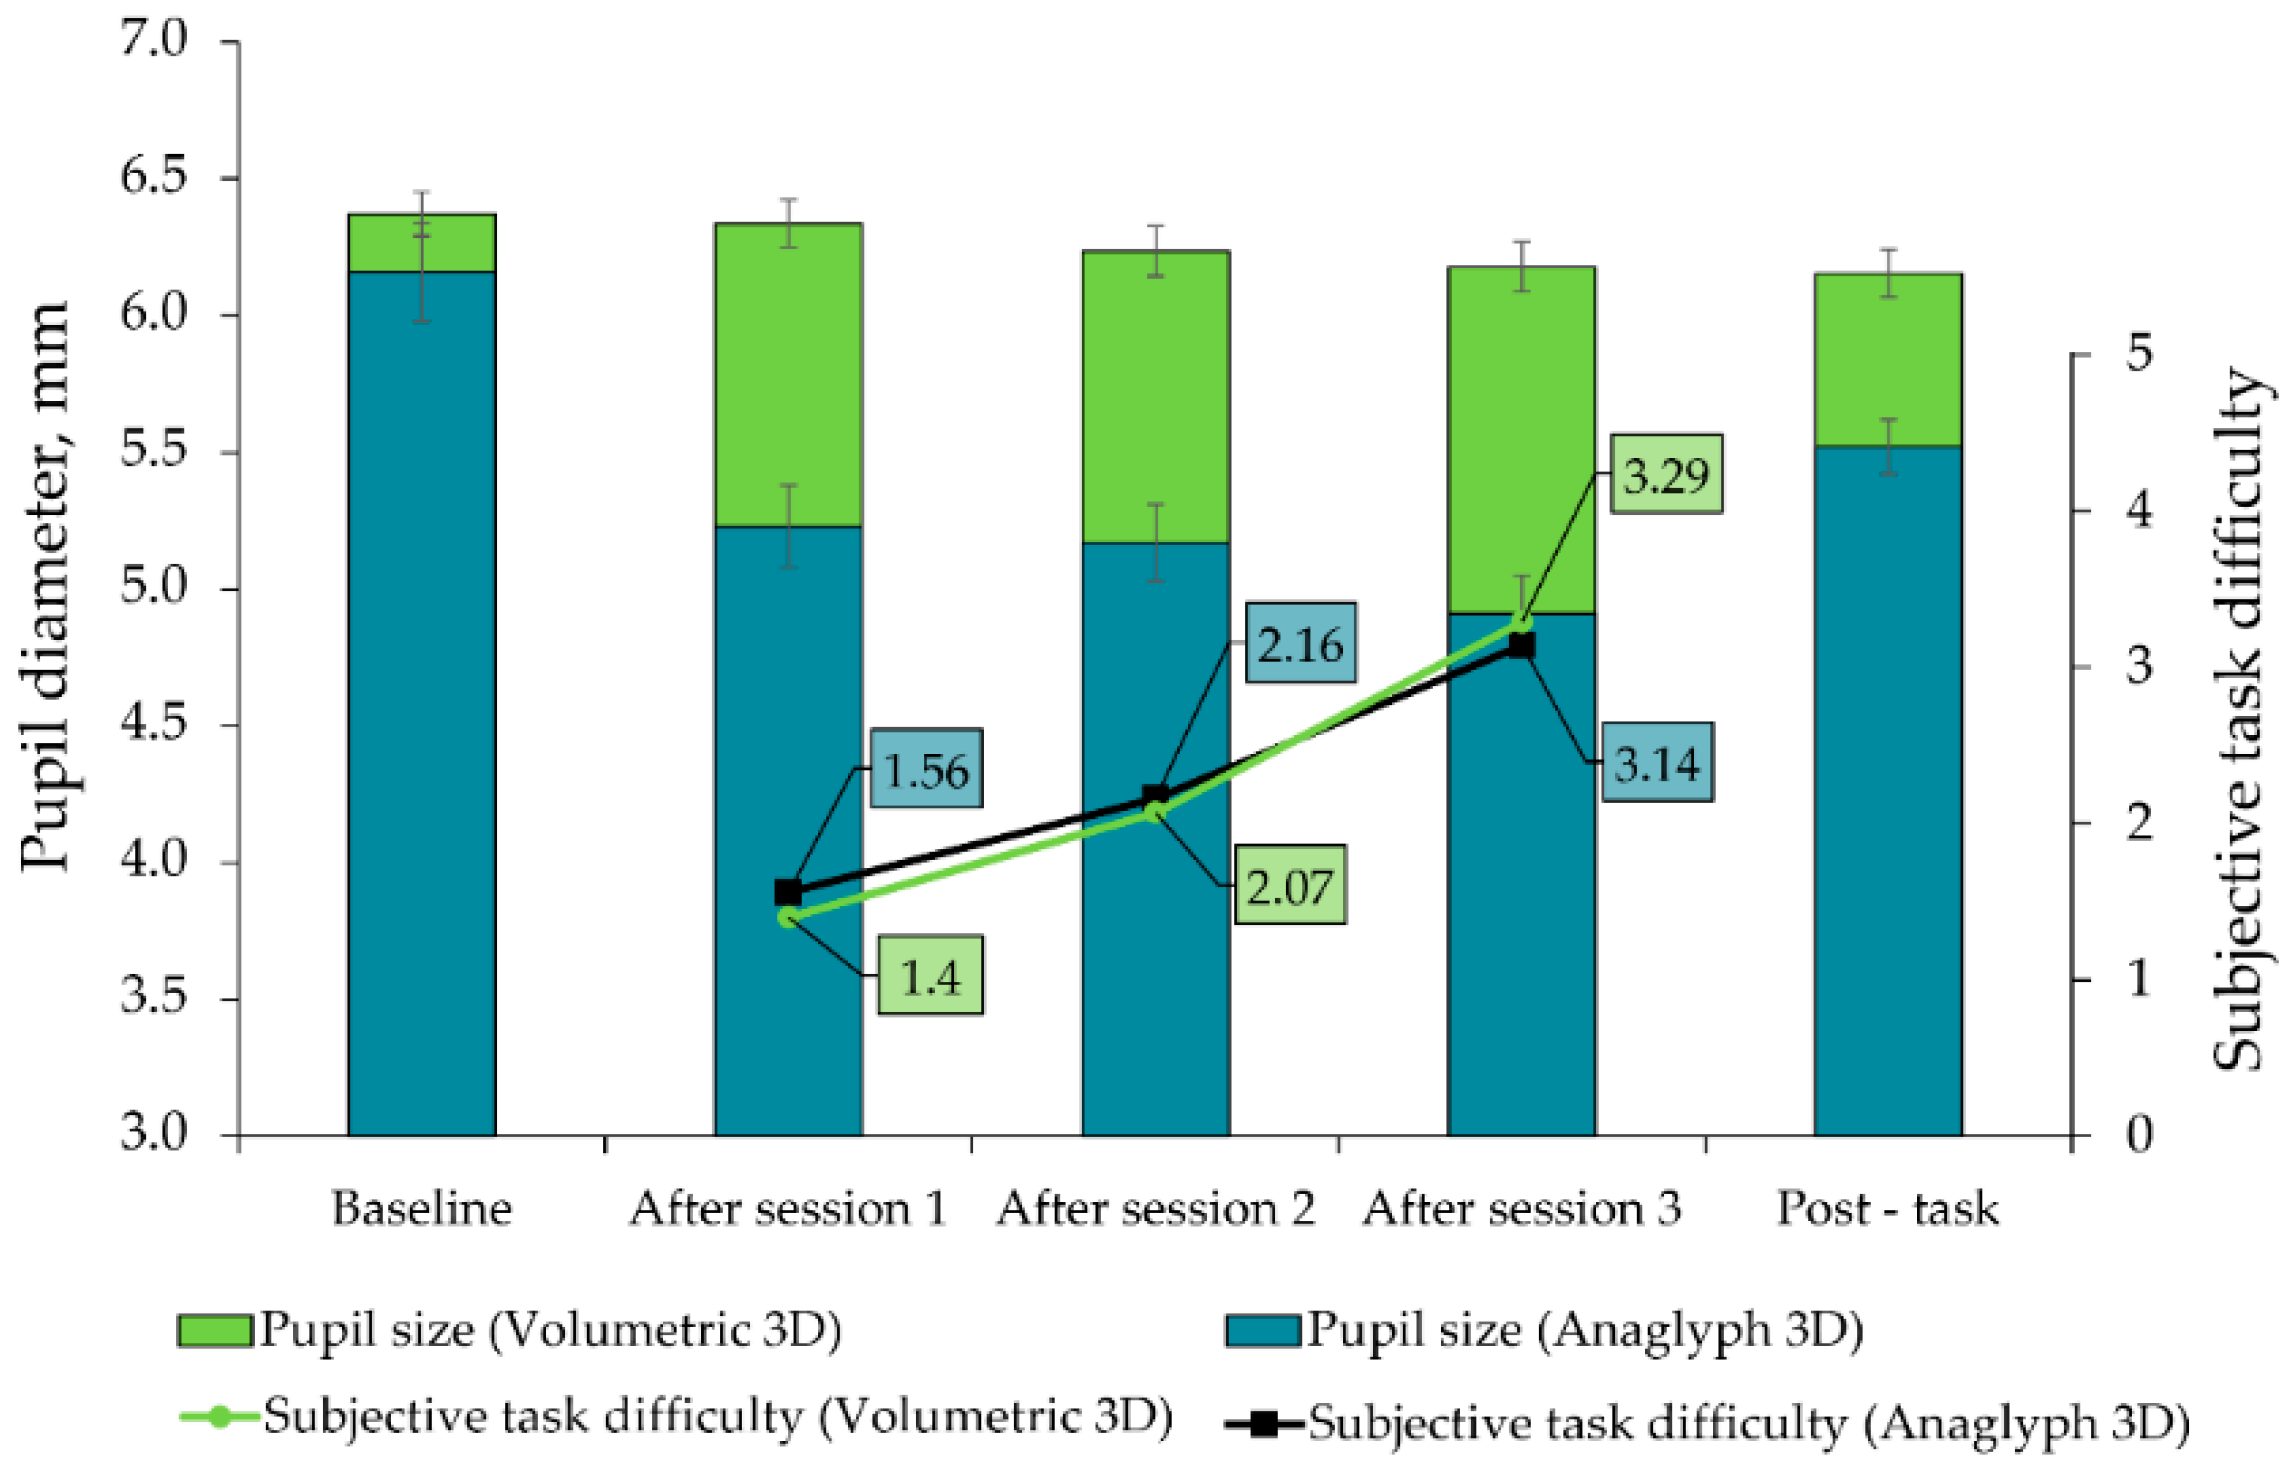
The mean RMS values (±SD) of steady state accommodation response, at near and far distance for volumetric 3D and anaglyph 3D group, is shown in Table 3. Three-way mixed design ANOVA was performed to compare RMS values (factors session, 3D type, and distance). We did not observe the significant difference in accommodative microfluctuations after work with volumetric 3D or anaglyph 3D (F1,74 = 0.05, p = 0.82). Microfluctuations remained constant during all sessions (F2.67,196.7 = 2.02, p = 0.12) for both conditions and were significantly larger at near distance (5.00 D accommodation demand), compared to far distance (0.00 D accommodative demand) (F1,74 = 128.0, p < 0.001).

3.3. Pupil Size

The three-way mixed design ANOVA analysis (factors session, 3D type and distance) shows considerable change in pupil size for the main factors distance and session, allowing to state that pupil size was smaller for near distance (F1,38 = 4.7, p = 0.036) and decreased with sessions (F3,114 = 40.7, p < 0.001). For further analysis, the only pupil size at far distance is analyzed and presented in Figure 3 for all sessions in anaglyph 3D and volumetric 3D groups. There was no difference between baseline far pupil size in two groups—volumetric 3D and anaglyph 3D (F1,38 = 1.85, p = 0.18). Interaction effect between 3D type and session was significant (F3,114 = 17.50, p < 0.001). Closer analysis of this interaction between session and 3D type by post hoc Bonferroni adjusted pairwise comparisons demonstrates that sessions have different effects depending on the display type used. For the volumetric 3D, the significant difference is revealed only between baseline and Session 3 (p = 0.003). For the anaglyph 3D, there is a significant difference in the pupil size in all sessions compared to baseline: Session 1 (p < 0.001), Session 2 (p < 0.001), and Session 3 (p < 0.001). This demonstrates that the pupil size changes will appear at the later stages working with volumetric 3D, compared to anaglyph 3D, where changes are observed already at the beginning of the work.
Finally, we were interested in the difference between the baseline pupil measurement and post-task pupil measurement in the far. Two-way mixed design ANOVA, with factors session and 3D type, was performed. We found that the session was a significant factor (F3.01,117.5 = 29.9, p < 0.001), as well as the interaction factor between session and 3D type (F3.01,117.5 = 13.91, p < 0.001). We explored the interaction more closely to analyze whether the pupil size returned to baseline measurement at 5 min post-task. The Bonferroni corrected the pairwise difference test between baseline. The post-task measurement were statistically significant for both volumetric 3D (p = 0.003) and anaglyph 3D (p = 0.003). The pupil becomes smaller after viewing 3D content and this effect remains, at least, 5 min after the end of the near task, regardless of the method used to present 3D image.
Two-way mixed design ANOVA (factors session and 3D type) for subjective task difficulty evaluation revealed a significant increase in the subjective difficulty evaluation over sessions (F1.5,57 = 104.5, p < 0.001). Post hoc Bonferroni corrected pairwise t-test comparison between sessions revealed that all the pairwise differences between sessions were statistically significant (p < 0.001). Our results show an association between pupil size decrease and increase in subjective task difficulty that can be correspondingly attributed to increased fatigue along with decrease in pupil size with sessions.

4. Discussion

Our findings suggest that sustained work with 3D content with small disparities (Anaglyph 3D task) or with fully eliminated possibility of accommodation-vergence conflict (Volumetric 3D task) can not only minimize near work-induced myopic shift, but also provide beneficial accommodation relaxation via hypermetropic shift for nearly half of participants. One of the explanations could be related to the fact that our participants were all emmetropic, while NITM is more likely to affect people with myopic baseline refraction [6]. Ciuffreda and Wallis (1998) previously compared comparison to only 33% of emmetropes, and 11% of hypermetropes experienced NITM after short period of sustained near work. [10]. Another factor that could have stimulated hypermetropic shift is specific volumetric 3D content, which requires a focus on different display segments, providing a range of accommodative demands, that were not constant like for regular near work. Thus, visual systems when using volumetric display works similar (changing accommodative response) to natural viewing conditions. To the extent of our knowledge, this is the first study that demonstrates hypermetropic shift after 3D content near work. Further work needs to be done to estimate whether real voxel-based 3D content can provide beneficial accommodation relaxation training.
Furthermore, this study demonstrated that accommodative microfluctuations were not statistically different in both groups and did not change during the task. Other studies in similar experimental conditions have found results that support this conclusion [37,38]. We observed increased accommodative microfluctuations at closer viewing distance (compared to far) for both 3D type groups. This result is in agreement with previous studies that have also found greater microfluctuations at near compared to far distances [17,21,28].
The pattern of pupil size changes was similar after work with volumetric and anaglyph 3D task. However, interaction analysis revealed that sessions have different effects on pupil size depending on the 3D type used. Significant change in pupil size was observed only after Session 3 compared to the baseline if volumetric 3D was used. Whereas, pupil size decreased after Session 1 and constantly decreased during all following sessions where anaglyph 3D was used. These changes can be interpreted as an objective sign of fatigue after sustained near work. Pupillometry is considered a challenging method for vision science research, because the pupil is very easily influenced by external stimuli, such as sensorial and emotional conditions that can be hard to control by the participants. It is still widely used because of easy, relatively cheap access and objectivity. Oyamada et al. (2007) measured changes in amplitude and velocity of the pupillary light reflex as dynamic parameters to evaluate visual fatigue [50]. Another well-presented change in pupil diameter is related to cognitive demands, where it is generally accepted that pupil dilates with increasing required cognitive effort. Therefore, pupil dilation can be used as an indirect index of effort in cognitive control tasks, as pupil dilation closely responds to changes in task demands, and in some cases, predict improved task performance [51]. There was no specific cognitive demand required for performing relative depth estimation task used in our study. A recent study [40] collected static and dynamic pupillometry data of healthy individuals, where they observed that pupil contraction amplitude is smaller with a smaller baseline diameter. Therefore, it could be beneficial to present changes in pupil size as a percentage of the baseline pupil diameter, instead of changes in milimeters.
There is a variety of intra-subject, task and environment condition related issues that have influence on overall visual performance. The limitations in our study, relevant to task (visual stimulus) and room environment, will be discussed further. The display parameters and stimulus size calculations were made as equal as possible for both displays, but there were few technical limitations that prevented them from equally matched visual information, viewed on anaglyph 3D and volumetric 3D. First, it was not possible to provide an equal stimulus color and brightness because we had to use chromatically opposite colored circles to produce stereo images by anaglyph technique, while the white circles were used in a volumetric display. The resolution of volumetric display was relatively lower, as well as brightness and contrast. For comparable pupil size evaluations, it was crucial to correct for differences between the brightness of both displays. Therefore, we asked participants who were tasked with anaglyph technique to subjectively adjust the brightness of both displays (volumetric display was the reference) prior the experiment for equal brightness. Room lighting as environment related limitation must be mentioned for this and other studies, where eccentric photorefraction technique is used, because eye accommodation response provides that its best performance is in good lighting environment [52]. In order to provide pupil size above 4 mm so the eccentric photorefractor would be able to make reliable measurements, our experiment was conducted in low light level (4 lux at the eye plane, 10× more at stimulus plane). Low lighting conditions are recommended also for work with volumetric display, because the brightness of projector is relatively low, and the best image contrast is achieved in low lighting conditions.
There are several methods available for refraction shift, microfluctuations, and pupil size data analysis. Accommodative microfluctuations expressed as RMS value has been used in several studies [31,33,53]. The main advantage of this technique is its easy interpretation because it provides a single number that indicates the average amount of fluctuations in a specified time interval. The accuracy of the result is affected only by the number of samples measured on the signal that was very high in our 10 s interval. The main disadvantage and limitation of this data analysis technique is the fact that it does not provide information about the evolution of the response spectrum over time, and the shape of the spectrum of the signal [54].

5. Conclusions

This study has demonstrated that 3D task, performed on the volumetric display created fewer undesirable effects related to visual fatigue, compared to standard display: Less myopic refraction shift, no changes in accommodative microfluctuations, during the task, as well as delayed onset in pupil constriction. It appears that performing 3D task on the volumetric display is much closer to the true depth perception compared to anaglyph 3D created on standard monitors.

Author Contributions

Conceptualization, K.P. and T.P.; formal analysis, M.V.; funding acquisition, G.K.; investigation, K.P.; methodology, K.P., and T.P.; supervision, A.S., and G.K.; validation, A.S. and G.K.; visualization, K.P.; writing—original draft, K.P.; writing—review and editing, A.S.

Funding

The research has been financed by the University of Latvia and LightSpace Technologies (the project No. ZD2017/20467, effective collaboration project: “3D volumetric screen and the functionality of the visual system”), SIA Mikrotikls, and the Foundation of the University of Latvia (the project No. 2184 “Development of environment for visual ergonomics studies”).

Conflicts of Interest

The authors declare no conflict of interest. The funders had no role in the design of the study; in the collection, analyses, or interpretation of data; in the writing of the manuscript, or in the decision to publish the results. Funder Lightspace Technologies provided technical support via computer programming for generating visual stimulus specifically on volumetric display.

References

  1. Osmanis, K.; Valters, G.; Zabels, R.; Gertners, U.; Osmanis, I.; Kalnins, L.; Kandere, U.; Ozols, A. Advanced multiplanar volumetric 3D display. Proc. SPIE 2018, 10555, 1055510. [Google Scholar] [CrossRef]
  2. Bando, T.; Iijima, A.; Yano, S. Visual fatigue caused by stereoscopic images and the search for the requirement to prevent them: A review. Displays 2012, 33, 76–83. [Google Scholar] [CrossRef]
  3. Hoffman, D.M.; Girshick, A.R.; Akeley, K.; Banks, M.S. Vergence–accommodation conflicts hinder visual performance and cause visual fatigue. J. Vis. 2008, 8, 33. [Google Scholar] [CrossRef] [PubMed]
  4. Ukai, K.; Howarth, P.A. Visual fatigue caused by viewing stereoscopic motion images: Background, theories, and observations. Displays 2008, 29, 106–116. [Google Scholar] [CrossRef]
  5. Cutting, J.E.; Vishton, P.M. Perceiving layout and knowing distances: The integration, relative potency, and contextual use of different information about depth. In Perception of Space and Motion; Elsevier: Amsterdam, The Netherlands, 1995; pp. 69–117. [Google Scholar] [CrossRef]
  6. Arunthavaraja, M.; Vasudevan, B.; Ciuffreda, K.J. Nearwork-induced transient myopia (NITM) following marked and sustained, but interrupted, accommodation at near. Ophthalmic Physiol. Opt. 2010, 30, 766–775. [Google Scholar] [CrossRef] [PubMed]
  7. Ciuffreda, K.J.; Vasudevan, B. Nearwork-induced transient myopia (NITM) and permanent myopia-is there a link? Ophthalmic Physiol. Opt. 2008, 28, 103–114. [Google Scholar] [CrossRef]
  8. Iribarren, R.; Fornaciarr, A.; Hung, G.K. Effect of cumulative nearwork on accommodative facility and asthenopia. Int. Ophthalmol. 2001, 24, 205–212. [Google Scholar] [CrossRef]
  9. Ong, E.; Ciuffreda, K.J. Nearwork-induced transient myopia: A critical review. Doc. Ophthalmol. J. Clin. Electrophysiol. Vis.-Off. J. Int. Soc. Clin. Electrophysiol. Vis. 1995, 91, 57–85. [Google Scholar] [CrossRef]
  10. Ciuffreda, K.J.; Wallis, D.M. Myopes show increased susceptibility to nearwork aftereffects. Investig. Ophthalmol. Vis. Sci. 1998, 39, 1797–1803. [Google Scholar]
  11. Moulakaki, A.I.; Recchioni, A.; Águila-Carrasco, A.J.D.; Esteve-Taboada, J.J.; Montés-Micó, R. Assessing the accommodation response after near visual tasks using different handheld electronic devices. Arq. Bras. Oftalmol. 2017, 80, 9–13. [Google Scholar] [CrossRef]
  12. Owens, D.A.; Wolf-Kelly, K. Near work, visual fatigue, and variations of oculomotor tonus. Investig. Ophthalmol. Vis. Sci. 1987, 28, 743–749. [Google Scholar]
  13. Ip, J.M.; Saw, S.M.; Rose, K.A.; Morgan, I.G.; Kifley, A.; Wang, J.J.; Mitchell, P. Role of Near Work in Myopia: Findings in a Sample of Australian School Children. Investig. Opthalmology Vis. Sci. 2008, 49, 2903. [Google Scholar] [CrossRef] [PubMed]
  14. Muhamedagic, L.; Muhamedagic, B.; Halilovic, E.A.; Halimic, J.A.; Stankovic, A.; Muracevic, B. Relation between near work and myopia progression in student population. Mater. Sociomed. 2014, 26, 100–103. [Google Scholar] [CrossRef] [PubMed]
  15. Díaz Llopis, M.; Cisneros Lanuza, A. Myopia, the challenge of Ophthalmology and its worldwide “explosive epidemic”. Arch. La Soc. Española Oftalmol. (Engl. Ed.) 2018, 93, 365–367. [Google Scholar] [CrossRef]
  16. Rudnicka, A.R.; Kapetanakis, V.V.; Wathern, A.K.; Logan, N.S.; Gilmartin, B.; Whincup, P.H.; Cook, D.G.; Owen, C.G. Global variations and time trends in the prevalence of childhood myopia, a systematic review and quantitative meta-analysis: Implications for aetiology and early prevention. Br. J. Ophthalmol. 2016, 100, 882–890. [Google Scholar] [CrossRef] [PubMed]
  17. Charman, W.N.; Heron, G. Microfluctuations in accommodation: An update on their characteristics and possible role. Ophthalmic Physiol. Opt. 2015, 35, 476–499. [Google Scholar] [CrossRef] [PubMed]
  18. Lambooij, M.T.M.; IJsselsteijn, W.A.; Heynderickx, I. Visual discomfort in stereoscopic displays: A review. In Proceeding SPIE 6490: Stereoscopic Displays and Virtual Reality Systems XIV; Society of Photo Optical: Bellingham, WC, USA, 2007; Volume 64900I. [Google Scholar] [CrossRef]
  19. Alpern, M. Variability of accommodation during steady fixation at various levels of illuminance. J. Opt. Soc. Am. 1958, 48, 193. [Google Scholar] [CrossRef]
  20. Leahy, C.; Leroux, C.; Dainty, C.; Diaz-Santana, L. Temporal dynamics and statistical characteristics of the microfluctuations of accommodation: Dependence on the mean accommodative effort. Opt. Express 2010, 18, 2668–2681. [Google Scholar] [CrossRef]
  21. Day, M.; Strang, N.C.; Seidel, D.; Gray, L.S.; Mallen, E.A.H. Refractive group differences in accommodation microfluctuations with changing accommodation stimulus. Ophthalmic Physiol. Opt. 2006, 26, 88–96. [Google Scholar] [CrossRef]
  22. Gray, L.S.; Winn, B.; Gilmartin, B. Effect of target luminance on microfluctuations of accommodation. Ophthalmic Physiol. Opt. 1993, 13, 258–265. [Google Scholar] [CrossRef]
  23. Daum, K.M. Accommodative dysfunction. Doc. Ophthalmol. 1983, 55, 177–198. [Google Scholar] [CrossRef] [PubMed]
  24. Sheppard, A.L.; Wolffsohn, J.S. Digital eye strain: Prevalence, measurement and amelioration. BMJ Open Ophthalmol. 2018, 3, 146. [Google Scholar] [CrossRef] [PubMed]
  25. Bullimore, M.A.; Gilmartin, B. Tonic accommodation, cognitive demand, and ciliary muscle innervation. Am. J. Optom. Physiol. Opt. 1987, 64, 45–50. [Google Scholar] [CrossRef] [PubMed]
  26. Gabriel, G.M.; Mutti, D.O. Evaluation of infant accommodation using retinoscopy and photoretinoscopy. Optom. Vis. Sci. 2009, 86, 208–215. [Google Scholar] [CrossRef] [PubMed]
  27. Roberts, T.L.; Manny, R.E.; Benoit, J.S.; Anderson, H.A. Impact of cognitive demand during sustained near tasks in children and adults. Optom. Vis. Sci. 2018, 95, 223–233. [Google Scholar] [CrossRef] [PubMed]
  28. Harb, E.; Thorn, F.; Troilo, D. Characteristics of accommodative behavior during sustained reading in emmetropes and myopes. Vision Res. 2006, 46, 2581–2592. [Google Scholar] [CrossRef] [Green Version]
  29. Seidel, D.; Gray, L.S.; Heron, G. Retinotopic accommodation responses in myopia. Invest. Ophthalmol. Vis. Sci. 2003, 44, 1035–1041. [Google Scholar] [CrossRef]
  30. Gray, L.S.; Winn, B.; Gilmartin, B. Accommodative microfluctuations and pupil diameter. Vision Res. 1993, 33, 2083–2090. [Google Scholar] [CrossRef]
  31. Day, M.; Gray, L.S.; Seidel, D.; Strang, N.C. The relationship between object spatial profile and accommodation microfluctuations in emmetropes and myopes. J. Vis. 2009, 9, 1–13. [Google Scholar] [CrossRef]
  32. Aggarwala, K.R.; Kruger, E.S.; Mathews, S.; Kruger, P.B. Spectral bandwidth and ocular accommodation. J. Opt. Soc. Am. A 1995, 12, 450. [Google Scholar] [CrossRef]
  33. Anderson, H.A.; Glasser, A.; Manny, R.E.; Stuebing, K.K. Age-related changes in accommodative dynamics from preschool to adulthood. Investig. Ophthalmol. Vis. Sci. 2010, 51, 614–622. [Google Scholar] [CrossRef]
  34. Mordi, J.A.; Ciuffreda, K.J. Dynamic aspects of accommodation: Age and presbyopia. Vision Res. 2004, 44, 591–601. [Google Scholar] [CrossRef]
  35. Panke, K.; Svede, A.; Jaschinski, W.; Krumina, G. Usage of CISS and Conlon surveys in eye accommodation studies. Proc. SPIE 2017, 10453, 104533A. [Google Scholar] [CrossRef]
  36. Mira-Agudelo, A.; Lundströ, L.; Artal, P. Temporal dynamics of ocular aberrations: Monocular vs. binocular vision. Ophthalmic Physiol. Opt. 2009, 29, 256–263. [Google Scholar] [CrossRef]
  37. Maeda, F.; Tabuchi, A.; Kani, K. Influence of three-dimensional image viewing on visual function. Jpn. J. Ophthalmol. 2011, 5, 175–182. [Google Scholar] [CrossRef]
  38. Iwasaki, T.; Tawara, A. Effects of viewing distance on accommodative and pupillary responses following a three-dimensional task. Ophthalmic Physiol. Opt. 2002, 22, 113–118. [Google Scholar] [CrossRef]
  39. McDougal, D.H.; Gamlin, P.D. Autonomic control of the eye. Compr. Physiol. 2015, 5, 439–473. [Google Scholar] [CrossRef]
  40. Tekin, K.; Sekeroglu, M.A.; Kiziltoprak, H.; Doguizi, S.; Inanc, M.; Yilmazbas, P. Static and dynamic pupillometry data of healthy individuals. Clin. Exp. Optom. 2018, 101, 659–665. [Google Scholar] [CrossRef]
  41. Lowenstein, O.; Feinberg, R.; Loewenfeld, I. Pupillary movements during acute and chronic fatigue. Invest. Ophthalmol. Vis. Sci. 1963, 2, 138–157. [Google Scholar]
  42. Gislén, A.; Gustafsson, J.; Kröger, R.H.H. The accommodative pupil responses of children and young adults at low and intermediate levels of ambient illumination. V. Res. 2008, 48, 989–993. [Google Scholar] [CrossRef] [Green Version]
  43. Lee, E.C.; Lee, J.W.; Park, K.R. Experimental investigations of pupil accommodation factors. Investig. Ophthalmol. Vis. Sci. 2011, 52, 6478–6485. [Google Scholar] [CrossRef]
  44. Sreenivasan, V.; Irving, E.L.; Bobier, W.R. Effect of near adds on the variability of accommodative response in myopic children. Ophthalmic Physiol. Opt. 2011, 31, 145–154. [Google Scholar] [CrossRef]
  45. Jainta, S.; Hoormann, J.; Jaschinski, W. Ocular accommodation and cognitive demand: An additional indicator besides pupil size and cardiovascular measures? J. Negat. Results Biomed. 2008, 7, 1–14. [Google Scholar] [CrossRef]
  46. Hunt, O.A.; Wolffsohn, J.S.; Gilmartin, B. Evaluation of the measurement of refractive error by the PowerRefractor: A remote, continuous and binocular measurement system of oculomotor function. Br. J. Ophthalmol. 2003, 87, 1504–1508. [Google Scholar] [CrossRef]
  47. Jainta, S.; Jaschinski, W.; Hoormann, J. Measurement of refractive error and accommodation with the photorefractor PowerRef II. Ophthalmic Physiol. Opt. 2004, 24, 520–527. [Google Scholar] [CrossRef]
  48. Sravani, N.G.; Nilagiri, V.K.; Bharadwaj, S.R. Photorefraction estimates of refractive power varies with the ethnic origin of human eyes. Sci. Rep. 2015, 5, 1–8. [Google Scholar] [CrossRef]
  49. Horwood, A.M.; Riddell, P.M. The use of cues to convergence and accommodation in naïve, uninstructed participants. Vision Res. 2008, 48, 1613–1624. [Google Scholar] [CrossRef]
  50. Oyamada, H.; Iijima, A.; Tanaka, A.; Ukai, K.; Toda, H.; Sugita, N.; Yoshizawa, M.; Bando, T. A pilot study on pupillary and cardiovascular changes induced by stereoscopic video movies. J. Neuroeng. Rehabil. 2007, 4, 1–7. [Google Scholar] [CrossRef]
  51. Van der Wel, P.; Van Steenbergen, H. Pupil dilation as an index of effort in cognitive control tasks: A review. Psychon. Bull. Rev. 2018, 25, 2005–2015. [Google Scholar] [CrossRef]
  52. Charman, W.N. Night myopia and driving. Ophthalmic Physiol. Opt. 1996, 16, 474–485. [Google Scholar] [CrossRef]
  53. MacKenzie, K.J.; Hoffman, D.M.; Watt, S.J. Accommodation to multiple-focal-plane displays: Implications for improving stereoscopic displays and for accommodation control. J. Vis. 2010, 10, 22. [Google Scholar] [CrossRef] [PubMed]
  54. Monticone, P.P.; Menozzi, M. A review on methods used to record and analyze microfluctuations of the accommodation in the human eye. J. Eur. Opt. Soc. 2011, 6, 1–7. [Google Scholar] [CrossRef]
Figure 1. Setup of volumetric display and PowerRef 3 system.
Photonics 06 00106 g001
Figure 2. An example (22-year-old participant, Anaglyph 3D group) of actual recordings of baseline far refraction and post-task refraction. The green solid line corresponds to the refraction status and microfluctuations at baseline status, measured before the task. The green dashed line represents refraction status and microfluctuations, measured 5 min after completion of all tasks (duration 30 min). Changes in refraction shift after 30 min anaglyph 3D near work can be observed along with microfluctuations during steady fixation.
Photonics 06 00106 g002
Figure 3. Box plots represents the mean values of pupil size for all experimental sessions in Volumetric 3D group (green bars) and Anaglyph 3D group (blue bars). Subjective task difficulty values measured with 5-point Likert scale are plotted as a solid line (black for Volumetric 3D and blue for Anaglyph 3D) with group mean values as data labels (green for Volumetric 3D and blue for Anaglyph 3D). The results show that pupil size decreased after viewing 3D content, along with an increase in subjective difficulty evaluation over sessions, regardless of the method used to present 3D image. However, for Volumetric 3D, the changes in pupil size are smaller and appear at the later stages compared to anaglyph 3D.
Photonics 06 00106 g003
Table 1. Relevant characteristics of the participants in Volumetric 3D and Anaglyph 3D groups.
Volumetric 3D (n = 19)Anaglyph 3D (n = 19)p-Value *
Age, years (mean ± SD)24 ± 423 ± 30.15
Stereoacuity, arc.sec (mean ± SD)42″ ± 9″44″ ± 14″0.30
Baseline refraction, D (mean ± SD)+0.30 ± 0.48+0.22 ± 0.400.50
Baseline pupil size, mm (mean ± SE)5.90 ± 0.106.14 ± 0.120.13
* independent sample t-test, statistical significance if p < 0.05.
Table 2. Refraction shift type distribution in two participant groups (Volumetric 3D and Anaglyph 3D) during sessions (task shift) and after sessions (post-task shift).
ConditionMyopic Shift, %Hypermetropic Shift, %
Volumetric 3DTask shift3442
Post-task shift3247
Anaglyph 3DTask shift3247
Post-task shift3934
Table 3. Accommodative microfluctuations expressed as mean RMS value (± SD) for near, and far, distances in each session for volumetric 3D and anaglyph 3D.
Accommodative Microfluctuations RMS (mean ± SD), D
BeforeAfter Session 1After Session 2After Session 3After 5 min
Far
(5 m)
Volumetric 3D0.098 ± 0.060.076 ± 0.030.084 ± 0.050.078 ± 0.040.077 ± 0.04
Anaglyph 3D0.083 ± 0.070.091 ± 0.060.100 ± 0.060.096 ± 0.060.089 ± 0.07
Near
(20 cm)
Volumetric 3D0.148 ± 0.060.161 ± 0.070.162 ± 0.080.183 ± 0.100-
Anaglyph 3D0.139 ± 0.070.160 ± 0.090.175 ± 0.100.160 ± 0.067-

