Experimental Demonstration to Enhance the Curvature Sensitivity of a Fiber Mach–Zehnder Interferometer Based on a Waist-Enlarged Technique Using Polymer

 , , , , , ,
Abstract
:1. Introduction
2. Fabrication Process and Operation Principle
3. Experimental Results
3.1. Experimental Setup for Performing Curvature Measurements
3.2. Temperature Measurement without and with Polymer
4. Results and Discussion
5. Conclusions
Author Contributions
Funding
Institutional Review Board Statement
Informed Consent Statement
Data Availability Statement
Acknowledgments
Conflicts of Interest
References
- Chen, Z.; Wang, C.; Ding, Z.; Zhu, D.; Guo, H.; Pan, M.; Yu, Y.; Liu, K.; Jiang, J.; Liu, T. Demonstration of Large Curvature Radius Shape Sensing Using Optical Frequency Domain Reflectometry in Multi-Core Fibers. IEEE Photonics J. 2021, 13, 1–9. [Google Scholar] [CrossRef]
- Arrizabalaga, O.; Sun, Q.; Beresna, M.; Lee, T.; Zubia, J.; Velasco Pascual, J.; Sáez De Ocáriz, I.; Schülzgen, A.; Antonio-Lopez, J.E.; Amezcua-Correa, R.; et al. High-Performance Vector Bending and Orientation Distinguishing Curvature Sensor Based on Asymmetric Coupled Multi-Core Fibre. Sci. Rep. 2020, 10, 14058. [Google Scholar] [CrossRef] [PubMed]
- Li, J.; Liu, B.; Liu, J.; Shi, J.-L.; He, X.-D.; Yuan, J.; Wu, Q. Low-Cost Wearable Device Based D-Shaped Single Mode Fiber Curvature Sensor for Vital Signs Monitoring. Sens. Actuators A Phys. 2022, 337, 113429. [Google Scholar] [CrossRef]
- Zhu, F.; Zhang, Y.; Jiang, W.; Qu, Y.; Qi, K.; Guo, Y. Self-Assembled Highly Sensitive Hybrid Structure Sensor for Vector Curvature and Temperature Measurement. J. Light. Technol. 2022, 40, 2570–2576. [Google Scholar] [CrossRef]
- Wang, F.; Zhang, L.; Ma, T.; Wang, X.; Yu, K.; Liu, Y. A High-Sensitivity Sensor Based on Tapered Dispersion Compensation Fiber for Curvature and Temperature Measurement. Opt. Commun. 2021, 481, 126534. [Google Scholar] [CrossRef]
- Ji, Y.; Sun, D.; Chen, Y.; Shi, Y.; Cao, J.; Zhang, G.; Han, Z.; Wang, C.; Zhu, X. A High Sensitivity Curvature Sensor Based on Microfiber Mach-Zehnder Interferometer with Tapered Seven-Core Fiber. IEEE Sens. J. 2021, 21, 24090–24097. [Google Scholar] [CrossRef]
- Sun, Y.; Zhou, X.; Yan, X.; Zhang, X.; Wang, F.; Cheng, T. A Temperature-Insensitive Bidimensional Curvature Sensor Employing C-Fiber-Based Fabry–Pérot Air Cavity. IEEE Trans. Instrum. Meas. 2022, 71, 1–6. [Google Scholar] [CrossRef]
- Li, X.; Liang, J.; Li, J.; Ye, J.; Liu, Y.; Chen, M.; Zhang, Z.; Qu, S. Highly Sensitive Curvature and Temperature Sensor Based on Double Groove Structure and Hollow Core Fiber. IEEE Sens. J. 2022, 22, 9454–9461. [Google Scholar] [CrossRef]
- Yu, Y.; Wang, K.; Zhang, X.; Zhang, Q.; Yang, Y.; Wang, Z.; Wang, Y.; Huang, Y.; Wen, J.; Chen, W.; et al. High-Sensitive Curvature Sensor Based on Negative Curvature Hollow Core Fiber. IEEE Sens. J. 2023, 23, 4849–4855. [Google Scholar] [CrossRef]
- Zhang, F.; Su, B.; Zhong, L.; Qi, B.; Xu, O.; Qin, Y. Ring Core Few-Mode Fiber Sensor for Curvature Measurement. Appl. Opt. 2022, 61, 2598. [Google Scholar] [CrossRef]
- Rong, Z.; Shu, X.; Xu, Z. Compact Fiber Curvature and Temperature Sensor Inscribed by Femtosecond Laser Through the Coating. J. Light. Technol. 2021, 39, 3981–3990. [Google Scholar] [CrossRef]
- Roldán-Varona, P.; Pallarés-Aldeiturriaga, D.; Rodríguez-Cobo, L.; López-Higuera, J.M. All-in-Fiber Multiscan Mach-Zehnder Interferometer Assisted by Core FBG for Simultaneous Multi-Parameter Sensing. Opt. Laser Technol. 2020, 132, 106459. [Google Scholar] [CrossRef]
- Marrujo-Garcia, S.; Hernandez-Romano, I.; Torres-CIsneros, M.; May-Arrioja, D.A.; Minkovich, V.P.; Monzon-Hernandez, D. Temperature-Independent Curvature Sensor Based on in-Fiber Mach-Zehnder Interferometer Using Hollow-Core Fiber. J. Light. Technol. 2020, 38, 4166–4173. [Google Scholar] [CrossRef]
- Herrera-Piad, L.A.; Hernández-Romano, I.; May-Arrioja, D.A.; Minkovich, V.P.; Torres-Cisneros, M. Sensitivity Enhancement of Curvature Fiber Sensor Based on Polymer-Coated Capillary Hollow-Core Fiber. Sensors 2020, 20, 3763. [Google Scholar] [CrossRef]
- Lu, J.; Yu, Y.; Qin, S.; Li, M.; Bian, Q.; Lu, Y.; Hu, X.; Yang, J.; Meng, Z.; Zhang, Z. High-Performance Temperature and Pressure Dual-Parameter Sensor Based on a Polymer-Coated Tapered Optical Fiber. Opt. Express 2022, 30, 9714. [Google Scholar] [CrossRef] [PubMed]
- Cai, L.; Li, J. PDMS Packaged Microfiber Knot Resonator Used for Sensing Longitudinal Load Change. J. Phys. Chem. Solids 2020, 138, 109268. [Google Scholar] [CrossRef]
- Zhao, W.; Wang, Y.; Li, S.; Geng, W.; Bao, C.; Fang, Y.; Wang, Z.; Liu, Y.; Ren, Y.; Pan, Z.; et al. Non-Zero Dispersion-Shifted Ring Fiber for the Orbital Angular Momentum Mode. Opt. Express 2021, 29, 25428. [Google Scholar] [CrossRef]
- Huerta-Mascotte, E.; Sierra-Hernandez, J.; Mata-Chavez, R.; Jauregui-Vazquez, D.; Castillo-Guzman, A.; Estudillo-Ayala, J.; Guzman-Chavez, A.; Rojas-Laguna, R. A Core-Offset Mach Zehnder Interferometer Based on A Non-Zero Dispersion-Shifted Fiber and Its Torsion Sensing Application. Sensors 2016, 16, 856. [Google Scholar] [CrossRef]
- Rong, Q.; Qiao, X.; Du, Y.; Feng, D.; Wang, R.; Ma, Y.; Sun, H.; Hu, M.; Feng, Z. In-Fiber Quasi-Michelson Interferometer with a Core–Cladding-Mode Fiber End-Face Mirror. Appl. Opt. 2013, 52, 1441. [Google Scholar] [CrossRef]
- Bertholds, A.; Dandliker, R. Determination of the Individual Strain-Optic Coefficients in Single-Mode Optical Fibres. J. Light. Technol. 1988, 6, 17–20. [Google Scholar] [CrossRef]
- Albero Blanquer, L.; Marchini, F.; Seitz, J.R.; Daher, N.; Bétermier, F.; Huang, J.; Gervillié, C.; Tarascon, J.-M. Optical Sensors for Operando Stress Monitoring in Lithium-Based Batteries Containing Solid-State or Liquid Electrolytes. Nat. Commun. 2022, 13, 1153. [Google Scholar] [CrossRef] [PubMed]
- Gong, H.; Yang, X.; Ni, K.; Zhao, C.-L.; Dong, X. An Optical Fiber Curvature Sensor Based on Two Peanut-Shape Structures Modal Interferometer. IEEE Photon. Technol. Lett. 2014, 26, 22–24. [Google Scholar] [CrossRef]
- Cai, L.; Zhao, Y.; Li, X. A Fiber Ring Cavity Laser Sensor for Refractive Index and Temperature Measurement with Core-Offset Modal Interferometer as Tunable Filter. Sens. Actuators B Chem. 2017, 242, 673–678. [Google Scholar] [CrossRef]
- Liu, D.; Wu, Q.; Mei, C.; Yuan, J.; Xin, X.; Mallik, A.K.; Wei, F.; Han, W.; Kumar, R.; Yu, C.; et al. Hollow Core Fiber Based Interferometer for High-Temperature (1000 °C) Measurement. J. Light. Technol. 2018, 36, 1583–1590. [Google Scholar] [CrossRef]
- White, I.M.; Fan, X. On the Performance Quantification of Resonant Refractive Index Sensors. Opt. Express 2008, 16, 1020. [Google Scholar] [CrossRef] [PubMed]
- Niu, L.; Zhao, C.-L.; Gong, H.; Li, Y.; Jin, S. Curvature Sensor Based on Two Cascading Abrupt-Tapers Modal Interferometer in Single Mode Fiber. Opt. Commun. 2014, 333, 11–15. [Google Scholar] [CrossRef]
- Bai, Z.; Zhang, W.; Gao, S.; Zhang, H.; Wang, L.; Liu, F. Bend-Insensitive Long Period Fiber Grating-Based High Temperature Sensor. Opt. Fiber Technol. 2015, 21, 110–114. [Google Scholar] [CrossRef]
- Barrera, D.; Madrigal, J.; Sales, S. Long Period Gratings in Multicore Optical Fibers for Directional Curvature Sensor Implementation. J. Light. Technol. 2018, 36, 1063–1068. [Google Scholar] [CrossRef]
- Xu, S.; Chen, H.; Feng, W. Fiber-Optic Curvature and Temperature Sensor Based on the Lateral-Offset Spliced SMF-FCF-SMF Interference Structure. Opt. Laser Technol. 2021, 141, 107174. [Google Scholar] [CrossRef]
- Yuan, W.; Zhao, Q.; Li, L.; Wang, Y.; Yu, C. Simultaneous Measurement of Temperature and Curvature Using Ring-Core Fiber-Based Mach-Zehnder Interferometer. Opt. Express 2021, 29, 17915. [Google Scholar] [CrossRef]
- Liu, H.; Yang, H.; Qiao, X.; Wang, Y.; Liu, X.; Lee, Y.-S.; Lim, K.-S.; Ahmad, H. Curvature and Temperature Measurement Based on a Few-Mode PCF Formed M-Z-I and an Embedded FBG. Sensors 2017, 17, 1725. [Google Scholar] [CrossRef] [PubMed]


| L (cm) | Curvature Sensitivity (nm/m−1) | Curvature Range (m−1) | R-Square |
|---|---|---|---|
| 5 | −4.86 ± 0.35 | From 1.25 to 1.77 (0.52) | 0.98 |
| 5.5 | −3.28 ± 0.16 | From 1.08 to 1.53 (0.45) | 0.99 |
| 6 | −2.50 ± 0.14 | From 0.88 to 1.53 (0.65) | 0.98 |
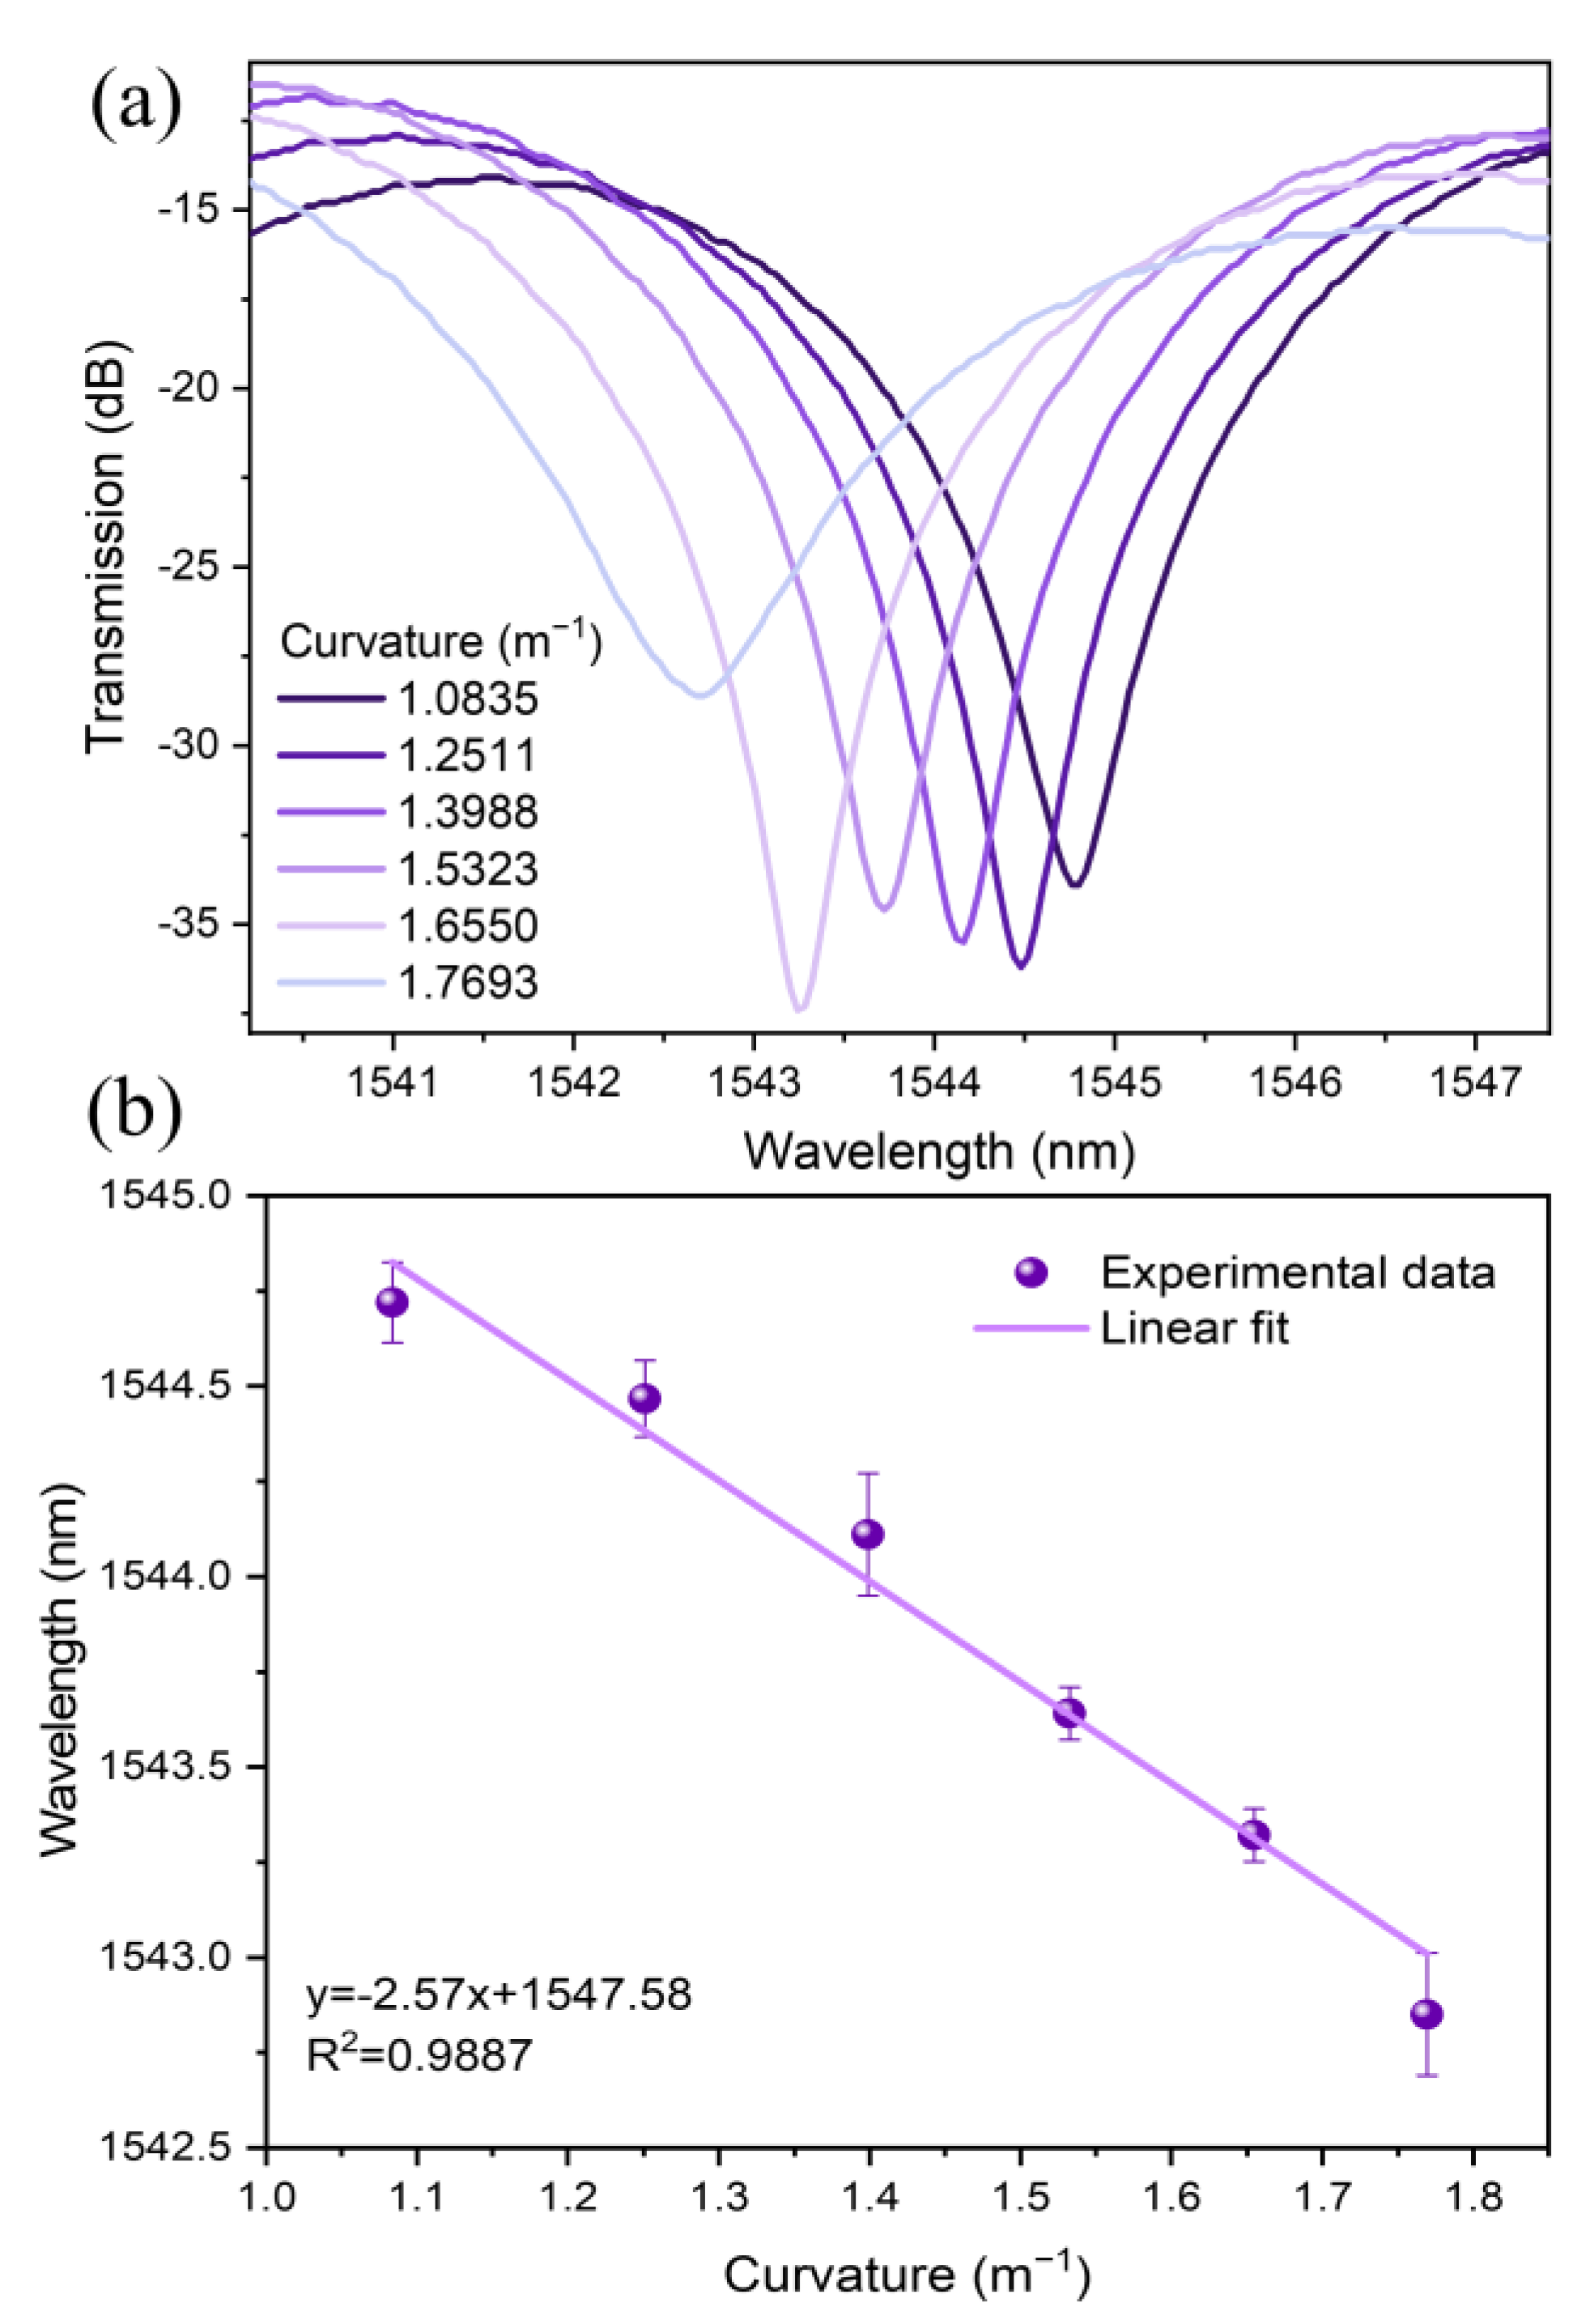
| 6.5 | −2.57 ± 0.15 | From 1.08 to 1.77 (0.69) | 0.98 |
| 7 | −4.46 ± 0.44 | From 0.62 to 1.39 (0.77) | 0.97 |
| L (cm) | Curvature Sensitivity (nm/m−1) | Curvature Range (m−1) | R-Square |
|---|---|---|---|
| 5 | −6.44 ± 0.52 | From 0.88 to 1.39 (0.51) | 0.98 |
| 5.5 | −7.26 ± 1.11 | From 1.25 to 1.77 (0.52) | 0.93 |
| 6 | −7.40 ± 1.27 | From 0.88 to 1.39 (0.51) | 0.94 |
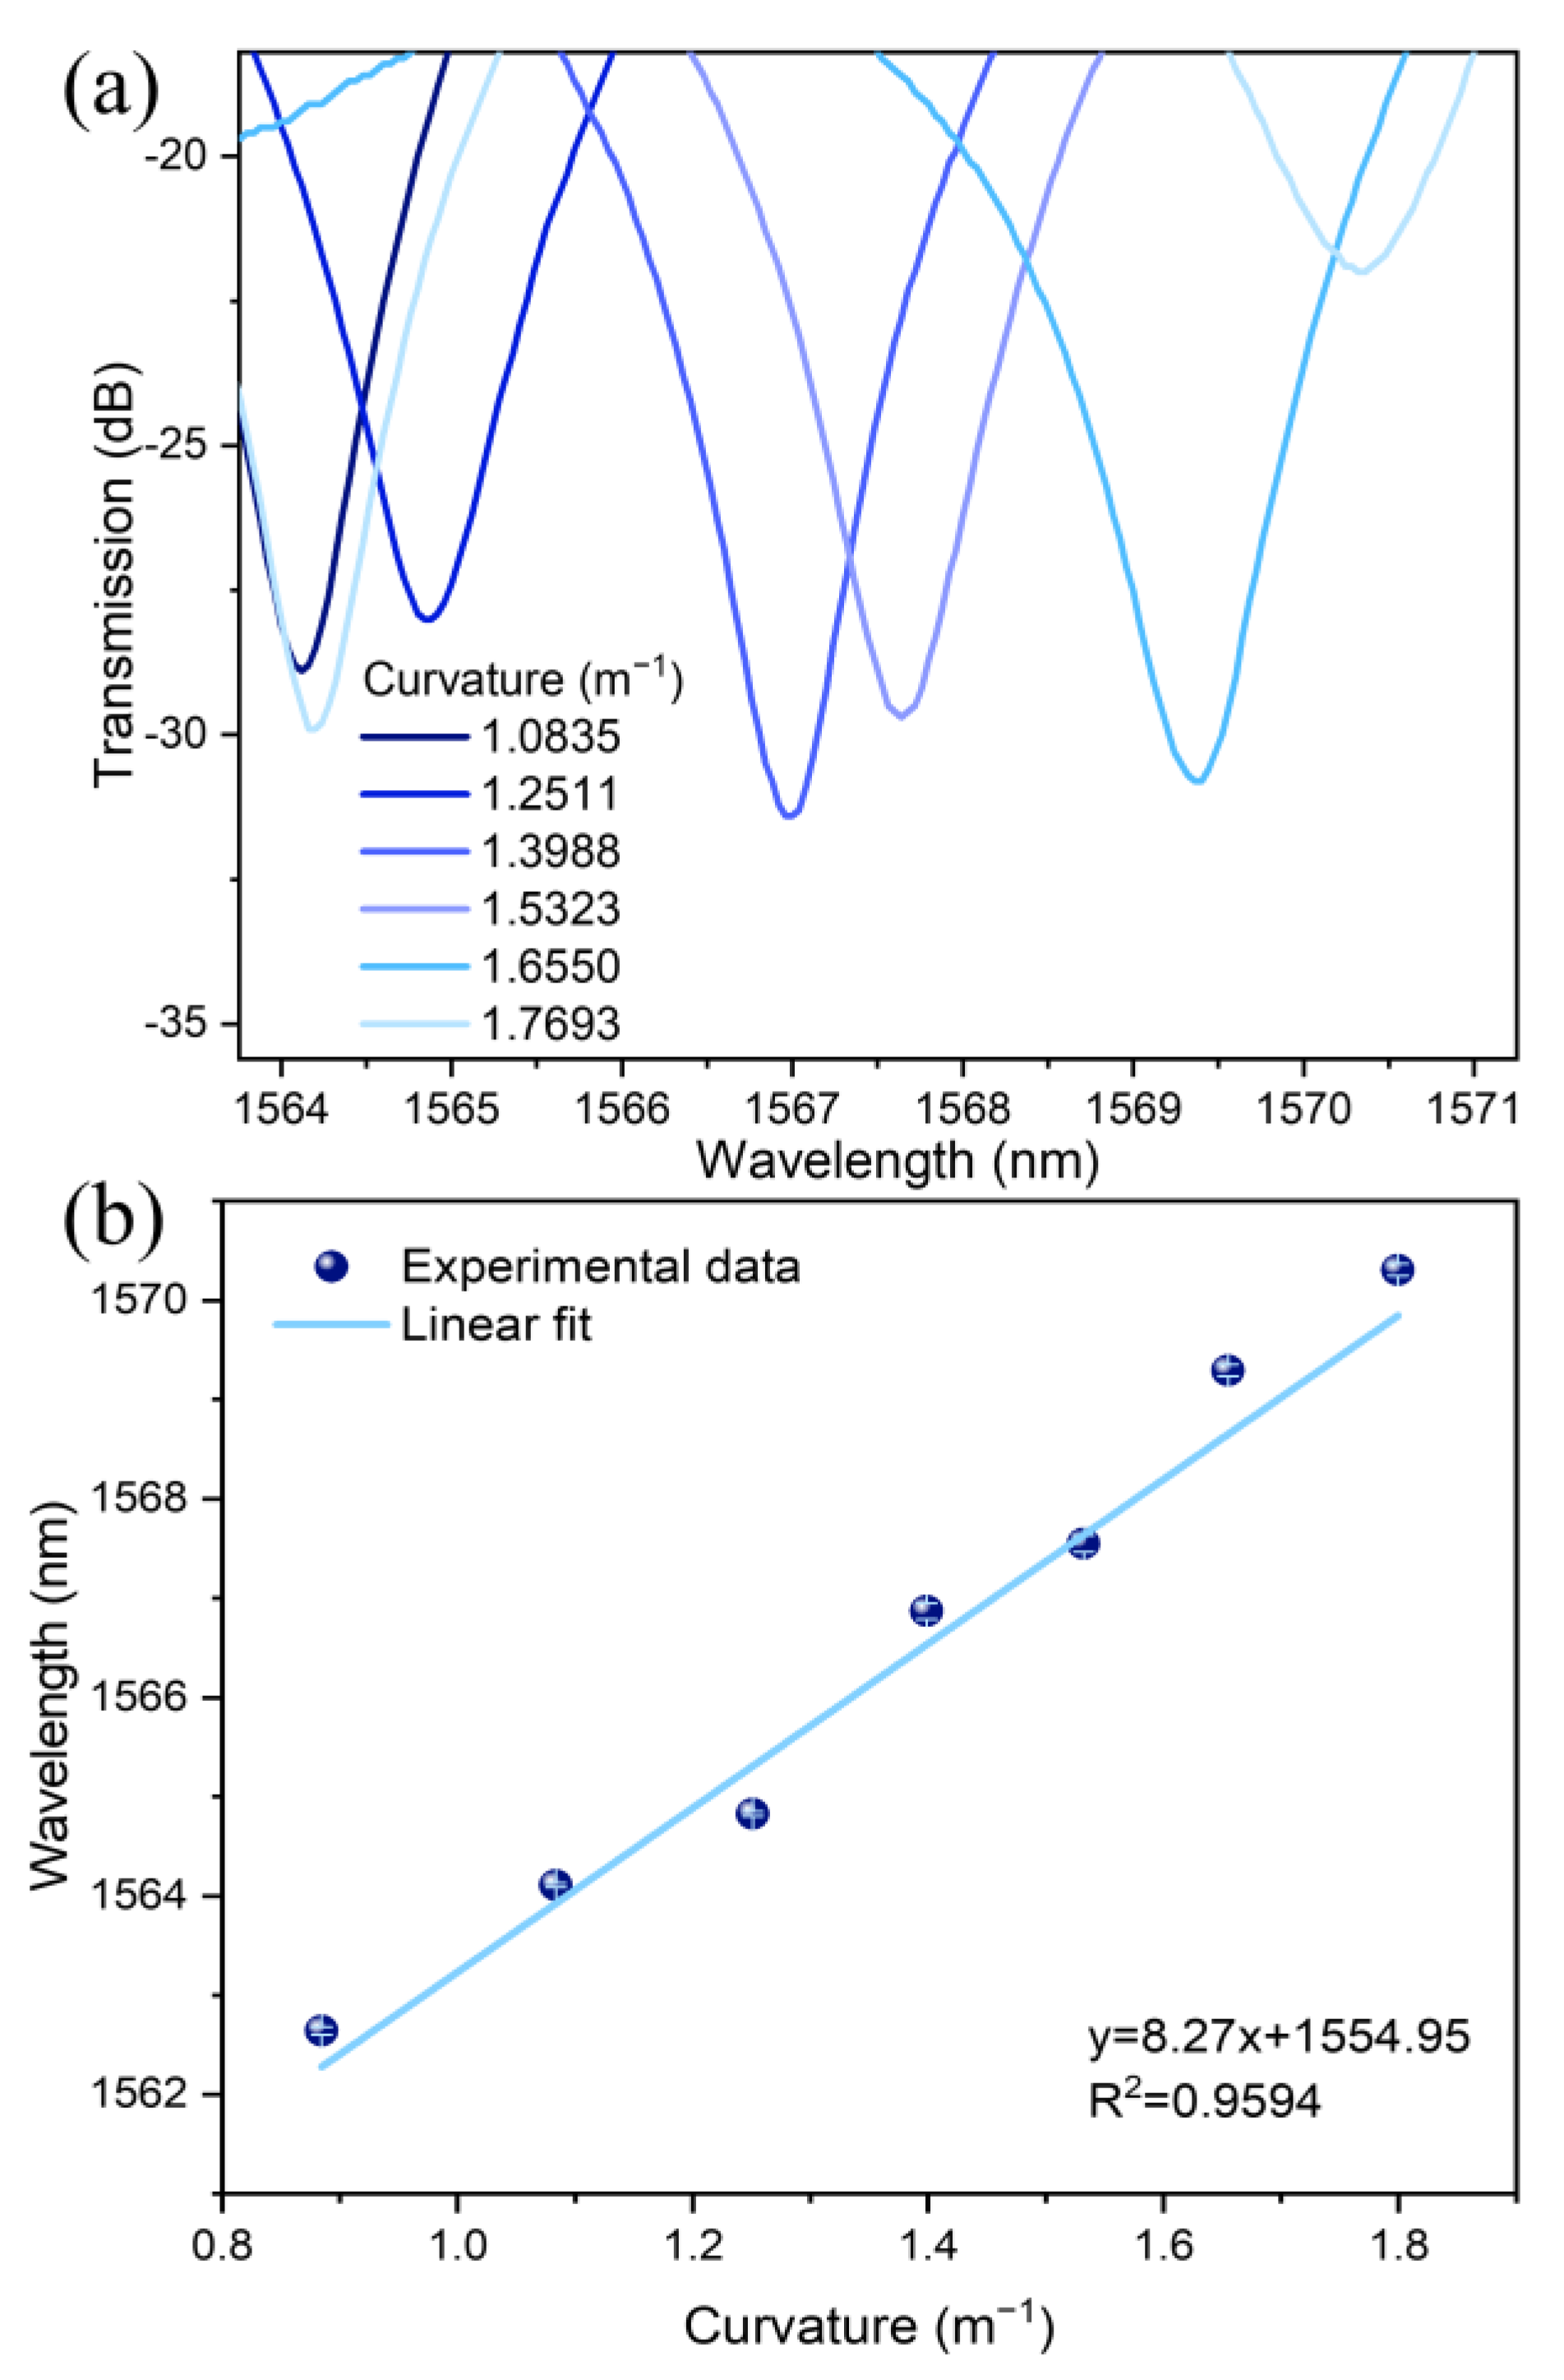
| 6.5 | 8.27 ± 0.76 | From 1.08 to 1.77 (0.69) | 0.95 |
| 7 | 7.13 ± 1.98 | From 0.88 to 1.39 (0.51) | 0.86 |
| Curvature without Polymer | Curvature with Polymer | |||
|---|---|---|---|---|
| Curvature (m−1) | The Central Wavelength of the Dip (nm) | Q-Factor | The Central wavelength of the Dip (nm) | Q-Factor |
| 1.0835 | 1544.76 | 3960.92 | 1564.12 | 3066.90 |
| 1.2511 | 1544.48 | 5148.27 | 1564.84 | 2301.24 |
| 1.3988 | 1544.16 | 4981.16 | 1566.96 | 2901.78 |
| 1.5323 | 1543.72 | 4540.35 | 1567.64 | 2449.44 |
| 1.655 | 1543.24 | 5511.57 | 1569.36 | 2414.40 |
| 1.7693 | 1542.68 | 1623.87 | 1570.36 | 1308.63 |
| Temperature without Polymer | Temperature with Polymer | |||
|---|---|---|---|---|
| Temperature (°C) | The Central Wavelength of the Dip (nm) | Q-Factor | The Central Wavelength of the Dip (nm) | Q-Factor |
| 20 | 1543.7 | 799.84 | 1568.36 | 780.28 |
| 35 | 1544.37 | 808.57 | 1569.52 | 1171.28 |
| 50 | 1545.08 | 908.87 | 1571.04 | 2182.00 |
| 65 | 1545.77 | 796.79 | 1571.56 | 2965.21 |
| 80 | 1546.73 | 761.94 | 1572.56 | 1512.08 |
| [#] | Structure | Sensitivity (nm/m−1) | Curvature Range (m−1) | Reference |
|---|---|---|---|---|
| 1 | SMF cascading abrupt tapers | −25.946 | From 6.38 to 7.98 (1.6) | [26] |
| 2 | MCO-LPFG | 0.1877 | From 1.775 to 3.436 (1.661) | [27] |
| 3 | LPGs in MCF | −4.85 | From 0 to 1.77 (1.77) | [28] |
| 4 | SMF-FCF-SMF with lateral offset | −18.75 | From 0.042 to 0.163 (0.121) | [29] |
| 5 | SMF-NCF-RCF-SMF | −3.68 | From 1.3856 to 3.6661 (2.28) | [30] |
| 6 | SMF-MMF-PCF-MMF-SMF | −1.03 | From 10 to 22.4 (12.4) | [31] |
| 7 | Our sensor (SMF-NZDSF-SMF) | 8.27 | From 1.08 to 1.77 (0.69) | --- |
Disclaimer/Publisher’s Note: The statements, opinions and data contained in all publications are solely those of the individual author(s) and contributor(s) and not of MDPI and/or the editor(s). MDPI and/or the editor(s) disclaim responsibility for any injury to people or property resulting from any ideas, methods, instructions or products referred to in the content. |
© 2024 by the authors. Licensee MDPI, Basel, Switzerland. This article is an open access article distributed under the terms and conditions of the Creative Commons Attribution (CC BY) license (https://creativecommons.org/licenses/by/4.0/).
Share and Cite
Martinez-Ramirez, L.G.; Hernández-Romano, I.; Guzmán-Cano, C.; Marrujo-García, S.; Fernandez-Jaramillo, A.A.; Estudillo-Ayala, J.M.; Rojas-Laguna, R.; Sierra-Hernandez, J.M. Experimental Demonstration to Enhance the Curvature Sensitivity of a Fiber Mach–Zehnder Interferometer Based on a Waist-Enlarged Technique Using Polymer. Photonics 2024, 11, 262. https://doi.org/10.3390/photonics11030262
Martinez-Ramirez LG, Hernández-Romano I, Guzmán-Cano C, Marrujo-García S, Fernandez-Jaramillo AA, Estudillo-Ayala JM, Rojas-Laguna R, Sierra-Hernandez JM. Experimental Demonstration to Enhance the Curvature Sensitivity of a Fiber Mach–Zehnder Interferometer Based on a Waist-Enlarged Technique Using Polymer. Photonics. 2024; 11(3):262. https://doi.org/10.3390/photonics11030262
Chicago/Turabian StyleMartinez-Ramirez, Laura G., Iván Hernández-Romano, Cipriano Guzmán-Cano, Sigifredo Marrujo-García, Arturo A. Fernandez-Jaramillo, Julian M. Estudillo-Ayala, Roberto Rojas-Laguna, and Juan M. Sierra-Hernandez. 2024. "Experimental Demonstration to Enhance the Curvature Sensitivity of a Fiber Mach–Zehnder Interferometer Based on a Waist-Enlarged Technique Using Polymer" Photonics 11, no. 3: 262. https://doi.org/10.3390/photonics11030262