Article

Enhanced XUV Harmonics Generation with an Intense Laser Field in the Overdriven Regime

Department of Physics, Shanghai Normal University, Shanghai 200234, China
*
Authors to whom correspondence should be addressed.
Photonics 2023, 10(9), 964; https://doi.org/10.3390/photonics10090964
Submission received: 3 July 2023 / Revised: 19 August 2023 / Accepted: 21 August 2023 / Published: 23 August 2023

Abstract

:
High-order harmonic generation with high photon flux has been a challenging task in strong-field physics. According to the high-order harmonic generation process, the essential requirements for achieving efficient harmonic radiations inside a gas medium are the improvement of the induced atomic dipole moment amplitude of the single-atom response in the microscopic and the phase matching of the high harmonics in the macroscopic medium. In this work, we demonstrated a feasible approach to enhance the extreme-ultraviolet harmonics in the plateau region by increasing the intensity of the driving laser while keeping the laser energy constant. The simulation results showed that by increasing the laser intensity to the overdriven regime, the average extreme-ultraviolet harmonics yield in the plateau region is approximately twice as high as that obtained optimally in the conventional loose focusing geometry scheme by utilizing a relatively low-intensity driving laser with the same laser energy. The quantitative analysis of the harmonics generation process in the macroscopic medium and the phase matching revealed that the observed enhancement in harmonics can be attributed to the amplification of the induced atomic dipole moment amplitude of the single-atom response in the high-intensity driving laser and the favorable transient phase matching in the overdriven regime. Furthermore, the investigation of the driving laser indicated that the favorable transient phase matching is caused by the spatiotemporal reshaping of the driving laser in the overdriven regime.

1. Introduction

High-order harmonic generation (HHG) resulting from the interaction of intense laser pulses with a gaseous medium has become a promising tabletop coherent attosecond light source spanning from the extreme-ultraviolet (XUV) to water window X-ray [1,2,3,4,5,6,7,8,9]. With such light sources, many ultrafast processes, such as ultrafast electronic dynamics inside atoms, time-resolved X-ray absorption fine structure spectroscopy, and nanoscale transient gratings excitation can be observed [10,11,12,13]. Usually, high photon flux HHG is essential for these applications. However, due to the low conversion efficiency in gas HHG, the photon flux of the high harmonics is still low to nJ-level in the water window [14]. According to the semiclassical three-step model [15], the cutoff photon energy of HHG is given by E c u t o f f = I p + 3.17 U p , where Ip is the ionization potential of the gas medium and U p I λ 2 denotes the pondermotive potential of the driving laser field. Here I and λ correspond to the intensity and wavelength of the driving laser, respectively. The feasible approaches to extend the HHG cutoff photon energy are to use long wavelength lasers or increase the laser intensity under certain conditions. However, the conversion efficiency of HHG from a single atom drops significantly with long wavelengths, e.g., λ ( 4 ~ 6 ) [16] and will be further reduced when taking the macroscopic propagation of the harmonics in the gas medium into consideration [17,18]. Although this unfavorable scaling law could be partially compensated by increasing the gas pressure of the gas medium [14,19,20], shorter wavelength lasers are still preferable for generating stronger HHG with high photon flux [21].
Therefore, increasing the driving laser intensity moderately is another feasible way to extend the cutoff photon energy of the HHG. Usually, in a weakly ionized gas medium, the driving laser intensity is low enough that the phase mismatch caused by the plasma dispersion can be compensated by neutral atom dispersion. This mechanism is referred to as the conventional phase matching and the corresponding ionization level is below a “critical” ionization fraction [19,22]. However, as the laser intensity increases, the gas medium would be ionized excessively and the plasma dispersion cannot be balanced by the neutral atom dispersion, which will cause a phase mismatch between the harmonics and the driving laser during the macroscopic propagation in the medium and prevent efficient buildup of the harmonic field [19,23]. Several quasi-phase matching methods [24], including the use of multiple gas jets [25], counterpropagating lasers [26], or a periodically modulating waveguide [27,28], have been proposed to overcome this conventional phase matching limit and enhance the HHG yield. However, these quasi-phase matching methods are complicated to implement experimentally and limited to relatively low harmonic order [24]. Recently, an alternative method was proposed to extend the phase matching condition in a high-intensity laser field [5,29,30,31]. This method takes advantage of laser defocusing in a strongly ionized gas medium and is commonly referred to as the overdriven regime [23]. In the ordinary regime, the presence of ionization-induced plasma always hinders the scaling of HHG towards higher cutoff photon energy, as the plasma defocusing leads to a decrease in intensity and a blueshift in the frequency of the driving laser pulses. However, in the overdriven regime, this large plasma dispersion can also cause a significant spatiotemporal reshaping of the driving laser pulses, resulting in a transient buildup of harmonics over a distance of a few hundred micrometers (μm) [14,32]. This propagation effect of the driving laser in the overdriven regime and the transient phase matching of the HHG can be exploited for the generation of isolated attosecond pulses [33,34] and for the optimization of HHG in the XUV region [29] up to the water window [5,31]. For instance, Johnson et al. obtained sub-pJ soft X-ray emissions experimentally in the water window region in the overdriven regime [5], where the ionization fraction in the phase matching region is around 1%, significantly higher than the “critical” level. Schötz et al. demonstrated in experiments the generation of isolated attosecond pulses with a pulse width of 323-as at 80 eV in the overdriven regime, where the ionization fraction was up to 50% [33]. In their studies, the optimized harmonics were found to be located near the cutoff region. However, as the driving laser intensity passes through the gas medium, it is strongly clamped due to the plasma defocusing, resulting in a transient phase matching that is restricted only to the entrance of the gas medium. As a result, the harmonic yield buildup near the cutoff region occurs rapidly at the entrance of the medium but then descends gradually along the propagation axis [32]. Meanwhile, as the gas pressure increases, the plasma defocusing in the overdriven regime also leads to a decrease in laser intensity and cutoff photon energy along the propagation axis [35].
In addition, both theoretical and experimental findings have demonstrated that by increasing the intensity of the driving laser, it is possible to not only extend the cutoff photon energy but also significantly enhance the harmonic yield in the plateau region [29,31,35,36]. However, the intensity of the driving laser in these studies was adjusted by attenuating laser energy using polarizers or by truncating the laser beam with an iris. Although the driving laser intensity can be precisely adjusted by a polarizer or iris in experiments, this implies that different laser intensities correspond to varying laser energy. Hence, the effects of the different laser intensities on the harmonic yield of the plateau region under the same laser energy have not been verified.
Therefore, different from the previous studies that focus on harmonic generation in the cutoff region, in this paper we present a theoretical study on the generation of XUV harmonics in the plateau region with different laser intensities while keeping the laser energy constant. In experiments, different laser intensities with the same laser energy can be achieved by using a focal mirror with different focal lengths. The optimal harmonic emission is extremely sensitive to the experimental parameters, such as laser field intensity and gas pressure [29]. Therefore, in this work, we investigated the HHG driven by different laser intensities at different gas pressures by changing the laser focal spot size while keeping the peak power constant and obtained the optimal XUV harmonics emission within the plateau region in the overdriven regime. The single-atom response in our numerical study is calculated by the strong field approximation (SFA) model, and the macroscopic propagation of the driving laser and harmonic fields is obtained by solving the three-dimensional Maxwell’s wave equations with the full electric field. Unlike the phase matching of the cutoff harmonics that occurred at the entrance of the gas medium [5,33], the phase matching of harmonics in the plateau region, as observed in our study, occurs in the second half of the gas medium. Furthermore, our findings revealed a gradual decrease in the phase mismatching of the XUV harmonics in the plateau region along the propagation axis in the overdriven regime, leading to a harmonic buildup over the entire gas medium. Therefore, by increasing the laser intensity to the overdriven regime, the average XUV harmonics yield in the plateau region is approximately twice as high as that obtained optimally in the conventional loose focusing geometry scheme by utilizing a relatively low-intensity driving laser with the same laser energy. This enhanced XUV harmonics in our study can be attributed to the enhancement of the single-atom response at an intense laser field and the transient phase matching of the harmonics caused by the spatiotemporal reshaping of the driving laser pulses in the overdriven regime.

2. Theoretical Methods

2.1. The Macroscopic Propagation of the Driving Laser and Harmonic Fields

In our numerical model, the single-atom response of the harmonic radiation is calculated using the SFA, or the so-called Lewenstein model [37]. This approach has been shown to provide good qualitative agreement with the numerical solution of the Schrödinger equation. The time-dependent induced nonlinear dipole moment due to a linearly polarized laser field is described as
D t = i 0 d τ π ϵ + i τ / 2 3 / 2 d x * ( p s t + A ( t ) ) g * ( t ) e x p [ i S ( p s t , t , τ ) ] × E t τ d x p s t + A t τ g t τ + c . c .
In Equation (1), E(t) is the electric field of the laser pulse, A(t) is its associated vector potential, ϵ is a positive regularization constant, pst and S are the stationary values of the momentum and quasi-classical action with the vector potential of the laser field, g (t) is the ground state amplitude calculated with the ADK theory [38], and dx is the dipole matrix element for bound-free transitions. It can be seen from Equation (1) that the dipole moment of the single atom is positively correlated with the laser electric field E(t), so the induced atomic dipole moment amplitude of the single-atom response can be enhanced by increasing the laser intensity, which contributes to the harmonic yield buildup.
In order to simulate the macroscopic effects of the harmonics generated in the gas medium, the propagation of the fundamental laser and harmonic fields should be considered, which can be described by Maxwell’s equations. The single-atom response is inserted as a source term into the wave equations of the fundamental and the harmonic fields, which are solved in cylindrical coordinates and assuming radial symmetry. The propagation of the fundamental driving laser and the harmonic field in a gas medium is described by [39,40,41]
2 E 1 r , z , t 1 c 2 2 E 1 r , z , t t 2 = μ 0 2 P i o n r , z , t t 2 ,
2 E h r , z , t 1 c 2 2 E h r , z , t t 2 = μ 0 2 P r , z , t t 2 ,
where the source term P i o n r , z , t in Equation (2) denotes the effective polarization of the driving field under the strong ionization, which includes neutral atomic dispersion, the Kerr effect, ionization, absorption of the ionized medium, and plasma defocusing. The source term P(r, z, t) of the harmonic fields in Equation (3) is related to the single-atom induced dipole moment in Equation (1) and depends upon the fundamental driving laser field E1(r, z, t). In the harmonic propagation equation, we have neglected the free-electron dispersion because the plasma frequency is much lower than the harmonics frequencies. Equations (2) and (3) can be solved by the Crank–Nicolson method in a moving coordinate frame ( z = z ,     t = t z / c ) [40].

2.2. Transient Phase Matching in the Overdriven Regime

The above theoretical model is sufficient to simulate the HHG in a macroscopic medium, while for a deeper insight into the underlying physical mechanism, the phase matching of the HHG should be investigated. Phase matching refers to the constructive accumulation of radiation from coherent sources along the beam propagation direction, which is not only composed of the wavevector mismatching between the fundamental field and harmonics but also involves the mismatching induced by the intrinsic phase of the HHG dipole moment. Since the HHG is an extremely nonlinear process, both the single-atom response and the macroscopic effects could cause the phase mismatching of the harmonics. Usually, the phase mismatching degree of the qth harmonic can be expressed as [42,43]
Δ k q = Δ k d + Δ k n + Δ k p + Δ k g .
Here Δ k n z , t = 2 π q P z 1 p z , t Δ n / λ and Δ k p z , t = P ( z ) N a t m p ( z , t ) r e λ ( q 2 1 ) / q are the phase mismatching due to the dispersion of the neutral atomic and free electrons, respectively, in which P(z) is the gas pressure, p(z, t) is the ionization probability, Δn is the refractive index difference per atmosphere between the qth harmonic and the drive laser with wavelength λ , and N a t m is the initial atomic number density per atmosphere. Δ k g z , t = q Φ g ( z , t ) / z is the phase mismatching arising from the Gouy phase shift Φ g z , t , resulting from the geometrical focusing of the drive laser beam. The Gouy focal phase variation in space for a specific time moment ti can be expressed by the argument of the driving laser field as Φ g r , z , t i = a r g [ E 1 ( r , z , t i ) ] , which can be directly extracted from the simulation. Lastly, in the overdriven regime, the intrinsic harmonic dipole phase mismatching induced by the intensity-dependent trajectories in single-atom response can be given by [32,33]
k d z , t = α i U p z , t / ω z = α i U p z , t ω z , t 1 I z , t I z , t z 3 ω z , t ω z , t z ,
which contains the effect of the blueshift and intensity variation on the dipole contribution, where U p z , t is the ponderomotive potential of the driving laser and α i is a photon energy-dependent coefficient that differs for long and short trajectories and can be obtained by the semiclassical three-step model or SFA model [33,43].

3. Results and Discussion

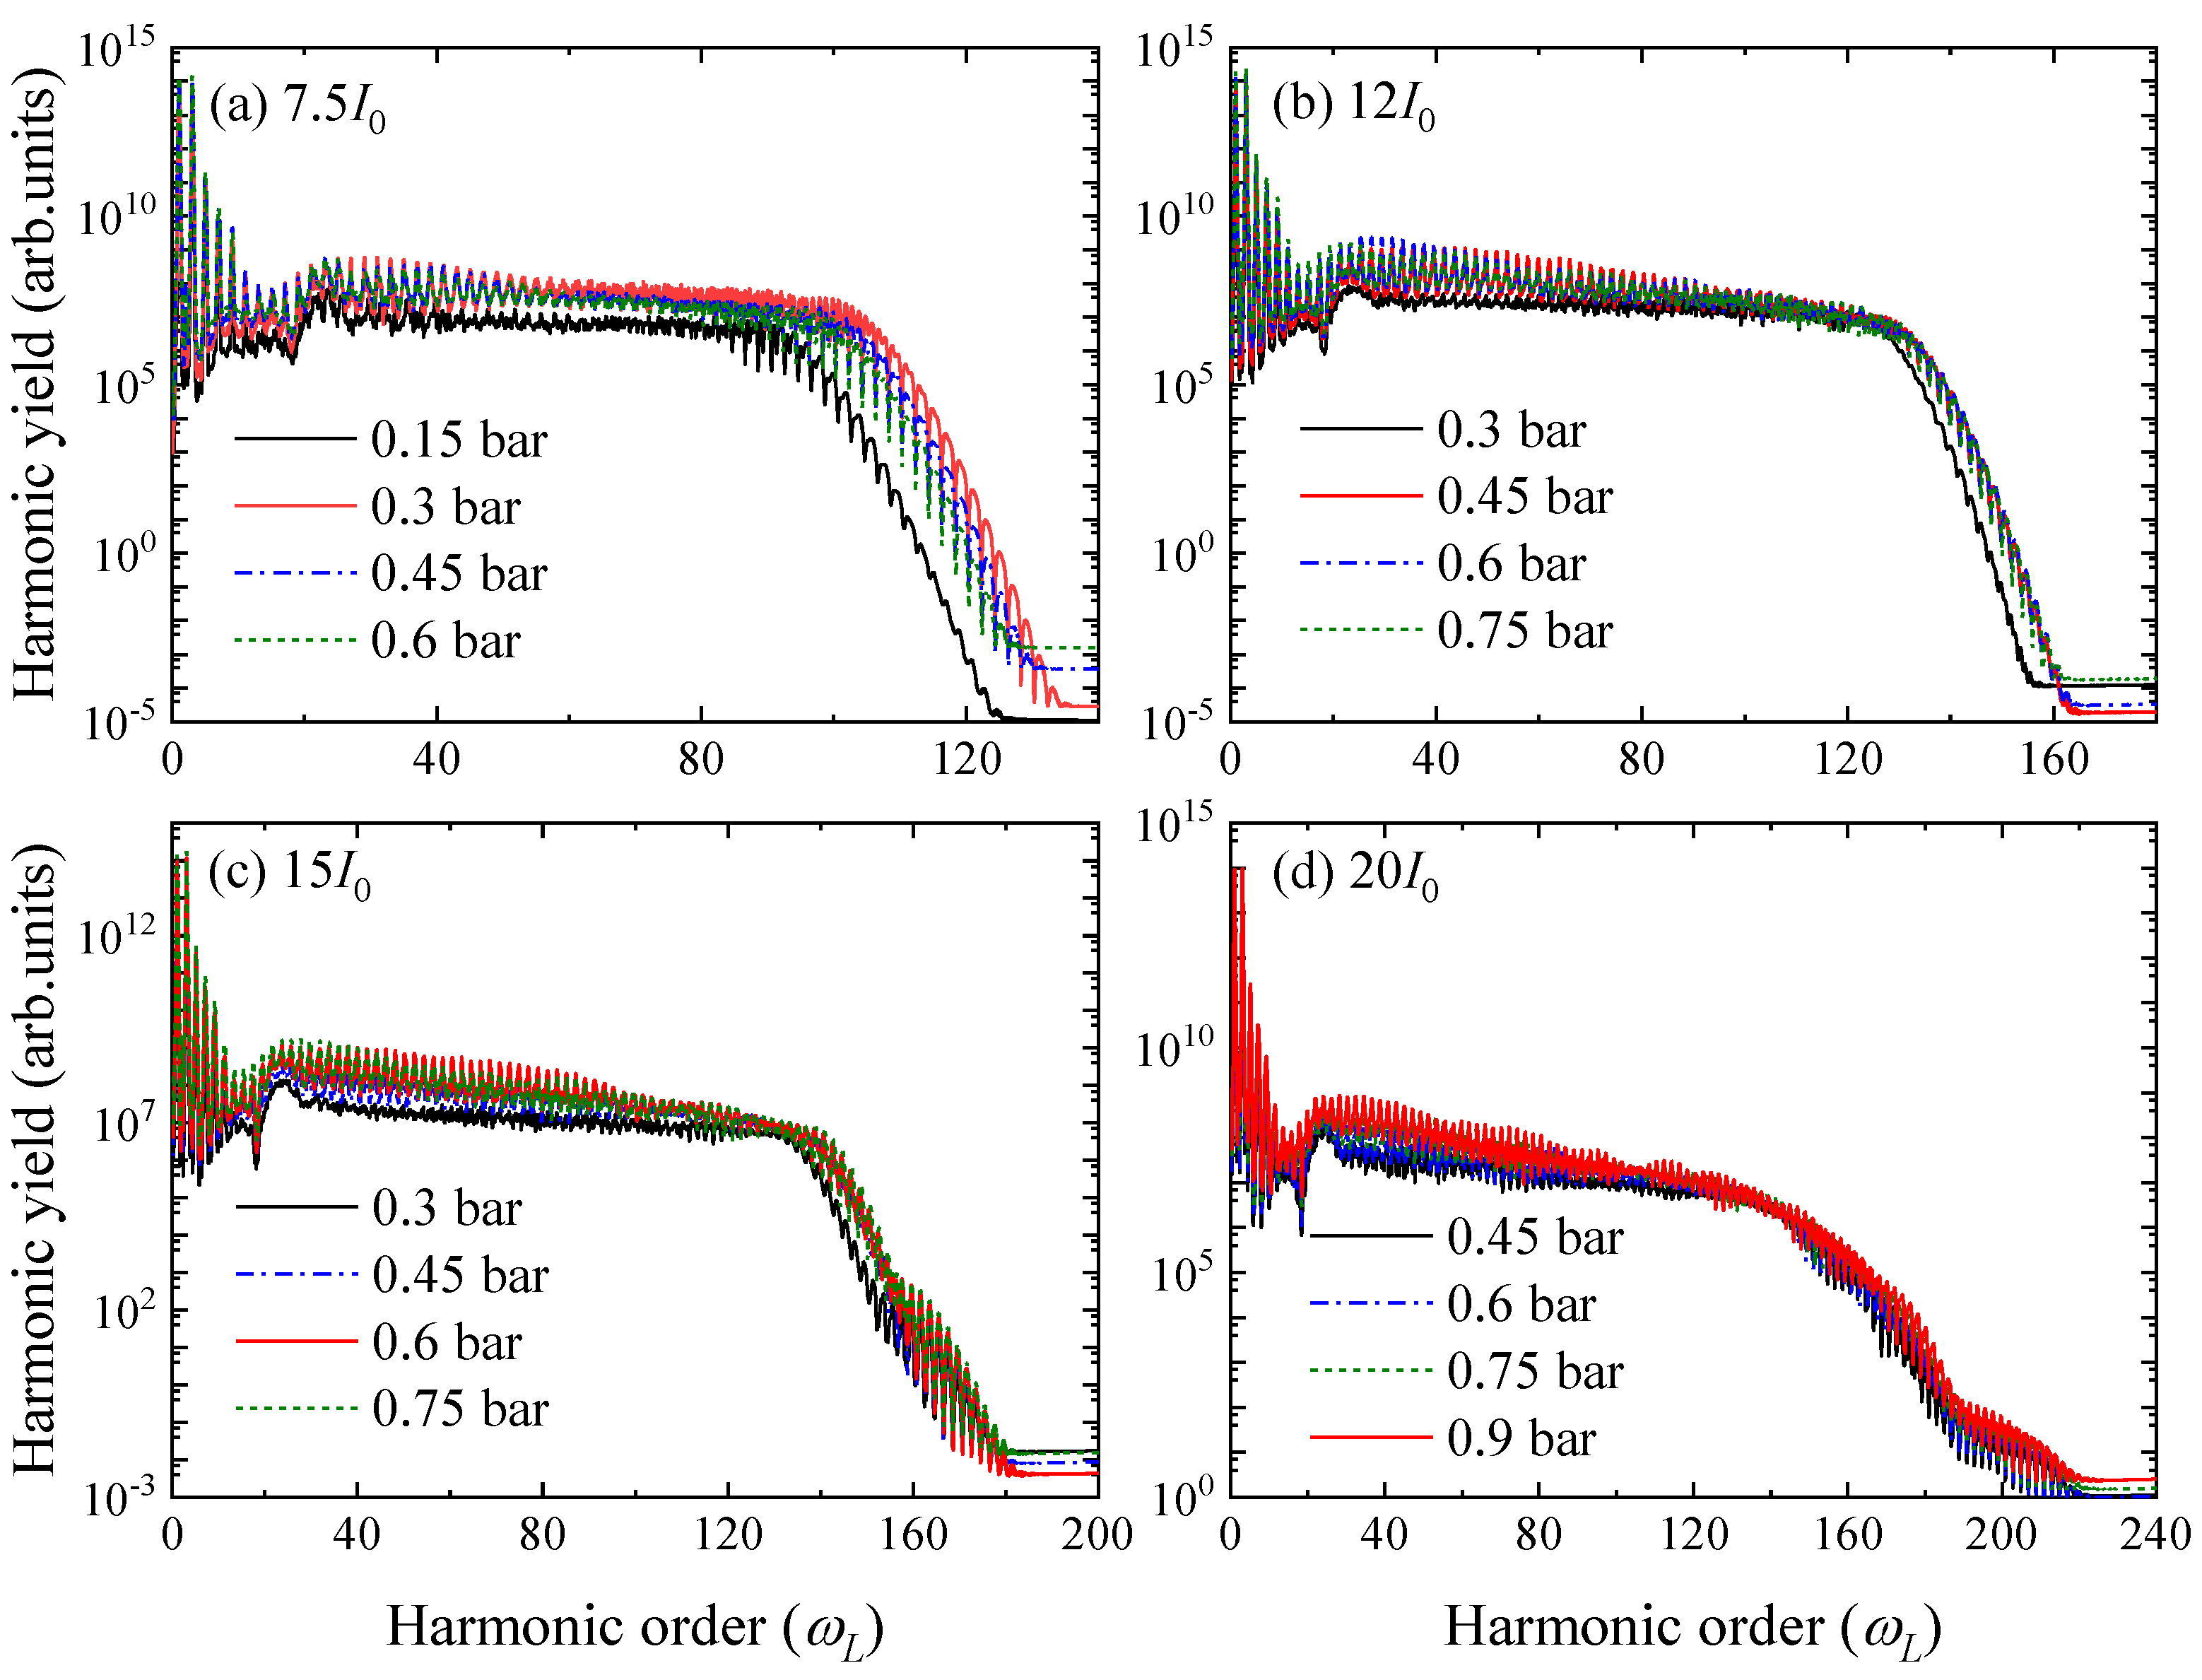
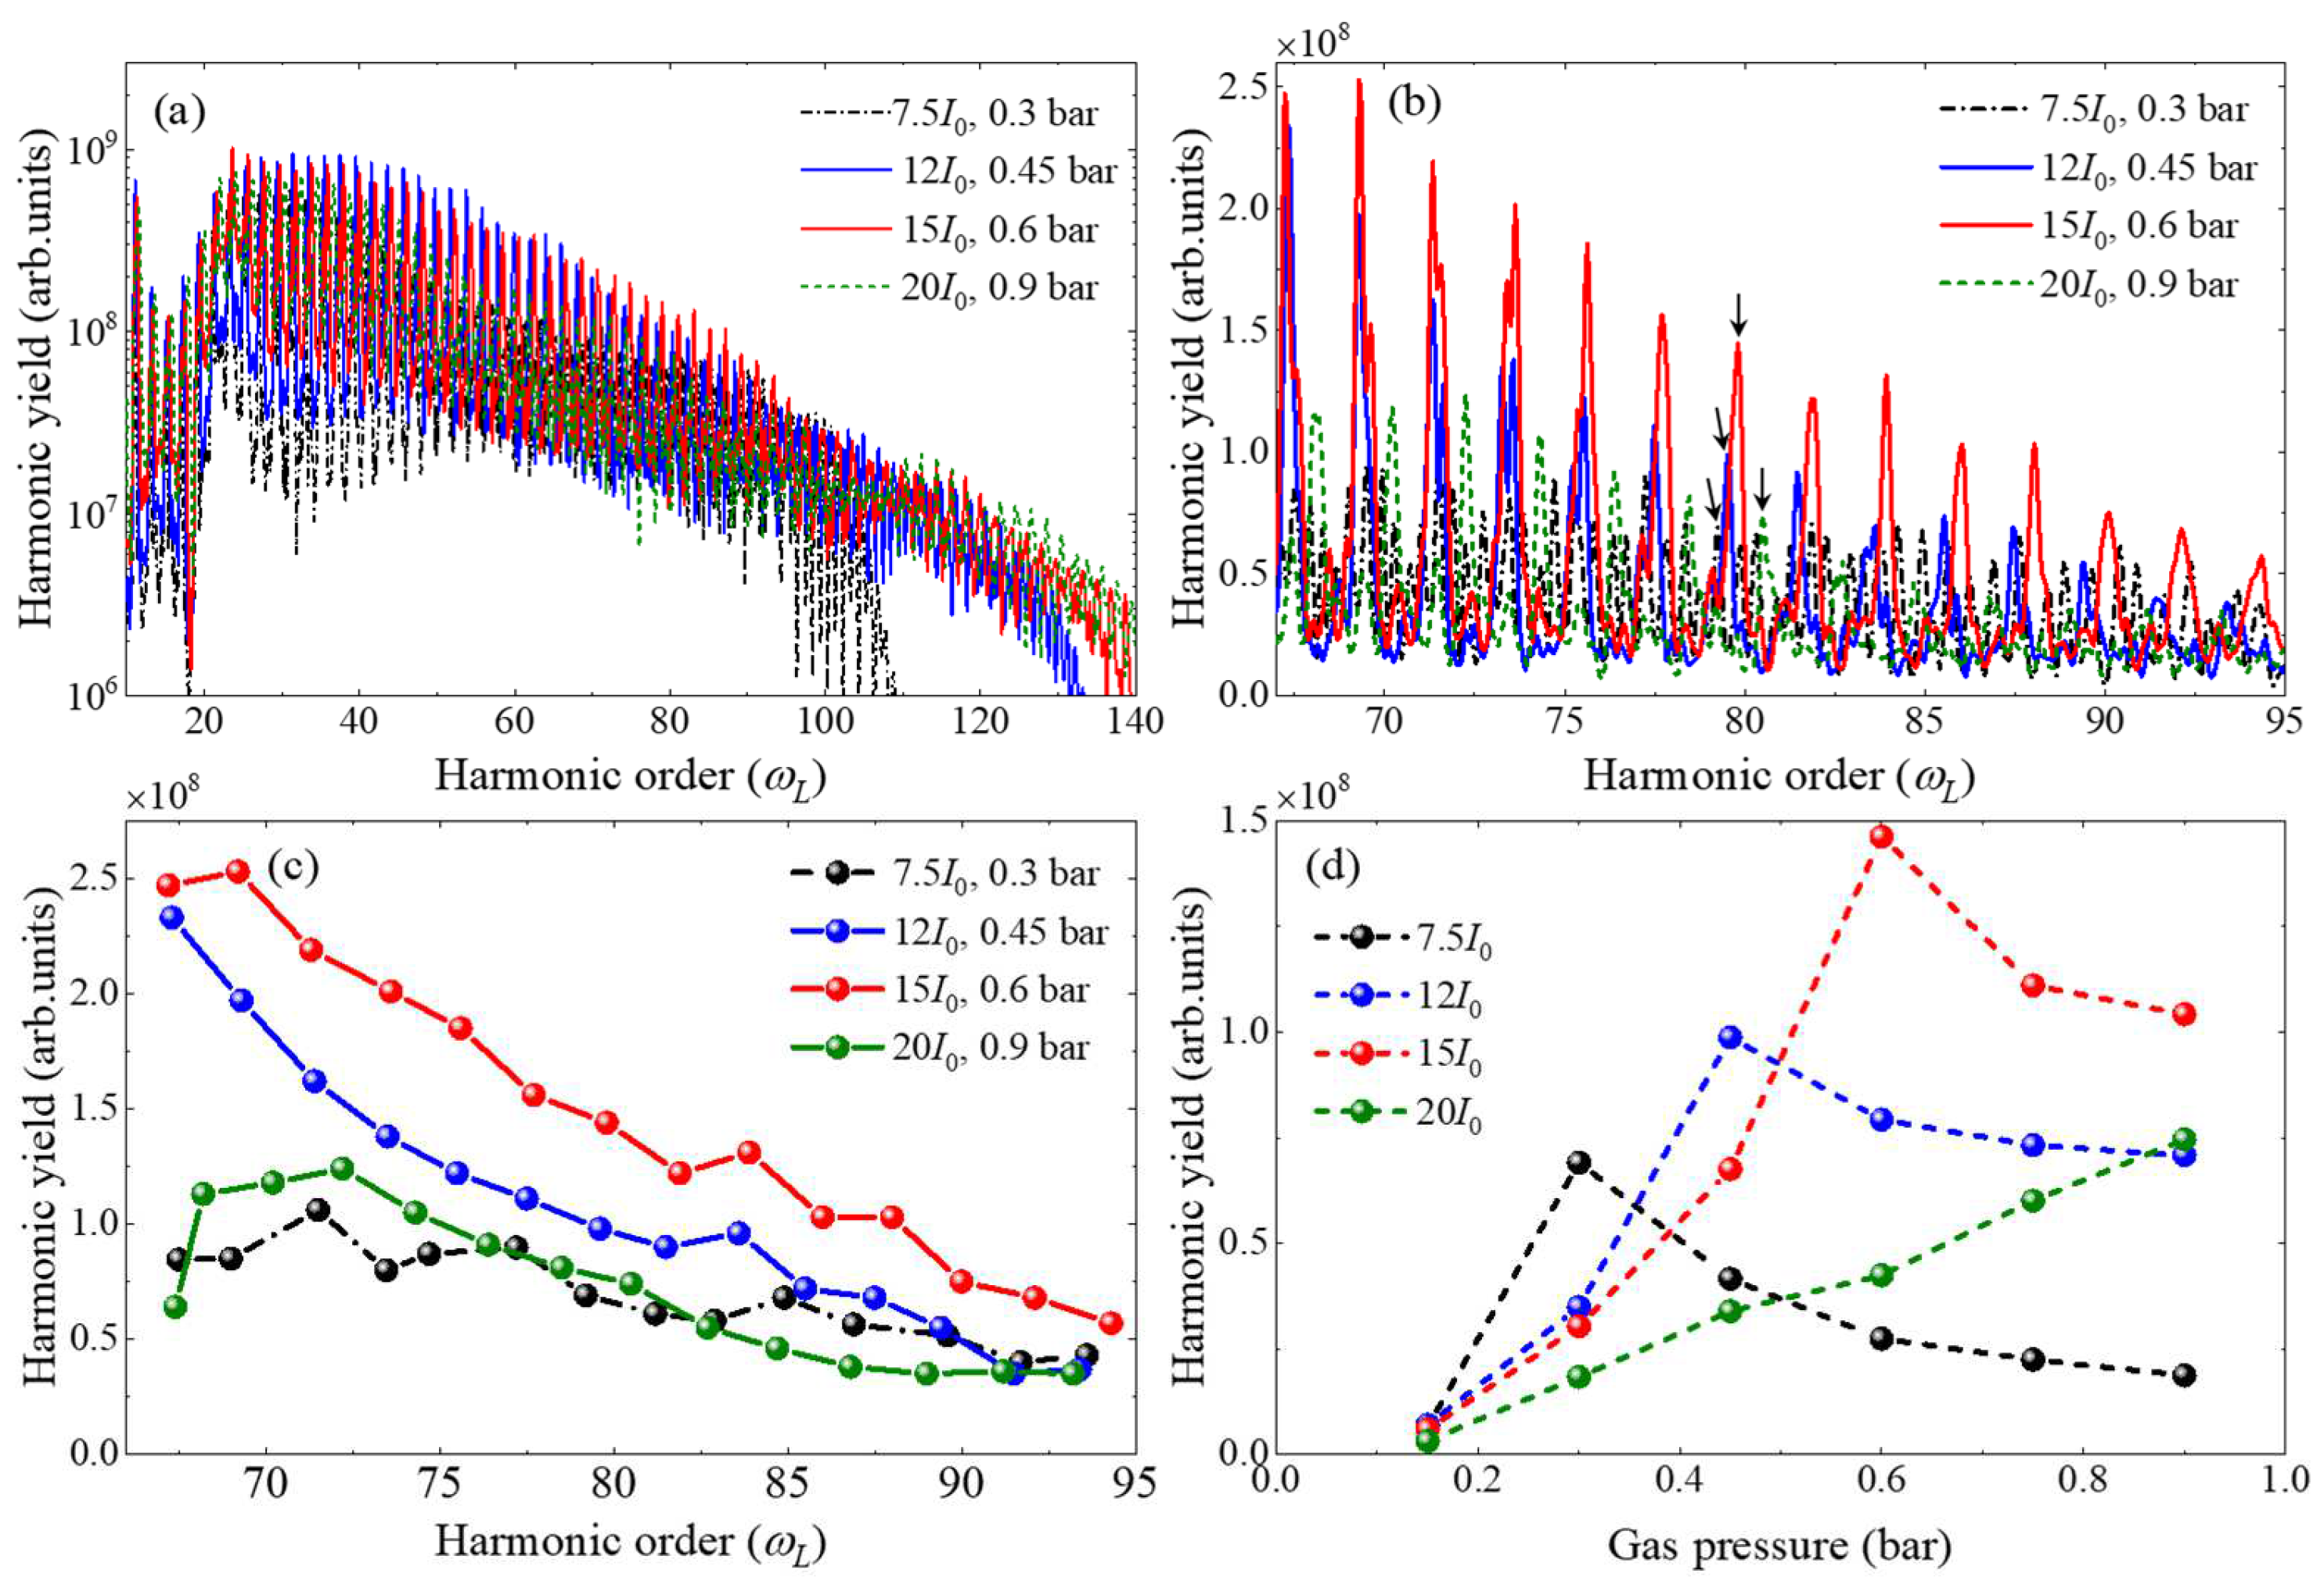
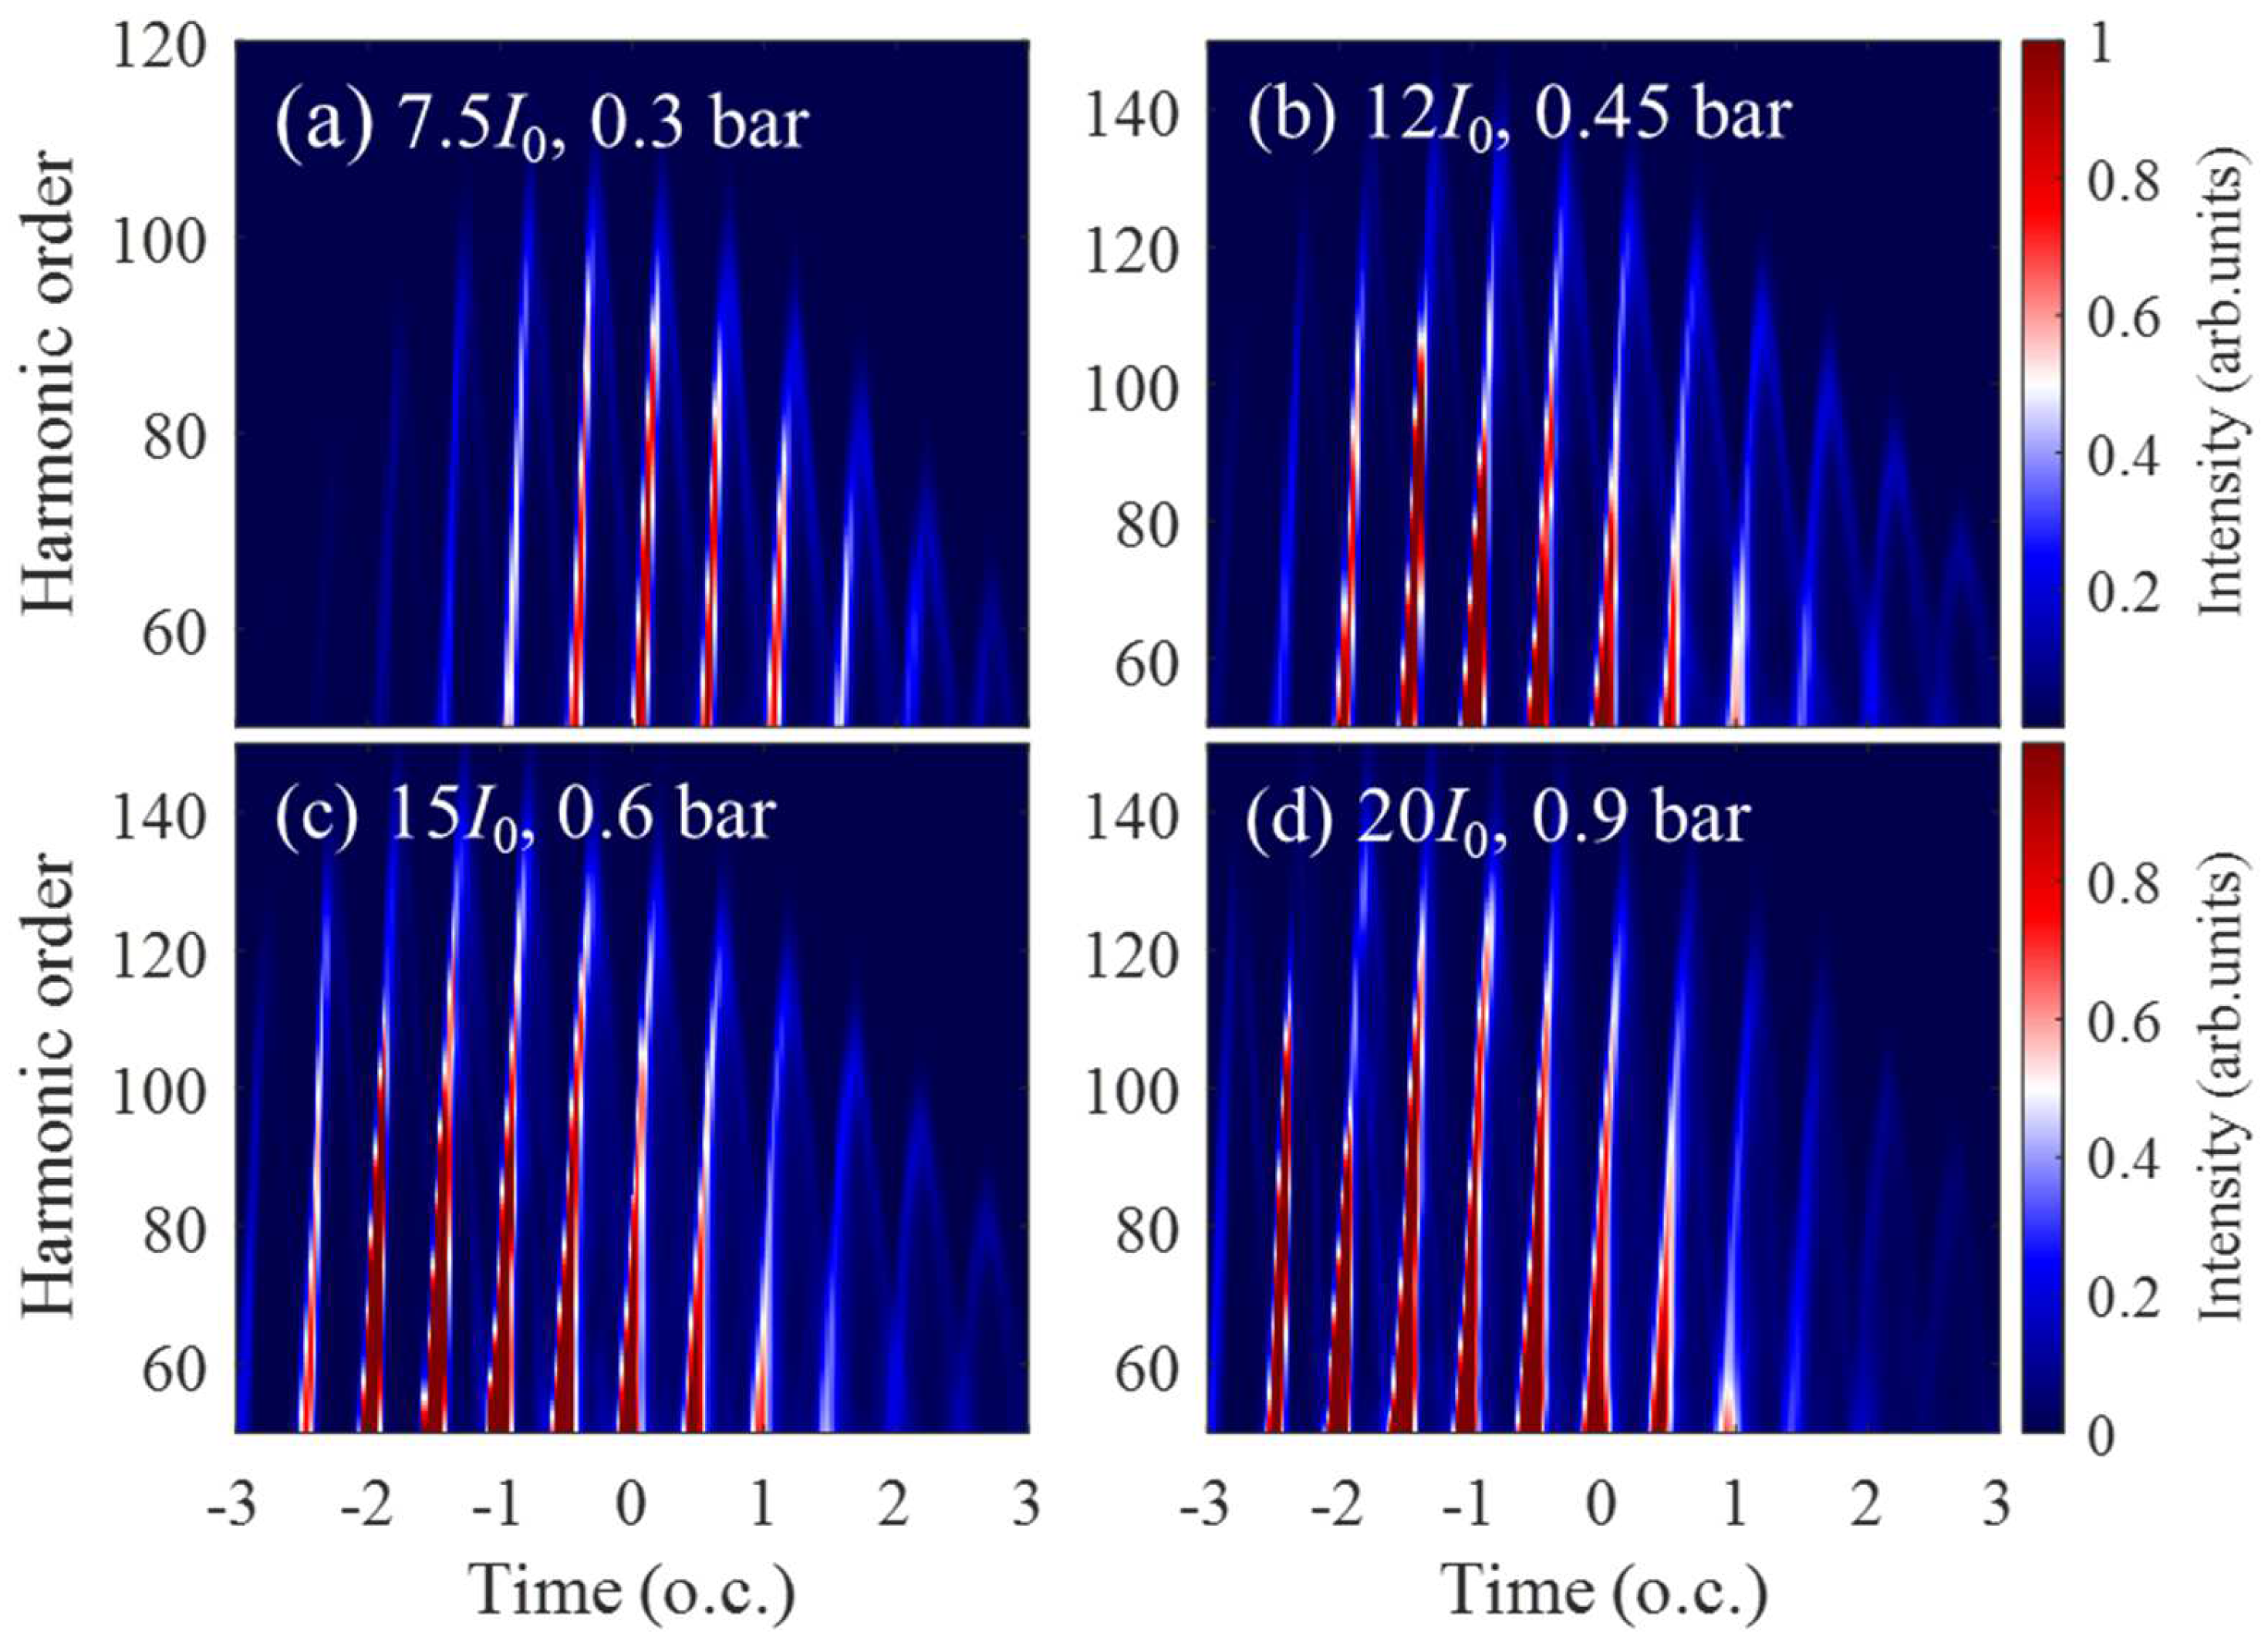
3.1. Effects of the Laser Intensity and Gas Pressure on the HHG

In our simulations, we adopt an 800 nm laser field with a pulse energy of about 0.36 mJ and a pulse duration of 15 fs. The peak laser intensity was changed by using different focal beam waists in simulations. The peak laser intensities used in our simulations are approximately 7.5 × 10¹⁴ W/cm2 (7.5 I0), 1.2 × 10¹⁵ W/cm2 (12 I0), 1.5 × 10¹⁵ W/cm2 (15 I0), and 2.0 × 10¹⁵ W/cm2 (20 I0), which corresponds to the laser beam waists of 45 μm, 36 μm, 32 μm, and 28 μm, respectively. The laser pulse is focused at the center of the helium (He) gas target with a Gaussian gas pressure distribution, and the medium length in each kind of laser intensity is chosen to be equal to the Rayleigh length (z0) of each beam waist, which is about 8 mm, 5 mm, 4 mm, and 3 mm, respectively. To optimize harmonic yields in the overdriven regime, the gas pressure was varied. Figure 1a–d showed the simulated macroscopic HHG spectra of He atoms driven by the four kinds of laser intensities at different gas pressures. The harmonic yields are collected in the whole exit plane of the gas medium. For each laser intensity, one can see that with an increase in gas pressure, the harmonic yields in the plateau are progressively increased and the harmonic cutoff energy is slightly decreased [35,44]. Therefore, an optimal pressure for each kind of laser intensity can be achieved to reach the best balance between the harmonic yield and plateau spectral range. The optimal pressures for the four driving laser intensities are approximately 0.3 bar, 0.45 bar, 0.6 bar, and 0.9 bar, respectively.
In order to investigate the effect of the laser intensity on the HHG, we summarized the optimal HHG spectrum in each kind of laser intensity, as shown in Figure 2a. On the one hand, it is evident that as the laser intensity increases gradually to 1.5 × 10¹⁵ W/cm2, not only does the harmonic cutoff energy is greatly extended, but there is also a notable enhancement in the harmonic yields within the plateau region. On the other hand, when the laser intensity increases from 1.5 × 10¹⁵ W/cm2 to 2.0 × 10¹⁵ W/cm2, despite the continued extension of the harmonic cutoff energy, there is a reduction in the harmonic yields within the plateau region. It can be seen from Figure 2a that by moderately increasing the driving laser intensity and gas pressure, the harmonic yields within the whole plateau region of the low-intensity case (7.5 × 10¹⁴ W/cm2) can be significantly enhanced. In addition, the optimal laser intensity and gas pressure, which correspond to the highest harmonic yield, vary across different harmonic orders. By striking a balance between yield enhancement and harmonic orders, the optimal laser intensity and gas pressure in our simulations are determined to be 1.5 × 10¹⁵ W/cm2 and gas pressure is 0.6 bar, respectively, which corresponds to the highest harmonic yield in the plateau region ranging from H65 to H95, as shown in Figure 2a. Figure 2b,c showed the detailed harmonic spectrum and corresponding harmonic yields of H65 to H95 driven by the four different laser intensities. With the increase in harmonic order, the growth factor of harmonic yield gradually diminishes. The average harmonic yield between H65 and H95, driven by the laser intensity of 1.5 × 10¹⁵ W/cm2, is approximately twice as high as that driven by the laser intensity of 7.5 × 10¹⁴ W/cm2 with the same laser energy. In order to quantitatively investigate the effects of different laser intensities at different gas pressures on the harmonics within the plateau region, the yield of a single harmonic order was analyzed in our simulations. The selected harmonic orders driven by the four laser intensities are shown by the arrow in Figure 2b, which was located around H80. These specific harmonic orders were selected because they are situated at the center of H65 to H95, and their corresponding harmonic yields closely approximate the average value. Additionally, the selected harmonic orders were not exactly the same due to the blueshift of the spectrum during macroscopic propagation [45,46,47]. Hence, for the convenience of description, we uniformly refer to them as H80 in this paper. The yield of H80 in the plateau region driven by different laser intensities at different gas pressures is shown in Figure 2d. One can see that for each laser intensity, there is an optimal gas pressure that maximizes the harmonic yield, and the optimal gas pressure increases with the laser intensity. In addition, it was observed that increasing the laser intensity can also significantly enhance the harmonic yield, even at the same gas pressure, except for the low gas pressures (<0.4 bar). The maximum yield of H80 is approximately 1.5 × 10⁸ with the laser intensity of 1.5 × 10¹⁵ W/cm2, which is approximately twice as high as that obtained optimally in the laser intensity of 7.5 × 10¹⁴ W/cm2 with the same laser energy. Therefore, by moderately increasing the laser intensity, not only can the harmonic cutoff energy be extended, but there will also be a notable enhancement in the harmonic yields within the plateau region. To verify the accuracy of our model, we have compared the single-atom HHG at each driving laser intensity calculated based on the SFA theory and numerical solution of the time-dependent Schrödinger equation (TDSE), respectively (see Supplementary Materials).
In order to understand the laser intensity and gas pressure dependence obtained from the simulation shown in Figure 2, we revisited the harmonics generation process in the macroscopic medium with a one-dimensional (1D) model. For the qth harmonic, the instantaneous intensity generated at the exit of the medium, Iq, can be expressed as [48,49]
I q 0 L m e d ρ ( z ) 1 η z D q I z e x p L m e d z 2 L a b s ( z ) e x p i φ q ( z ) d z 2
Here, Lmed is the length of the medium, z is the propagation coordinate, η(z) is the ionization probability, ρ ( z ) is the initial atomic number density. L a b s z = 1 / σ q ρ ( z ) is the absorption length, in which σ q is the absorption cross-section of the qth harmonic [50]. φ q ( z ) is the accumulated phase difference between the driving laser and the generated qth harmonic field at the exit of the medium, and D q is the induced atomic dipole moment amplitude of the single-atom response in Equation (1), which is positively correlated with the laser intensity I(z). It can be seen from Equation (6) that, the qth harmonic intensity is positively correlated with the gas pressure and driving laser intensity, but negatively correlated with the ionization probability. In addition, the accumulated phase difference φ q ( z ) of the qth harmonic is also dependent on the gas pressure and laser intensity. Therefore, the HHG intensity can be optimized by changing the laser intensity and the gas pressure.
In order to investigate the dependence of the HHG intensity on the laser intensity and the gas pressure, we numerically integrated Equation (1) over the propagation distance for each laser intensity. The results are shown in Figure 3. Here, we have neglected the φ q ( z ) dependence ( φ q z   = 0) on the harmonic intensity for simplicity. Figure 3a,b showed the typical evolution of the on-axis laser intensity and ionization probability in the gas medium. One can see that the laser intensity decreased rapidly along the propagation distance due to the nonlinear propagation effects, such as spatial diffraction, material dispersion, nonlinear self-focusing, ionization, plasma defocusing, and so on, which lead to the spatial reshaping of the driving laser. Moreover, as the initial laser intensity increases, there is a faster decrease in laser intensity, resulting in the more pronounced spatial reshaping of the driving laser. The maximum ionization probabilities at the four laser intensities are about 0.75%, 5.5%, 13%, and 40%, respectively, which is much higher than the “critical” ionization probability in the conventional phase matching. The envelope of the shadow in Figure 3a (dark blue line) denotes the Gaussian gas pressure distribution used in the simulations. By inserting the laser intensity and ionization probability evolution in Figure 3a,b into Equation (6), the integrated intensity of H80 for different gas pressures at the four laser intensities is shown in Figure 3c. It can be seen that the evolution of the harmonic intensity calculated by Equation (6) for different gas pressures at the four laser intensities is similar to the results obtained in Figure 2d. Therefore, the harmonic intensity dependence on the gas pressure and laser intensity in Figure 2d and Figure 3c can be explained by the balance between the induced atomic dipole moment amplitude, ionization probability, gas pressure, and absorption length. On the one hand, as the laser intensity increases, the induced atomic dipole moment amplitude D q of the single-atom response can be enhanced, which contributed to the increase in the HHG intensity. However, the ionization probability η(z) also increases with the laser intensity, which hinders the increase of the HHG intensity. Therefore, there exists an optimal intensity that makes the HHG intensity maximum for a certain gas pressure, as shown in Figure 2d and Figure 3c. On the other hand, the atomic number density ρ ( z ) increases with the gas pressure, a high gas pressure contributes to generating the HHG with high intensity. However, the absorption length L a b s is inversely proportional to the gas pressure, a high gas pressure corresponds to a short absorption length, which can also impede the increase of the HHG intensity. Therefore, there also exists an optimal gas pressure that makes the HHG intensity maximum for a certain laser intensity, as shown in Figure 2d and Figure 3c. This dependence of the gas pressure and laser intensity on the HHG intensity shown in Figure 2d and Figure 3c exhibits similarity to the findings reported in previous studies [48,51].
Finally, it is worth noting that the optimal gas pressures in each laser intensity in Figure 3c are much higher than that obtained in Figure 2d, and this can be attributed to the phase matching. The results in Figure 3c neglected the influence of the phase mismatching of the qth harmonic, which is typically significant at high gas pressure and high laser intensity. However, the results in Figure 2d are obtained by fully solving the harmonic propagation Equation (2), which intrinsically contains the phase mismatching of the harmonics. In addition, the optimal laser intensity to maximize the HHG intensity in Figure 3c is 1.2 × 10¹⁵ W/cm2, which is different from the optimal intensity (1.5 × 10¹⁵ W/cm2) in Figure 2. This difference in optimal intensity can also be attributed to phase matching, particularly in the overdriven regime. Therefore, the dynamic phase matching conditions will be investigated in the following.

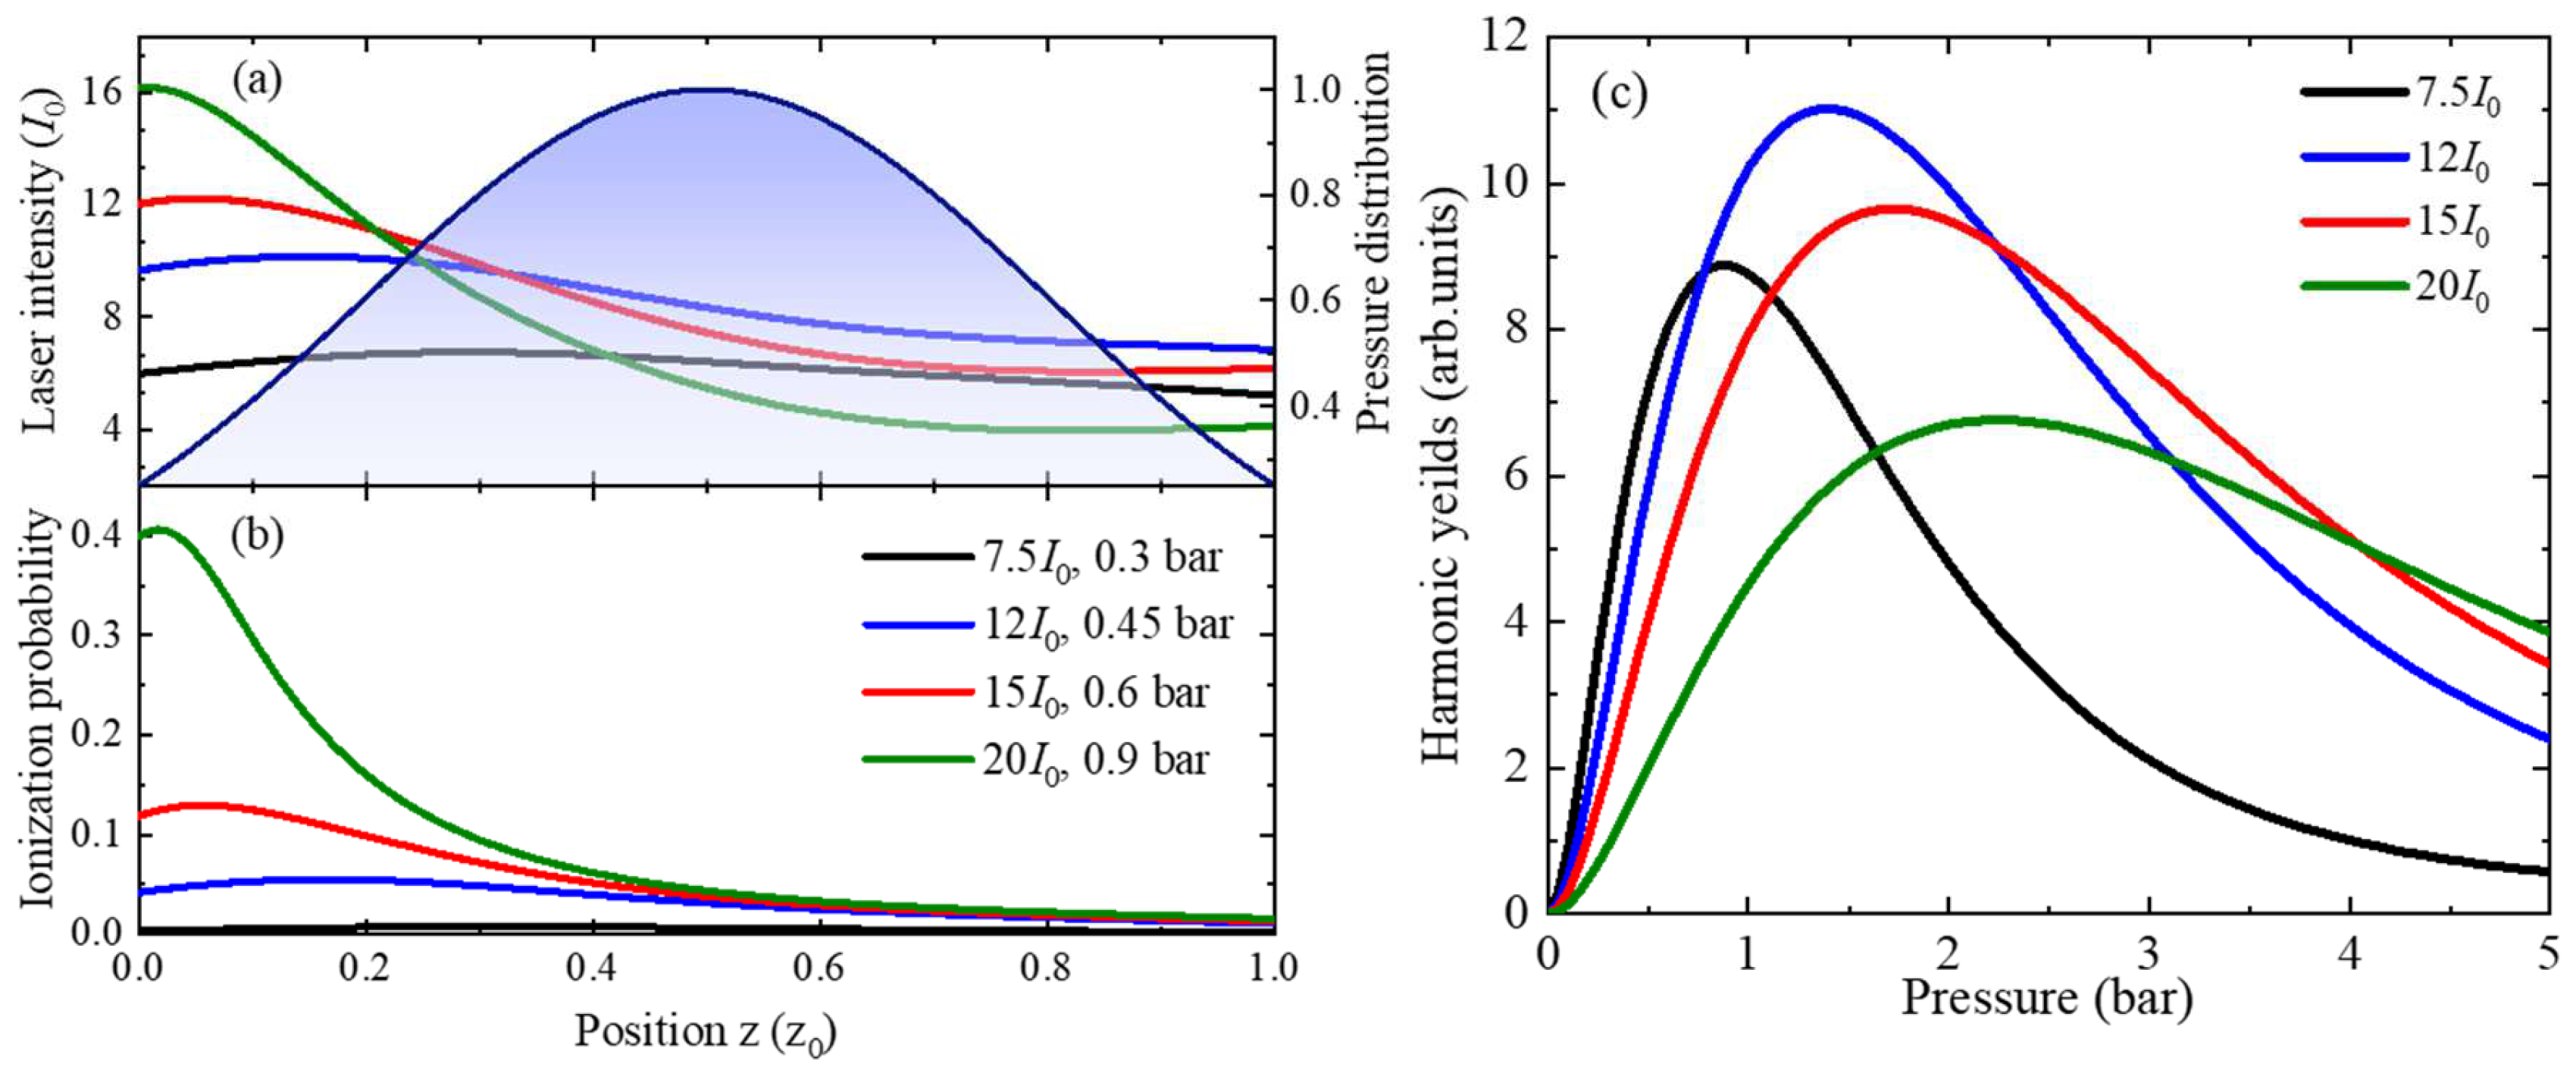
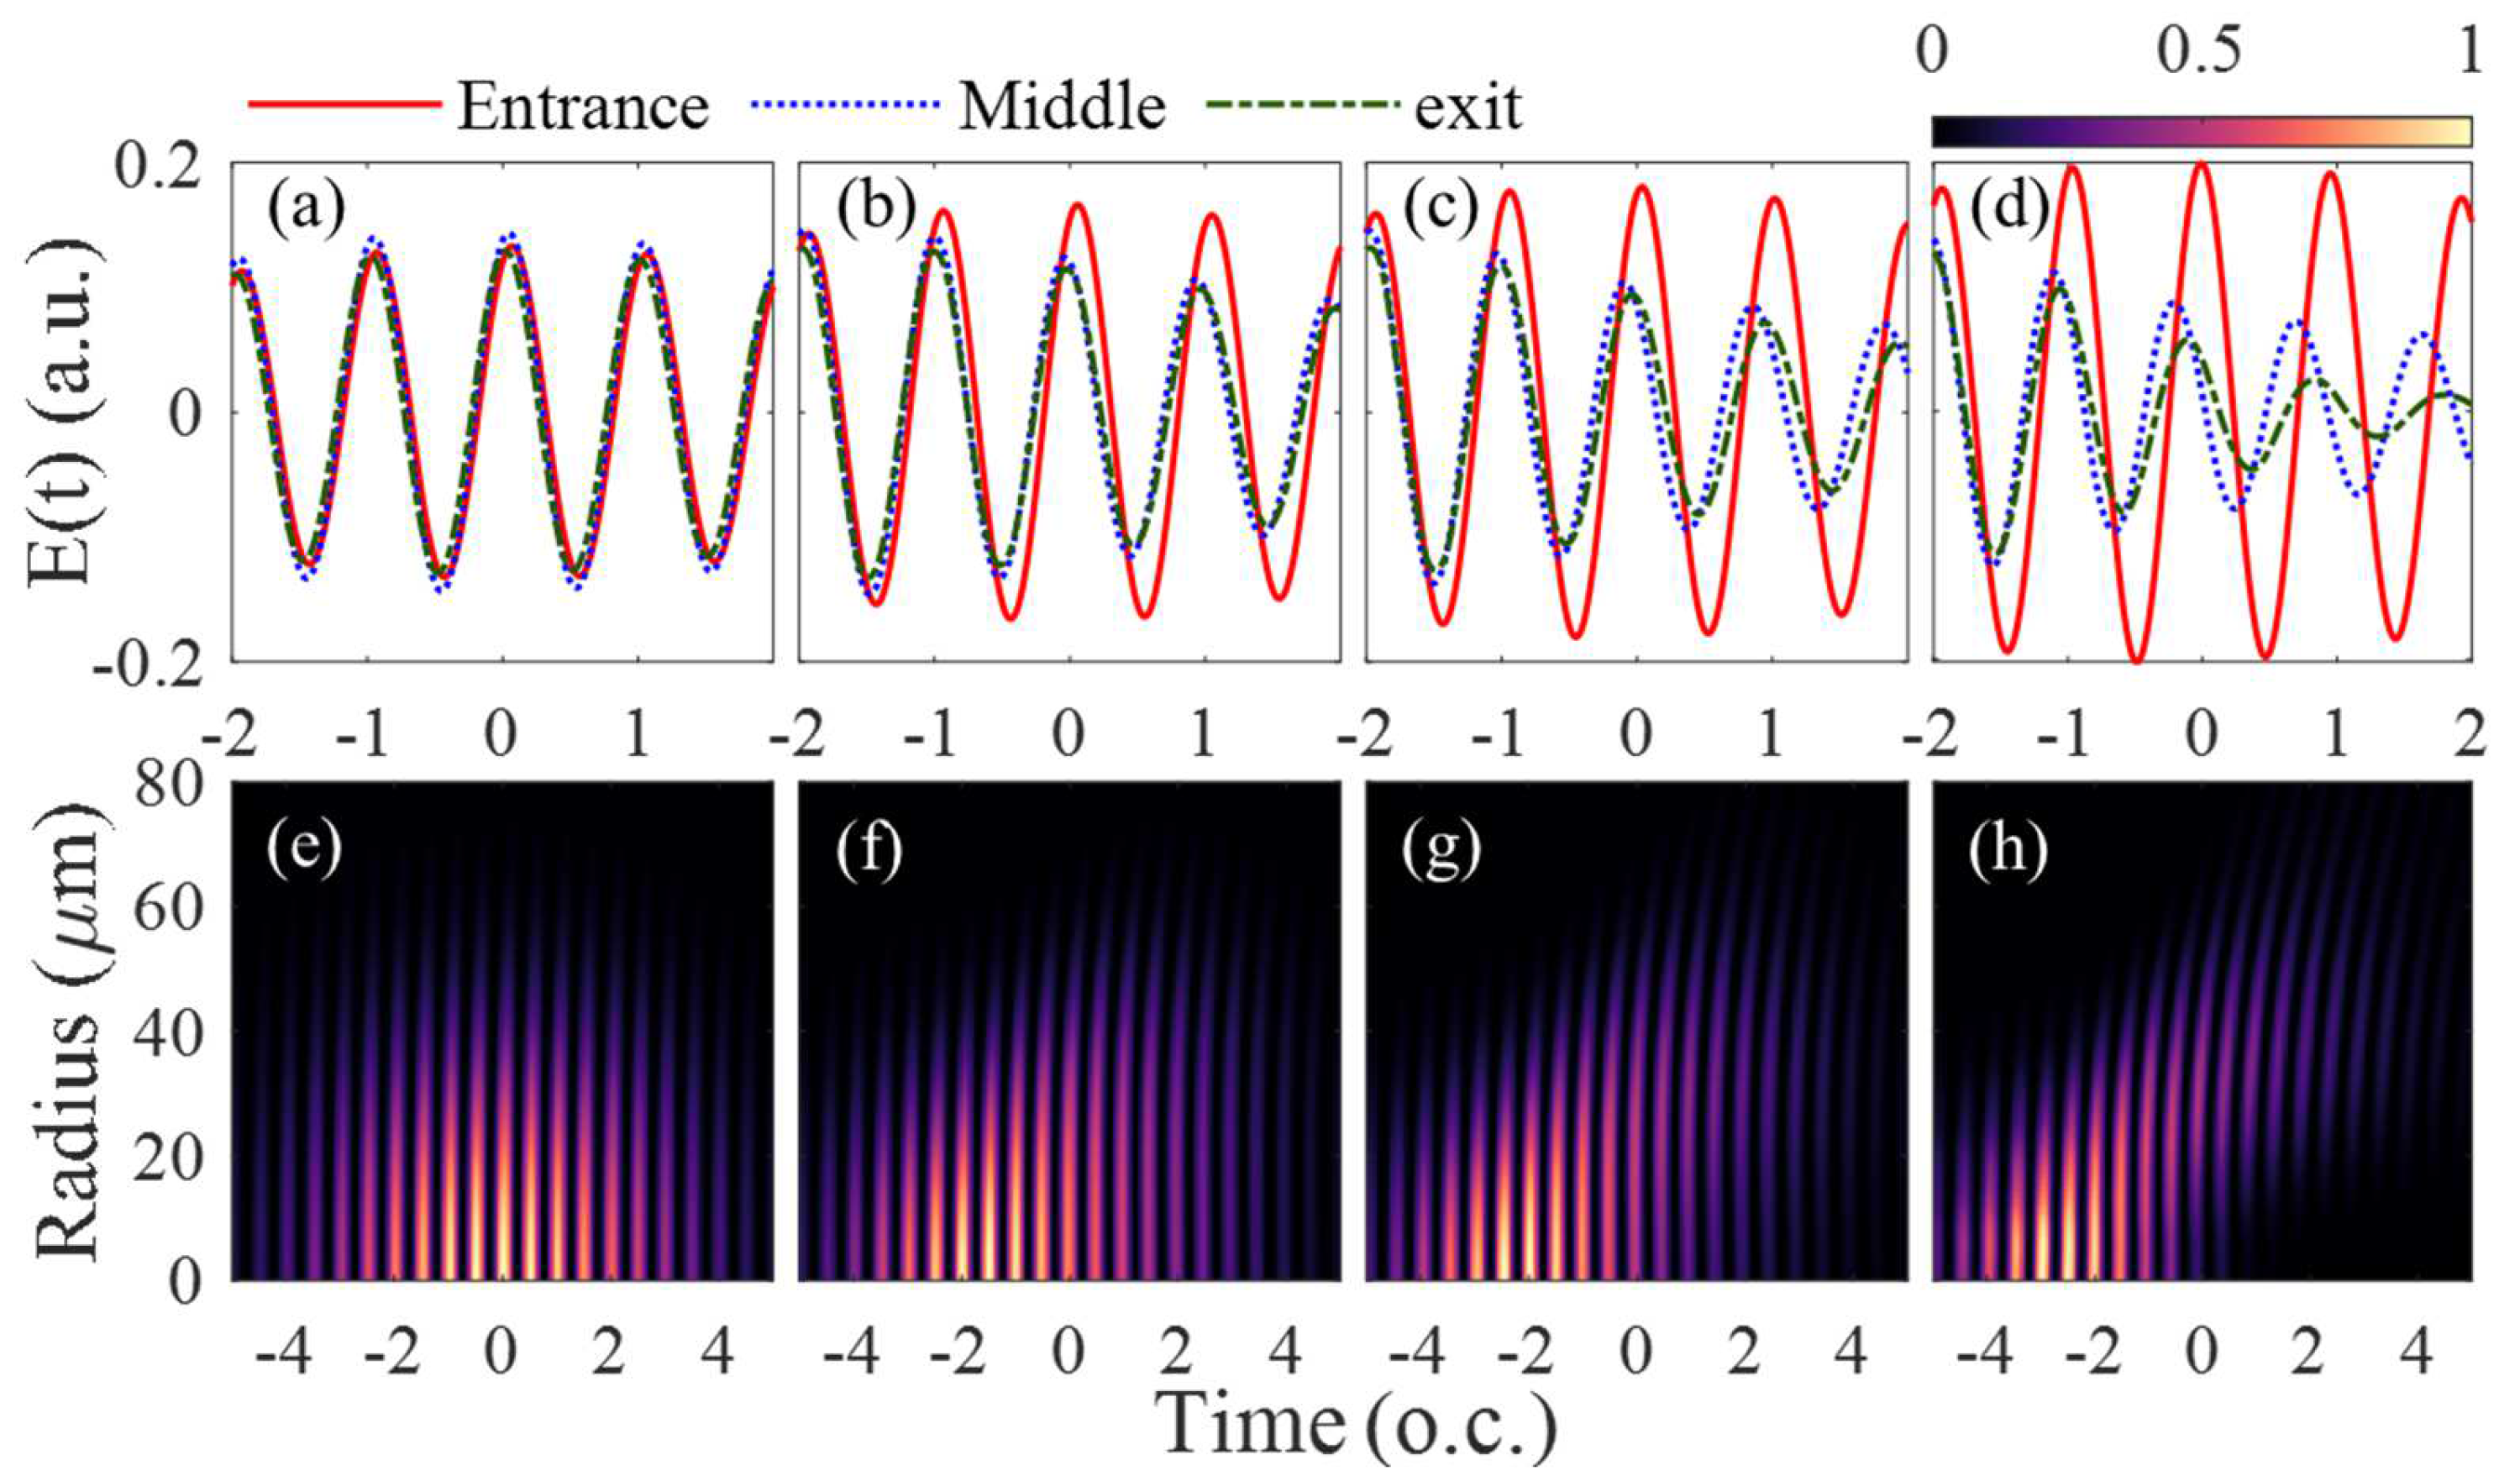
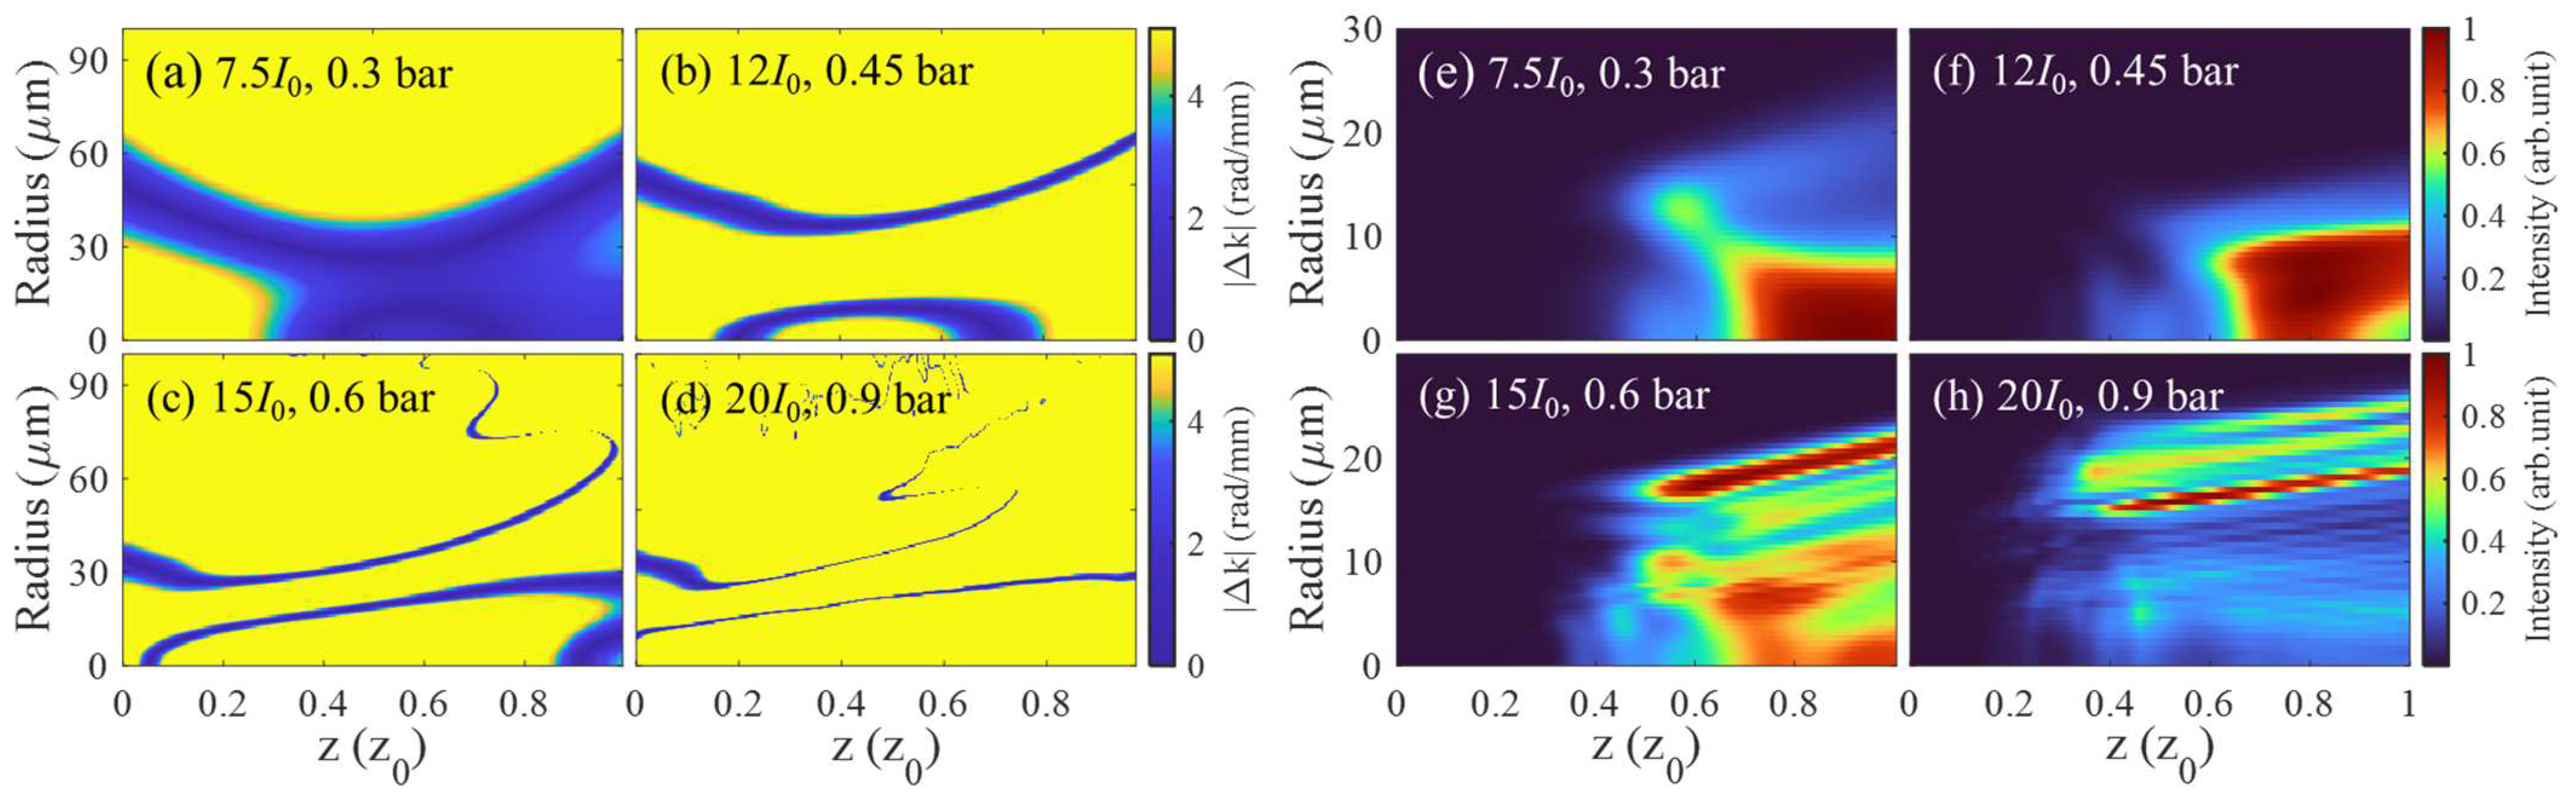
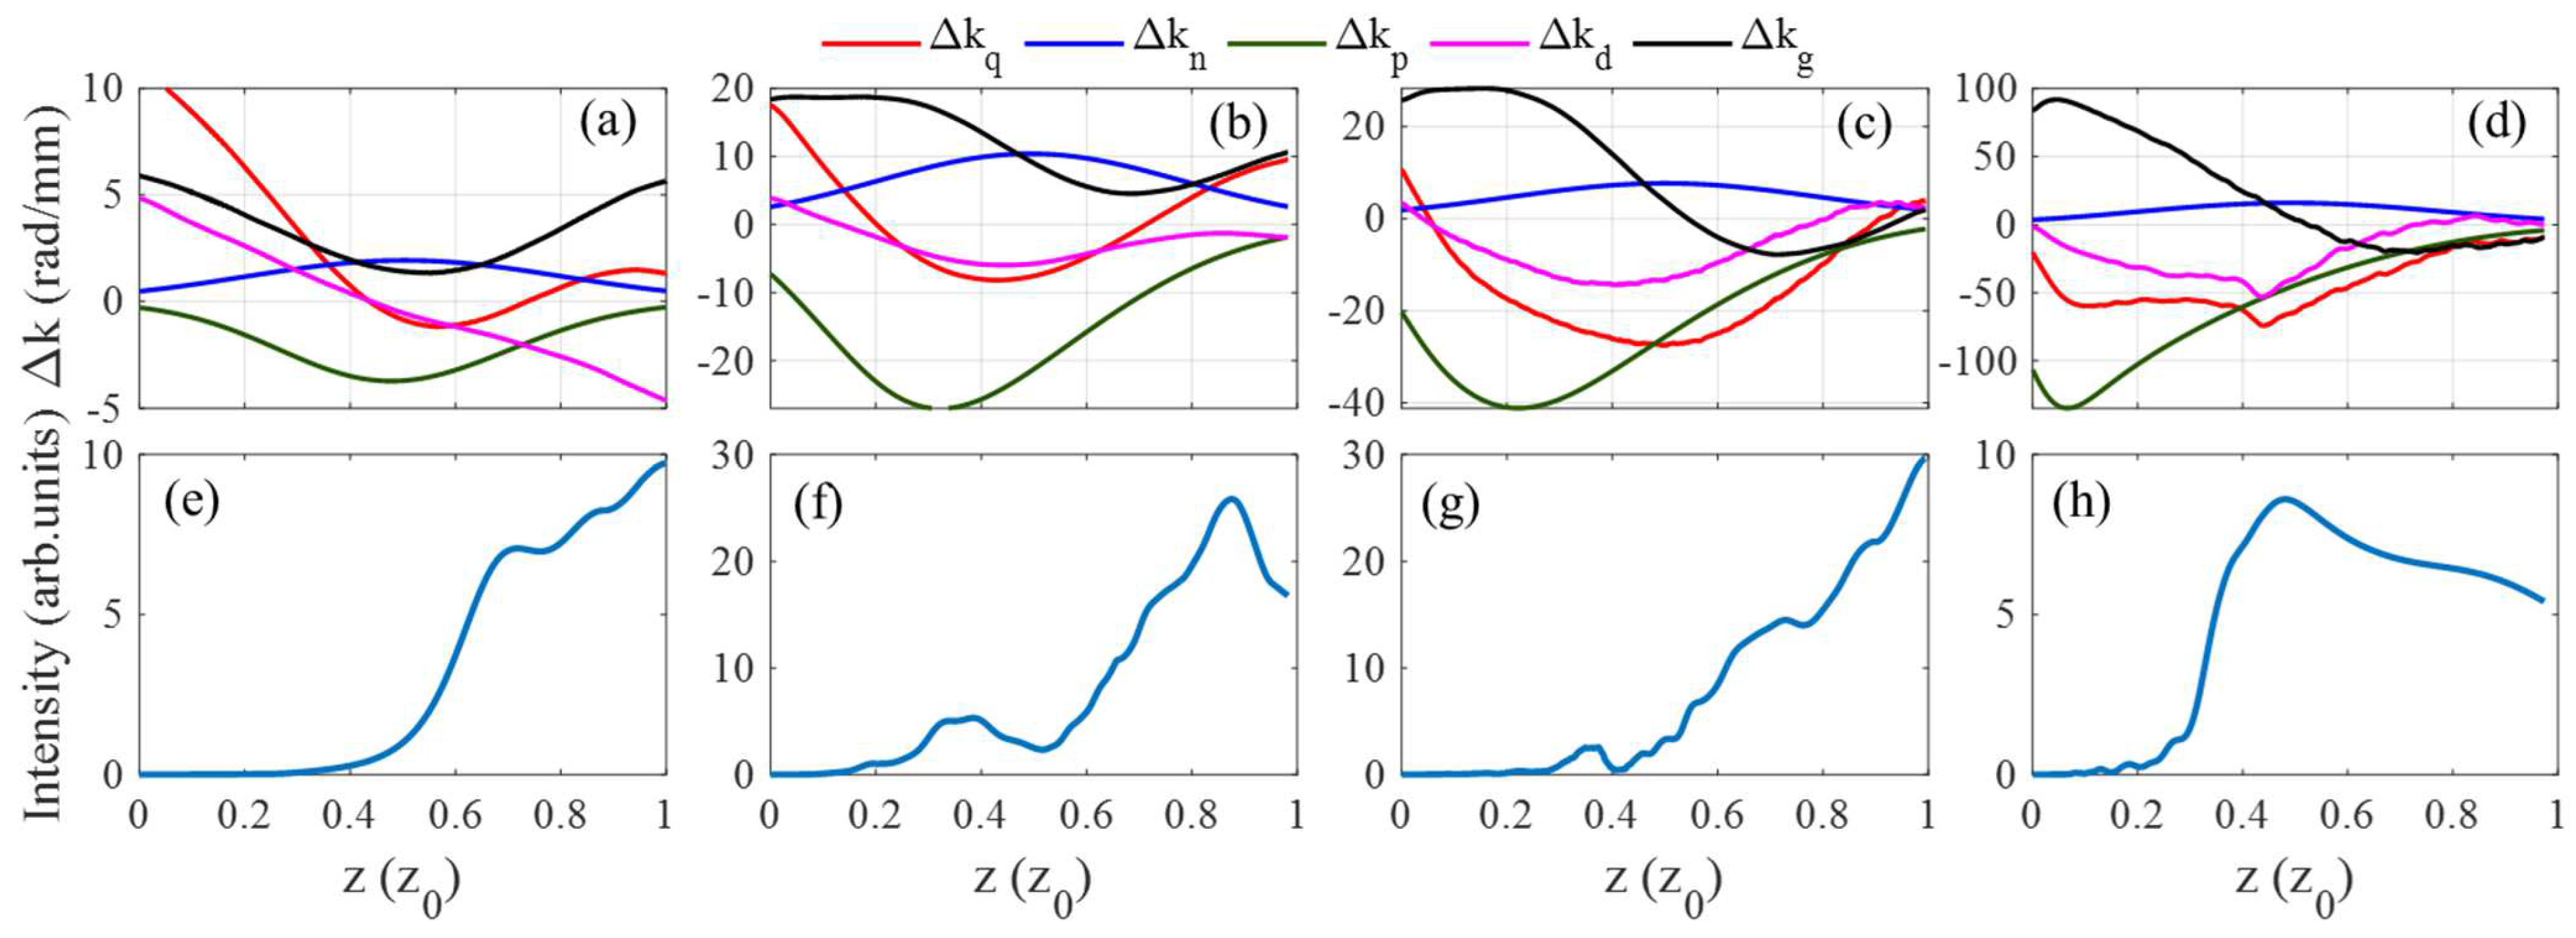
3.2. Phase Matching Analysis of the Harmonic Emissions in the Overdriven Regime

Because the phase matching of the harmonic is dependent on the spatiotemporal evolution of the driving laser in the gas medium, we first examine the electric fields of the driving laser in the reference frame at three selected positions, one at the entrance, one at the middle, and one at the exit of the gas medium, as shown in Figure 4. Figure 4a–d shows the on-axis (r = 0) driving laser electric field of the four laser intensities at the entrance (red line), middle (blue dashed line), and exit (green dash-dotted line), and Figure 4e–h shows the spatiotemporal laser intensity distributions of the four driving lasers at the exit of the gas medium. When the input laser peak intensity is low (7.5 I0), the spatiotemporal evolution of the laser in the gas medium is similar to that in a vacuum, as shown in Figure 3a and Figure 4a. This is because the ionization fraction is low (0.75%, as shown in Figure 3b) in this low-intensity laser case, which leads to a weak plasma defocusing effect and is unable to effectively reshape the spatiotemporal profile of the driving laser. Therefore, in the low-intensity case (7.5 I0), the spatiotemporal distribution of the driving laser during propagation typically demonstrates Gaussian profiles in both the temporal and radial direction, as shown in Figure 4e. But when the input laser peak intensity is high, although the laser fields have Gaussian profiles in the temporal and radial direction at the entrance of the medium, the electric fields at the middle and exit of the medium are reduced compared to the fields at the entrance, as shown in Figure 4b–d. Moreover, with an increase in the propagation distance, the spatiotemporal intensity distributions of the driving laser in the cases of high intensity are greatly reshaped, as shown in Figure 4f–h. This spatiotemporal reshaping of the driving laser in high-intensity cases can be attributed to the strong plasma defocusing effect caused by the excessive free electrons at the high ionization level [36,52,53]. In addition, one can clearly see the effective wavefront distortions in the high-intensity cases [54,55], as shown in Figure 4f–h. This is because the weaker intensity at a larger radial distance remains the same due to the weak plasma defocusing while the higher intensity at a smaller radial distance is reduced by the strong plasma defocusing, as shown in Figure 4f–h. Moreover, one can also see that with the wavefront distorts during propagation, the laser electric field also undergoes a blue shift in time and mostly in the trailing edge of the beam, resulting in an asymmetric laser pulse distribution in time that the laser intensity in the leading edge is much higher than that in the trailing edge, as shown in Figure 4b–d,f–h). Furthermore, as the input peak laser intensity increases, the effects of spatiotemporal reshaping and frequency blue-shift become more prominent. Therefore, the evolution of the driving laser in the high-intensity cases is different from that in the low-intensity case, which leads to the dynamic phase matching of the harmonics in the overdriven regime different from that in the conventional regime [23] (i.e., weakly ionized gas medium).
We next look at the time–frequency analysis of the resulting high harmonics exiting from the gas medium at four laser intensities and the corresponding optimal gas pressures, as shown in Figure 5. One can see that in all the cases of the input peak laser intensities, only short-trajectory emissions contribute to the harmonics. This is because the long-trajectory emissions accumulate more intrinsic phases compared to the short-trajectory emission branches, making phase matching particularly challenging. This is especially true in the overdriven regime, where the spatiotemporal reshaping of the driving laser causes a rapid change in the intrinsic phase. Furthermore, Figure 5 also showed that as the input laser intensity increases, harmonic emissions are concentrated gradually towards the leading edge of the laser pulse. This can be explained by two reasons: on the one hand, the wavefront distortion and blue shift in time of the driving laser field in the high-intensity cases lead to the laser pulse intensity in the leading edge being much higher than that in the trailing edge (see Figure 4), which contributed to the harmonic generation. On the other hand, the ionization fraction in the laser pulse trailing edge is much higher than that in the leading edge and limits the phase matching of the harmonics.
In order to investigate the effect of the spatiotemporal reshaping in the driving laser pulses on the harmonic generation process, we plot the spatial phase matching maps of H80 from the short-trajectory emissions inside the gas medium at t = 0 for the four laser intensities and the corresponding optimal gas pressures, as shown in Figure 6a–d. The phase mismatching in each position was calculated by Equation (4), which takes into account the effects of spatiotemporal reshaping and blue-shift of the driving laser in the overdriven regime, as shown in Equation (5). Additionally, the corresponding spatial evolution of harmonic intensity maps of H80 at the four laser intensities inside the gas medium was also investigated, as shown in Figure 6e–f. One can see that with the input peak laser intensity of 7.5 I0, the phase matching area is maximized, which contributed greatly to the harmonic yield buildup. The best region of phase matching is to be found on-axis downstream from the focus and the off-axis positions ranging from 30 μm to 60 μm, as shown in Figure 6a, resulting in a rapid harmonic buildup within the paraxial region in the second half of the medium, as shown in Figure 6e. When the input peak laser intensity increases to 12 I0, the phase matching area is greatly reduced due to the excessive plasma dispersion, and the best region of on-axis phase matching is located near the center of the gas medium, as shown in Figure 6b. This means that the harmonic yield buildup can only occur rapidly near the center of the medium and descends at the rear of the medium, as shown in Figure 6f. However, when the input peak laser intensity increases to 15 I0, despite experiencing an even greater plasma dispersion caused by the higher laser intensity and optimal gas pressure that makes phase matching more challenging, the phase matching area is only slightly reduced compared to the case of an input peak laser intensity of 12 I0, as illustrated in Figure 6c. In addition, compared with the case of 12 I0, the best region of on-axis phase matching in the case of 15 I0 is to be found within a 1 mm distance near the exit of the gas medium, which contributed greatly to the rapid harmonic yield buildup at the rear of the medium, as shown in Figure 6g. This difference in phase matching in 12 I0 and 15 I0 can be attributed to the effects of spatiotemporal reshaping and blue-shift of the driving laser in the overdriven regime. When the input peak laser intensity further increases to 20 I0, a much greater plasma dispersion due to a higher laser intensity and optimal gas pressure makes the phase matching area greatly reduce so that the best region of phase matching is to be found only off-axis, which hinders the harmonic yield buildup along the propagation, as shown in Figure 6h. Additionally, one can also find that as the driving laser intensity increases, the region of maximum harmonic intensity gradually shifts away from the axis, leading to an increase in the divergence angle of the harmonics, as shown in Figure 6e–h. This can be attributed to the wavefront distortion of the driving laser field at high laser intensity due to the spatiotemporal reshaping, as shown in Figure 4c–h.
To further observe the influence of the spatiotemporal reshaping of the driving laser on the four components of the phase matching, we also plot the on-axis (r = 0) phase mismatching of H80 from the short-trajectory emissions at t = 0 for the four laser intensities and the corresponding optimal gas pressures, as shown in Figure 7. Figure 7a–d showed the on-axis (r = 0) phase mismatching of H80 from the total ∆kq (red line), neutral atomic dispersion ∆kn (blue line), plasma dispersion ∆kp (green line), intrinsic dipole phase ∆kd (magenta line), and Gouy phase ∆kg (black line) driven by the four laser intensities, and Figure 7e–h showed the on-axis intensity evolution of H80 driven by the four driving lasers inside the gas medium. One can see that when the input peak laser intensity is 7.5 I0, the ionization fraction is low enough that the phase mismatching caused by the plasma dispersion is nearly compensated by the neutral atom dispersion. Additionally, the positive Gouy phase mismatching ∆kg is also compensated by the negative intrinsic dipole phase mismatching ∆kd downstream from the center of the medium, as shown in Figure 7a. As a result, a favorable phase matching region is formed in the second half of the gas medium, which leads to sustained harmonic buildup along the medium, as shown in Figure 7e. Therefore, the phase matching in this low-intensity laser case is actually a conventional phase matching mechanism where the ∆kg is always positive along the medium and the ∆kd is positive (negative) before (after) the focal position. However, we will see that the phase matching in the high-intensity laser cases is very different from the conventional mechanism, particularly in the overdriven regime. When the input peak laser intensity increases to 12 I0, despite the plasma dispersion ∆kp due to the excessive ionization that cannot be balanced by the neutral atom dispersion ∆kn, the large positive Gouy phase mismatching ∆kg and the negative intrinsic dipole phase mismatching ∆kd makes the ∆kq decrease gradually and cross the ∆kq = 0 line in the first half of the medium, as shown in Figure 7b. In the second half of the medium, the decrease in ∆kp makes ∆kq decrease gradually again and cross the ∆kq = 0 line for the second time. However, because of the large positive Gouy phase mismatching ∆kg along the medium, the total phase matching ∆kq increases again at the rear of the medium, which hinders the harmonic buildup in the exit plane, as shown in Figure 7f. It can be seen from Figure 7f that the harmonic is accumulated in the first half of the medium due to the phase matching of the first time and then descends gradually. In the second half of the medium, there is a re-accumulation of the harmonic due to the second phase matching and followed by a subsequent decrease again. By comparing the phase mismatching results in Figure 7a,b, one can see that the behavior of the Gouy phase mismatching and the intrinsic dipole phase mismatching in the case of 12 I0 is very different from that in the case of 7.5 I0. This can be attributed to the spatiotemporal reshaping and frequency blue-shift of the driving laser in high laser intensity. Because ∆kg is dependent on the spatial phase of the driving laser and ∆kd is dependent on the intensity gradient and frequency shift of the laser, the spatiotemporal reshaping and frequency blue-shift of the driving laser will make these two kinds of phase mismatching very different from that in the ordinary regime (i.e., the low-intensity case) [23]. The phase matching mechanism in the overdriven regime is also called the extended phase matching [29,31].
With the input peak laser intensity further increasing to 15 I0, although a greater plasma dispersion makes phase matching more challenging, a strong spatiotemporal reshaping of the driving laser results in a large positive Gouy phase mismatching. This large Gouy phase mismatching can almost compensate for the plasma dispersion phase mismatching and the total phase mismatching basically follows the profile of the intrinsic dipole phase mismatching, as shown in Figure 7c. This is because the strong spatiotemporal reshaping and frequency blue-shift of the driving laser results in an enhanced intrinsic dipole phase mismatching that is more dominant than the neutral atomic dispersion phase mismatching, particularly in the fast-dropping stage of the driver pulse intensity. As a result, the balance of ∆kp, ∆kg, and ∆kd makes the total phase mismatching reduce gradually in the second half of the gas medium and realizes a good phase matching near the rear of the medium, which contributed greatly to the harmonic buildup along the medium, as shown in Figure 7g. When the input peak laser intensity further increases to 20 I0, even though the significantly greater plasma dispersion can still be counterbalanced by the intensified Gouy phase mismatching caused by the stronger spatiotemporal reshaping of the driving laser, the intrinsic dipole phase mismatching is also greatly enhanced. Consequently, this leads to poor phase matching throughout the gas medium, thereby impeding the harmonic buildup, as depicted in Figure 7d,h. Therefore, we can conclude that the spatiotemporal reshaping of the driving laser in the overdriven regime can significantly influence the phase matching of the harmonics and the harmonic buildup along the gas medium.
It is worth noting that, by comparing the harmonic buildup process in the four laser intensities, as shown in Figure 7e–h, one can find that despite the phase mismatching being much smaller in the case of 7.5 I0 compared to 12 I0 and 15 I0, the harmonic buildup in the exit plane of the gas medium is still lower in the low-intensity case than that in the high-intensity cases. This is attributed to the high induced atomic dipole moment amplitude of the single-atom response in the high laser intensity and the high atomic number density in the high gas pressure (see Equation (5)). One can also see that the harmonic intensity at the exit of the medium in the case of 12 I0 is lower than that in the case of 15 I0, which can be attributed to the phase matching of the harmonics. The harmonic in the case of 15 I0 has a good phase matching at the rear of the medium, resulting in a continuous harmonic buildup along the medium, as shown in Figure 7c,g. However, the harmonic in the case of 12 I0 has poor phase matching due to the large Gouy phase mismatching at the rear of the medium, resulting in a decrease in the harmonic at the rear of the medium. This discrepancy in phase matching between the two laser intensities can also be used to explain the difference between the results in Figure 2d and Figure 3c. Therefore, the phase matching of the harmonic can also greatly affect the harmonic yield buildup. We can also conclude that both the induced atomic dipole moment amplitude of the single-atom response and the phase matching of the macroscopic medium should be carefully considered to maximize the harmonic generation. In addition, by comparing the phase matching in the overdriven regime as shown in Figure 7b–d, one can also see that only a suitable spatiotemporal reshaping of the driving laser results in favorable phase matching and harmonic buildup. In the case of 12 I0, a weak spatiotemporal reshaping that makes the Gouy phase mismatched just slightly changed compared to the low-intensity case, resulting in poor phase matching at the rear of the medium, as shown in Figure 7b. However, in the case of 20 I0, although a strong spatiotemporal reshaping makes the ∆kg change considerably compared to the low-intensity case, the intrinsic dipole phase mismatching is also greatly enhanced, which also results in poor phase matching along the medium. Therefore, it is the suitable spatiotemporal reshaping of the driving laser in the case of 15 I0 that makes the ∆kg and the ∆kd a relatively large value in the first half of the medium to compensate for the plasma dispersion and a small value at the rear of the medium to realize favorable phase matching.

4. Conclusions

In this work, we demonstrated an approach to enhance the XUV harmonics in the plateau region by increasing the intensity of the driving laser while keeping the laser energy constant. We theoretically investigated the effects of different driving laser intensities at different gas pressures on the harmonics generation. The simulation results showed that by increasing the laser intensity to the overdriven regime, the average XUV harmonics yield in the plateau region is approximately twice as high as that obtained optimally in the conventional loose focusing geometry scheme by utilizing a relatively low-intensity driving laser with the same laser energy. The analysis of the HHG in the macroscopic medium using a 1D model, along with a further quantitative analysis of the phase matching, has revealed that the observed enhancement in harmonics can be attributed to two key factors. On the one hand, it is the amplification of the induced atomic dipole moment amplitude of the single-atom response in the high-intensity driving laser that results in the improvement of the harmonic generation efficiency in the microscopic, which contributes to the enhancement of the harmonic. On the other hand, the favorable phase matching along the gas medium in the overdriven regime can also contribute to the harmonic buildup in the macroscopic. Furthermore, by investigating the effects of the spatiotemporal reshaping of the driving laser on the harmonic’s phase mismatching in the overdriven regime, the results revealed that the spatiotemporal reshaping can greatly change the phase mismatching of the harmonics, particularly the Gouy phase mismatching and the intrinsic dipole phase mismatching. In addition, the results also showed that only a suitable spatiotemporal reshaping of the driving laser can contribute to forming a favorable phase matching and result in a sustained harmonic buildup along the gas medium, which should be carefully considered in experiments. Therefore, our study provides a feasible scheme to enhance the XUV harmonics in the plateau region for future HHG experiments.

Supplementary Materials

The following supporting information can be downloaded at: https://www.mdpi.com/article/10.3390/photonics10090964/s1, Figure S1: Ionization probability calculated by TDSE (solid line) and SFA model (dashed line). I0 = 1 × 10¹⁴ W/cm2. Figure S2: HHG spectrum of single-atom response calculated by TDSE and SFA (black line) at different laser intensities. In the TDSE calculation, two initial state cases are considered: the initial pure ground state (red line) and the initial superposition state of the ground and six excited states (blue line). The shadow region represents the harmonics below the threshold. The shadow region represents the harmonics below the threshold. Figure S3: The normalized average intensity of harmonics from H65 to H95 with different laser intensities was calculated by TDSE and SFA. References [56,57,58,59,60,61,62,63] are cited in the Supplementary Materials.

Author Contributions

Conceptualization, Z.Q. and J.L.; formal analysis, J.L. and C.Y.; software, Z.Q.; methodology, Z.Q. and Z.X. (Zibo Xu); investigation, Z.X. (Zibo Xu); validation, J.C., X.J., Z.X. (Zhongtao Xiang), Z.Z., and S.Z.; resources, C.Y. and J.L.; data curation, Z.Q. and Z.X. (Zibo Xu); writing—original draft preparation, Z.Q.; writing—review and editing, J.L. and C.Y.; supervision, J.L.; project administration, J.L.; funding acquisition, J.L. All authors have read and agreed to the published version of the manuscript.

Funding

This work was supported by the National Natural Science Foundation of China (Grants Nos 11974251, 12105180, 12005137, 12074397, 11904377, and 11905279), Shanghai Natural Science Foundation (Grant No. 20ZR1441600), the Innovation Program of Shanghai Municipal Education Commission (Grant No. 2021-01-07-00-02-E00118), and the Sponsored by Shanghai Sailing Program (Grant No. 20YF1435400).

Institutional Review Board Statement

Not applicable.

Informed Consent Statement

Not applicable.

Data Availability Statement

The data presented in this study are available from the corresponding author upon reasonable request.

Conflicts of Interest

The authors declare no conflict of interest.

References

  1. Midorikawa, K. Progress on table-top isolated attosecond light sources. Nat. Photonics 2022, 16, 267–278. [Google Scholar] [CrossRef]
  2. Krausz, F.; Ivanov, M. Attosecond physics. Rev. Mod. Phys. 2009, 81, 163–234. [Google Scholar] [CrossRef]
  3. Takahashi, E.J.; Kanai, T.; Ishikawa, K.L.; Nabekawa, Y.; Midorikawa, K. Coherent Water Window X Ray by Phase-Matched High-Order Harmonic Generation in Neutral Media. Phys. Rev. Lett. 2008, 101, 253901. [Google Scholar] [CrossRef]
  4. Popmintchev, T.; Chen, M.-C.; Popmintchev, D.; Arpin, P.; Brown, S.; Ališauskas, S.; Andriukaitis, G.; Balčiunas, T.; Mücke, O.D.; Pugzlys, A.; et al. Bright Coherent Ultrahigh Harmonics in the keV X-ray Regime from Mid-Infrared Femtosecond Lasers. Science 2012, 336, 1287–1291. [Google Scholar] [CrossRef] [PubMed]
  5. Johnson, A.S.; Austin, D.R.; Wood, D.A.; Brahms, C.; Gregory, A.; Holzner, K.B.; Jarosch, S.; Larsen, E.W.; Parker, S.; Strüber, C.S.; et al. High-flux soft x-ray harmonic generation from ionization-shaped few-cycle laser pulses. Sci. Adv. 2018, 4, eaar3761. [Google Scholar] [CrossRef]
  6. Ren, X.; Li, J.; Yin, Y.; Zhao, K.; Chew, A.; Wang, Y.; Hu, S.; Cheng, Y.; Cunningham, E.; Wu, Y.; et al. Attosecond light sources in the water window. J. Opt. 2018, 20, 023001. [Google Scholar] [CrossRef]
  7. Han, S.; Li, J.; Zhu, Z.; Chew, A.; Larsen, E.W.; Wu, Y.; Pang, S.S.; Chang, Z. Chapter One—Tabletop attosecond X-rays in the water window. In Advances in Atomic, Molecular, and Optical Physics; Dimauro, L.F., Perrin, H., Yelin, S.F., Eds.; Academic Press: Cambridge, MA, USA, 2020; Volume 69, pp. 1–65. [Google Scholar]
  8. Major, B.; Ghafur, O.; Kovács, K.; Varjú, K.; Tosa, V.; Vrakking, M.J.J.; Schütte, B. Compact intense extreme-ultraviolet source. Optica 2021, 8, 960–965. [Google Scholar] [CrossRef]
  9. Gao, J.; Wu, J.; Lou, Z.; Yang, F.; Qian, J.; Peng, Y.; Leng, Y.; Zheng, Y.; Zeng, Z.; Li, R. High-order harmonic generation in an x-ray range from laser-induced multivalent ions of noble gas. Optica 2022, 9, 1003–1008. [Google Scholar] [CrossRef]
  10. Goulielmakis, E.; Loh, Z.-H.; Wirth, A.; Santra, R.; Rohringer, N.; Yakovlev, V.S.; Zherebtsov, S.; Pfeifer, T.; Azzeer, A.M.; Kling, M.F.; et al. Real-time observation of valence electron motion. Nature 2010, 466, 739–743. [Google Scholar] [CrossRef]
  11. Bencivenga, F.; Mincigrucci, R.; Capotondi, F.; Foglia, L.; Naumenko, D.; Maznev, A.A.; Pedersoli, E.; Simoncig, A.; Caporaletti, F.; Chiloyan, V.; et al. Nanoscale transient gratings excited and probed by extreme ultraviolet femtosecond pulses. Sci. Adv. 2019, 5, eaaw5805. [Google Scholar] [CrossRef]
  12. Lan, P.; Ruhmann, M.; He, L.; Zhai, C.; Wang, F.; Zhu, X.; Zhang, Q.; Zhou, Y.; Li, M.; Lein, M.; et al. Attosecond Probing of Nuclear Dynamics with Trajectory-Resolved High-Harmonic Spectroscopy. Phys. Rev. Lett. 2017, 119, 033201. [Google Scholar] [CrossRef] [PubMed]
  13. Popmintchev, D.; Galloway, B.R.; Chen, M.-C.; Dollar, F.; Mancuso, C.A.; Hankla, A.; Miaja-Avila, L.; O’Neil, G.; Shaw, J.M.; Fan, G.; et al. Near- and Extended-Edge X-Ray-Absorption Fine-Structure Spectroscopy Using Ultrafast Coherent High-Order Harmonic Supercontinua. Phys. Rev. Lett. 2018, 120, 093002. [Google Scholar] [CrossRef]
  14. Fu, Y.; Nishimura, K.; Shao, R.; Suda, A.; Midorikawa, K.; Lan, P.; Takahashi, E.J. High efficiency ultrafast water-window harmonic generation for single-shot soft X-ray spectroscopy. Commun. Phys. 2020, 3, 92. [Google Scholar] [CrossRef]
  15. Corkum, P.B. Plasma perspective on strong field multiphoton ionization. Phys. Rev. Lett. 1993, 71, 1994–1997. [Google Scholar] [CrossRef] [PubMed]
  16. Tate, J.; Auguste, T.; Muller, H.G.; Salières, P.; Agostini, P.; DiMauro, L.F. Scaling of Wave-Packet Dynamics in an Intense Midinfrared Field. Phys. Rev. Lett. 2007, 98, 013901. [Google Scholar] [CrossRef]
  17. Balcou, P.; L’Huillier, A. Phase-matching effects in strong-field harmonic generation. Phys. Rev. A 1993, 47, 1447–1459. [Google Scholar] [CrossRef]
  18. Jin, C.; Le, A.-T.; Trallero-Herrero, C.A.; Lin, C.D. Generation of isolated attosecond pulses in the far field by spatial filtering with an intense few-cycle mid-infrared laser. Phys. Rev. A 2011, 84, 043411. [Google Scholar] [CrossRef]
  19. Popmintchev, T.; Chen, M.-C.; Bahabad, A.; Gerrity, M.; Sidorenko, P.; Cohen, O.; Christov, I.P.; Murnane, M.M.; Kapteyn, H.C. Phase matching of high harmonic generation in the soft and hard X-ray regions of the spectrum. Proc. Natl. Acad. Sci. USA 2009, 106, 10516. [Google Scholar] [CrossRef]
  20. Chen, M.C.; Arpin, P.; Popmintchev, T.; Gerrity, M.; Zhang, B.; Seaberg, M.; Popmintchev, D.; Murnane, M.M.; Kapteyn, H.C. Bright, Coherent, Ultrafast Soft X-ray Harmonics Spanning the Water Window from a Tabletop Light Source. Phys. Rev. Lett. 2010, 105, 173901. [Google Scholar] [CrossRef]
  21. Wang, H.; Xu, Y.; Ulonska, S.; Robinson, J.S.; Ranitovic, P.; Kaindl, R.A. Bright high-repetition-rate source of narrowband extreme-ultraviolet harmonics beyond 22 eV. Nat. Commun. 2015, 6, 7459. [Google Scholar] [CrossRef]
  22. Durfee, C.G.; Rundquist, A.R.; Backus, S.; Herne, C.; Murnane, M.M.; Kapteyn, H.C. Phase Matching of High-Order Harmonics in Hollow Waveguides. Phys. Rev. Lett. 1999, 83, 2187–2190. [Google Scholar] [CrossRef]
  23. Lai, C.-J.; Kärtner, F.X. The influence of plasma defocusing in high harmonic generation. Opt. Express 2011, 19, 22377–22387. [Google Scholar] [CrossRef] [PubMed]
  24. Hareli, L.; Shoulga, G.; Bahabad, A. Phase matching and quasi-phase matching of high-order harmonic generation—A tutorial. J. Phys. B 2020, 53, 233001. [Google Scholar] [CrossRef]
  25. Seres, J.; Yakovlev, V.S.; Seres, E.; Streli, C.; Wobrauschek, P.; Spielmann, C.; Krausz, F. Coherent superposition of laser-driven soft-X-ray harmonics from successive sources. Nat. Phys. 2007, 3, 878–883. [Google Scholar] [CrossRef]
  26. Lytle, A.L.; Zhang, X.; Peatross, J.; Murnane, M.M.; Kapteyn, H.C.; Cohen, O. Probe of High-Order Harmonic Generation in a Hollow Waveguide Geometry using Counterpropagating Light. Phys. Rev. Lett. 2007, 98, 123904. [Google Scholar] [CrossRef] [PubMed]
  27. Gibson, E.A.; Paul, A.; Wagner, N.; Tobey, R.A.; Gaudiosi, D.; Backus, S.; Christov, I.P.; Aquila, A.; Gullikson, E.M.; Attwood, D.T.; et al. Coherent Soft X-ray Generation in the Water Window with Quasi-Phase Matching. Science 2003, 302, 95–98. [Google Scholar] [CrossRef] [PubMed]
  28. Paul, A.; Bartels, R.A.; Tobey, R.; Green, H.; Weiman, S.; Christov, I.P.; Murnane, M.M.; Kapteyn, H.C.; Backus, S. Quasi-phase-matched generation of coherent extreme-ultraviolet light. Nature 2003, 421, 51–54. [Google Scholar] [CrossRef] [PubMed]
  29. Sun, H.-W.; Huang, P.-C.; Tzeng, Y.-H.; Huang, J.-T.; Lin, C.D.; Jin, C.; Chen, M.-C. Extended phase matching of high harmonic generation by plasma-induced defocusing. Optica 2017, 4, 976–981. [Google Scholar] [CrossRef]
  30. Major, B.; Kovács, K.; Svirplys, E.; Anus, M.; Ghafur, O.; Varjú, K.; Vrakking, M.J.J.; Tosa, V.; Schütte, B. High-order harmonic generation in a strongly overdriven regime. Phys. Rev. A 2023, 107, 023514. [Google Scholar] [CrossRef]
  31. Jin, C.; Chen, M.-C.; Sun, H.-W.; Lin, C.D. Extension of water-window harmonic cutoff by laser defocusing-assisted phase matching. Opt. Lett. 2018, 43, 4433–4436. [Google Scholar] [CrossRef]
  32. Shao, R.; Zhai, C.; Zhang, Y.; He, L.; Zhu, X.; Lan, P.; Lu, P. Efficient soft x-ray high-order harmonic generation via dual-pulse driving lasers in the overdriven regime. J. Phys. B 2021, 54, 064001. [Google Scholar] [CrossRef]
  33. Schötz, J.; Förg, B.; Schweinberger, W.; Liontos, I.; Masood, H.A.; Kamal, A.M.; Jakubeit, C.; Kling, N.G.; Paasch-Colberg, T.; Biswas, S.; et al. Phase-Matching for Generation of Isolated Attosecond XUV and Soft-X-ray Pulses with Few-Cycle Drivers. Phys. Rev. X 2020, 10, 041011. [Google Scholar] [CrossRef]
  34. Tang, X.; Wang, K.; Li, B.; Chen, Y.; Lin, C.D.; Jin, C. Optimal generation and isolation of attosecond pulses in an overdriven ionized medium. Opt. Lett. 2021, 46, 5137–5140. [Google Scholar] [CrossRef] [PubMed]
  35. Jin, C.; Tang, X.; Li, B.; Wang, K.; Lin, C.D. Optimal Spatial Separation of High-Order Harmonics from Infrared Driving Lasers with an Annular Beam in the Overdriven Regime. Phys. Rev. Appl. 2020, 14, 014057. [Google Scholar] [CrossRef]
  36. Trallero-Herrero, C.; Jin, C.; Schmidt, B.E.; Shiner, A.D.; Kieffer, J.C.; Corkum, P.B.; Villeneuve, D.M.; Lin, C.D.; Légaré, F.; Le, A.T. Generation of broad XUV continuous high harmonic spectra and isolated attosecond pulses with intense mid-infrared lasers. J. Phys. B 2012, 45, 011001. [Google Scholar] [CrossRef]
  37. Lewenstein, M.; Balcou, P.; Ivanov, M.Y.; L’Huillier, A.; Corkum, P.B. Theory of high-harmonic generation by low-frequency laser fields. Phys. Rev. A 1994, 49, 2117–2132. [Google Scholar] [CrossRef]
  38. Ammosov, M.V.; Delone, N.B.; Krainov, V.P. Tunnel ionization of complex atoms and of atomic ions in an alternating electromagnetic field. Sov. J. Exp. Theor. Phys. 1986, 64, 1191–1194. [Google Scholar]
  39. Geissler, M.; Tempea, G.; Scrinzi, A.; Schnürer, M.; Krausz, F.; Brabec, T. Light Propagation in Field-Ionizing Media: Extreme Nonlinear Optics. Phys. Rev. Lett. 1999, 83, 2930–2933. [Google Scholar] [CrossRef]
  40. Priori, E.; Cerullo, G.; Nisoli, M.; Stagira, S.; De Silvestri, S.; Villoresi, P.; Poletto, L.; Ceccherini, P.; Altucci, C.; Bruzzese, R.; et al. Nonadiabatic three-dimensional model of high-order harmonic generation in the few-optical-cycle regime. Phys. Rev. A 2000, 61, 063801. [Google Scholar] [CrossRef]
  41. Jin, C.; Le, A.-T.; Lin, C.D. Medium propagation effects in high-order harmonic generation of Ar and N2. Phys. Rev. A 2011, 83, 023411. [Google Scholar] [CrossRef]
  42. Balcou, P.; Salières, P.; L’Huillier, A.; Lewenstein, M. Generalized phase-matching conditions for high harmonics: The role of field-gradient forces. Phys. Rev. A 1997, 55, 3204–3210. [Google Scholar] [CrossRef]
  43. Gaarde, M.B.; Tate, J.L.; Schafer, K.J. Macroscopic aspects of attosecond pulse generation. J. Phys. B 2008, 41, 132001. [Google Scholar] [CrossRef]
  44. Jin, C.; Lin, C.D. Spatially coherent high-order harmonics generated at optimal high gas pressure with high-intensity one- or two-color laser pulses. Phys. Rev. A 2016, 94, 043804. [Google Scholar] [CrossRef]
  45. Watson, J.B.; Sanpera, A.; Burnett, K. Pulse-shape effects and blueshifting in the single-atom harmonic generation from neutral species and ions. Phys. Rev. A 1995, 51, 1458–1463. [Google Scholar] [CrossRef]
  46. Shin, H.J.; Lee, D.G.; Cha, Y.H.; Hong, K.H.; Nam, C.H. Generation of Nonadiabatic Blueshift of High Harmonics in an Intense Femtosecond Laser Field. Phys. Rev. Lett. 1999, 83, 2544–2547. [Google Scholar] [CrossRef]
  47. Tong, X.-M.; Chu, S.-I. Probing the spectral and temporal structures of high-order harmonic generation in intense laser pulses. Phys. Rev. A 2000, 61, 021802. [Google Scholar] [CrossRef]
  48. Constant, E.; Garzella, D.; Breger, P.; Mével, E.; Dorrer, C.; Le Blanc, C.; Salin, F.; Agostini, P. Optimizing High Harmonic Generation in Absorbing Gases: Model and Experiment. Phys. Rev. Lett. 1999, 82, 1668–1671. [Google Scholar] [CrossRef]
  49. Weissenbilder, R.; Carlström, S.; Rego, L.; Guo, C.; Heyl, C.M.; Smorenburg, P.; Constant, E.; Arnold, C.L.; L’Huillier, A. How to optimize high-order harmonic generation in gases. Nat. Rev. Phys. 2022, 4, 713–722. [Google Scholar] [CrossRef]
  50. Henke, B.L.; Gullikson, E.M.; Davis, J.C. X-Ray Interactions: Photoabsorption, Scattering, Transmission, and Reflection at E = 50–30,000 eV, Z = 1–92. At. Data Nucl. Data Tables 1993, 54, 181–342. [Google Scholar] [CrossRef]
  51. Kazamias, S.; Daboussi, S.; Guilbaud, O.; Cassou, K.; Ros, D.; Cros, B.; Maynard, G. Pressure-induced phase matching in high-order harmonic generation. Phys. Rev. A 2011, 83, 063405. [Google Scholar] [CrossRef]
  52. Rivas, D.E.; Major, B.; Weidman, M.; Helml, W.; Marcus, G.; Kienberger, R.; Charalambidis, D.; Tzallas, P.; Balogh, E.; Kovács, K.; et al. Propagation-enhanced generation of intense high-harmonic continua in the 100-eV spectral region. Optica 2018, 5, 1283–1289. [Google Scholar] [CrossRef]
  53. Major, B.; Kovács, K.; Tosa, V.; Rudawski, P.; L’Huillier, A.; Varjú, K. Effect of plasma-core-induced self-guiding on phase matching of high-order harmonic generation in gases. J. Opt. Soc. Am. B 2019, 36, 1594–1601. [Google Scholar] [CrossRef]
  54. Tosa, V.; Lee, J.S.; Kim, H.T.; Nam, C.H. Attosecond pulses generated by the lighthouse effect in Ar gas. Phys. Rev. A 2015, 91, 051801. [Google Scholar] [CrossRef]
  55. Kovács, K.; Negro, M.; Vozzi, C.; Stagira, S.; Tosa, V. Attosecond lighthouse above 100 eV from high-harmonic generation of mid-infrared pulses. J. Opt. 2017, 19, 104003. [Google Scholar] [CrossRef]
  56. Fu, Y.; Zeng, J.; Yuan, J. PCTDSE: A parallel Cartesian-grid-based TDSE solver for modeling laser–atom interactions. Comput. Phys. Commun. 2017, 210, 181–192. [Google Scholar] [CrossRef]
  57. Beaulieu, S.; Camp, S.; Descamps, D.; Comby, A.; Wanie, V.; Petit, S.; Légaré, F.; Schafer, K.J.; Gaarde, M.B.; Catoire, F.; et al. Role of Excited States in High-order Harmonic Generation. Phys. Rev. Lett. 2016, 117, 203001. [Google Scholar] [CrossRef]
  58. Watson, J.B.; Sanpera, A.; Chen, X.; Burnett, K. Harmonic generation from a coherent superposition of states. Phys. Rev. A 1996, 53, R1962–R1965. [Google Scholar] [CrossRef]
  59. Yuan, X.; Wei, P.; Liu, C.; Zeng, Z.; Zheng, Y.; Jiang, J.; Ge, X.; Li, R. Enhanced high-order harmonic generation from excited argon. Appl. Phys. Lett. 2015, 107, 041110. [Google Scholar] [CrossRef]
  60. Chen, J.; Wang, R.; Zhai, Z.; Chen, J.; Fu, P.; Wang, B.; Liu, W.-M. Frequency-selected enhancement of high-order-harmonic generation by interference of degenerate Rydberg states in a few-cycle laser pulse. Phys. Rev. A 2012, 86, 033417. [Google Scholar] [CrossRef]
  61. Tikman, Y.; Yavuz, I.; Ciappina, M.F.; Chacón, A.; Altun, Z.; Lewenstein, M. High-order-harmonic generation from Rydberg atoms driven by plasmon-enhanced laser fields. Phys. Rev. A 2016, 93, 023410. [Google Scholar] [CrossRef]
  62. Krause, J.L.; Schafer, K.J.; Kulander, K.C. High-order harmonic generation from atoms and ions in the high intensity regime. Phys. Rev. Lett. 1992, 68, 3535–3538. [Google Scholar] [CrossRef] [PubMed]
  63. Miyazaki, K.; Takada, H. High-order harmonic generation in the tunneling regime. Phys. Rev. A 1995, 52, 3007–3021. [Google Scholar] [CrossRef] [PubMed]
Figure 1. Simulated HHG spectra generated for different gas pressures at four laser intensities, where I0 = 1 × 10¹⁴ W/cm2. The harmonic yields are integrated over the radial direction in the near field.
Photonics 10 00964 g001
Figure 2. (ac) Optimal HHG spectra (a,b) and the statistical harmonic yields of different harmonic orders (c) driven by the four laser intensities at the corresponding optimal gas pressures, where I0 = 1 × 10¹⁴ W/cm2. The harmonic yields are integrated over the radial direction in the near field. The arrows in (b) represent the selected harmonic orders to analyze furtherly in this paper, which are uniformly referred to as H80 for convenience. (d) The harmonic yield of selected H80 versus gas pressure for different laser intensities.
Photonics 10 00964 g002
Figure 3. (a,b) Simulated on-axis (r = 0) laser intensity evolution (a) and probability evolution (b) along the propagation axis for the optimal gas pressure at four laser intensities: 7.5 I0 and 0.3 bar (black line), 12 I0 and 0.45 bar (blue line), 15 I0 and 0.6 bar (red line), and 20 I0 and 0.9 bar (green line). z0 represents the Rayleigh length for each laser beam waist. (c) The calculated harmonic yield of H80 for different gas pressures at the four laser intensities by numerically integrating Equation (1).
Photonics 10 00964 g003
Figure 4. (ad) Simulated on-axis (r = 0) laser electric fields at the entrance (red line), middle (blue dotted line), and exit (green dash-dotted line) of the gas medium for the optimal gas pressure at four laser intensities. (eh) Spatiotemporal laser intensity distributions at the exit of the gas medium for the optimal gas pressure at four laser intensities. The four laser intensities and their corresponding optimal gas pressures are 7.5 I0 and 0.3 bar (a,e), 12 I0 and 0.45 bar (b,f), 15 I0 and 0.6 bar (c,g), and 20 I0 and 0.9 bar (d,h). Laser intensities in each panel of (eh) are normalized to their maximum.
Photonics 10 00964 g004
Figure 5. Time–frequency analysis of harmonic emissions (normalized to the maximum in each panel) at the exit plane of the gas medium for the four laser intensities and the corresponding gas pressures.
Photonics 10 00964 g005
Figure 6. (ad) Spatial phase matching map of H80 from the short-trajectory emissions inside the gas medium at t = 0 for the four laser intensities and the corresponding optimal gas pressures. (eh) The corresponding spatial evolution of harmonic intensity maps (normalized to the maximum in each panel) of H80 at the four laser intensities inside the gas medium. z0 represents the Rayleigh length for each kind of laser beam waist.
Photonics 10 00964 g006
Figure 7. (ad) Simulated on-axis (r = 0) phase mismatching of H80 from the total ∆kq (red line), neutral atomic dispersion ∆kn (blue line), plasma dispersion ∆kp (green line), intrinsic dipole phase ∆kd (magenta line), and Gouy phase ∆kg (black line) inside the medium driven by the four laser intensities and their optimal gas pressures. (eh) On-axis intensity evolution of H80 inside the gas medium driven by the four driving lasers and their optimal pressures. The four laser intensities and their corresponding optimal gas pressures are 7.5 I0 and 0.3 bar (a,e), 12 I0 and 0.45 bar (b,f), 15 I0 and 0.6 bar (c,g), and 20 I0 and 0.9 bar (d,h).
Photonics 10 00964 g007
Disclaimer/Publisher’s Note: The statements, opinions and data contained in all publications are solely those of the individual author(s) and contributor(s) and not of MDPI and/or the editor(s). MDPI and/or the editor(s) disclaim responsibility for any injury to people or property resulting from any ideas, methods, instructions or products referred to in the content.

