1. Introduction
The quality of the Structural Health Monitoring (SHM) system depends on the effectiveness of the used sensitive elements that register crucial parameters of the monitored object. Fiber-optic sensors (FOSs) demonstrate high sensitivity, the ability to operate in a wide range of temperatures and environmental conditions, and independence from electromagnetic interference, which make them highly relevant in the field of structural integrity assessment. The small dimensions of the optical fiber make it possible to attach FOSs both on the surface of the monitored object and to embed them into the structure’s material, opening up possibilities for registering the mechanical state at the manufacturing stage. FOSs find applications in aerospace [
1,
2,
3], geotechnical [
4,
5,
6], civil engineering [
7,
8,
9], medical [
10,
11,
12], and many other [
13] fields.
FOSs are sensitive to strain and/or temperature changes as well as derivatives of these parameters (pressure, force, displacement, etc.) in a certain section of the optical fiber or throughout the entire fiber under test (FUT). Depending on the size of the sensitive zone, FOSs are usually divided into categories of single point and distributed sensors [
14].
Typically, in the fabrication of the point FOSs, the optical fiber undergoes preliminary treatment in the area where the sensitive element should be located. For instance, to record an FBG, which is the most common point of FOS for measuring strain, a periodic change in the refractive index is induced via laser radiation in the section of the fiber-optic core [
15].
On the other hand, for distributed measurements, it is possible to use an optical fiber that is not subjected to special processing. Distributed FOSs are based on the measurement of optical scattering resulting from the interaction of light with the material in an optical fiber. There are three main types of scattering used in distributed FOSs: Rayleigh (elastic), Brillouin, and Raman scattering [
16].
Among the main methods of optical reflectometry that are utilized for distributed measurements are Optical Time Domain Reflectometry (OTDR) and Optical Frequency Domain Reflectometry (OFDR). The principle of operation for OTDR involves introducing optical pulses into the optical fiber and detecting the intensity of reflected and scattered light based on the delay time between the injected and reflected signals. In contrast, OFDR uses a continuous wave (CW) tunable laser source (TLS), the optical signal from which, after passing through the reference and measuring arms of the interferometer, is mixed and detected using a photodetector. By applying the Fast Fourier Transform (FFT) to the received optical signal, it is possible to obtain the intensity distribution of the reflected and scattered light along the length of the optical fiber [
17].
Among distributed FOSs, the method based on measuring the spectral shift in Rayleigh backscattering via OFDR with the addition of polarization measurements has the best spatial resolution, which makes it possible to carry out distributed measurements of strain and temperature using a standard single-mode optical fiber [
18].
Measurements using point FBG sensors are based on the analysis of the resonant wavelength of the reflected spectrum. The most common method of simultaneous interrogation of multiple FBGs on a single optical fiber is Wavelength Division Multiplexing (WDM), where each FBG corresponds to a specific section of the interrogator’s operating wavelength range. This approach limits the maximum possible number of simultaneously interrogated FBGs to the width of the wavelength range of the interrogator channel [
19]. There are studies related to the use of OTDR and OFDR methods for interrogating a large number of weakly reflecting FBGs, which can increase the number of interrogated FBGs by up to several thousand [
20,
21,
22]. When using these methods, addressing the spectral shadowing effect becomes important [
23,
24]. The use of optical fibers with a large number of weak reflection FBGs instead of standard telecommunication optical fibers, in which Rayleigh scattering is measured, has a number of advantages. The larger reflection amplitude in this case improves the registration of strain at a higher sampling rate. However, it significantly increases the cost of optical fiber production [
25].
Despite the evident benefits of distributed strain measurement systems using the OFDR method based on Rayleigh scattering, these systems significantly fall behind traditional FBG interrogators employing WDM in terms of sensor sampling rate (hundreds of Hz versus several kHz) [
26]. The combination of both methods for strain measurement on a single optical fiber may allow to use the distinctive advantages of each method: a high sampling rate for point sensors located in critical sections of the monitored structure using WDM of FBGs, and a high spatial resolution for distributed FOSs based on Rayleigh scattering by OFDR.
The problem of correspondence between the readings of point and distributed FOSs is significant for their practical application. In [
27], on the example of full-scale fatigue and crack growth tests, the authors demonstrated that strain measurements conducted using distributed FOSs based on Rayleigh scattering are in good agreement with the readings of point FBG sensors and classical foil strain gages in areas with moderate strain gradients. However, measuring strain in regions with high strain gradients using distributed FOSs becomes challenging and may result in information loss due to the complexity of cross-correlation analysis. In [
28], various parameters affecting the reliability of strain measurements using distributed FOSs based on Rayleigh scattering in cases of gradient strain distribution along an optical fiber are considered. A close correspondence between point and distributed FOSs is demonstrated when selecting the optimal sensor gage length. In [
29], an approach is proposed for calibrating distributed FOS readings based on a finite number of point FBG sensor measurements.
Typically, comparisons of point and distributed FOSs are conducted on different optical fibers located near each other, but not in the same location, which may lead to differences in the stress–strain state in the area where the sensors are placed. A more reliable comparison would involve using two measuring systems on a single optical fiber, ensuring full compliance with the stress–strain state in the region where the FOSs are located.
In practical applications of strain measurement via point FOSs, it becomes particularly necessary to estimate the strain distribution in the vicinity of FBG locations, especially when measuring gradient strain fields. Distributed fiber-optic sensors based on Rayleigh scattering can address this issue by providing high spatial resolution in strain measurement.
This paper addresses the challenges of strain measurement using distributed FOSs based on Rayleigh scattering in the presence of fiber Bragg gratings with a reflection coefficient of 70% in the measured optical fiber. This situation can lead to significant noise in the measuring signal or the emergence of insensitive zones where strain is not determined. To overcome these issues, an approach is proposed that involves applying the Hann window function to the primary signal recorded with the detector of an optical backscatter reflectometer and selecting a scanning range that excludes resonant FBG wavelengths.
2. Materials and Methods
An FBG recorded in a single-mode optical fiber enables the measurement of strain and temperature at the grating location based on an analysis of the shift in the resonant wavelength of the optical spectrum reflected by the grating. Multiple FBGs with different resonant wavelengths can be recorded on a single optical fiber, allowing for the simultaneous interrogation of all gratings using the WDM method. This approach enables strain measurement at various points of a structure when the optical fiber is attached to its surface or embedded within the material.
The maximum number of measurement points is limited by the spectral wavelength range of the FBG sensor interrogation system (interrogator). Increasing the number of FBGs in the optical fiber results in a reduced strain measurement range for each sensor. The most optimal configuration includes 10–15 FBGs per interrogator channel, which can significantly limit the ability to assess gradient strain field distributions. This number of FBGs in the optical fiber provides a strain measurement range of ±(2500–4100) microstrain for each sensor. In this study, 5 mm long FBGs that have a reflection coefficient of 70% and feature a main peak width of 0.25 nm in the reflected spectrum written using the phase mask method are considered.
In contrast to point FOSs based on FBGs, where only a small region of the optical fiber containing the written grating is sensitive to changes in strain and temperature, distributed FOS utilize the entire length of the optical fiber as a sensitive element. Among the fiber-optic methods for distributed strain measurement, the approach based on Rayleigh scattering measurement using OFDR offers the best spatial resolution.
Rayleigh scattering along the optical fiber arises as a result of the interaction of the injected light with inhomogeneities in the optical fiber, the size of which is smaller than the wavelength of the input radiation. The scattering distribution, unique for each fiber under test, remains constant from measurement to measurement, provided there is no external influence.
To conduct measurements using a backscatter reflectometer, a specific section of the fiber is selected on the reflectogram of the fiber under test (FUT). This selected area is divided into sub-regions of a predefined length (gage length) with a certain spacing (distance between sensors), which can be considered as individual sensors. In this case, the sub-regions may overlap, and the center of each sub-region represents one of the points on the distributed measurement diagram for strain or temperature.
When an external influence (strain, temperature) affects the optical fiber, the signal shifts in the frequency domain relative to the reference signal for each of the sub-regions. To calculate strain or temperature, the spectral shift within a specific window is estimated relative to the reference signal via cross-correlation analysis. The spectrum shift (
) of the measured sub-region of the optical fiber is similar to the spectrum shift or the resonant wavelength shift (
) of the Bragg grating and is related to the change in strain and temperature as follows:
where
and
are the temperature and strain sensitivity coefficients. For most germanium-doped silica glass optical fibers
.
With a constant strain in the measured section of the optical fiber, the temperature change can be expressed as:
where
is the central scanning wavelength, which is the midpoint wavelength of the applied wavelength scanning range of the tunable laser source and
c is the speed of light in a vacuum.
Similarly, the change in strain, considering temperature compensation, can be expressed as:
where
is the spectral shift measured in the section of the optical fiber that does not experience a change in mechanical strain.
Utilizing an optical fiber with recorded FBGs for strain measurement enables the combination of the advantages of two types of fiber-optic sensors: point FOSs based on FBGs and distributed FOSs. Point FOSs, due to their higher sampling rate, allow for the strain response measurement at FBG locations under dynamic loading on the structure. Distributed FOSs, on the other hand, provide the measurement of strain distribution under the static loading of the structure with high spatial resolution.
Performing distributed measurements in the presence of considered FBGs in an optical fiber can be challenging due to the high reflectivity of FBGs at wavelengths within the scanning range of the TLS of a backscatter reflectometer. The presence of such FBGs in the measuring optical fiber is common for many operational objects in which the measurement system is already installed and cannot be modified.
The following section presents the results of experiments on distributed strain measurement under the uniaxial tension of an optical fiber with varying numbers of FBGs recorded in it. Distributed strain measurements based on Rayleigh scattering were conducted using an OBR4600 reflectometer from Luna Innovations.
3. Results and Discussion
Under the uniaxial tension of an optical fiber not attached to the material, a uniform strain distribution is formed along its axis.
Figure 1 displays a strain distribution plot obtained via OBR4600 in the presence of a 5 mm long FBG in the measurement area. The resonant wavelength of the FBG is 1520 nm, and the scanning range of the optical backscatter reflectometer was selected outside the main reflective peak of the FBG, specifically in the range 1589–1611 nm.
The obtained results showed that using a reflectometer scanning wavelength range outside the FBG resonant wavelength led to the emergence of insensitive areas of 20 mm length in the measured strain distribution along the optical fiber in the vicinity of the FBG location. However, strain readings are preserved within the FBG zone.
The case of distributed strain measurement using an optical fiber with multiple FBGs holds particular practical significance, since it enables the supplementation of strain data obtained using point sensors with strain distribution information in the vicinity of the FBGs, as well as the estimation of the strain distribution in other sections of the optical fiber.
The experiment was carried out by applying tension load to three sections of an optical fiber, two of which are outside the FBG location zone, according to the scheme in
Figure 2. One section includes five FBGs, each 5 mm long, with a distance of 10 mm between centers and resonant wavelengths of 1520.4, 1535.2, 1549.9, 1564.7, and 1579.9 nm, respectively.
It is important to note that the choice of the scanning range affects the spatial resolution of the measured reflectograms Δ
z and the maximum strain measurement range
in accordance with the following relations [
30,
31]:
where
is the initial scanning wavelength and
is the final scanning wavelength of the TLS. Thus, a larger scan range allows for better spatial resolution and the measurement of higher strain levels.
In this regard, when stretching an optical fiber with five FBGs, the maximum possible range of reflectometer scanning wavelengths of 1530–1613 nm was selected (red area in
Figure 2). The result of the distributed strain measurement for this experiment is illustrated in
Figure 3.
The inclusion of resonant wavelengths in the scanning range of the TLS results in a noise level within the strain distribution not allowing us to isolate the useful signal.
Selecting a scanning range of 1591–1613 nm, which does not include any of the resonant FBG wavelengths, as shown in
Figure 4, enables the acquisition of the tensile strain distribution of the three sections of the optical fiber, as depicted in
Figure 5. It is important to note that a reduction in the scanning range results in a decrease in the strain measurement range.
The strain distribution in the loaded sections of an optical fiber that does not contain FBGs exhibits the expected uniform character. Similar to the case with one FBG considered earlier, the loaded section with five FBGs contains insensitive zones in the vicinity of the FBGs. The strain distribution in this section is shown in
Figure 6, where the zones of FBG location along the length of the optical fiber are marked in red.
The maximum length of the insensitive zone was 100 mm, which largely limits the application of the optical fiber with recorded FBGs with the considered optical characteristics for measuring non-uniform strain fields.
The presence of insensitive zones may be attributed to signal smearing resulted from the FFT procedure. In this case, the reflectogram displays a considerable amplitude difference between the sections of Fresnel reflection in the FBG zones and the Rayleigh scattering, due to the high reflectivity of the FBGs used (
Figure 7).
It is well known that using a Discrete Fourier Transform (DFT) for a signal of finite length results in spectral leakage, which is expressed as smearing (broadening) of the spectrum in the frequency domain. This phenomenon occurs because some signal frequencies do not align with the basis functions of the DFT over a given measurement interval, leading to contributions across the entire spectral range. Due to spectral leakage and smearing under the FFT, the Rayleigh scattering regions near FBG locations are suppressed and may exhibit an unstable spectral composition, which is essential for calculating strain through the cross-correlation of the initial and current signals.
To mitigate the spectral leakage associated with a finite measurement interval, the original signal within this interval is multiplied by a window function before applying the DFT. This window function ensures signal continuity at the boundaries of the measurement interval. One of the most widely used window functions is the Hann window, which is defined by the following relation [
32]:
where
n is the sample number and
N is the number of data points.
The windowed discrete Fourier transform of the signal
x(
n) can be written as:
where
X(
k) is the complex transformed signal at frequency index
k, consisting of amplitudes and phases of the basis functions.
Figure 8 demonstrates the effect of the application of windowed Fourier transform on the frequency spectrum of a signal composed of the sum of two harmonic oscillations of different amplitudes but close frequencies.
The application of the Hann window function when measuring the reflectogram using OFDR method helps suppress signal smearing on the reflectogram in the FBG location area. Reflectograms in the FBG location area obtained without (a standard rectangular window is applied) and with the use of the Hann window function are shown in
Figure 9a. The calculation of the strain distribution (
Figure 9c) based on the reflectograms obtained using the windowed Fourier transform eliminates insensitive zones that were present in the original strain distribution (
Figure 9b).
The downside of using a windowed Fourier transform is that, due to the suppression of the original signal in the initial and final sections of the measurement interval, the window function narrows the scanning range. This limitation negatively impacts the maximum strain measurement range .
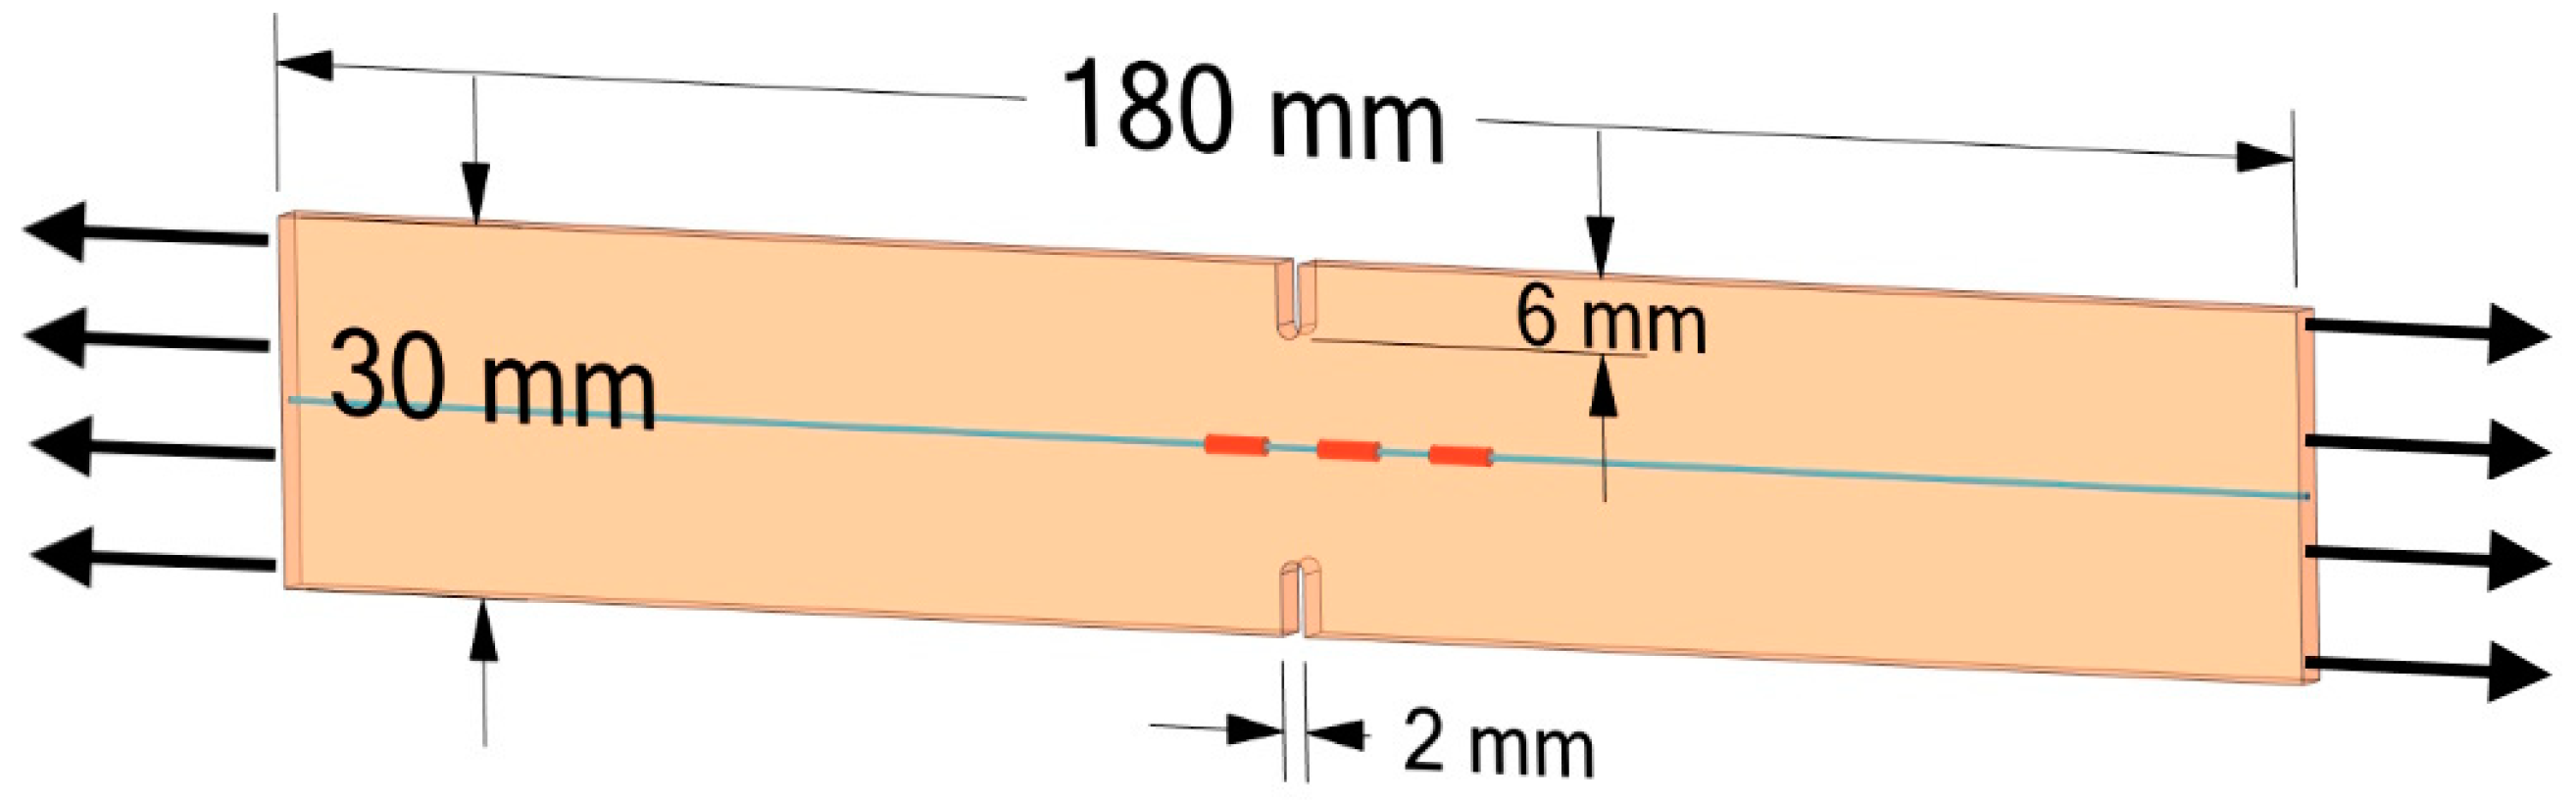
The approach of applying the windowed Fourier transform is demonstrated using an example of a specimen with an embedded optical fiber containing three FBGs in the region of cutouts, as shown in
Figure 10. The presence of cutouts in the specimen results in a non-uniform strain distribution along its length under uniaxial tension.
Figure 11a displays the strain distributions along the length of the specimen, measured using distributed FOS based on Rayleigh scattering at three levels of tensile force. These measurements were conducted using a standard signal processing algorithm without applying the Hann window function and with a scanning range of the TLS that does not include resonant FBG wavelengths. These distributions provide limited information due to the presence of insensitive zones, which do not allow for the assessment of non-uniform changes in strain along the length of the specimen.
Figure 11b presents similar strain distributions obtained using the Hann window function in signal processing.
When using the windowed Fourier transform, it is possible to evaluate the gradient nature of strain distribution along the entire length of the specimen under study. In addition to distributed strain measurements, at each loading stage, strain measurements were conducted using point FBG sensors based on recording the shift of the FBG resonant wavelength with the Hyperion si255 interrogator. The readings of point FOSs are shown in
Figure 11b as green segments, the length of which corresponds to the length of the FBGs used, and the location is determined based on the reflectogram obtained using a backscatter reflectometer. The readings of the two measuring systems are in close agreement with each other.
Combined measurements with point and distributed FOSs on one optical fiber in this study were conducted sequentially by switching the FUT between two interrogation systems (OBR4600 and Hyperion si255) at each loading step. However, the simultaneous interrogation of FBG sensors and distributed FOSs based on Rayleigh scattering is possible. Such a system should employ distinct operational wavelength ranges for point and distributed measurements to prevent interference between them. In the present study, the OBR4600 and the FBG interrogator had overlapping operational wavelength ranges (1530–1613 nm for OBR4600 and 1500–1600 nm for Hyperion si255 FBG interrogator). To separate the distributed interrogation system from the resonant wavelengths of FBGs, the scanning wavelength range of the OBR4600 was narrowed and shifted to longer wavelengths, which consequently reduced the maximum measurement strain range. It is possible to develop an interrogation optical system that utilizes different operational wavelength ranges for distributed and point FOS, the input signals from which would be combined in the fiber under test and the reflected signals would be separated for subsequent analysis.
Despite the advantages of distributed FOSs, FBG interrogation systems still offer superior capabilities for dynamic strain measurements. Additionally, FBG interrogators are more accessible in terms of price and market availability. Therefore, potential applications where both point and distributed sensors are necessary include cases where it is crucial to combine the benefits of both systems: measuring strain with a high acquisition rate at critical points of the structure, which FBG sensors can provide, and simultaneously requiring high spatial resolution to assess the strain distribution in areas with potential strain gradients where damage may occur. This can be essential in aircraft SHM systems, where the structure is subjected to both dynamic and static loads, as well as in SHM systems for civil engineering structures. Another possible application is related to the research and development stage of various products, where distributed FOSs can offer valuable information on the mechanical state of an object under different loads during laboratory tests. However, due to the high cost, it may be more appropriate to install point FBG sensors, calibrated with distributed FOSs, in the final product.


