Research on Indoor Visible Light Location Based on Fusion Clustering Algorithm


Abstract
:1. Introduction
2. Indoor Model and Algorithm Principle
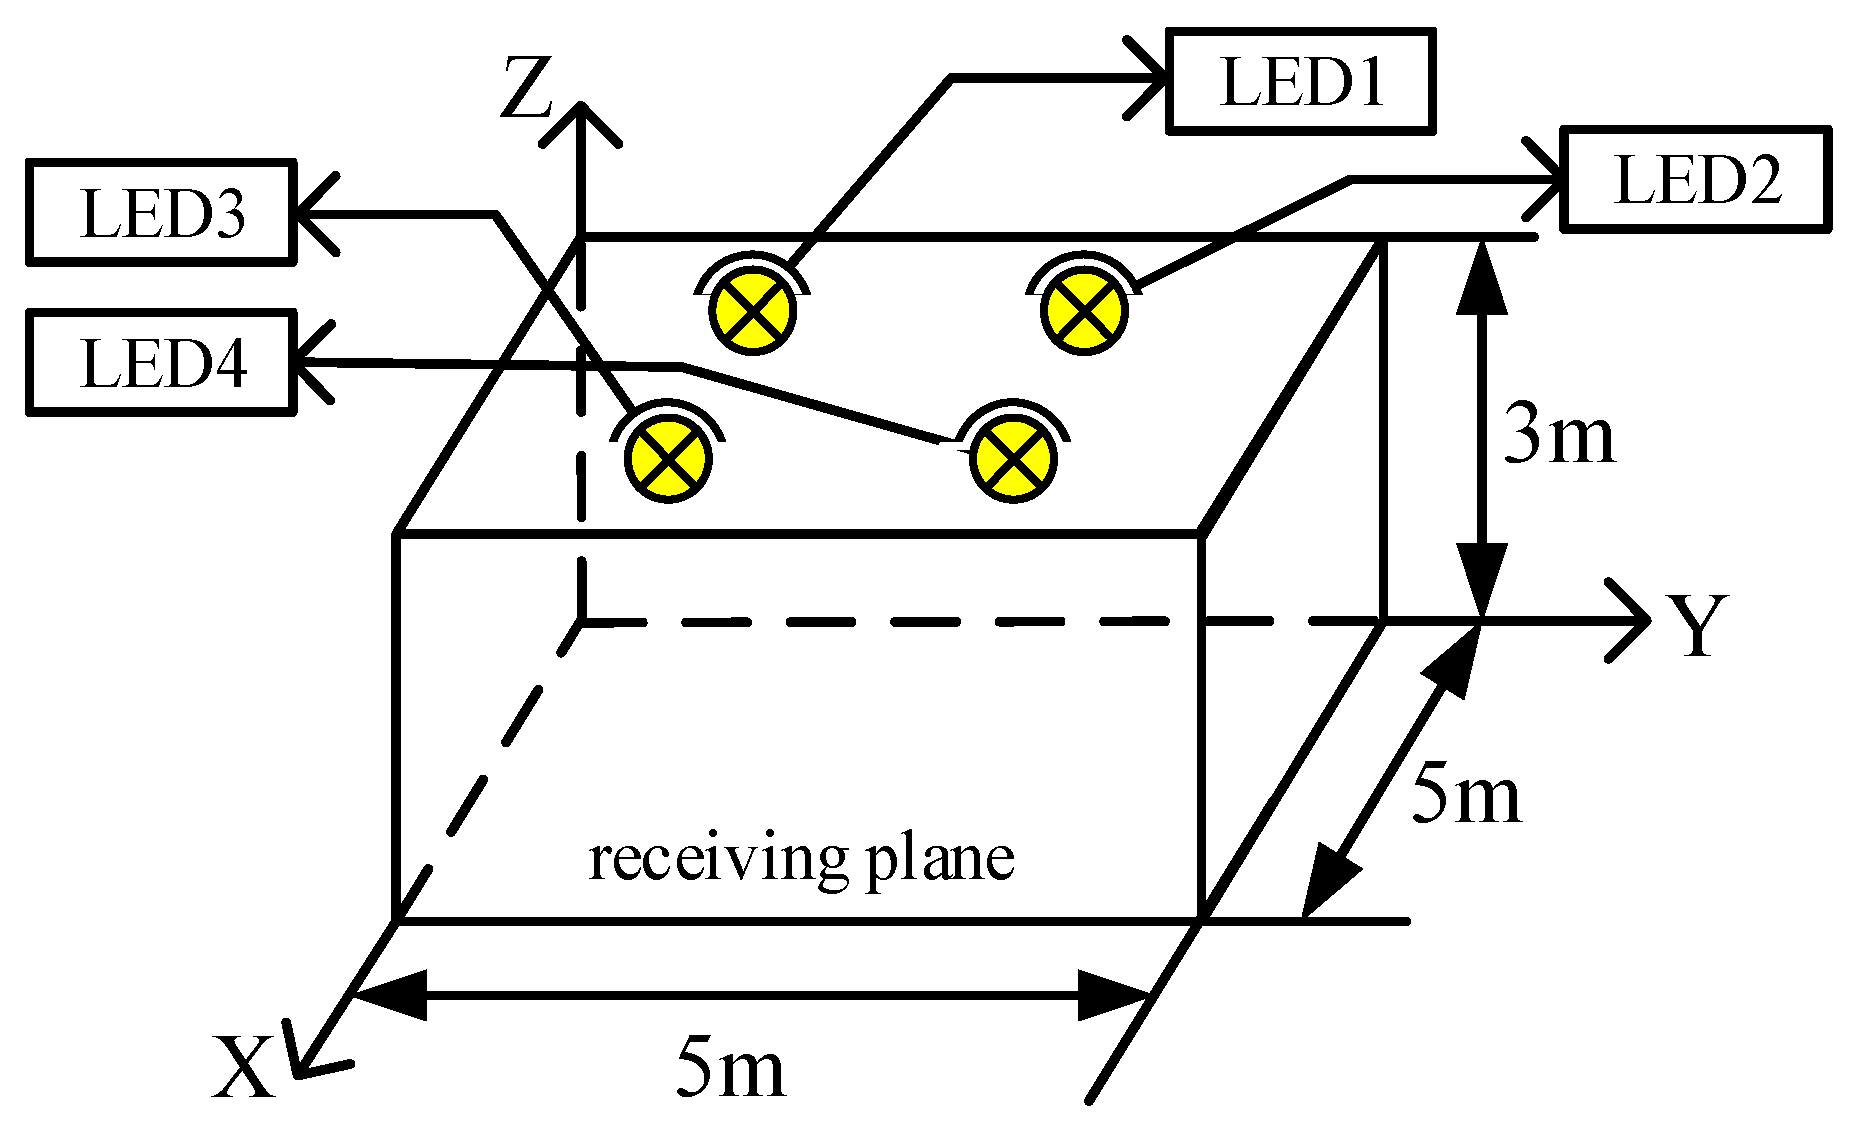
2.1. System Model
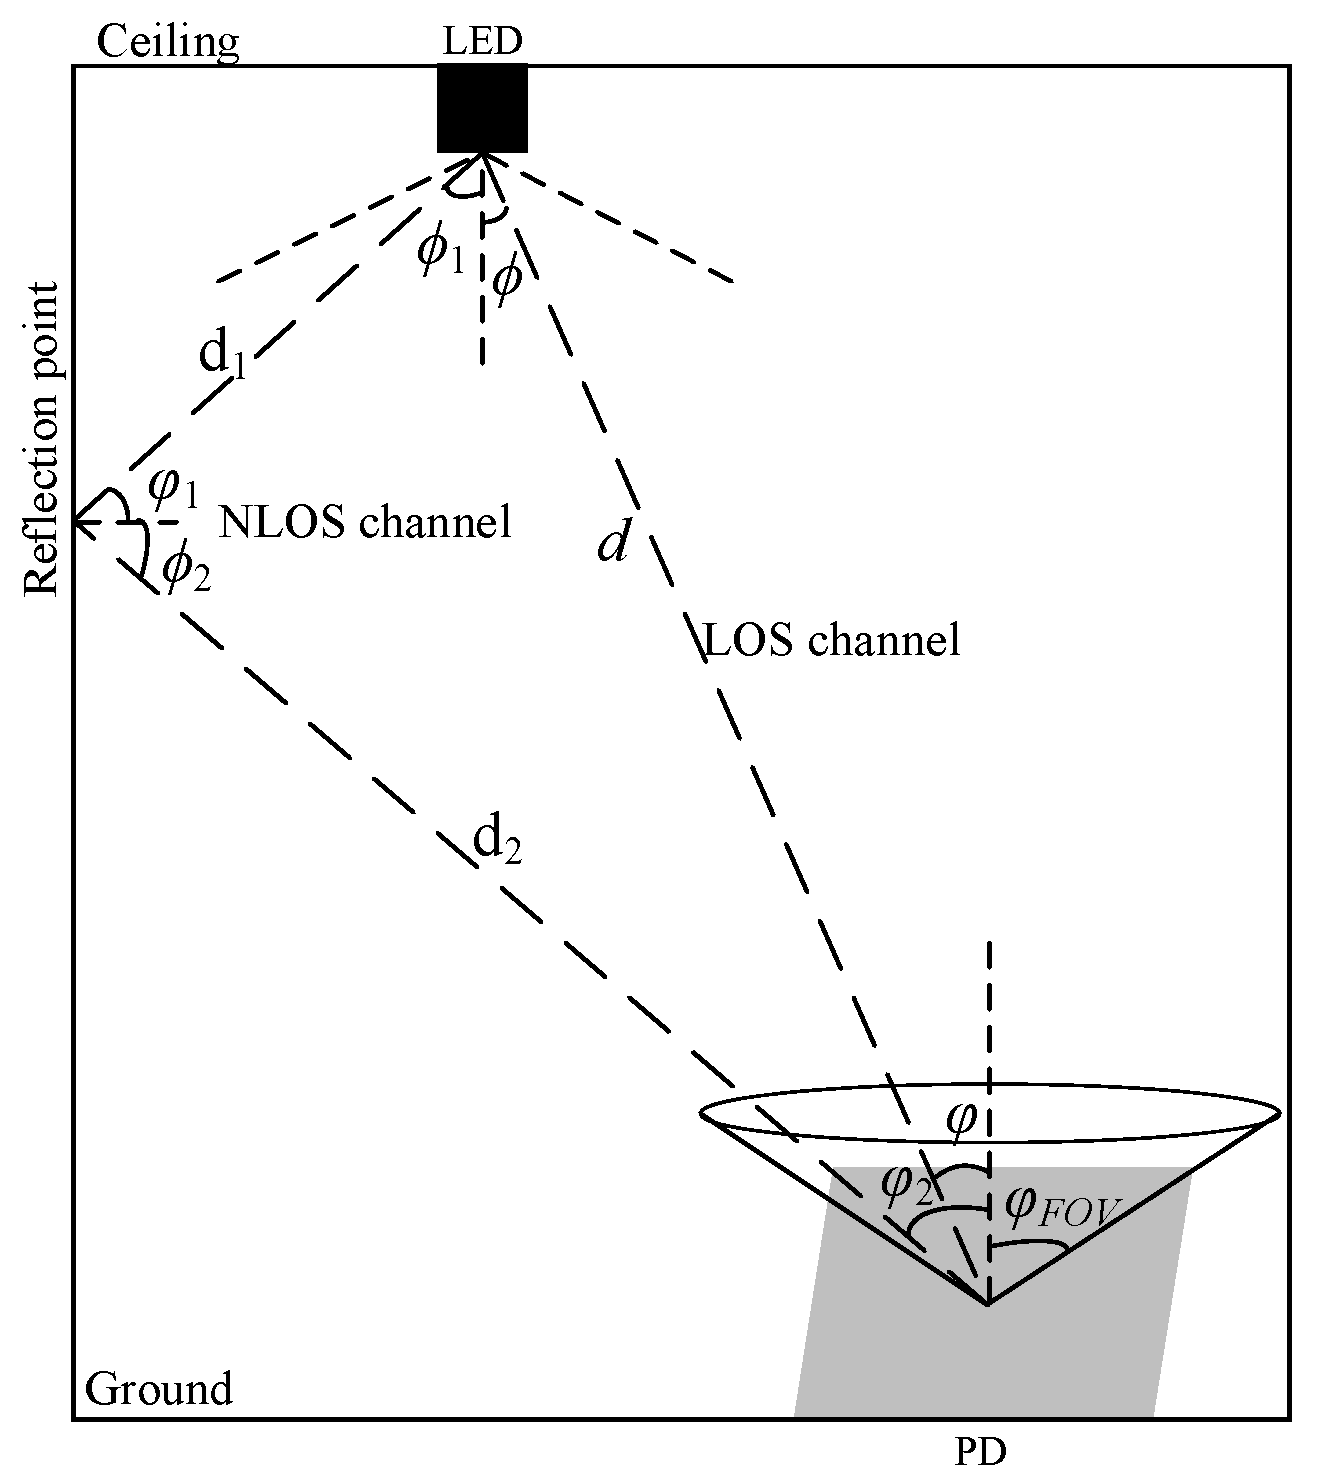
2.2. Channel Model
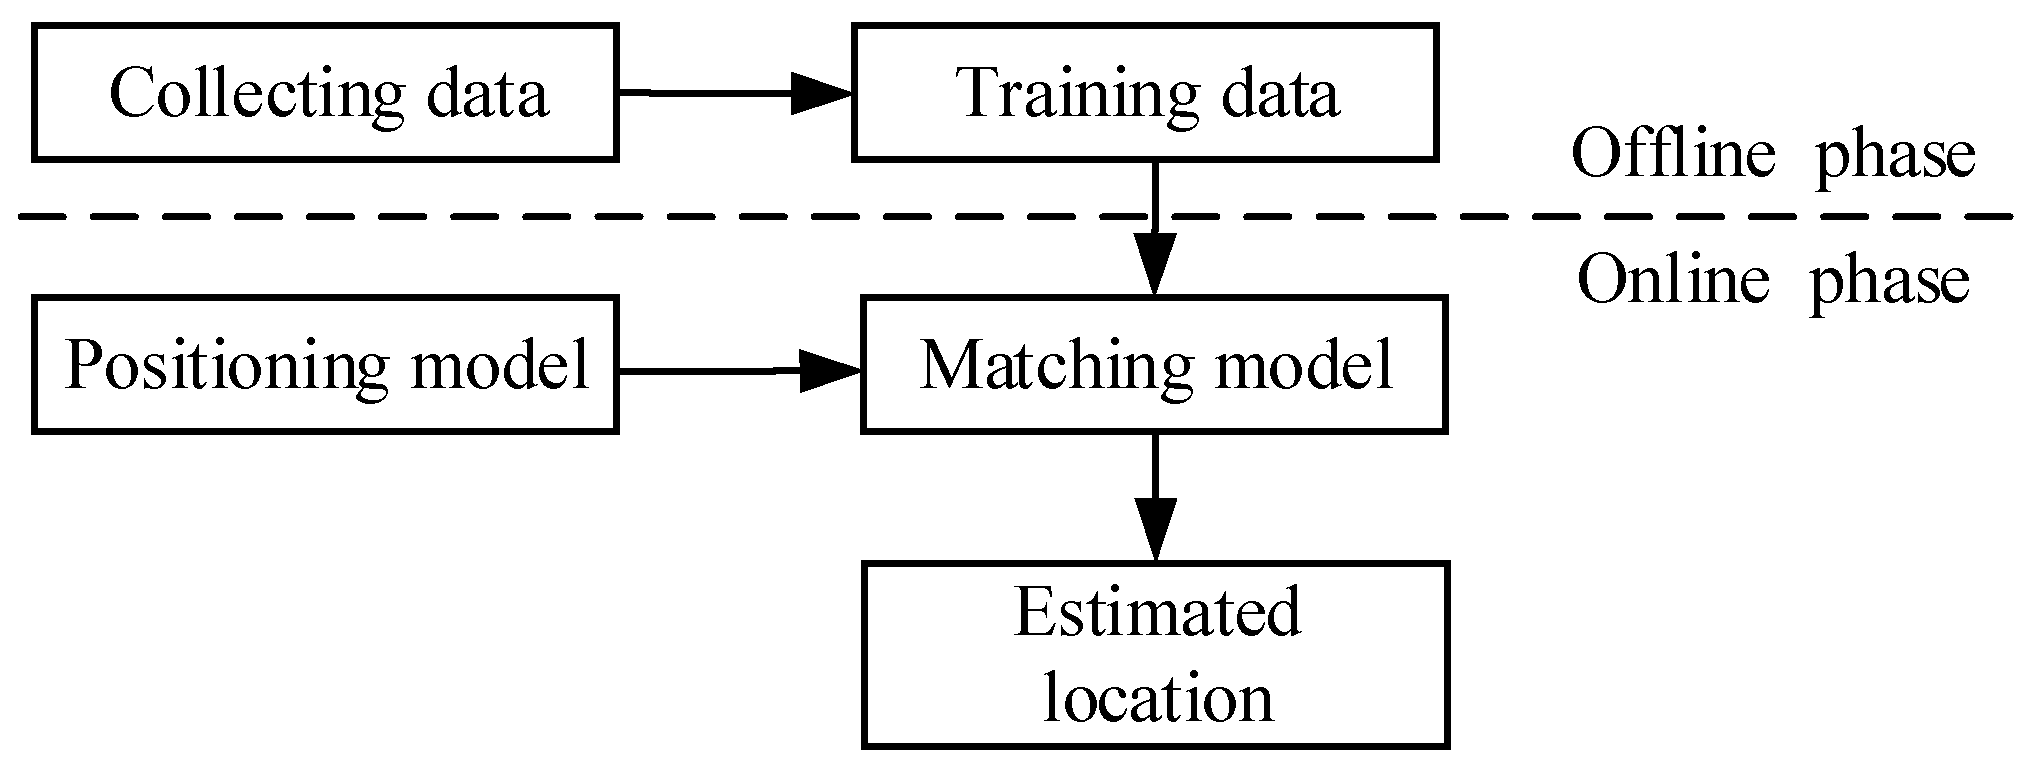
2.3. Fingerprint Location Method
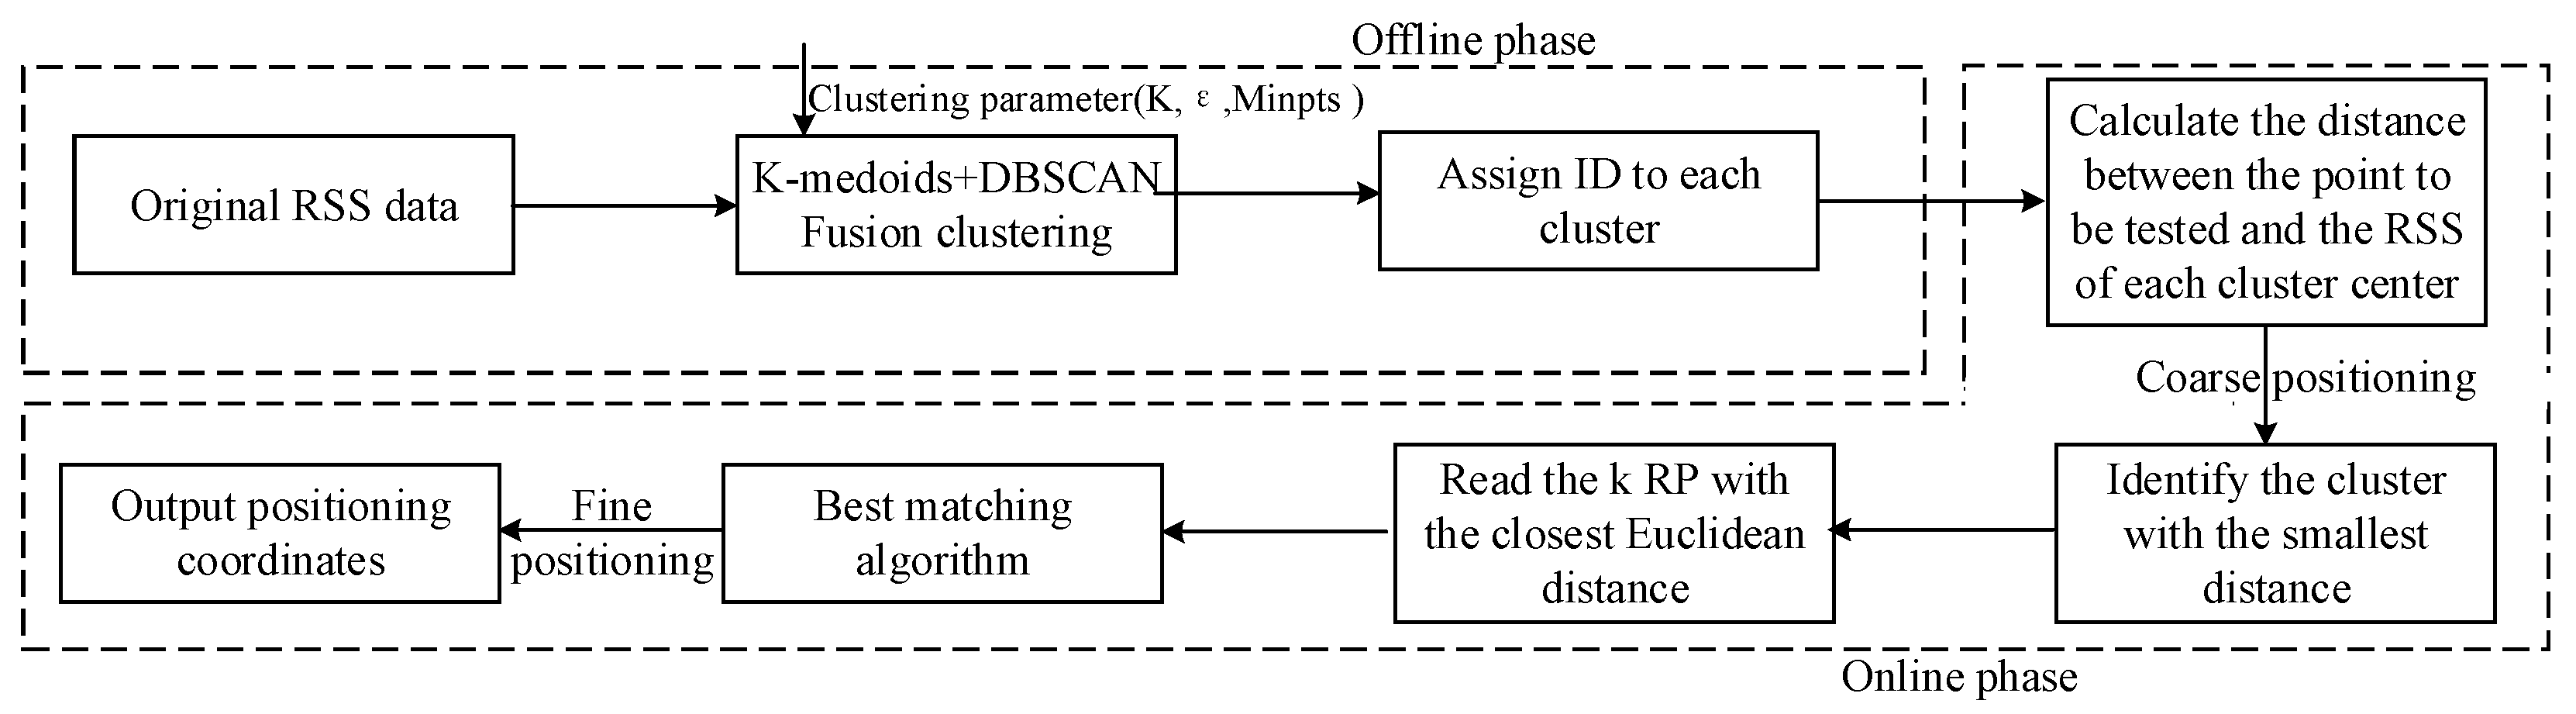
3. Improved Fingerprint Method
3.1. Offline Phase
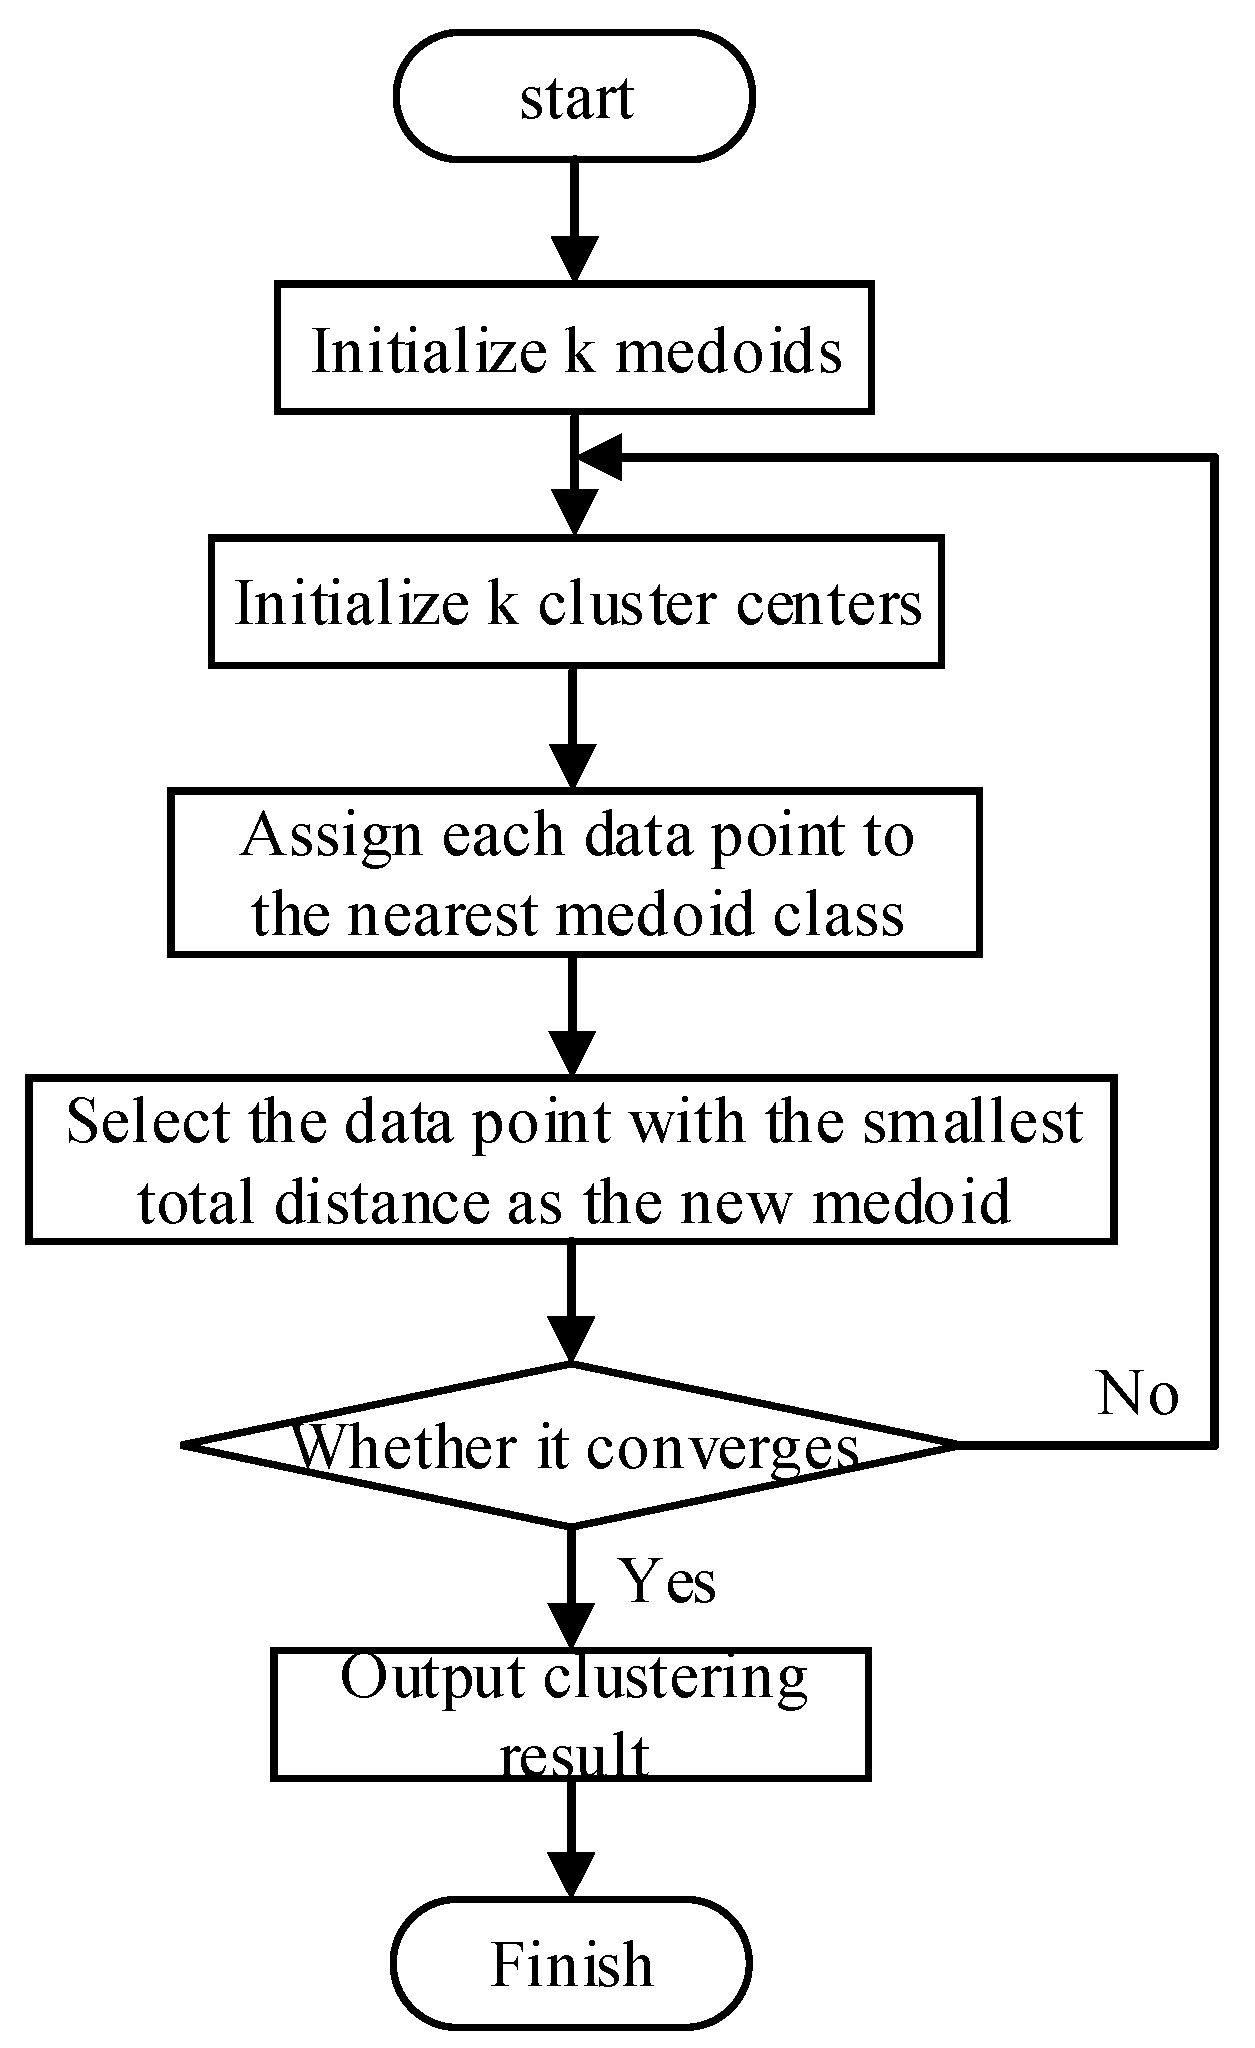
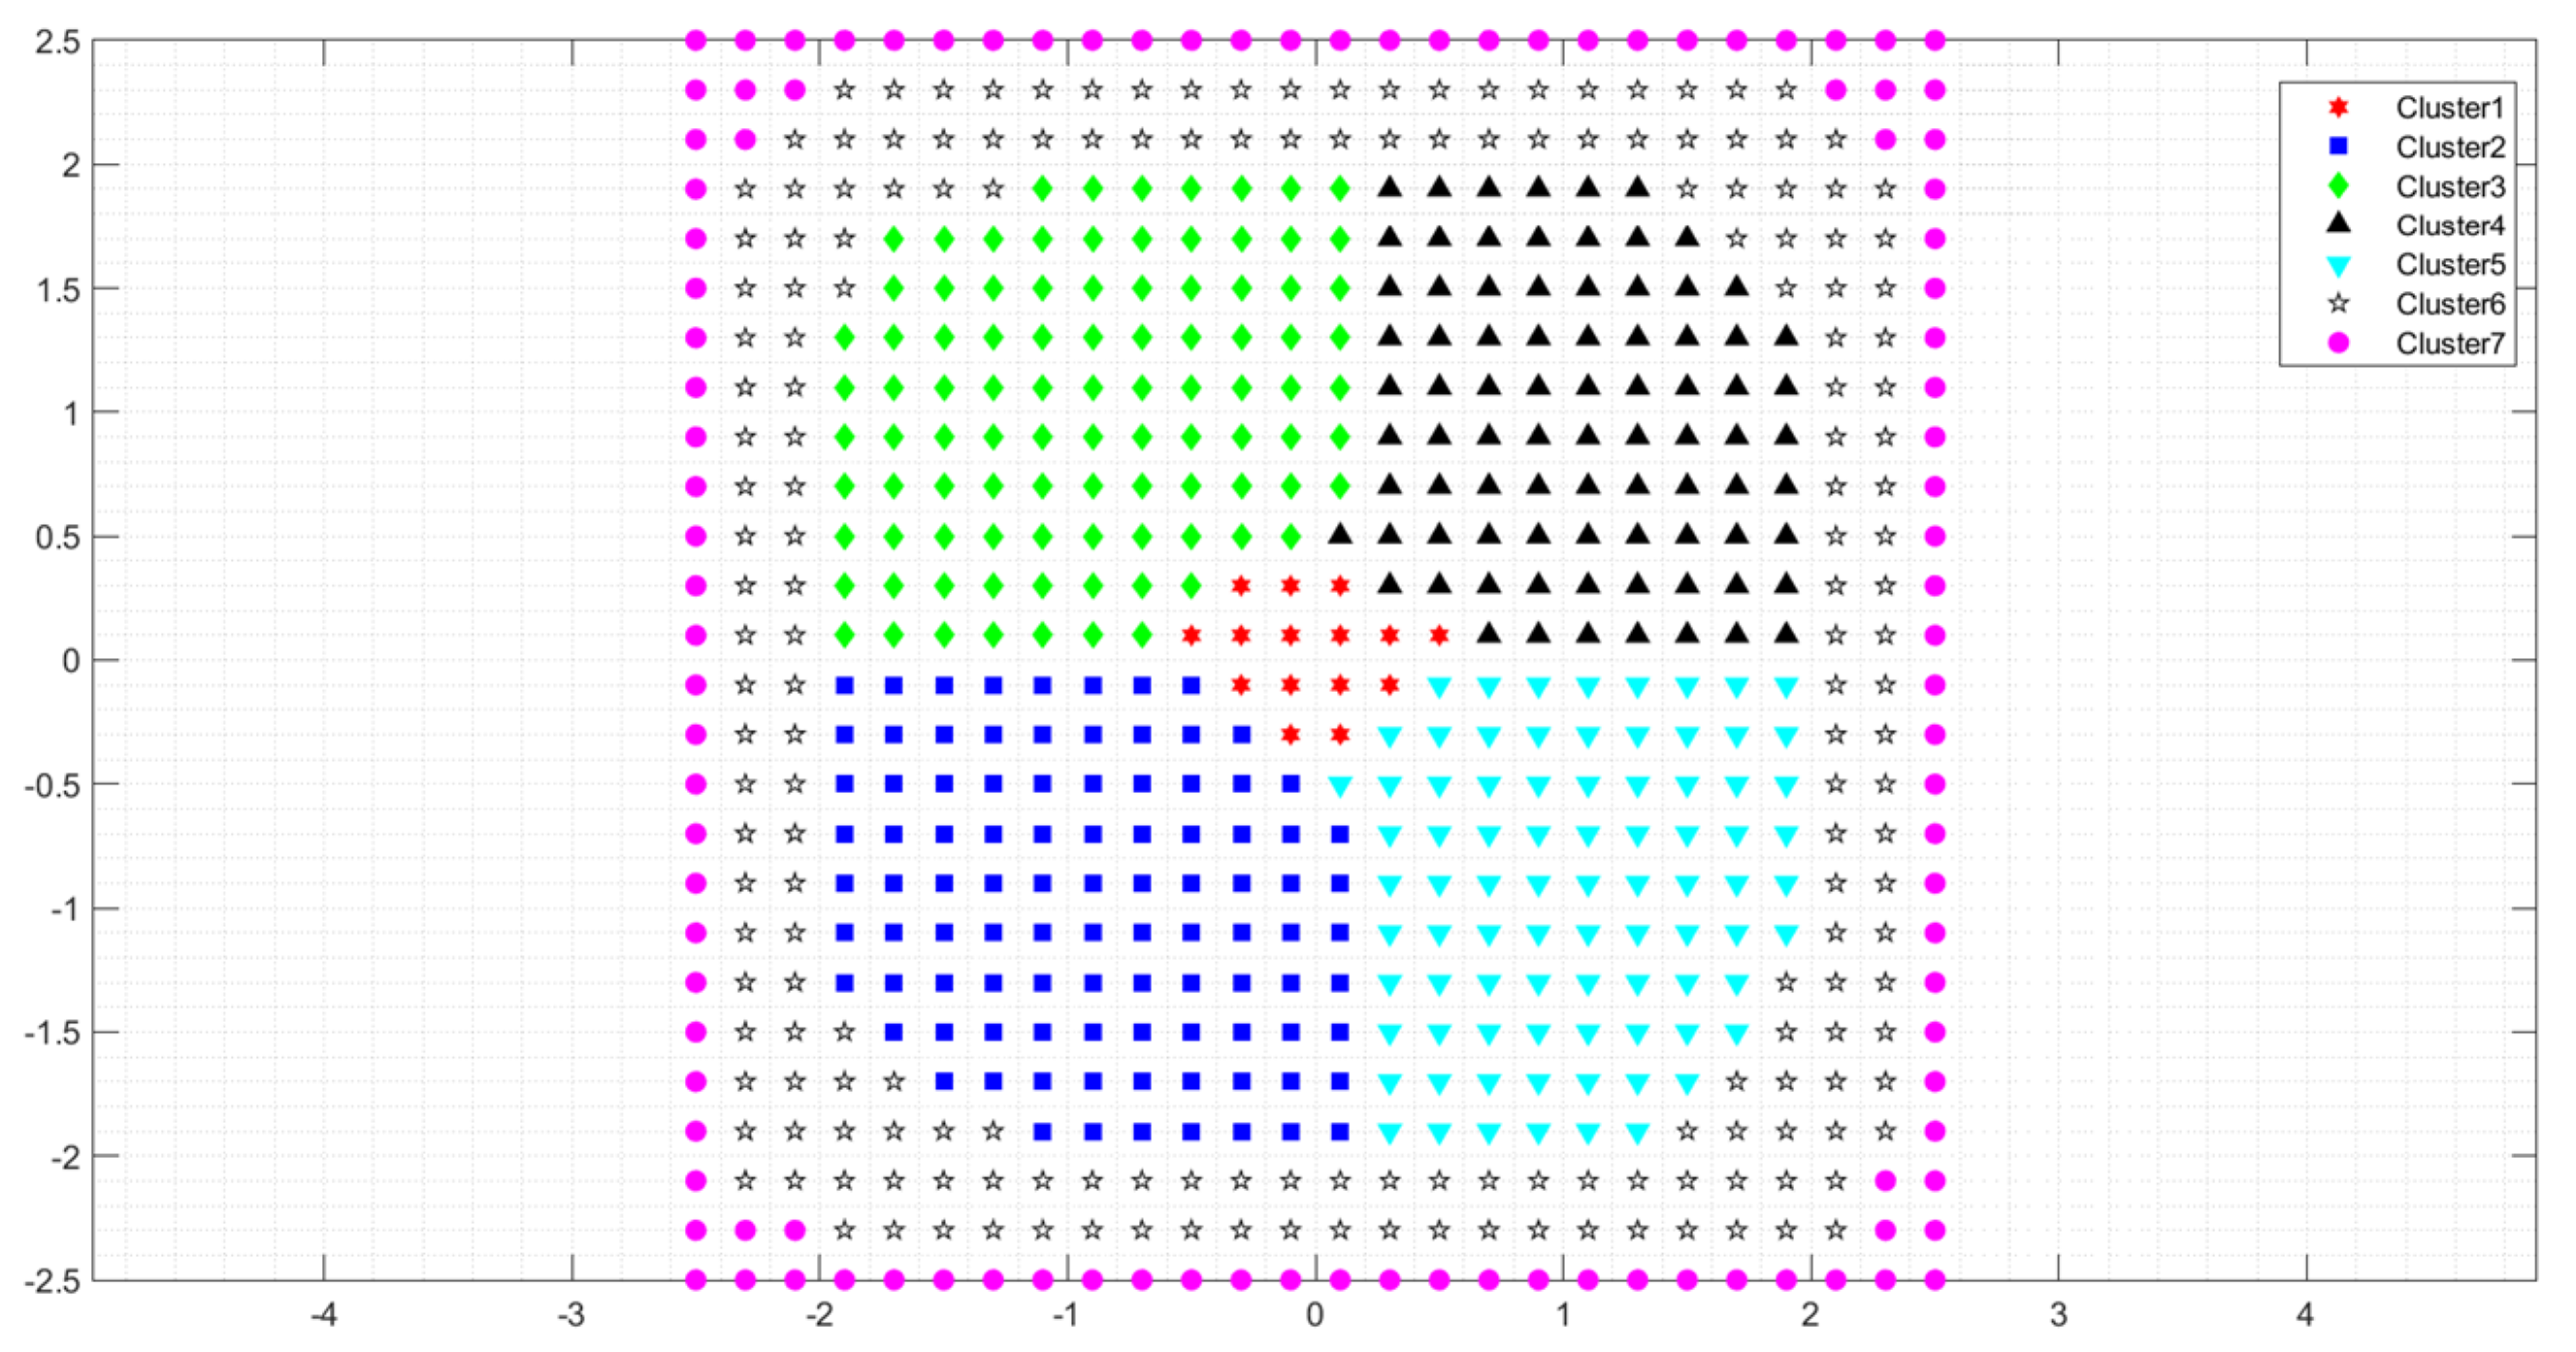
3.1.1. K-Medoids Algorithm
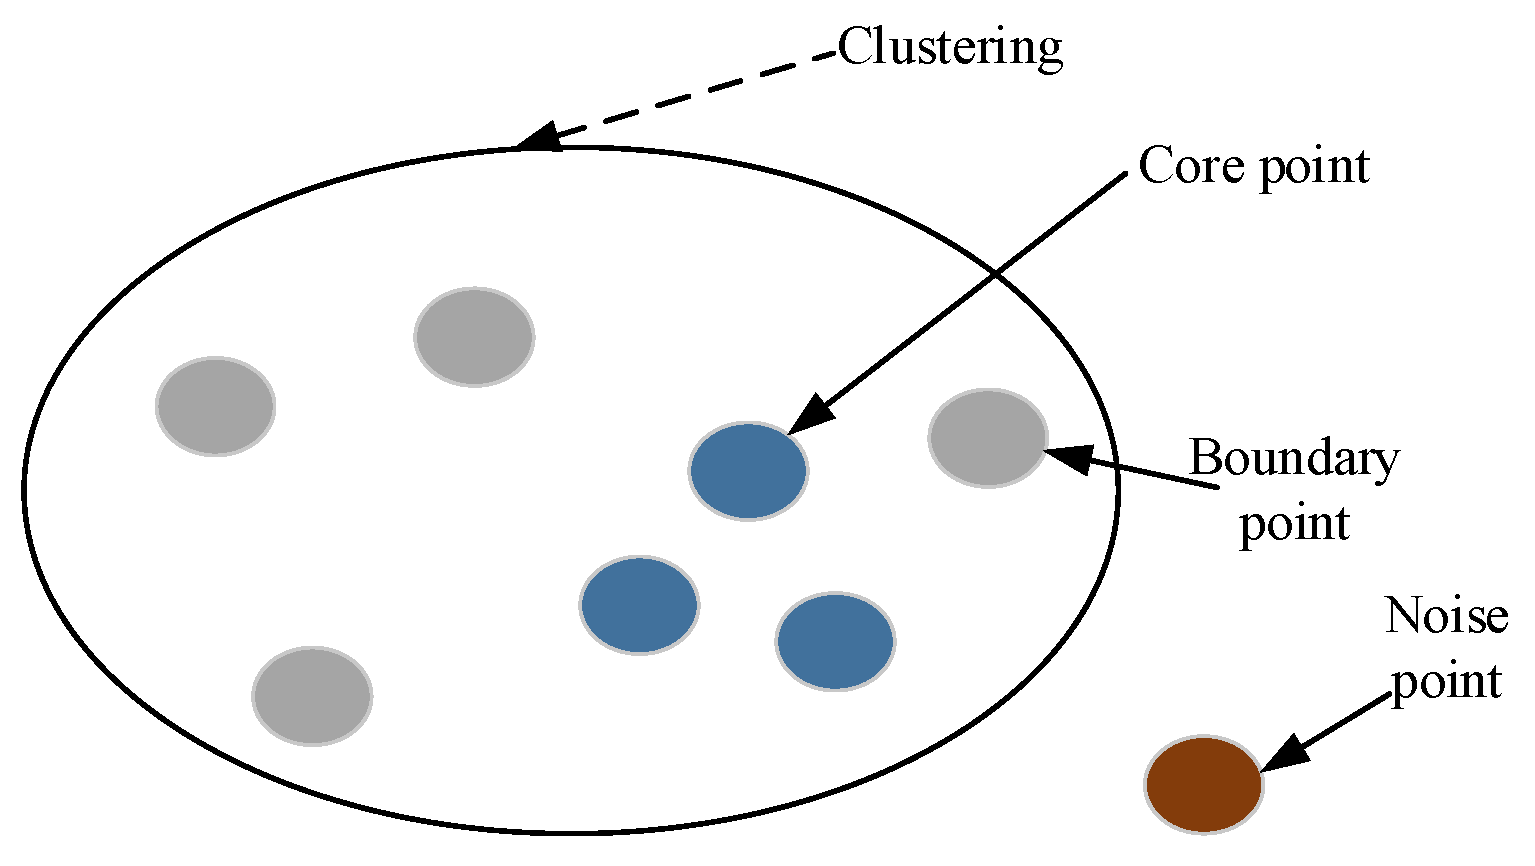
3.1.2. DBSCAN Algorithm
3.2. Online Phase
- The receiver obtains the RSS value and calculates its Euclidean distance di.
- 2.
- Arrange the distances di in ascending order, and find the average value Ed of the nearest K distances.
- 3.
- Compare each distance value di with the average value Ed, remove the distance greater than the average value, record the remaining points as M, and replace the K value in WKNN with M;
- 4.
- Repeat the above process and gradually reduce the value of K to make it closer to the true value. The estimated position coordinates of the target to be located are:where P represents the coordinates of the target to be located, and Li corresponds to the position of i th fingerprint.
4. Simulation Verification and Discussion
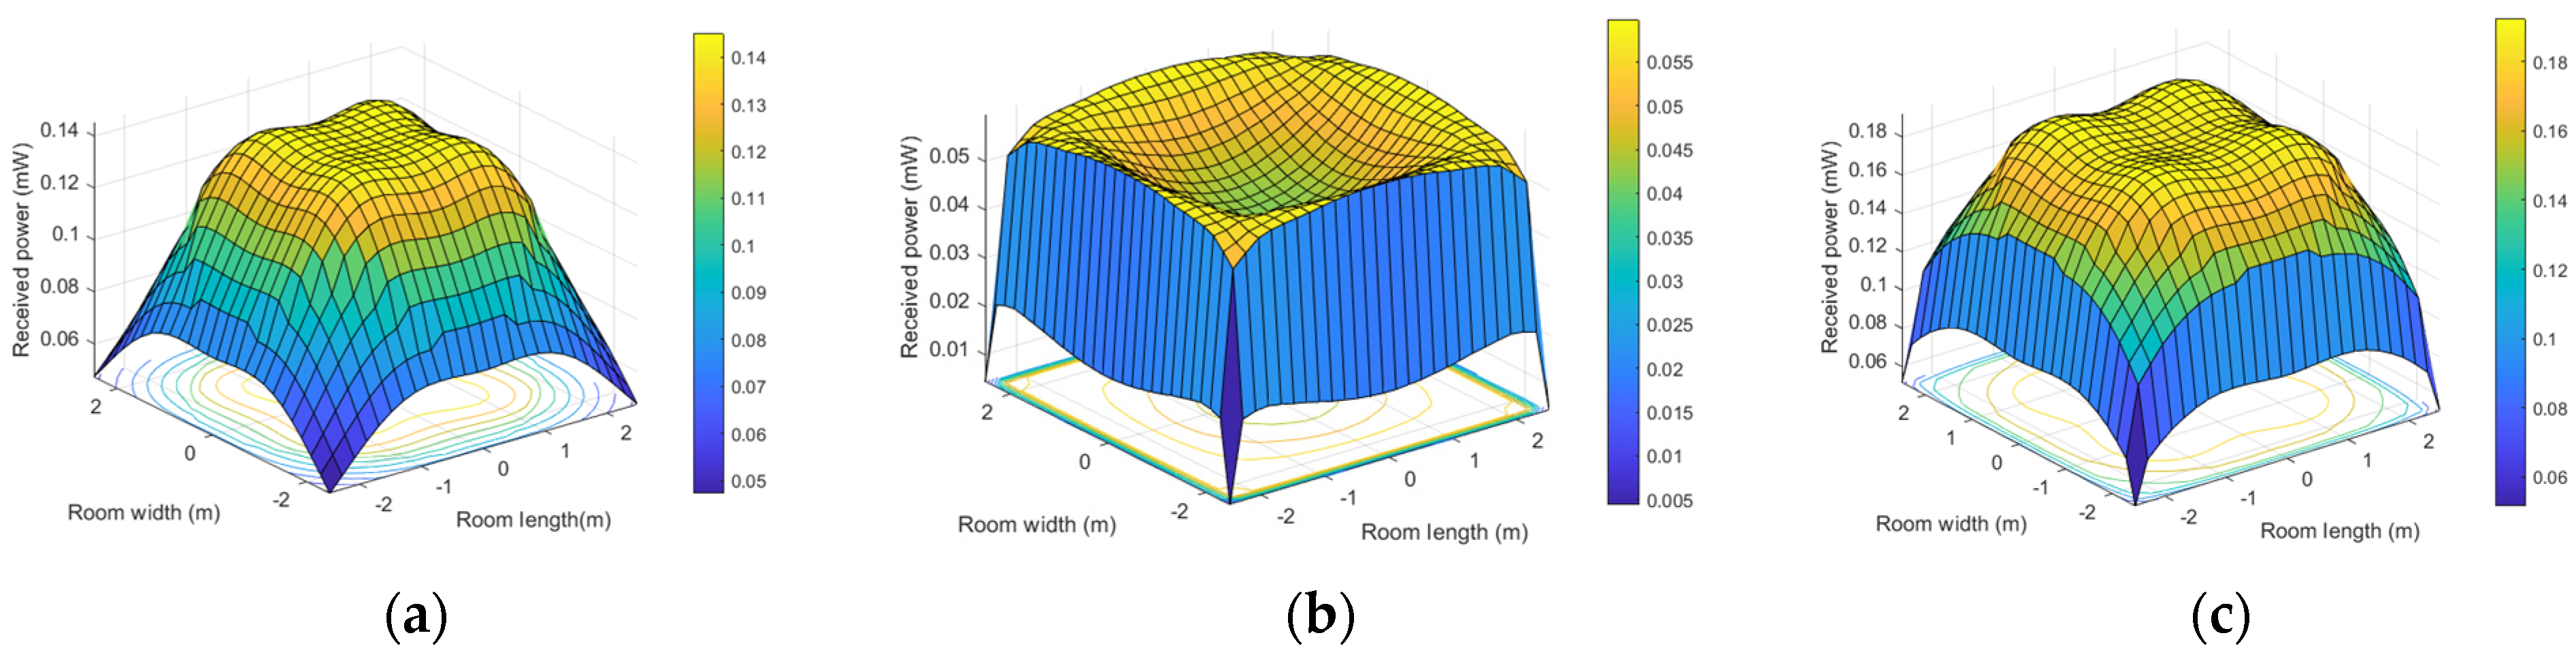
4.1. Fingerprint Method
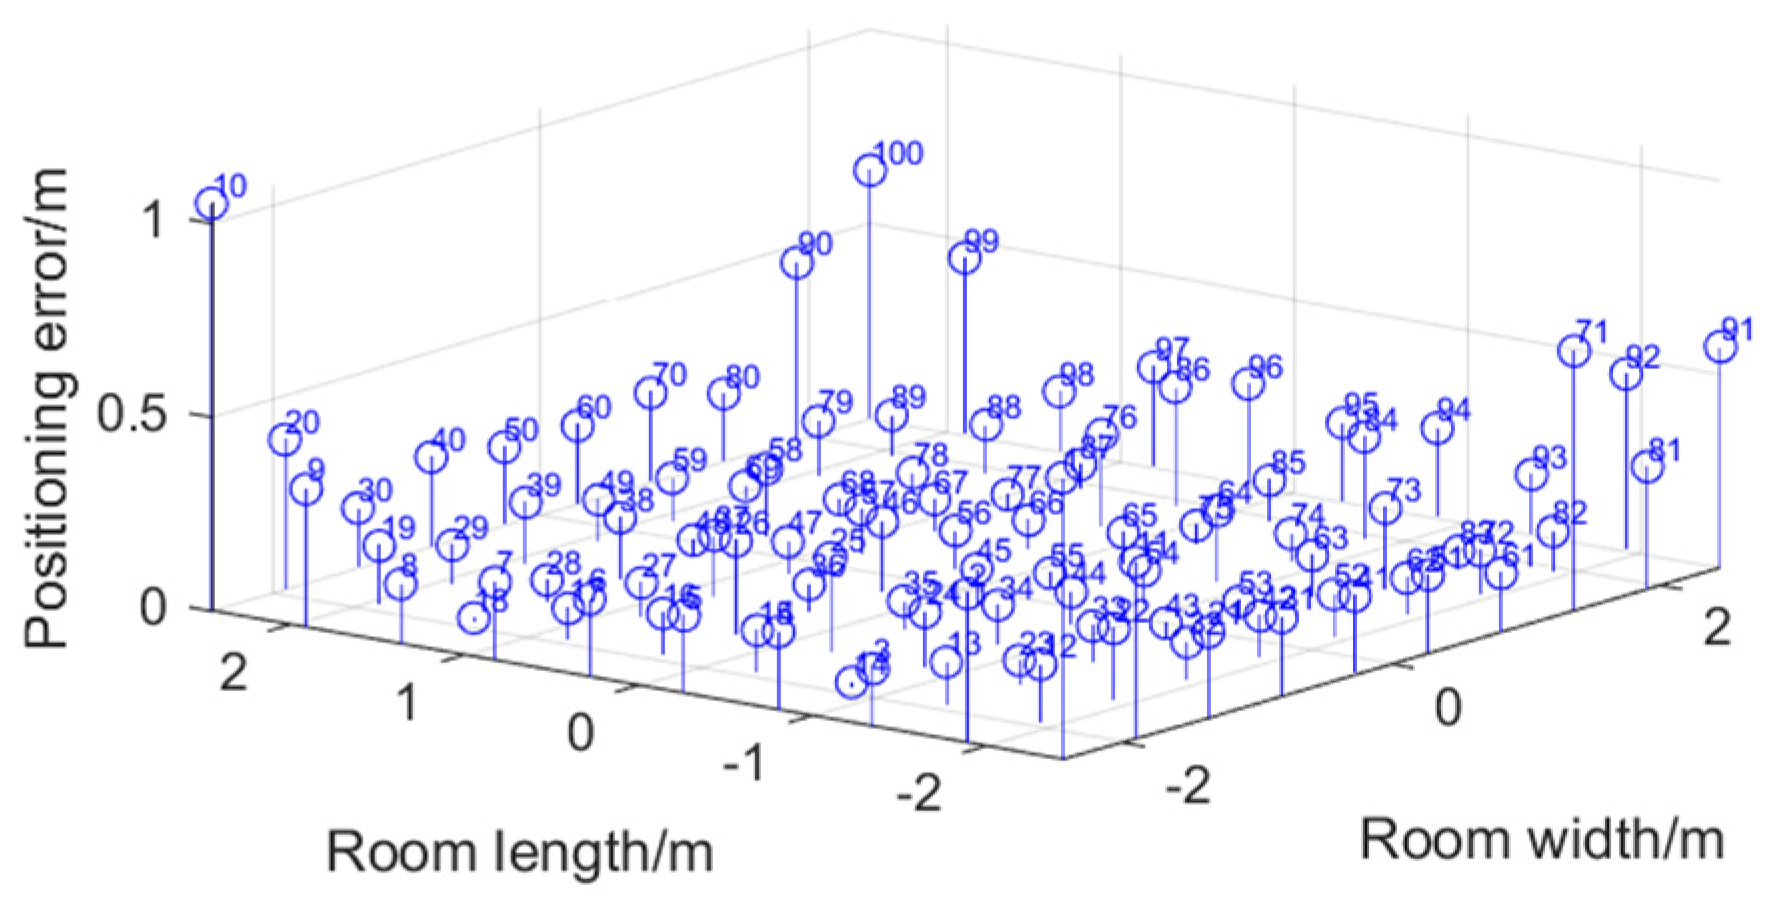
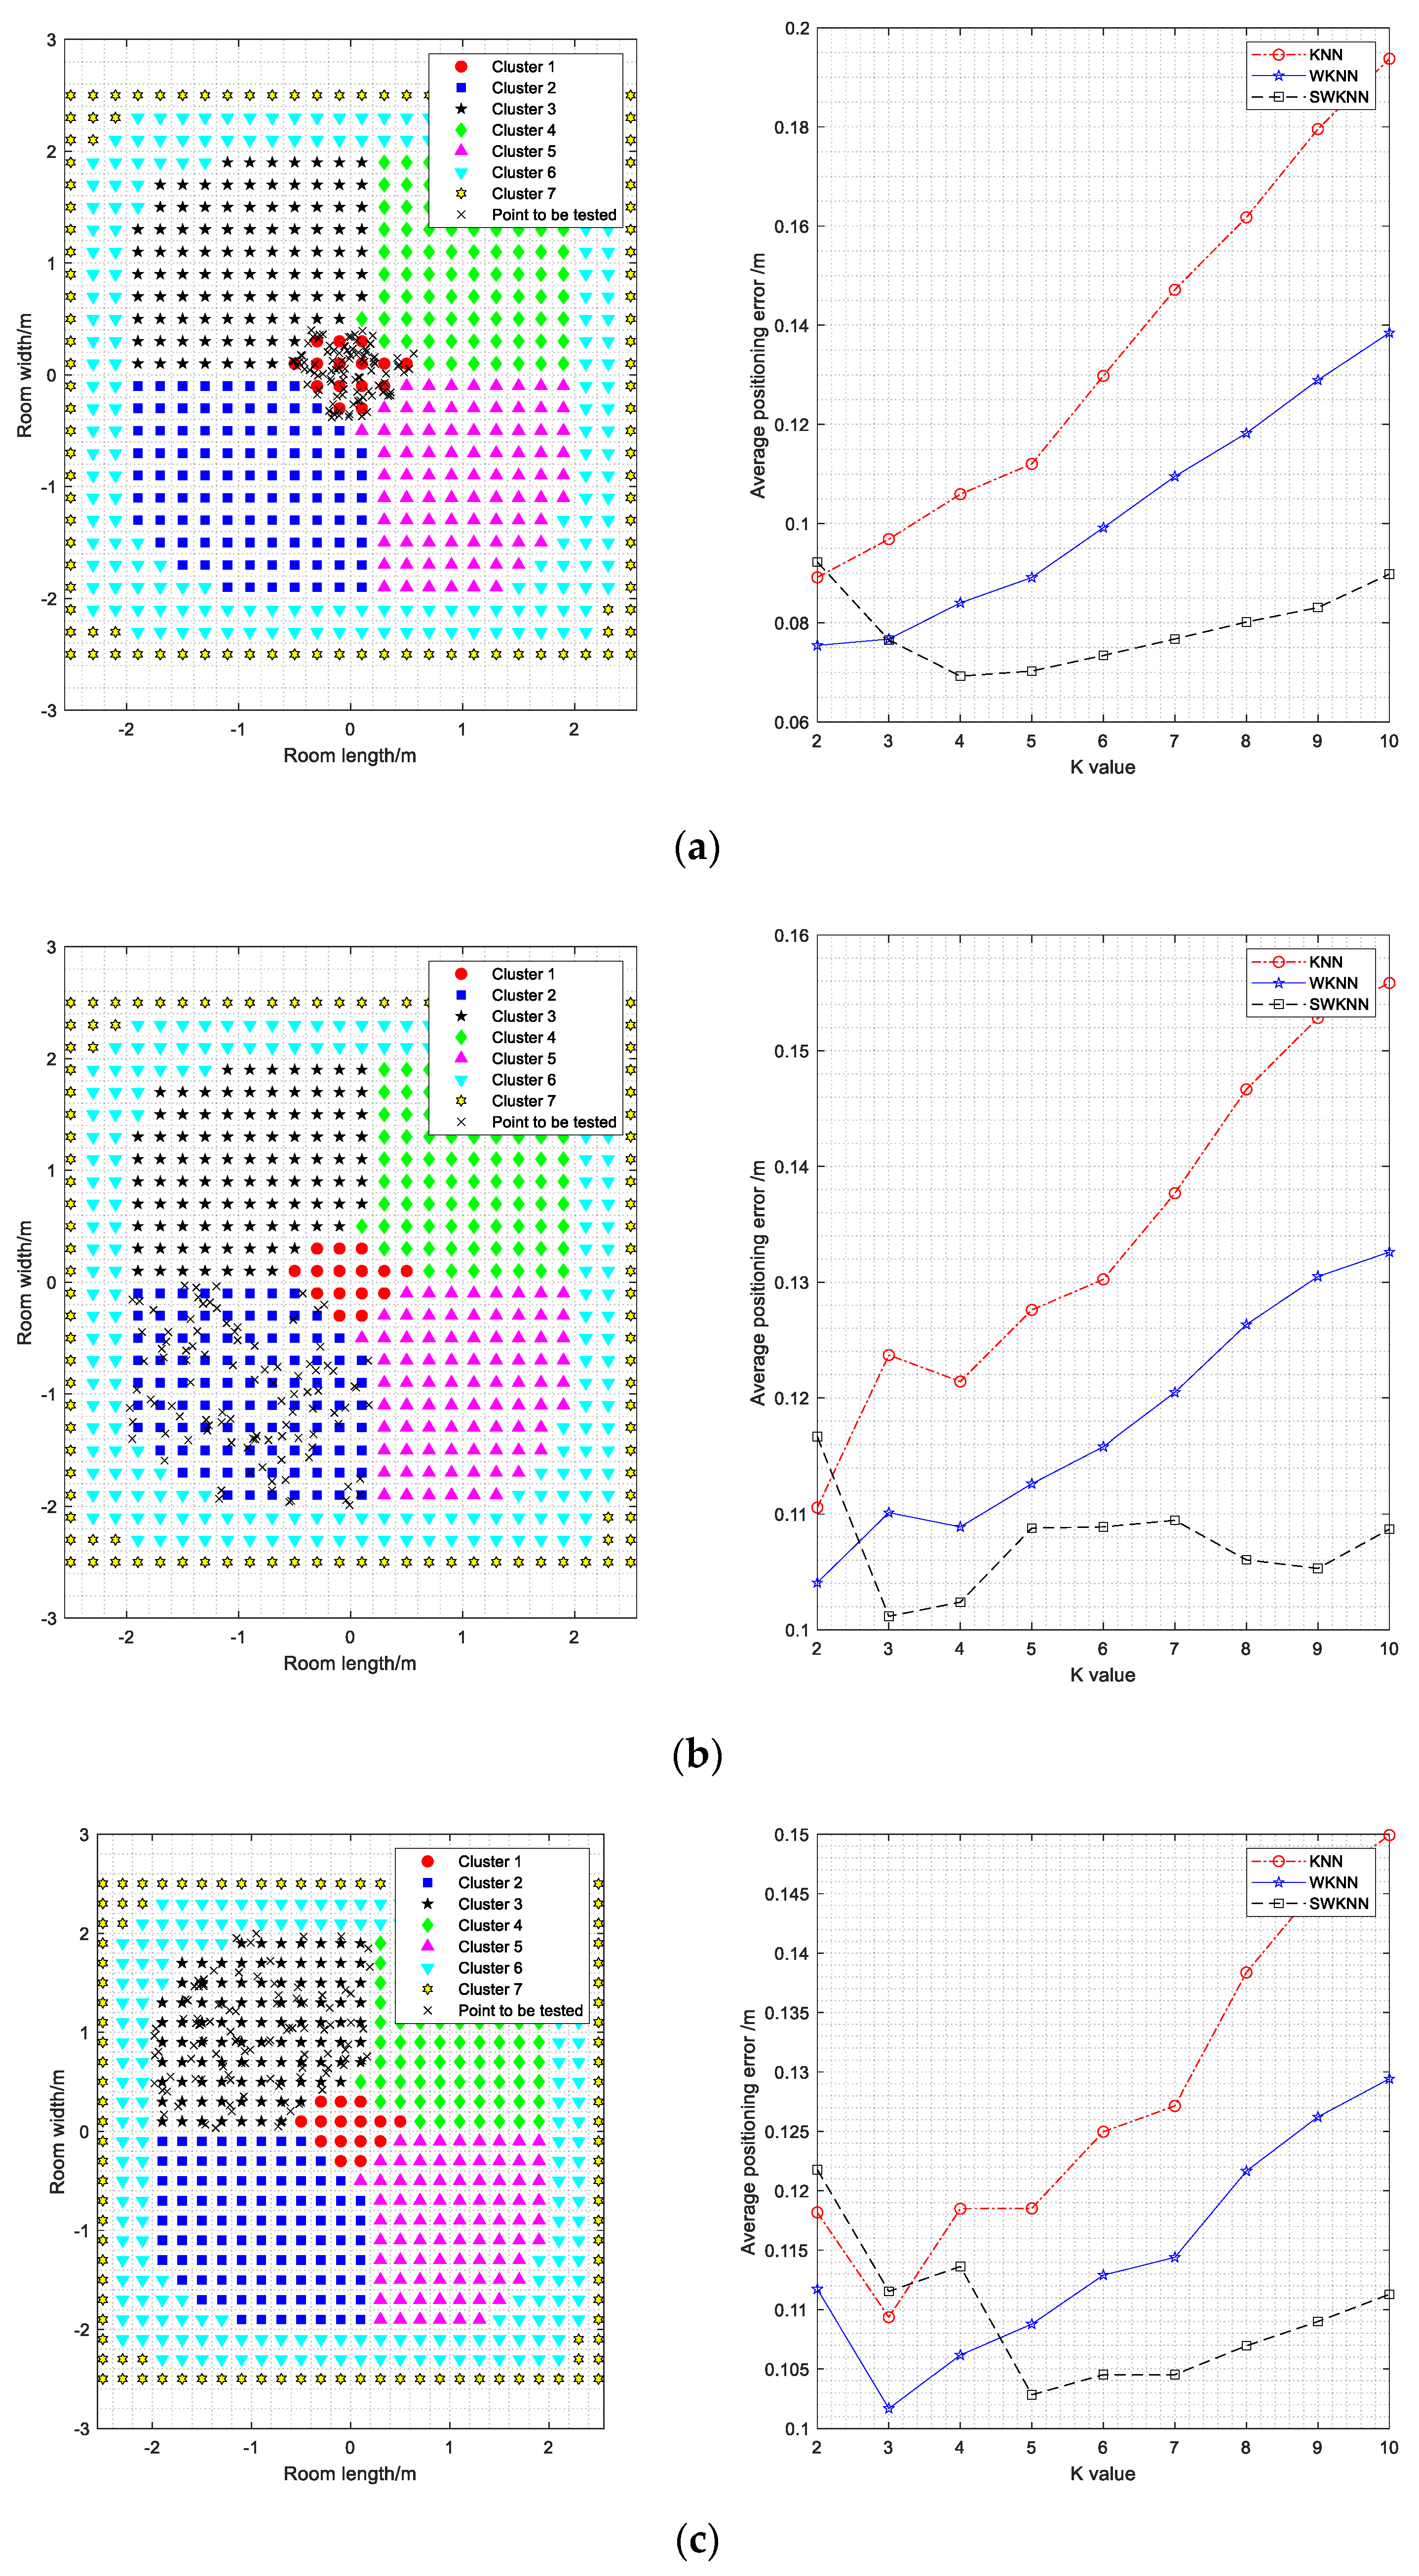
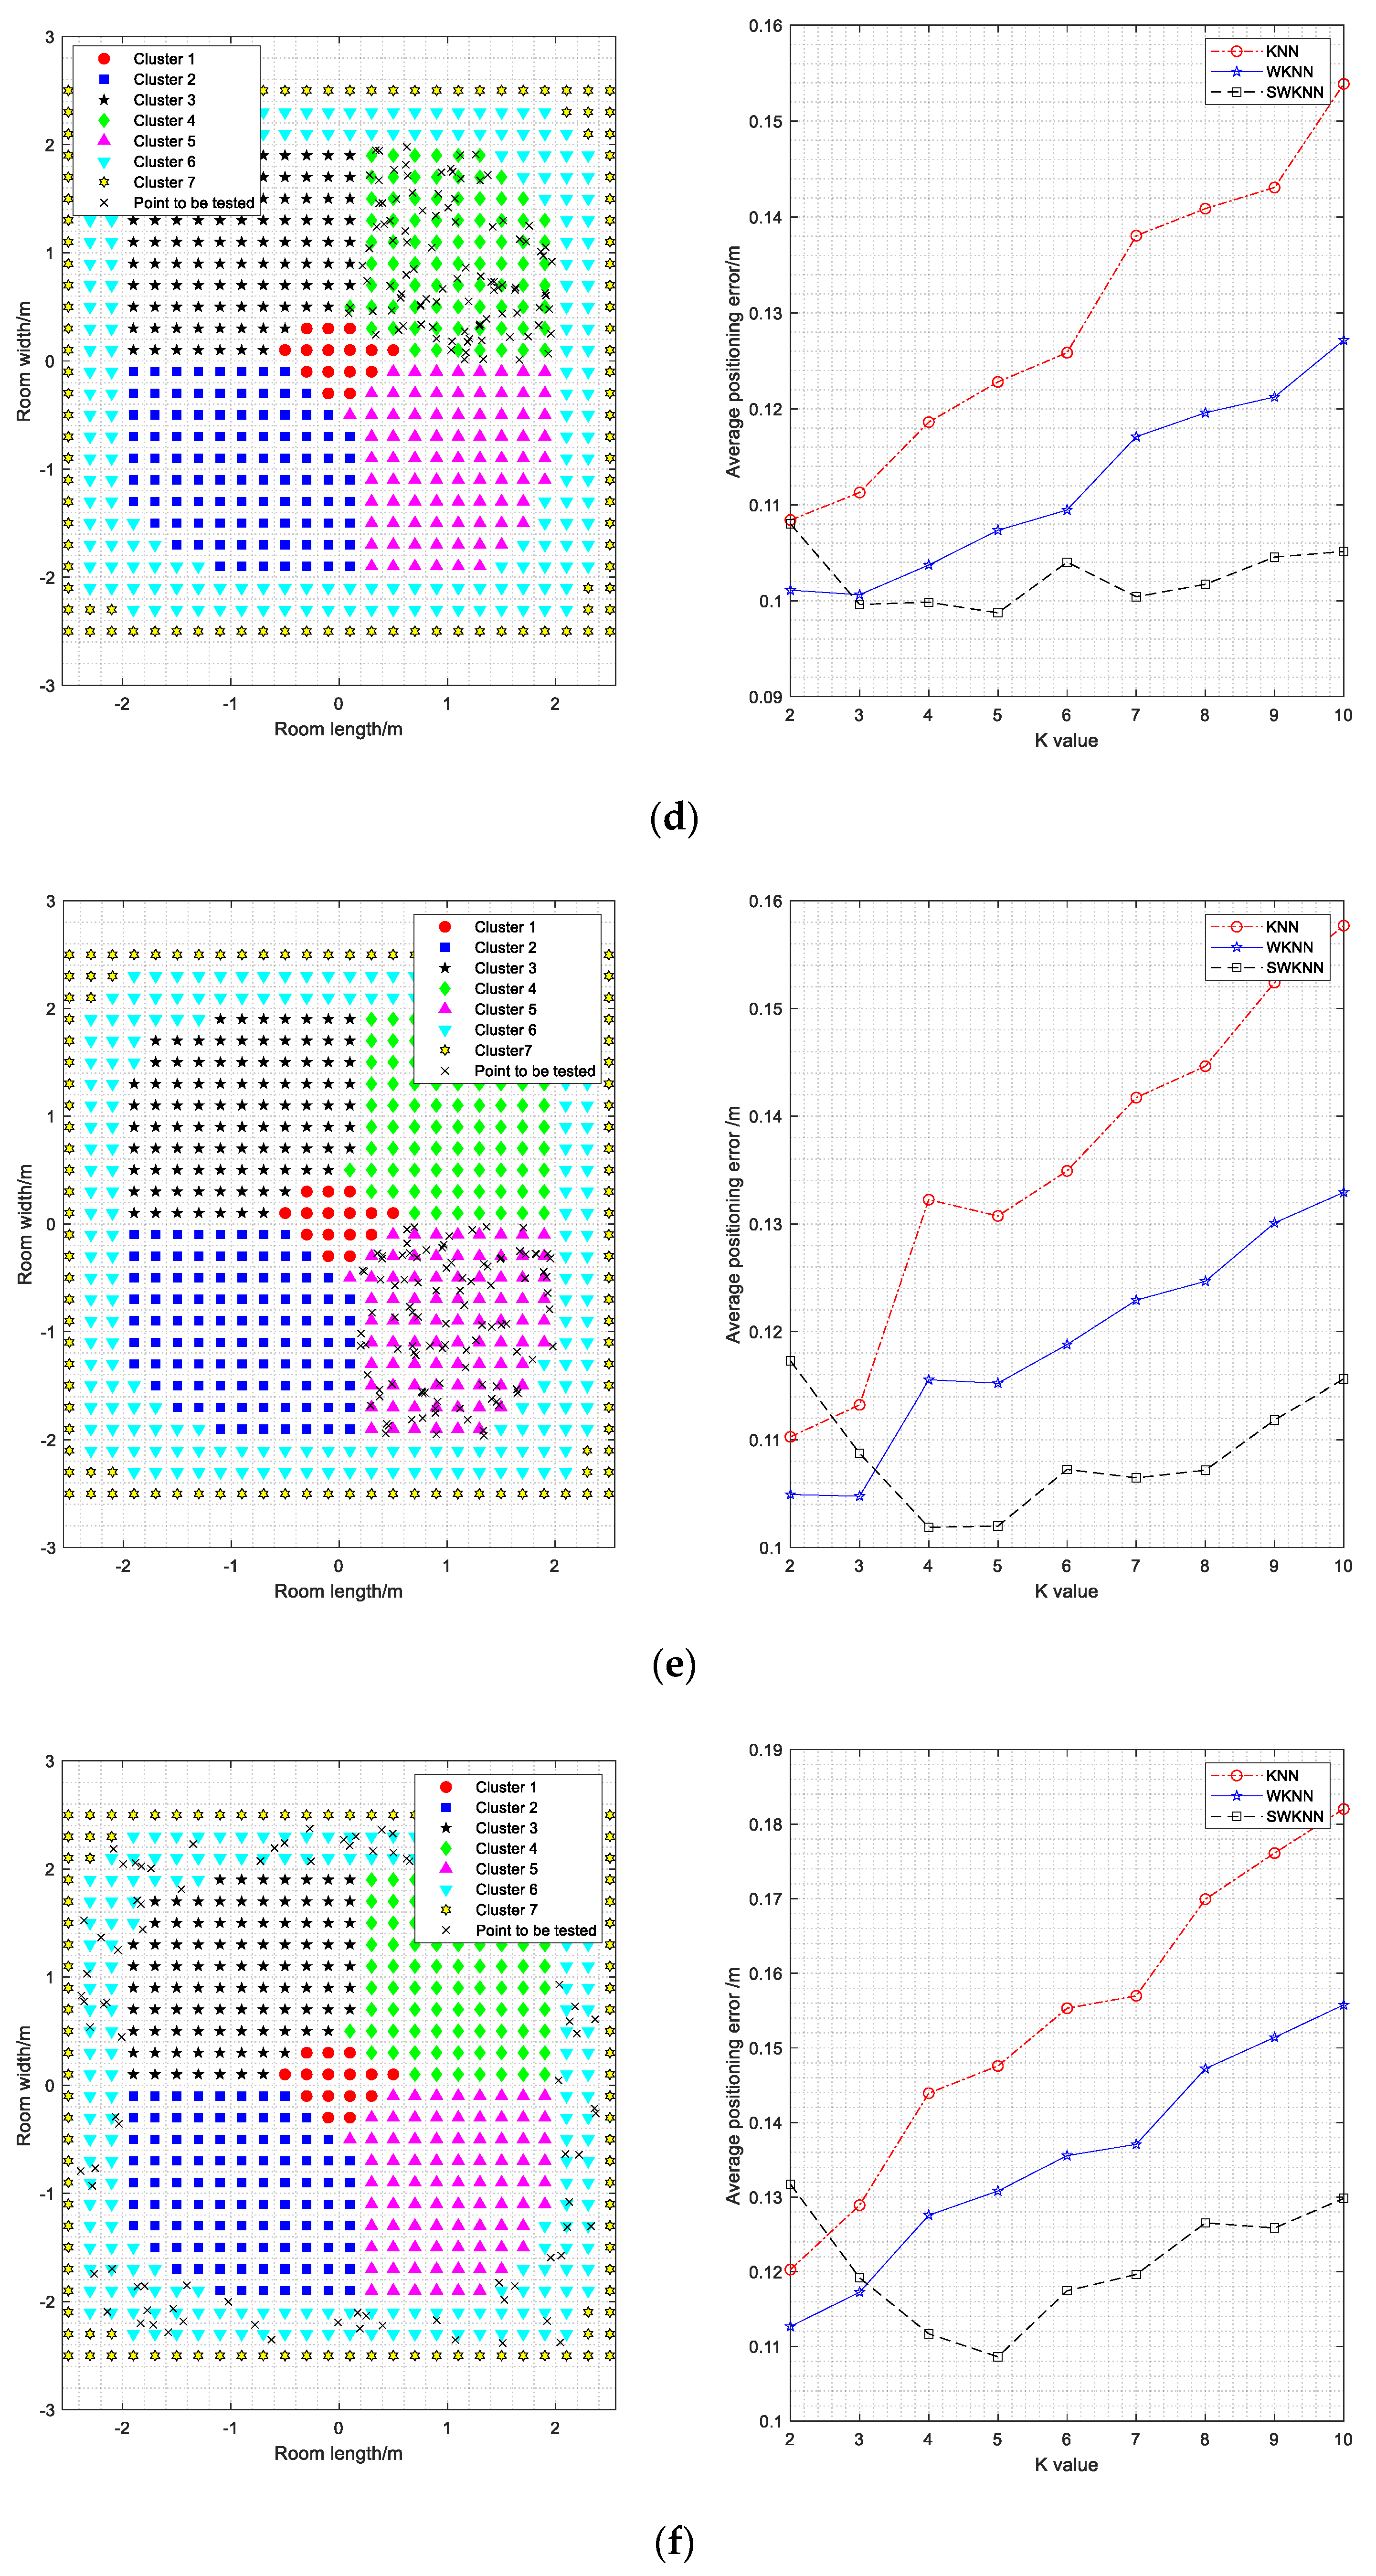
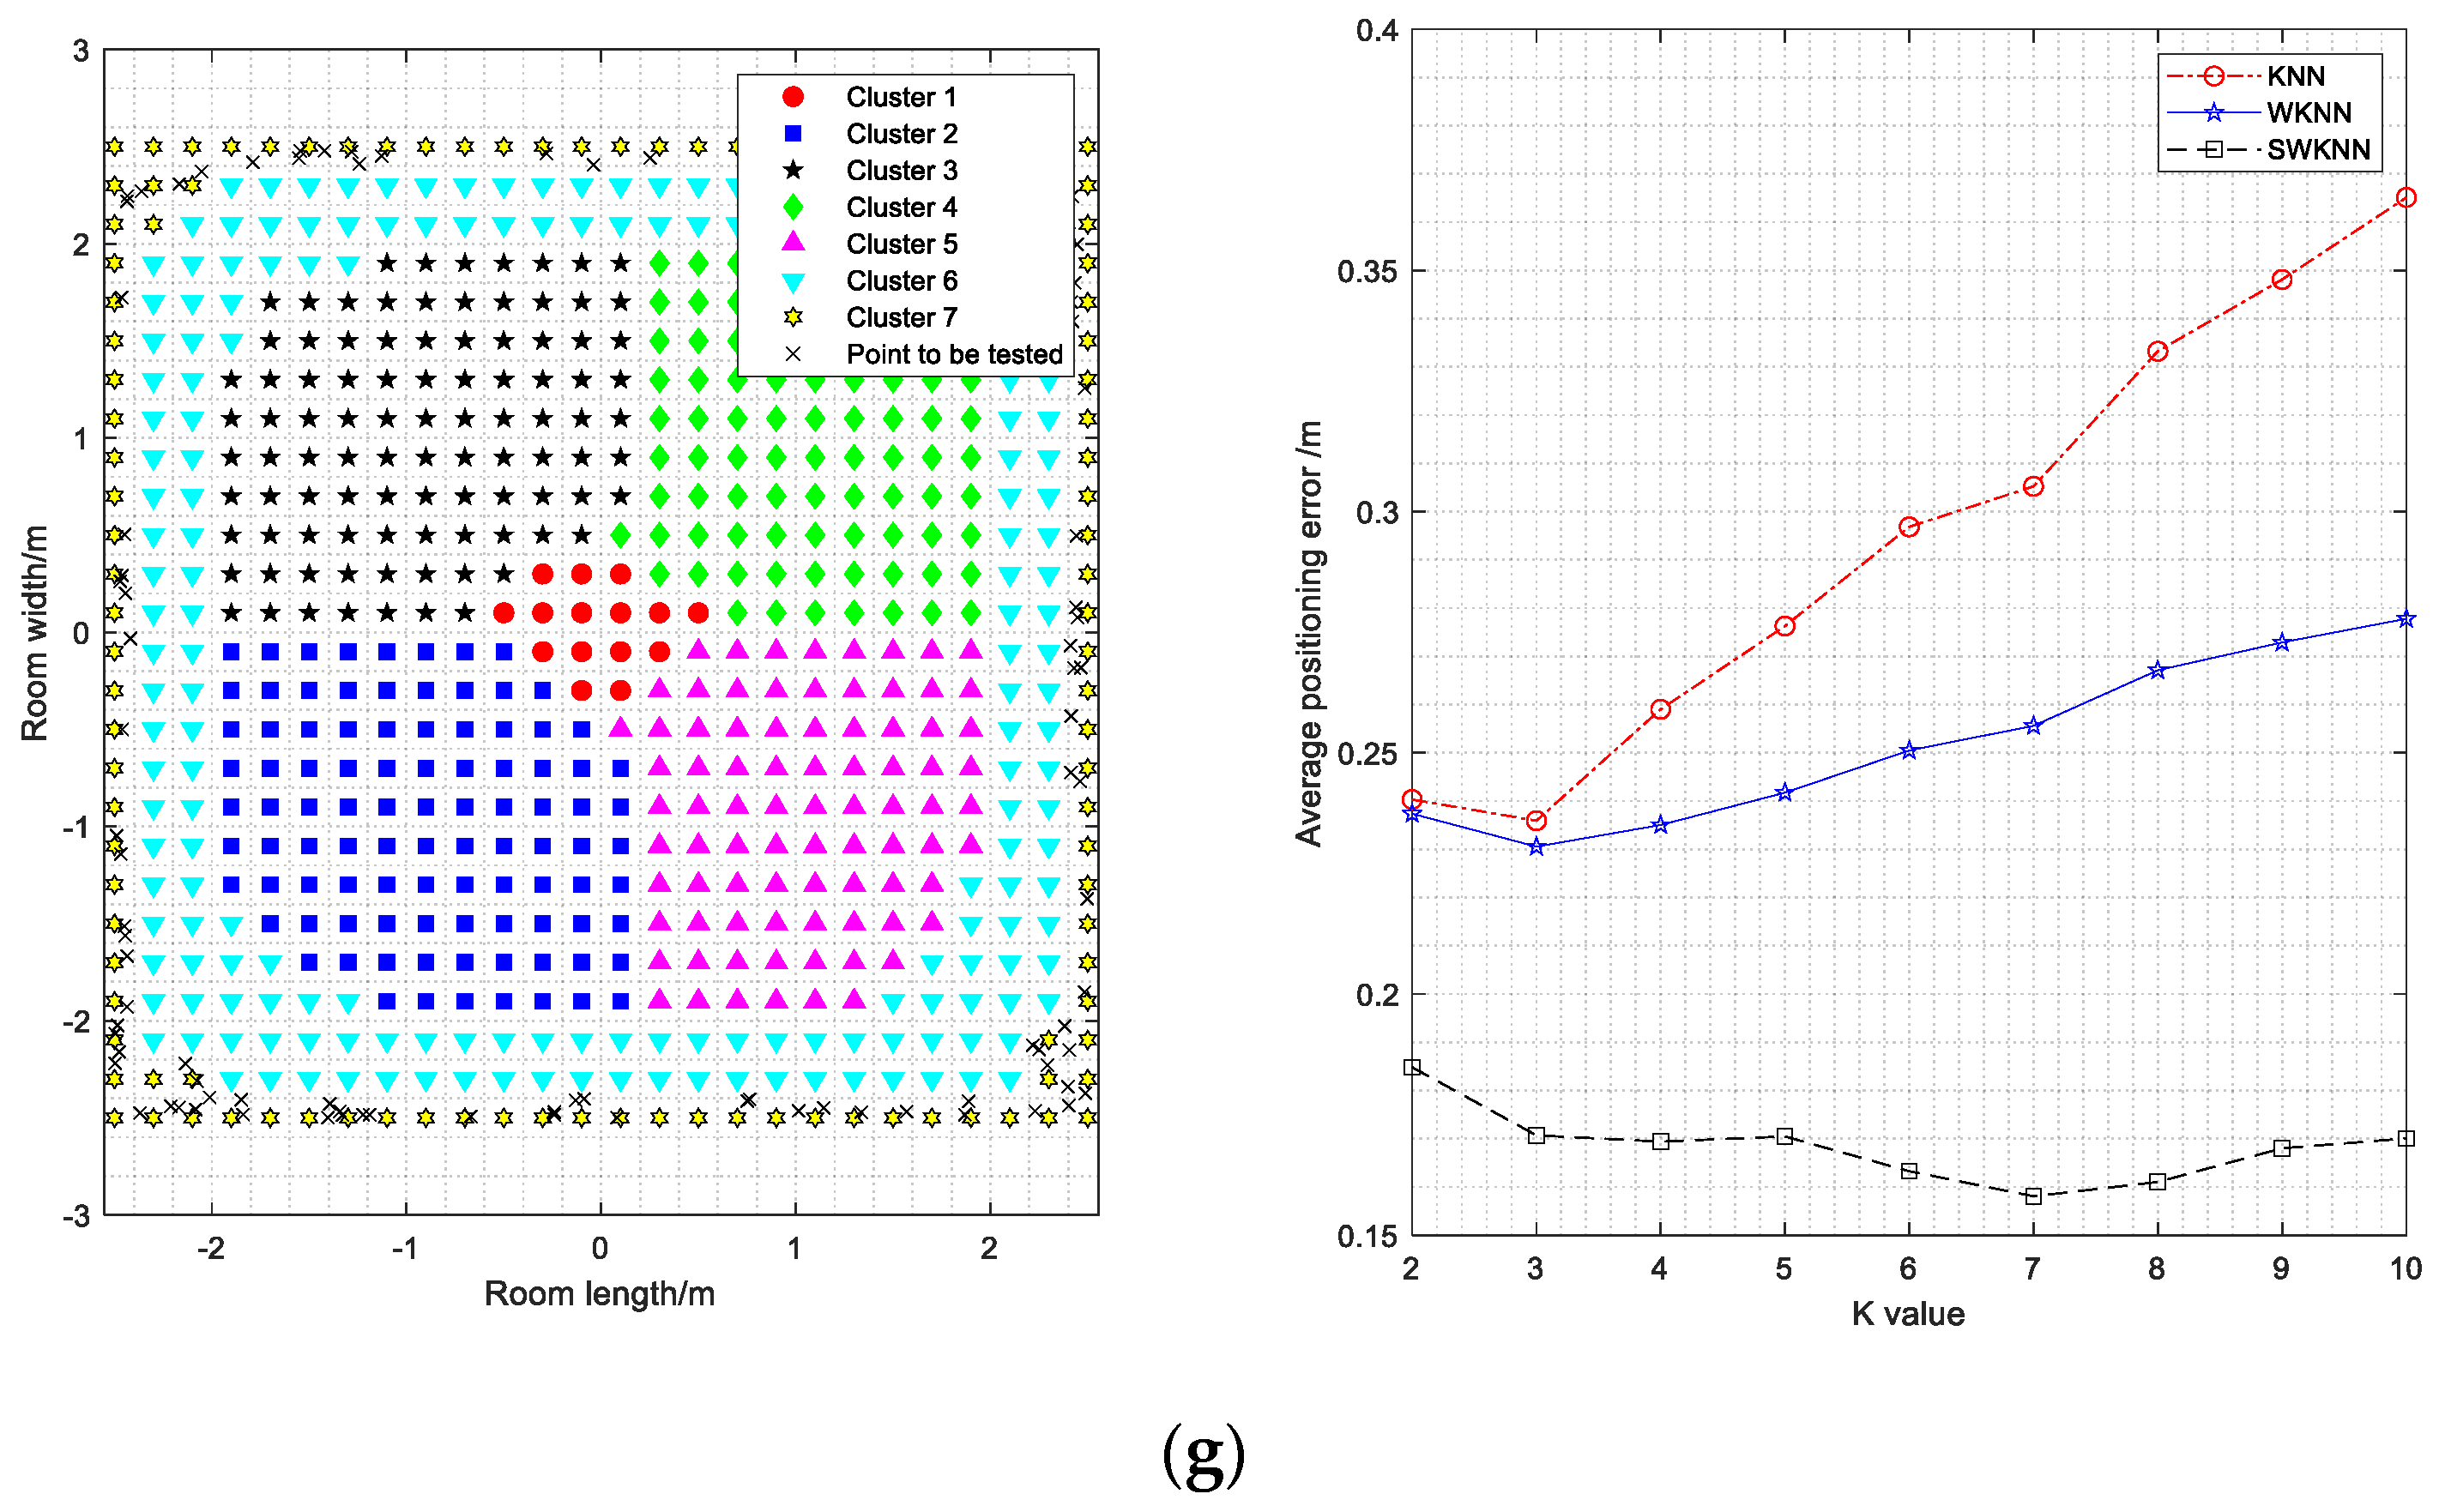
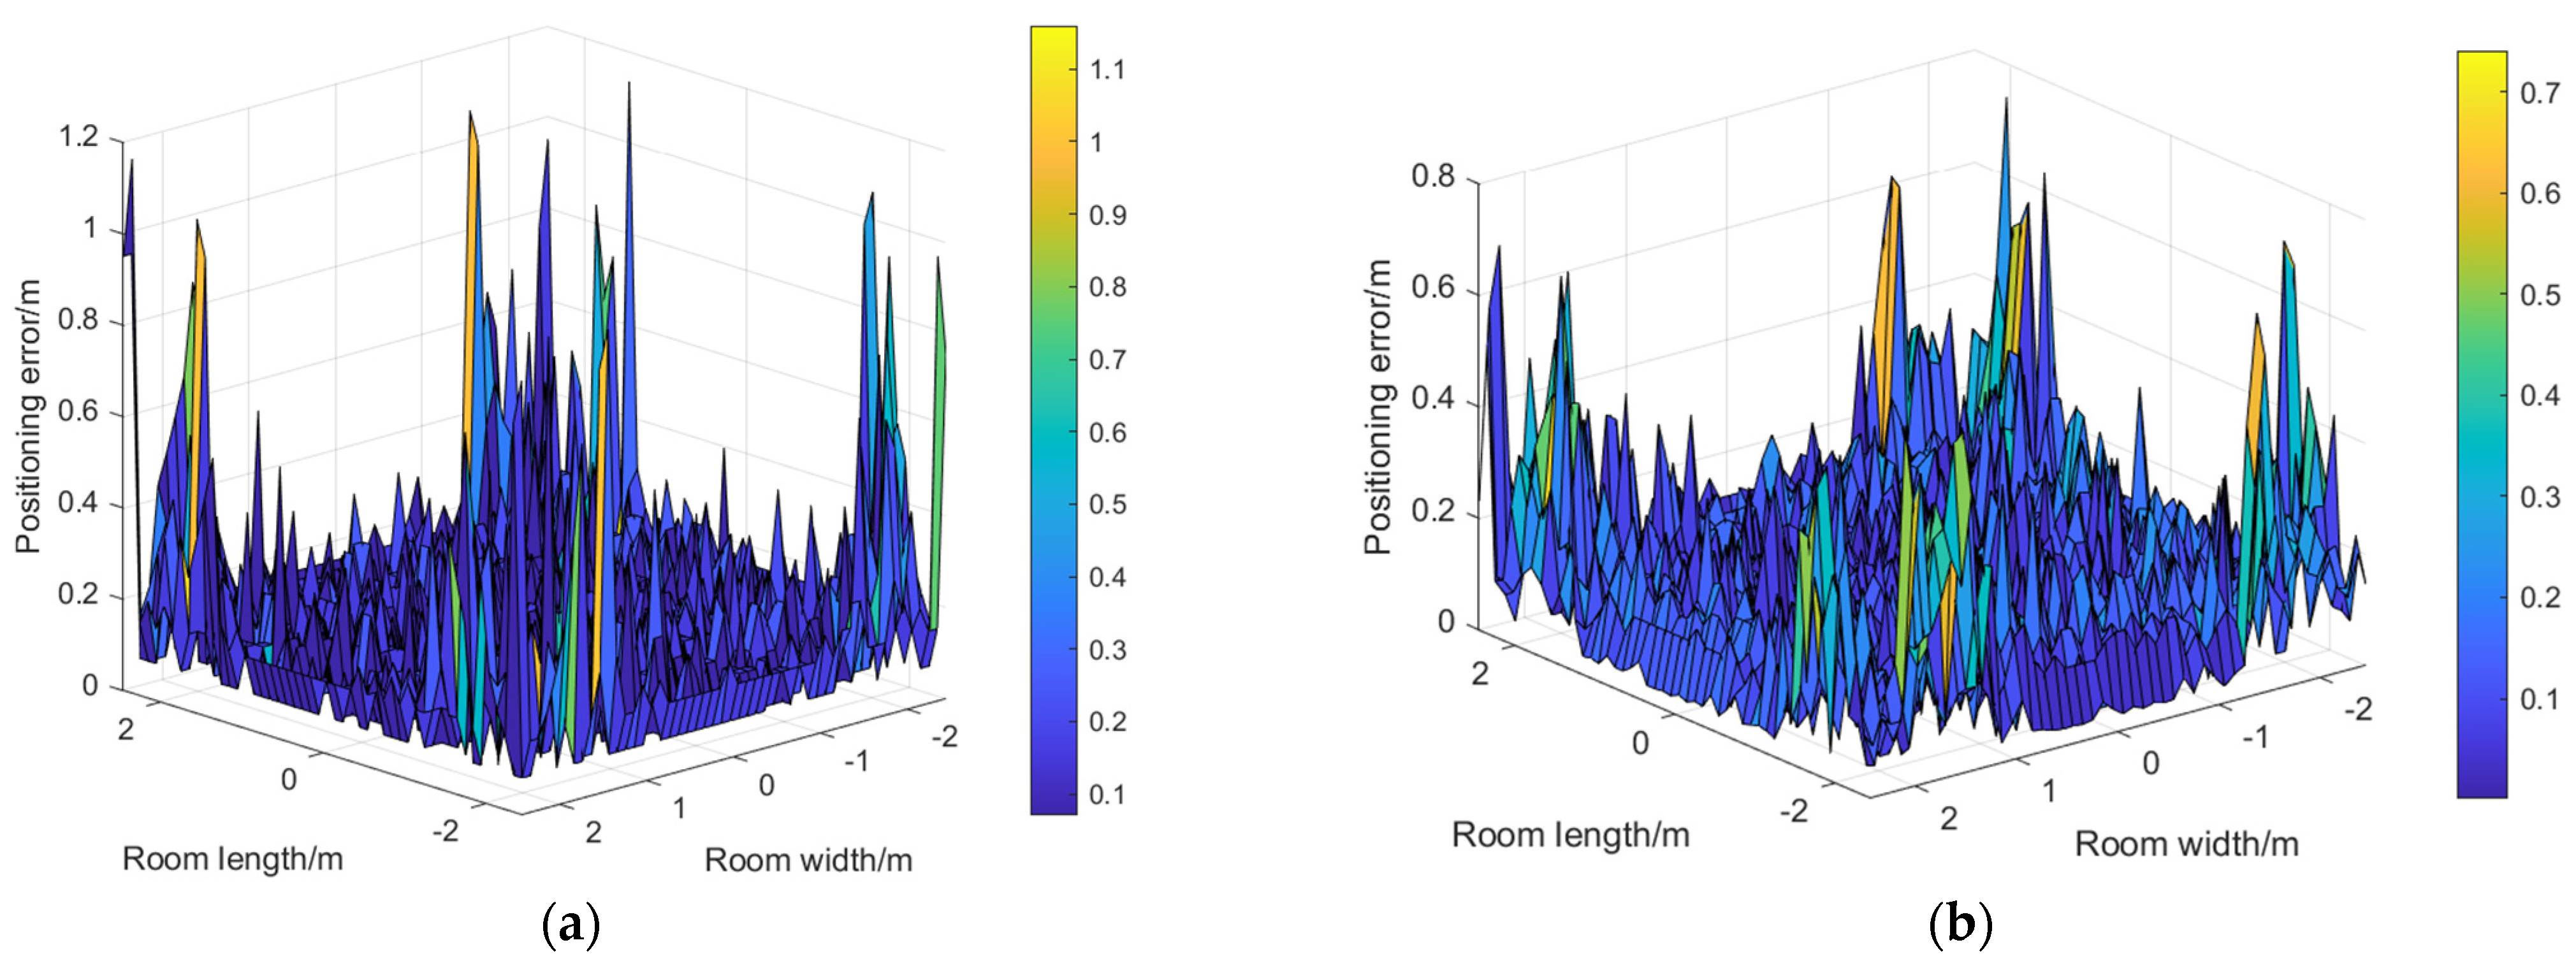
4.2. Improved Fingerprint Method
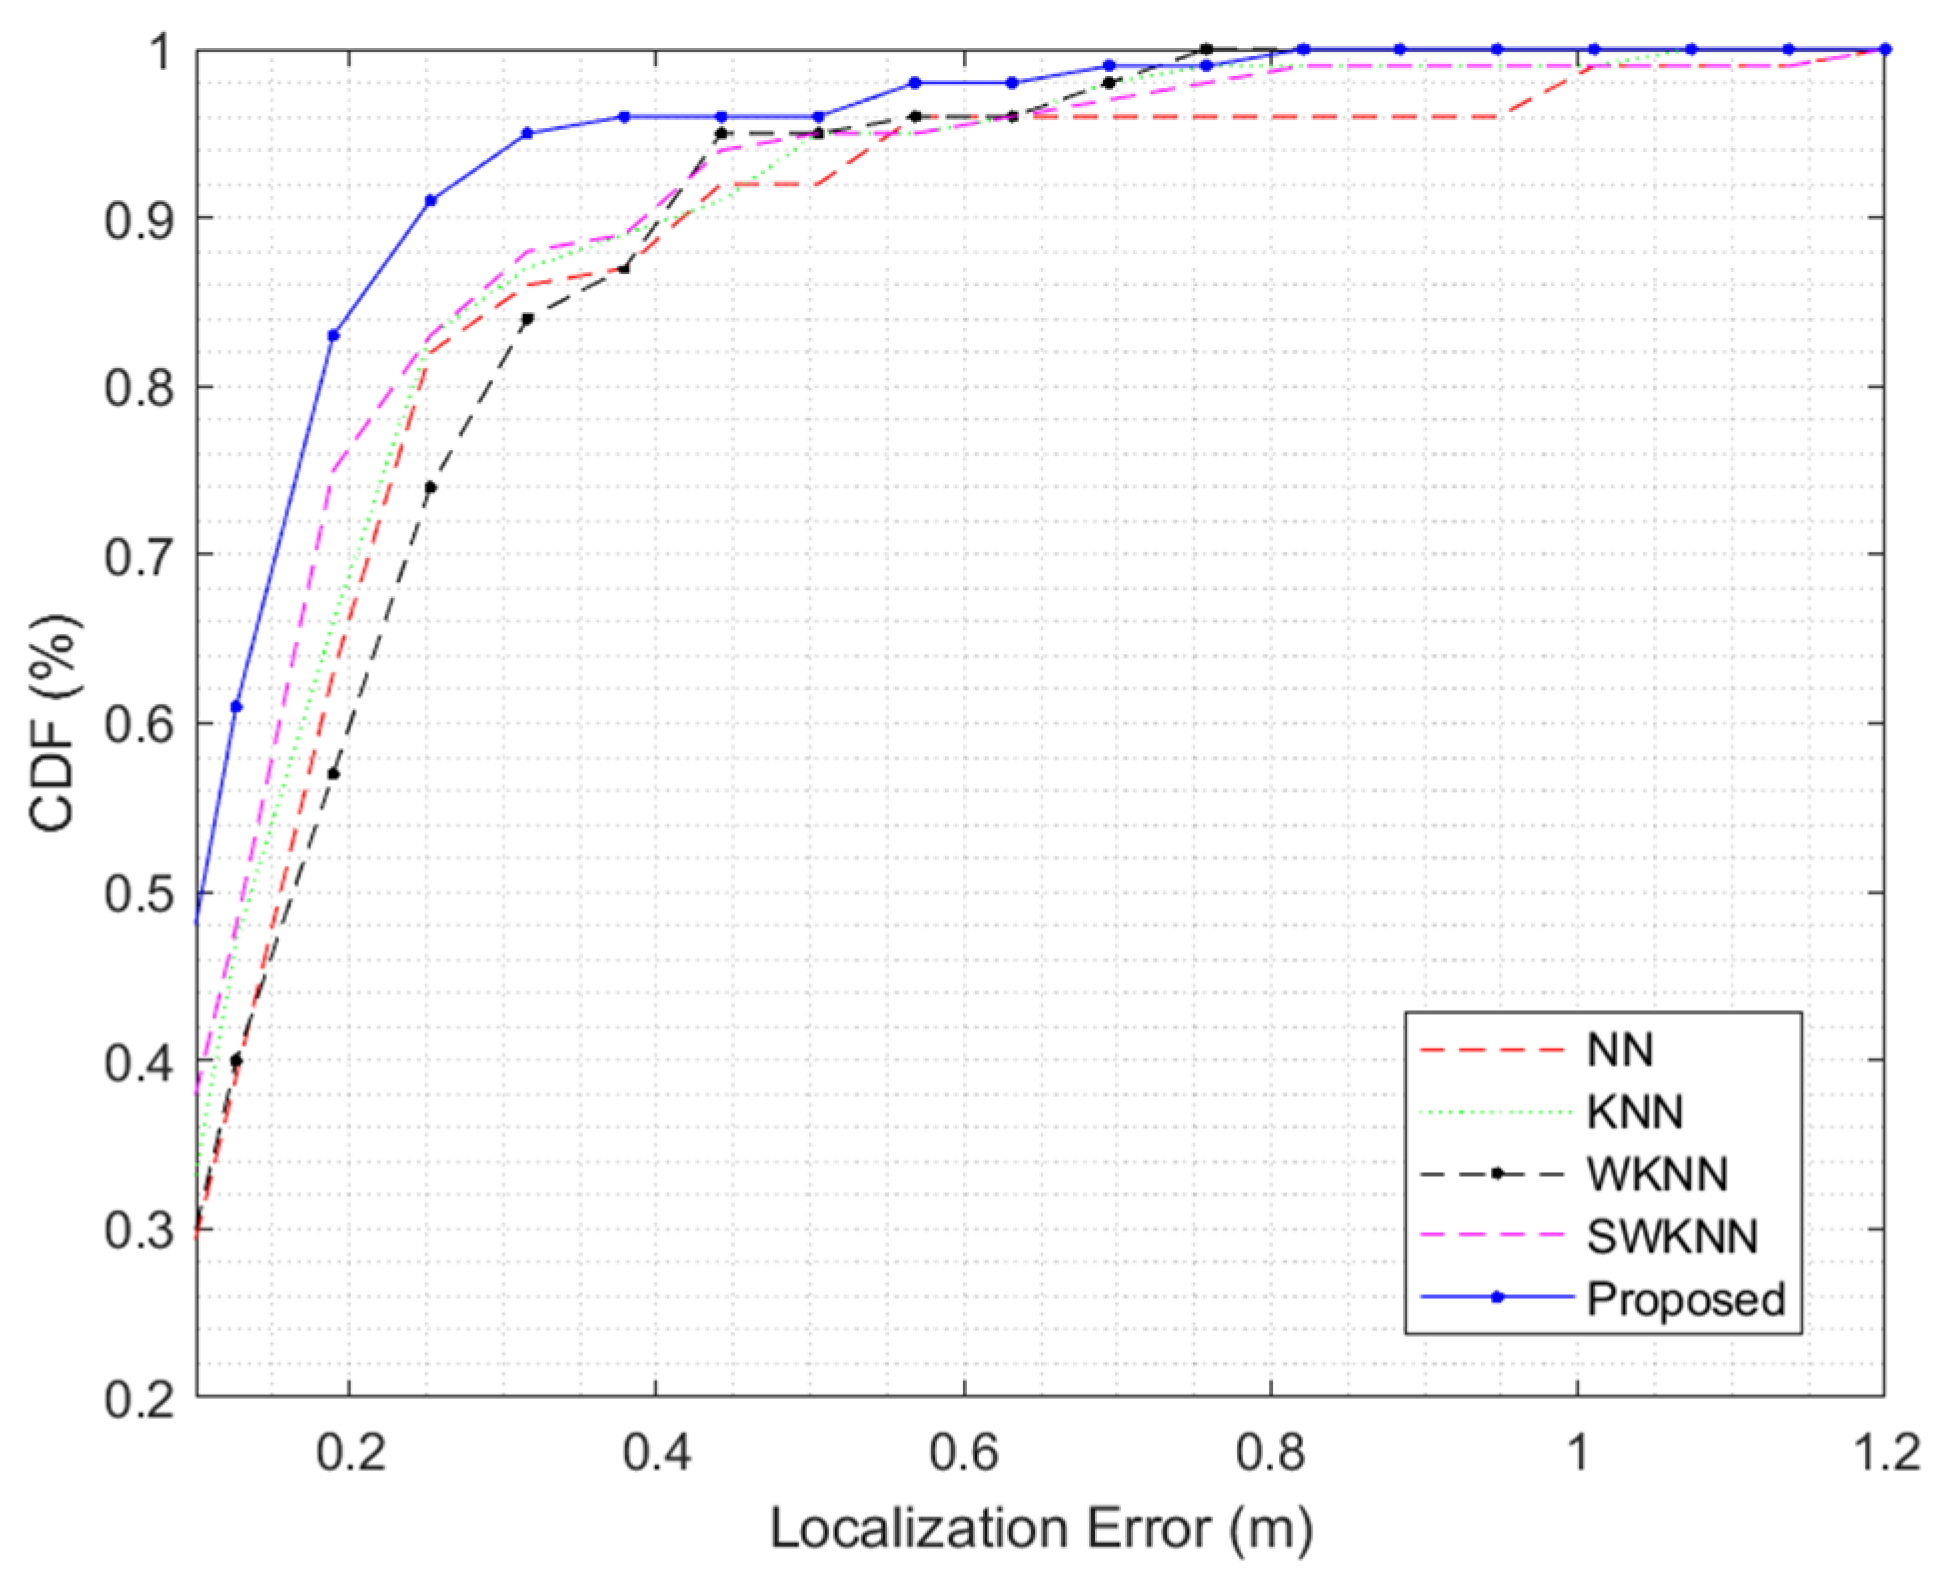
4.3. Discussion
5. Conclusions
Author Contributions
Funding
Institutional Review Board Statement
Informed Consent Statement
Data Availability Statement
Conflicts of Interest
References
- Filippoupolitis, A.; Oliff, W.; Loukas, G. Bluetooth Low Energy Based Occupancy Detection for Emergency Management. In Proceedings of the 2016 15th International Conference on Ubiquitous Computing and Communications and 2016 International Symposium on Cyberspace and Security (IUCC-CSS), Granada, Spain, 14–16 December 2016; pp. 31–38. [Google Scholar]
- Tekler, Z.D.; Low, R.; Yuen, C.; Blessing, L. Plug-Mate: An Iot-Based Occupancy-Driven Plug Load Management System in Smart Buildings. Build. Environ. 2022, 223, 109472. [Google Scholar] [CrossRef]
- Balaji, B.; Xu, J.; Nwokafor, A.; Gupta, R.; Agarwal, Y. Sentinel: Occupancy Based Hvac Actuation Using Existing Wifi Infrastructure within Commercial Buildings. In Proceedings of the 11th ACM Conference on Embedded Networked Sensor Systems, Roma, Italy, 11–15 November 2013; p. 17. [Google Scholar]
- Tekler, Z.D.; Chong, A. Occupancy Prediction Using Deep Learning Approaches across Multiple Space Types: A Minimum Sensing Strategy. Build. Environ. 2022, 226, 109689. [Google Scholar] [CrossRef]
- Tekler, Z.D.; Low, R.; Gunay, B.; Andersen, R.K.; Blessing, L. A Scalable Bluetooth Low Energy Approach to Identify Occupancy Patterns and Profiles in Office Spaces. Build. Environ. 2020, 171, 106681. [Google Scholar] [CrossRef]
- Yousif, B.B.; Elsayed, E.E.; Alzalabani, M.M. Atmospheric Turbulence Mitigation Using Spatial Mode Multiplexing and Modified Pulse Position Modulation in Hybrid Rf/Fso Orbital-Angular-Momentum Multiplexed Based on Mimo Wireless Communications System. Opt. Commun. 2019, 436, 197–208. [Google Scholar] [CrossRef]
- Sejan, M.A.S.; Rahman, M.H.; Aziz, M.A.; Kim, D.-S.; You, Y.-H.; Song, H.-K. A Comprehensive Survey on Mimo Visible Light Communication: Current Research, Machine Learning and Future Trends. Sensors 2023, 23, 739. [Google Scholar] [CrossRef] [PubMed]
- Ke, X.; Ding, D. Wireless Optical Communication, 2nd ed.; Science Press: Beijing, China, 2022. [Google Scholar]
- Gu, W.; Aminikashani, M.; Deng, P.; Kavehrad, M. Impact of multipath reflections on the performance of indoor visible light positioning systems. J. Light. Technol. 2016, 34, 2578–2587. [Google Scholar] [CrossRef] [Green Version]
- Saadi, M.; Zhao, Y.; Wuttisttikulkij, L.; Khan, M.T.A. A heuristic approach to indoor localization using light emitting diodes. J. Theor. Appl. Inf. Technol. 2016, 84, 332–338. [Google Scholar]
- Saadi, M.; Ahmad, T.; Zhao, Y.; Wuttisttikulkij, L. An LED Based Indoor Localization System Using k-Means Clustering. In Proceedings of the 2016 15th IEEE International Conference on Machine Learning and Applications (ICMLA), Anaheim, CA, USA, 18–20 December 2016; pp. 246–252. [Google Scholar]
- Wang, H. Research on Positioning Method of Indoor Visible Light Based on Position Fingerprint. Master’s Thesis, Xi’an University of Electronic Science and Technology, Xi’an, China, 2018. [Google Scholar]
- Liu, R.; Liang, Z.; Yang, K.; Li, W. Machine learning based visible light indoor positioning with single-LED and single rotatable photo detector. IEEE Photonics J. 2022, 14, 1–11. [Google Scholar] [CrossRef]
- Martínez-Ciro, R.A.; López-Giraldo, F.E.; Luna-Rivera, J.M.; Ramírez-Aguilera, A.M. An Indoor Visible Light Positioning System for Multi-Cell Networks. Photonics 2022, 9, 146. [Google Scholar] [CrossRef]
- Long, Q.; Zhang, J.; Cao, L.; Wang, W. Indoor Visible Light Positioning System Based on Point Classification Using Artificial Intelligence Algorithms. Sensors 2023, 23, 5224. [Google Scholar] [CrossRef]
- Komine, T.; Nakagawa, M. Fundamental analysis for visible-light communication system using LED lights. IEEE Trans. Consum. Electron. 2004, 50, 100–107. [Google Scholar] [CrossRef]
- Ding, D.Q.; Ke, X.Z.; Li, J.X. Design and simulation on the layout of lighting for VLC system. Opto-Electr. Eng. 2007, 34, 131–134. [Google Scholar]
- Van, M.T.; Van Tuan, N.; Son, T.T.; Le-Minh, H.; Burton, A. Weighted k-nearest neighbour model for indoor VLC positioning. IET Commun. 2017, 11, 864–871. [Google Scholar] [CrossRef]
- Maheepala, M.; Kouzani, A.Z.; Joordens, M.A. Light-based indoor positioning systems: A review. IEEE Sens. J. 2020, 20, 3971–3995. [Google Scholar] [CrossRef]
- Xu, Y.; Wang, X. Indoor positioning algorithm of subregional visible light based on multilayer ELM. J. Hunan Univ. Nat. Sci. 2019, 46, 125–132. [Google Scholar]
- Zheng, J.; Li, K.; Zhang, X. Wi-Fi Fingerprint-Based Indoor Localization Method via Standard Particle Swarm Optimization. Sensors 2022, 22, 5051. [Google Scholar] [CrossRef]
- Wang, K.; Yu, X.; Xiong, Q.; Zhu, Q.; Lu, W.; Huang, Y.; Zhao, L. Learning to improve WLAN indoor positioning accuracy based on DBSCAN-KRF algorithm from RSS fingerprint data. IEEE Access 2019, 7, 72308–72315. [Google Scholar] [CrossRef]
- Tran, H.Q.; Ha, C. Improved visible light-based indoor positioning system using machine learning classification and regression. Appl. Sci. 2019, 9, 1048. [Google Scholar] [CrossRef] [Green Version]
- Saadi, M.; Saeed, Z.; Ahmad, T.; Saleem, M.K.; Wuttisittikulkij, L. Visible light-based indoor localization using k-means clustering and linear regression. Trans. Emerg. Telecommun. Technol. 2019, 30, e3480. [Google Scholar] [CrossRef]
- Koçoğlu, F.Ö. Research on the success of unsupervised learning algorithms in indoor location prediction. Int. Adv. Res. Eng. J. 2022, 6, 148–153. [Google Scholar] [CrossRef]
- Tao, Z.; Song, Q.; Jin, X. WLAN indoor localization algorithm based on fast K-medoids clustering. Electr. Des. Eng. 2017, 25, 109–113. [Google Scholar]
- Ester, M.; Kriegel, H.-P.; Sander, J.; Xu, X. A density-based algorithm for discovering clusters in large spatial databases with noise. KDD-96 Proc. 1996, 96, 226–231. [Google Scholar]
- Wang, Y.; Gao, X.; Dai, X.; Xia, Y.; Hou, B. WiFi Indoor Location Based on Area Segmentation. Sensors 2022, 22, 7920. [Google Scholar] [CrossRef]
- Liu, Y.; Yu, X.; Xie, S.; Liu, S.; Zhu, P. Channel state information localization based on improved DBSCAN clustering algorithm. Electr. Meas. Technol. 2022, 45, 169–173. [Google Scholar]
- Gradim, A.; Fonseca, P.; Alves, L.N.; Mohamed, R.E. On the Usage of Machine Learning Techniques to Improve Position Accuracy in Visible Light Positioning Systems. In Proceedings of the 2018 11th International Symposium on Communication Systems, Networks & Digital Signal Processing (CSNDSP), Budapest, Hungary, 18–20 July 2018; pp. 1–6. [Google Scholar]
- Tran, H.Q.; Ha, C. Machine learning in indoor visible light positioning systems: A review. Neurocomputing 2022, 491, 117–131. [Google Scholar] [CrossRef]
- Tran, H.Q.; Ha, C. High precision weighted optimum K-nearest neighbors algorithm for indoor visible light positioning applications. IEEE Access 2020, 8, 114597–114607. [Google Scholar] [CrossRef]


| Parameters | Value |
|---|---|
| Emitting optical power | 1 W |
| Half power angle | 60° |
| Wall reflectivity | 0.7 |
| Receiver responsiveness | 0.5 A/W |
| Receiver field of view angle | 70° |
| Refractive index | 1.5 |
| Reflection coefficient | 0.8 |
| SNR | 30 dB |
| Region | Optimal Algorithm | Optimum k Value | Average Positioning Error (cm) |
|---|---|---|---|
| Cluster 1 | SWKNN | 4 | 6.92 |
| Cluster 2 | SWKNN | 3 | 10.11 |
| Cluster 3 | WKNN | 3 | 10.16 |
| Cluster 4 | SWKNN | 5 | 9.87 |
| Cluster 5 | SWKNN | 4 | 10.18 |
| Cluster 6 | SWKNN | 5 | 10.86 |
| Cluster 7 | SWKNN | 7 | 15.80 |
| Algorithm | Average Positioning Error (cm) |
|---|---|
| NN | 20.26 |
| KNN | 18.51 |
| WKNN | 19.87 |
| SWKNN | 17.37 |
| Proposed | 13.41 |
Disclaimer/Publisher’s Note: The statements, opinions and data contained in all publications are solely those of the individual author(s) and contributor(s) and not of MDPI and/or the editor(s). MDPI and/or the editor(s) disclaim responsibility for any injury to people or property resulting from any ideas, methods, instructions or products referred to in the content. |
© 2023 by the authors. Licensee MDPI, Basel, Switzerland. This article is an open access article distributed under the terms and conditions of the Creative Commons Attribution (CC BY) license (https://creativecommons.org/licenses/by/4.0/).
Share and Cite
Ke, C.; Shu, Y.; Ke, X. Research on Indoor Visible Light Location Based on Fusion Clustering Algorithm. Photonics 2023, 10, 853. https://doi.org/10.3390/photonics10070853
Ke C, Shu Y, Ke X. Research on Indoor Visible Light Location Based on Fusion Clustering Algorithm. Photonics. 2023; 10(7):853. https://doi.org/10.3390/photonics10070853
Chicago/Turabian StyleKe, Chenghu, Yuting Shu, and Xizheng Ke. 2023. "Research on Indoor Visible Light Location Based on Fusion Clustering Algorithm" Photonics 10, no. 7: 853. https://doi.org/10.3390/photonics10070853