Photonic-Assisted Microwave Frequency Measurement Using High Q-Factor Microdisk with High Accuracy


Abstract
:1. Introduction
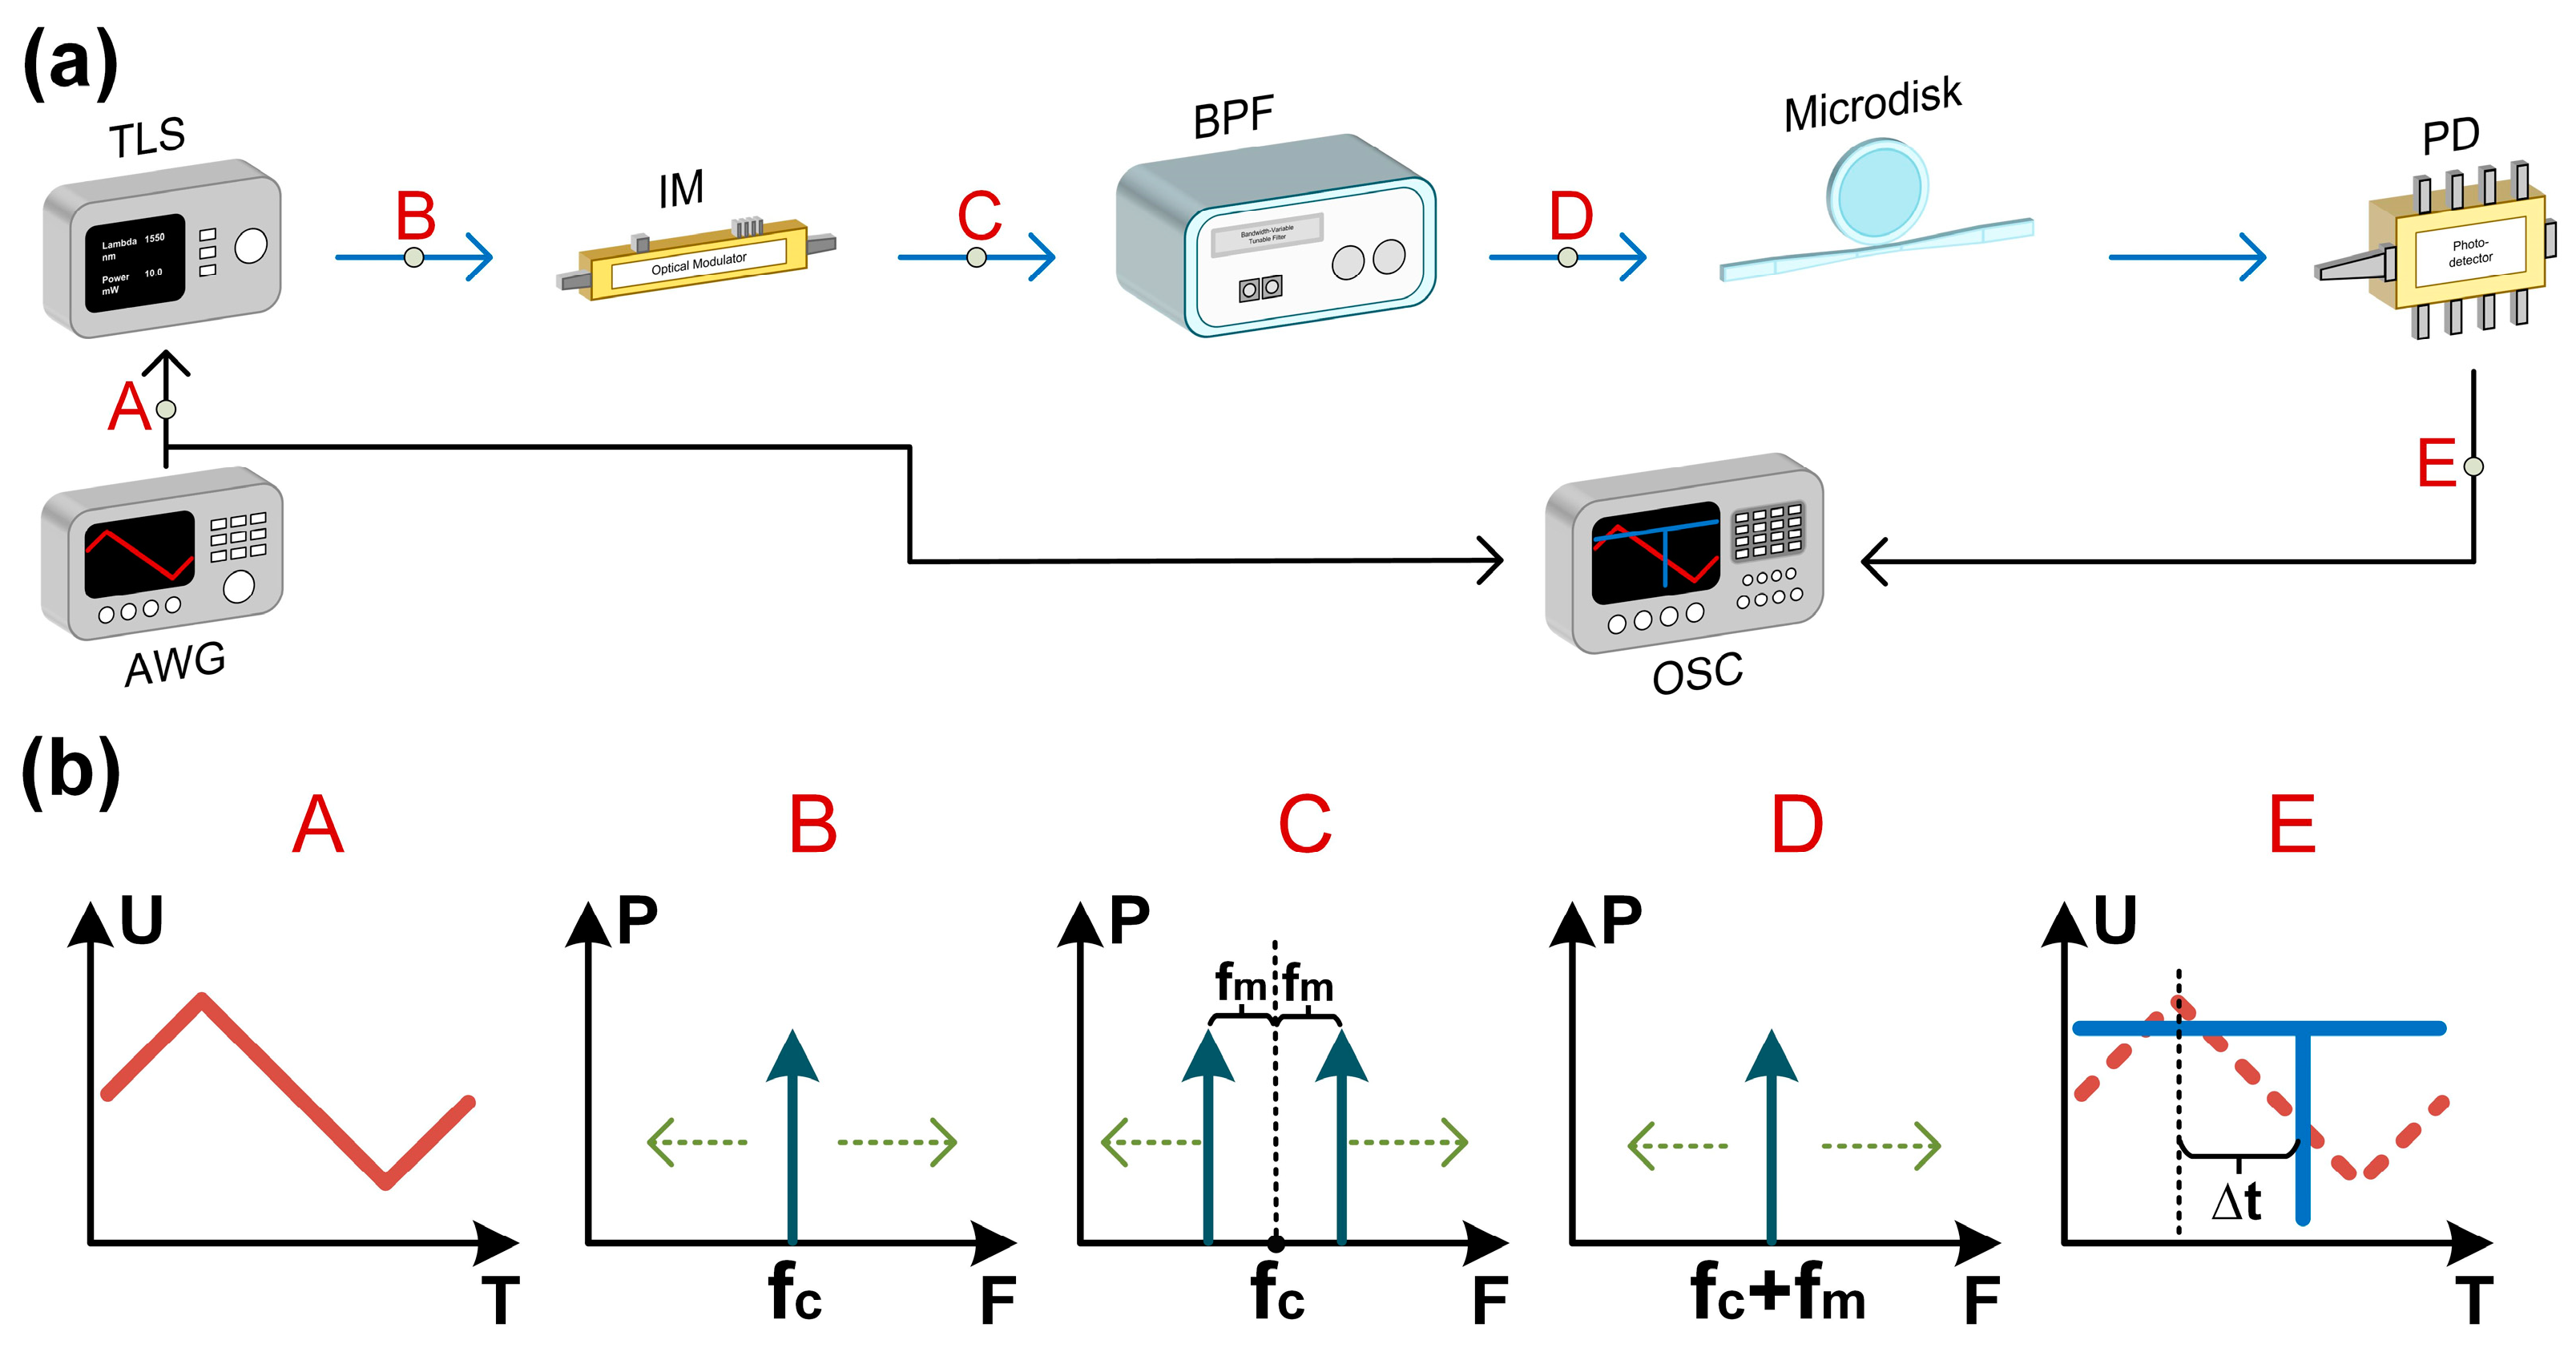
2. Principle
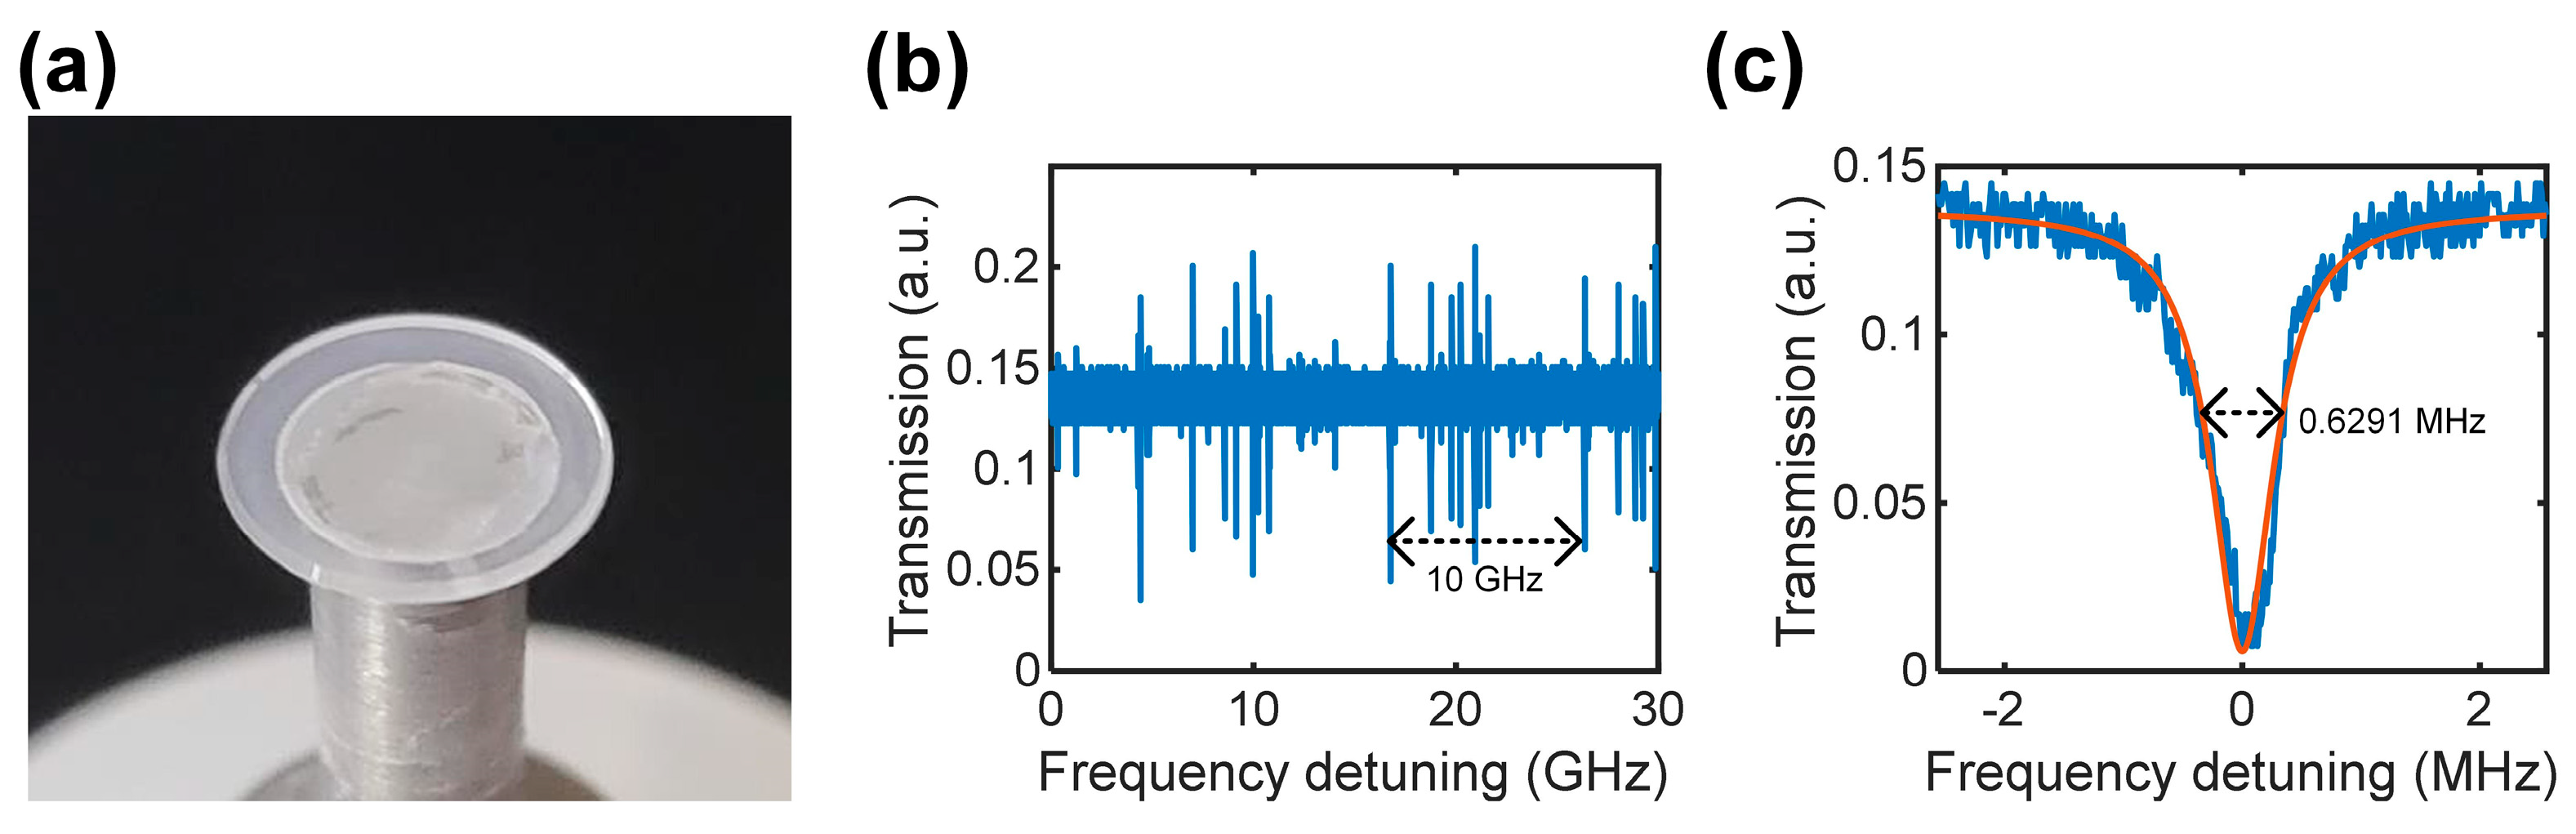
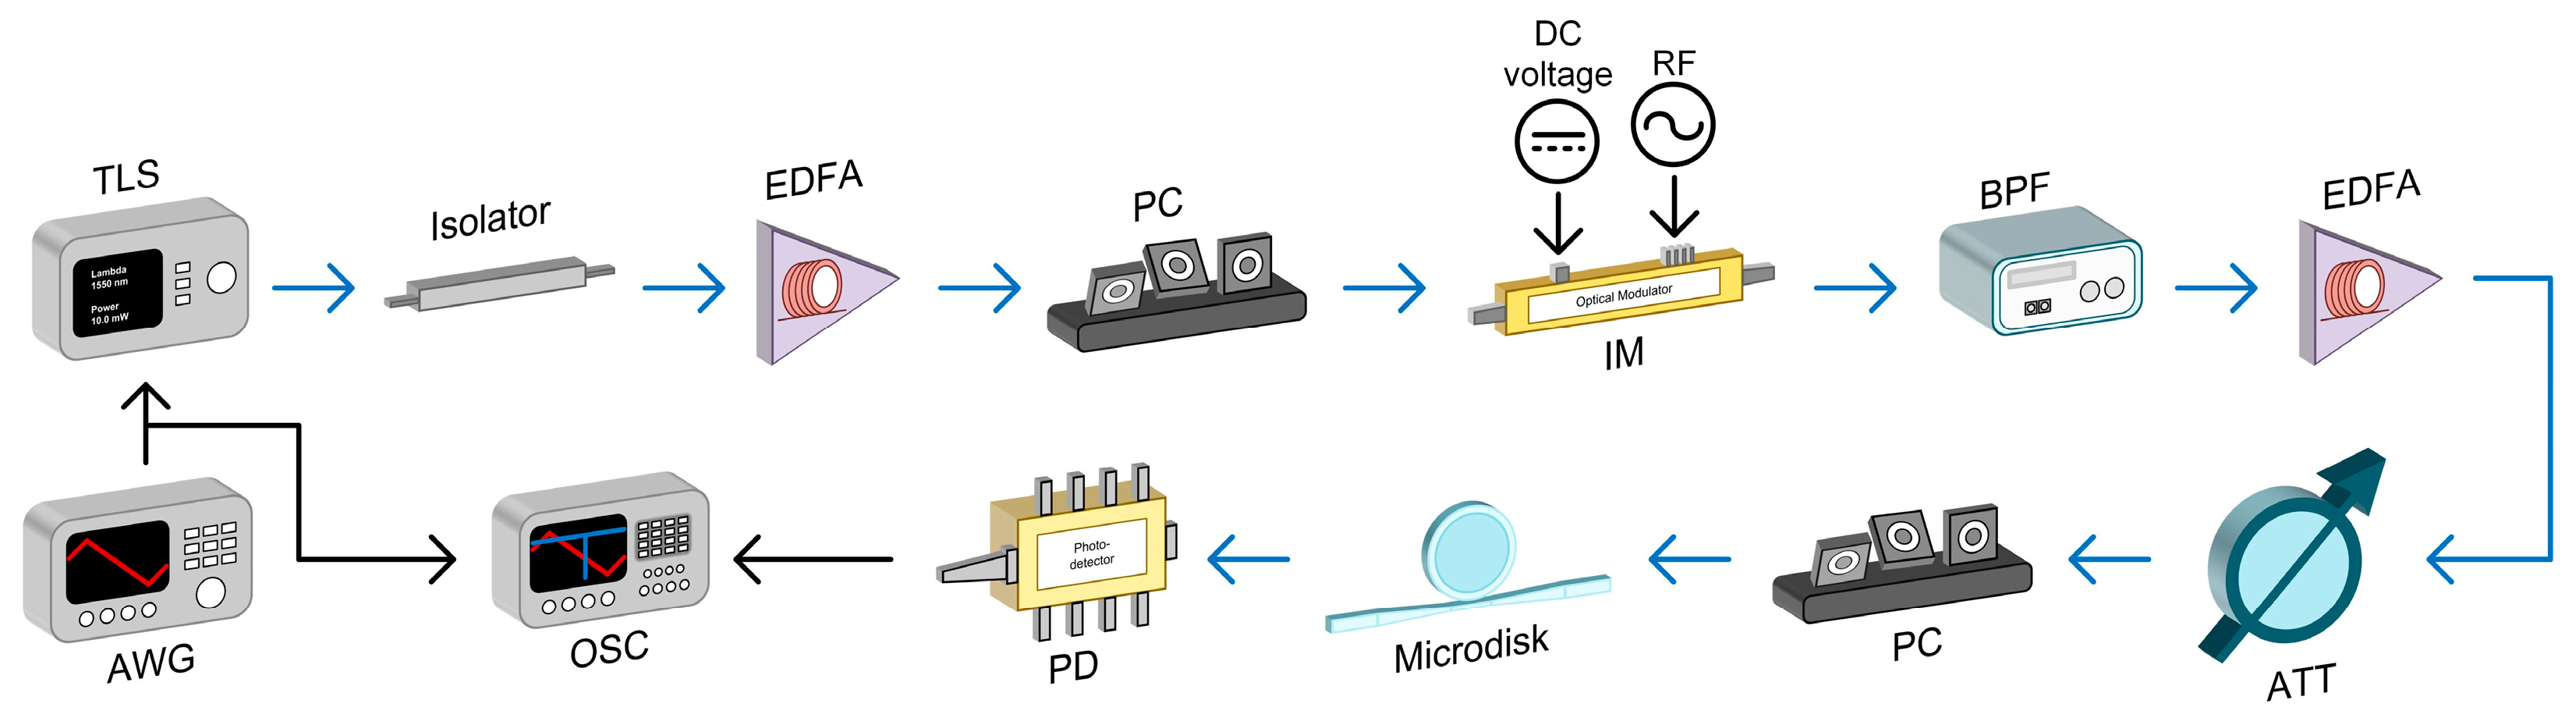
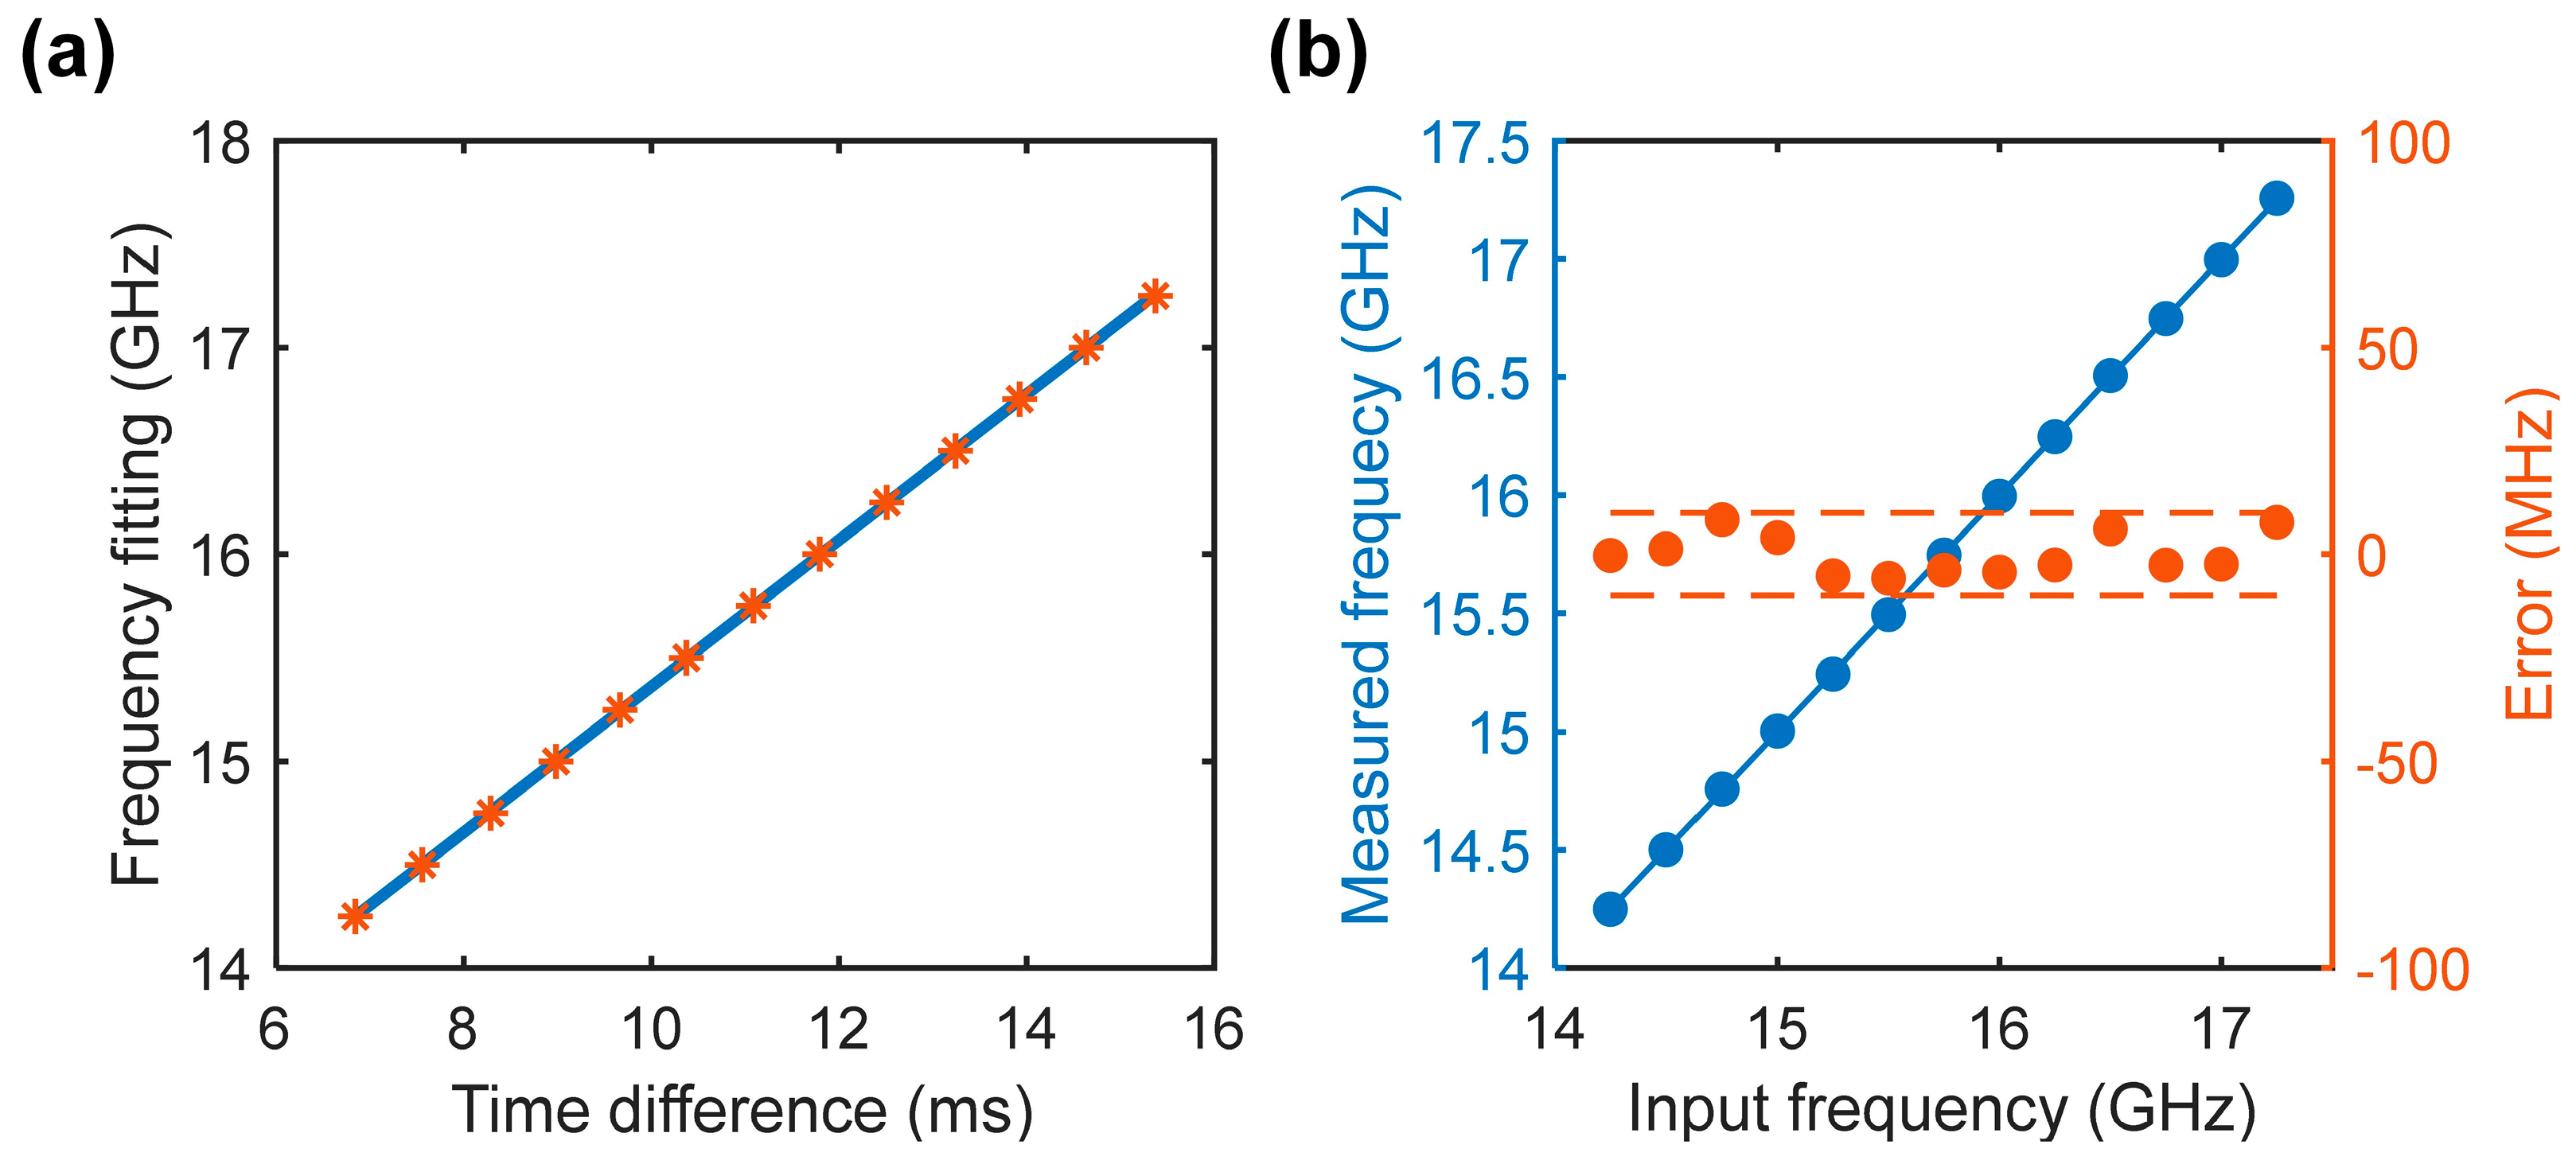
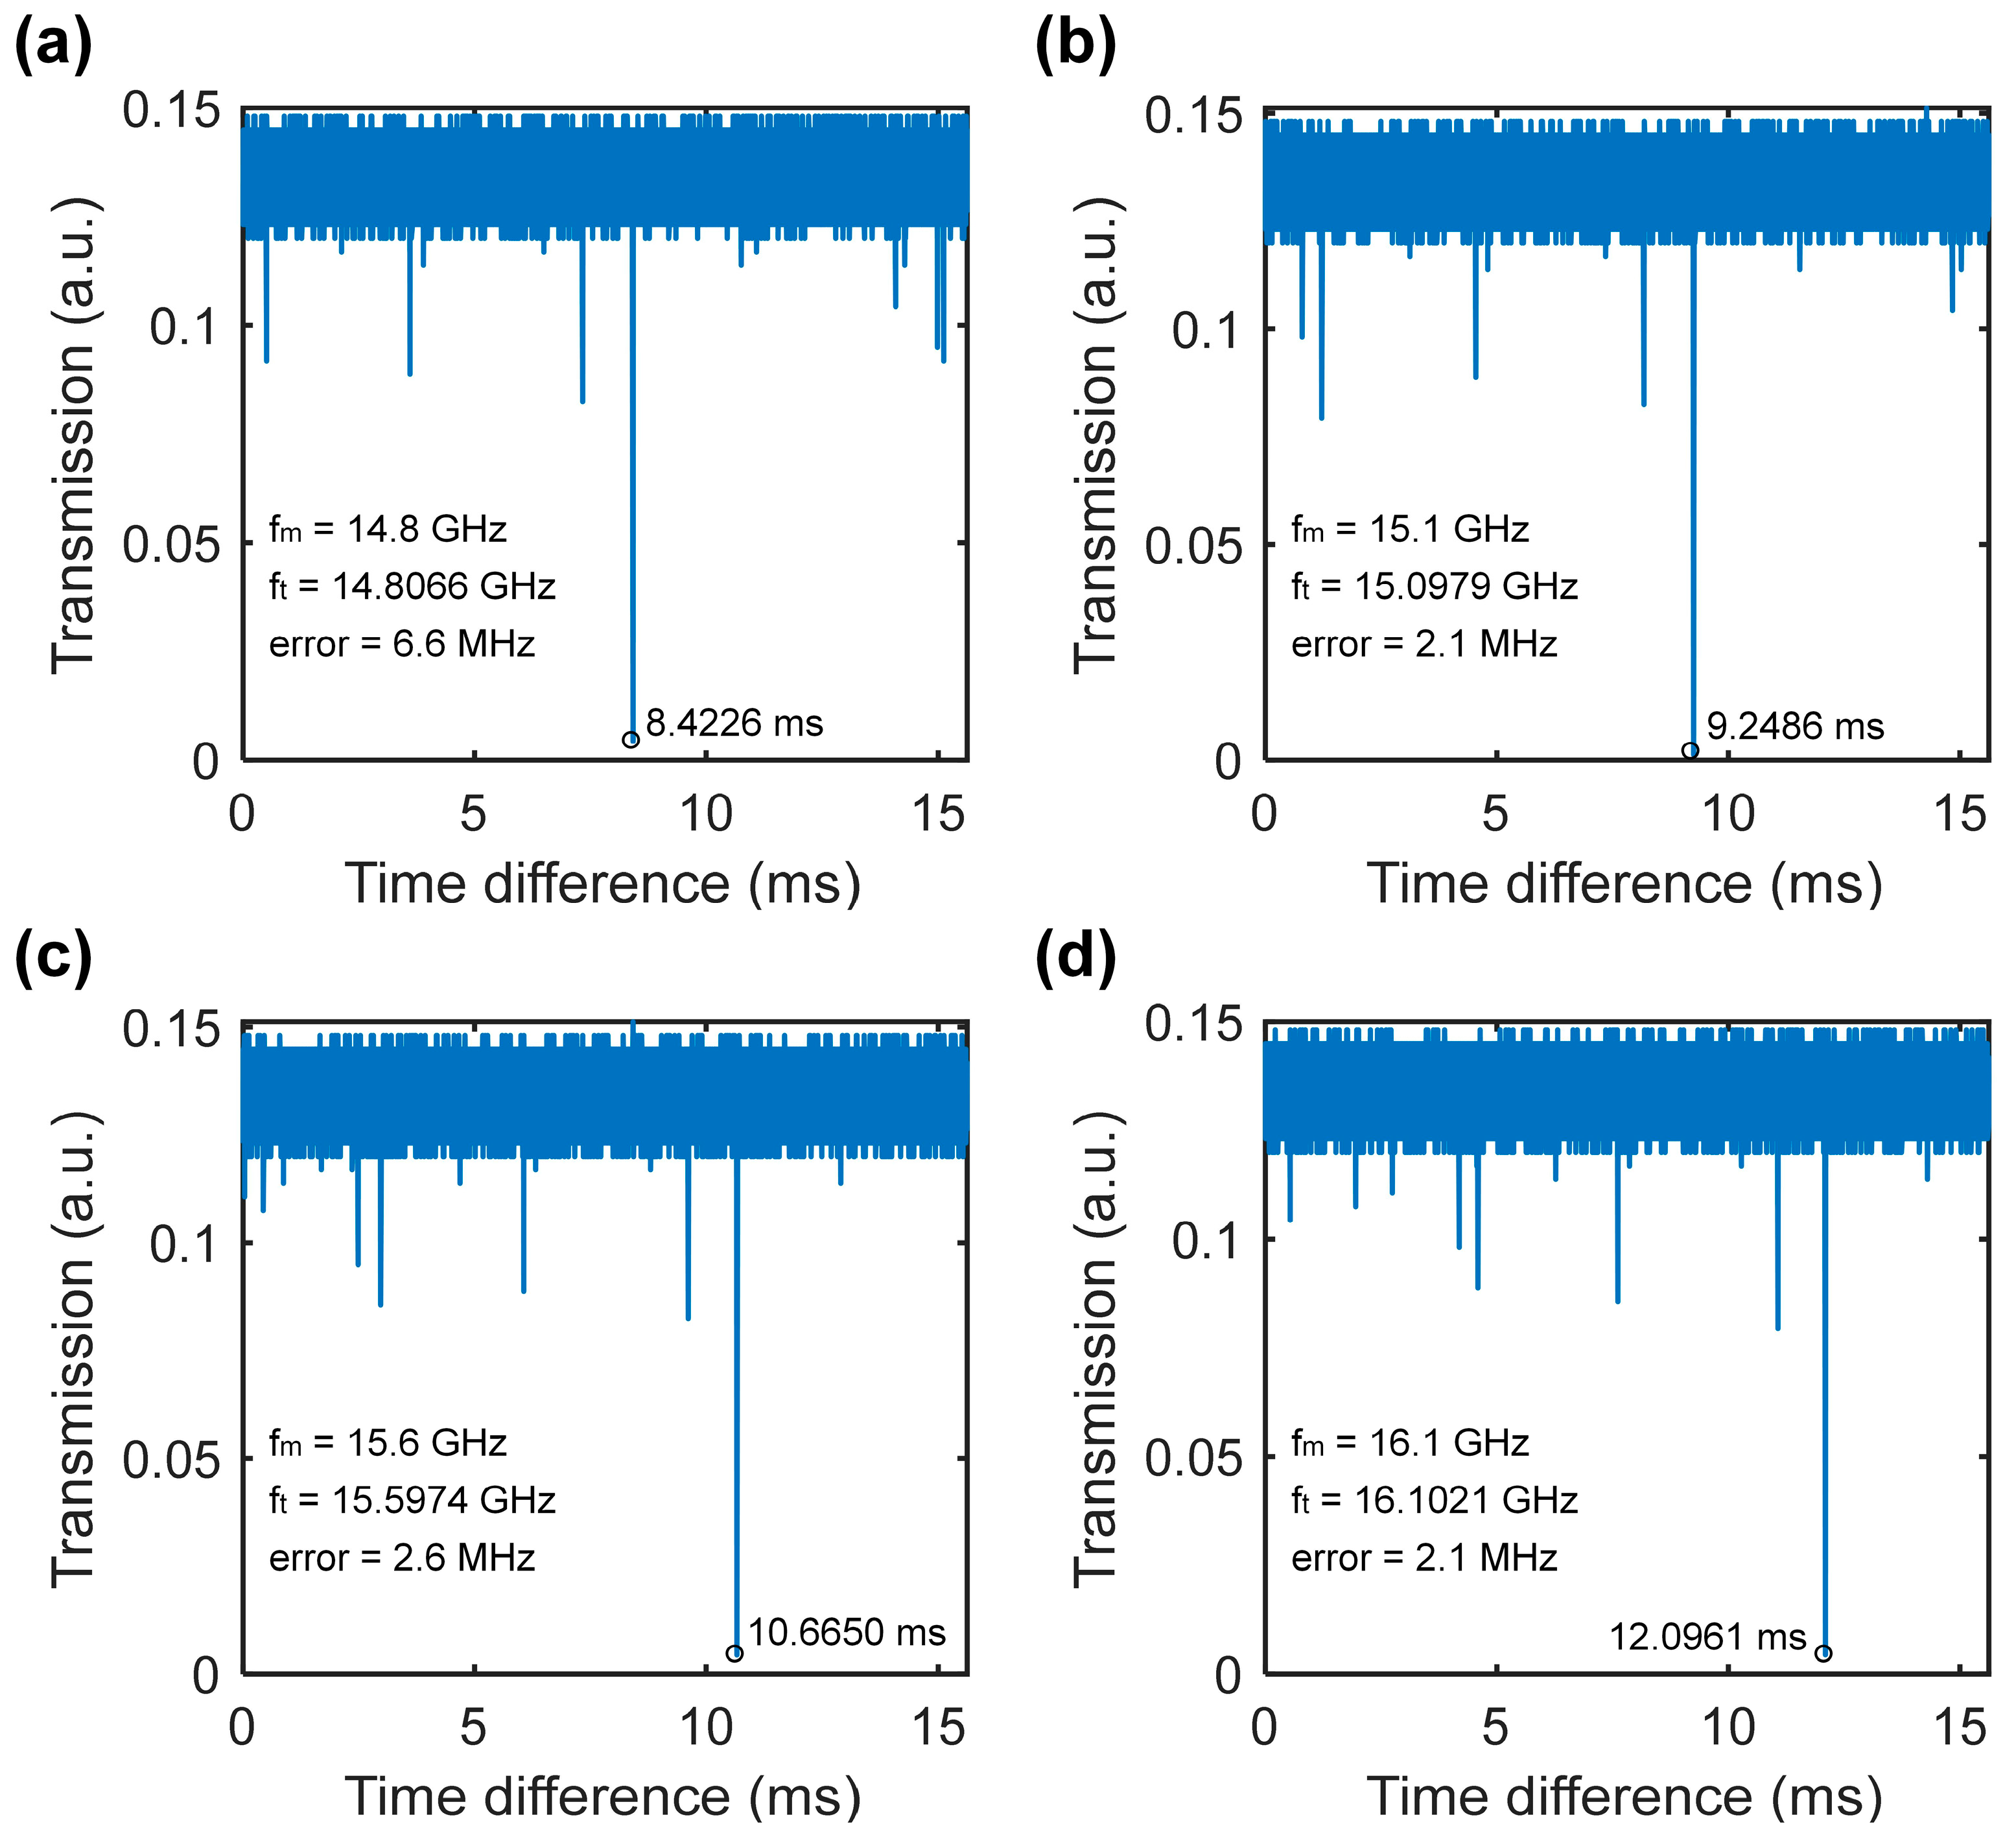
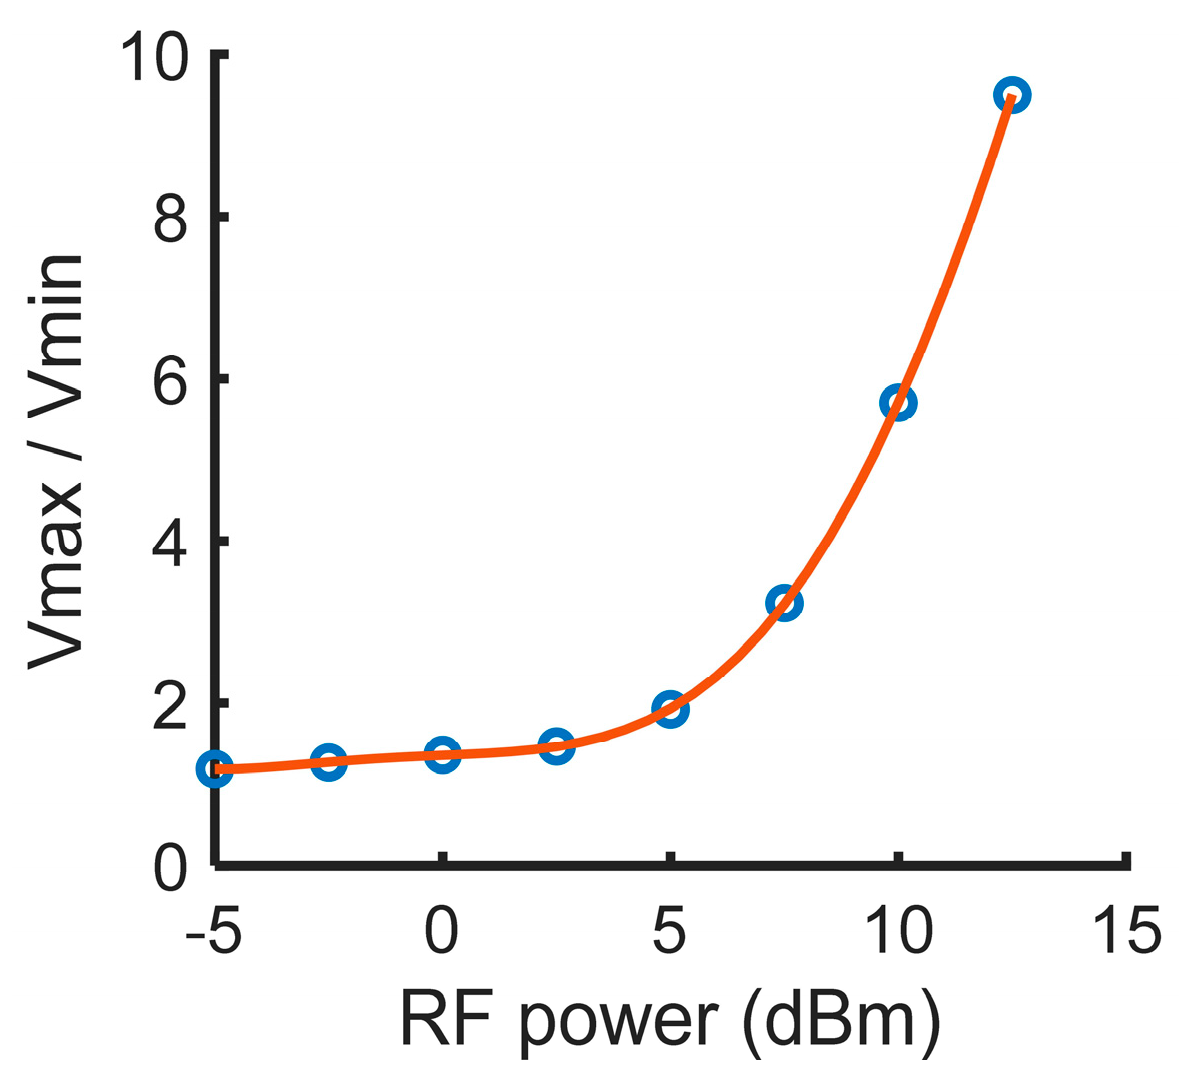
3. Results
4. Discussion
5. Conclusions
Author Contributions
Funding
Institutional Review Board Statement
Informed Consent Statement
Data Availability Statement
Conflicts of Interest
References
- Domdouzis, K.; Kumar, B.; Anumba, C. Radio-Frequency Identification (RFID) applications: A brief introduction. Adv. Eng. Inform. 2007, 21, 350–355. [Google Scholar] [CrossRef]
- Bolton, S.J.; Levin, S.M.; Guillot, T.; Li, C.; Kaspi, Y.; Orton, G.; Wong, M.H.; Oyafuso, F.; Allison, M.; Arballo, J.; et al. Microwave observations reveal the deep extent and structure of Jupiter’s atmospheric vortices. Science 2021, 374, 968–972. [Google Scholar] [CrossRef]
- Ali, L.; Wang, C.; Meng, F.Y.; Wei, Y.C.; Tan, X.; Adhikari, K.K.; Zhao, M. Simultaneous measurement of thickness and permittivity using microwave resonator-based planar sensor. Int. J. RF Microw. Comput. Aided Eng. 2021, 31, e22794. [Google Scholar] [CrossRef]
- Marpaung, D.; Roeloffzen, C.; Heideman, R.; Leinse, A.; Sales, S.; Capmany, J. Integrated microwave photonics. Laser Photonics Rev. 2013, 7, 506–538. [Google Scholar] [CrossRef] [Green Version]
- Zou, X.; Lu, B.; Pan, W.; Yan, L.; Stöhr, A.; Yao, J. Photonics for microwave measurements. Laser Photonics Rev. 2016, 10, 711–734. [Google Scholar] [CrossRef] [Green Version]
- Pan, S.; Yao, J. Photonics-Based Broadband Microwave Measurement. J. Light. Technol. 2017, 35, 3498–3513. [Google Scholar] [CrossRef]
- Capmany, J.; Novak, D. Microwave photonics combines two worlds. Nat. Photonics 2007, 1, 319–330. [Google Scholar] [CrossRef]
- Pelusi, M.; Luan, F.; Vo, T.D.; Lamont, M.R.E.; Madden, S.J.; Bulla, D.A.; Choi, D.-Y.; Luther-Davies, B.; Eggleton, B.J. Photonic-chip-based radio-frequency spectrum analyser with terahertz bandwidth. Nat. Photonics 2009, 3, 139–143. [Google Scholar] [CrossRef]
- Zhu, Y.-L.; Wu, B.-L.; Li, J.; Wang, M.-G.; Xiao, S.-Y.; Yan, F.-P. Switchable instantaneous frequency measurement by optical power monitoring based on DP-QPSK modulator. Chin. Phys. B 2022, 31, 044202. [Google Scholar] [CrossRef]
- Lin, T.; Zou, C.; Zhang, Z.; Zhao, S.; Liu, J.; Li, J.; Zhang, K.; Yu, W.; Wang, J.; Jiang, W. Differentiator-Based Photonic Instantaneous Frequency Measurement for Radar Warning Receiver. J. Light. Technol. 2020, 38, 3942–3949. [Google Scholar] [CrossRef]
- Emami, H.; Sarkhosh, N.; Ashourian, M. Reconfigurable photonic radar warning receiver based on cascaded grating. Opt. Express 2013, 21, 7734–7739. [Google Scholar] [CrossRef]
- Emami, H.; Sarkhosh, N.; Ashourian, M. Photonic simultaneous frequency identification of radio-frequency signals with multiple tones. Appl. Opt. 2013, 52, 5508–5515. [Google Scholar] [CrossRef]
- Nguyen, T.A.; Chan, E.H.W.; Minasian, R.A. Photonic Multiple Frequency Measurement Using a Frequency Shifting Recirculating Delay Line Structure. J. Light. Technol. 2014, 32, 3831–3838. [Google Scholar] [CrossRef]
- Nguyen, T.A.; Chan, E.H.; Minasian, R.A. Instantaneous high-resolution multiple-frequency measurement system based on frequency-to-time mapping technique. Opt. Lett. 2014, 39, 2419–2422. [Google Scholar] [CrossRef] [PubMed]
- Shi, J.; Zhang, F.; Ben, D.; Pan, S. Simultaneous Radar Detection and Frequency Measurement by Broadband Microwave Photonic Processing. J. Light. Technol. 2020, 38, 2171–2179. [Google Scholar] [CrossRef]
- Zhou, Y.; Zhang, F.; Shi, J.; Pan, S. Deep neural network-assisted high-accuracy microwave instantaneous frequency measurement with a photonic scanning receiver. Opt. Lett. 2020, 45, 3038–3041. [Google Scholar] [CrossRef]
- Shi, J.; Zhang, F.; Zhou, Y.; Pan, S.; Wang, Y.; Ben, D. Photonic scanning receiver for wide-range microwave frequency measurement by photonic frequency octupling and in-phase and quadrature mixing. Opt. Lett. 2020, 45, 5381–5384. [Google Scholar] [CrossRef]
- Burla, M.; Wang, X.; Li, M.; Chrostowski, L.; Azana, J. Wideband dynamic microwave frequency identification system using a low-power ultracompact silicon photonic chip. Nat. Commun. 2016, 7, 13004. [Google Scholar] [CrossRef] [PubMed] [Green Version]
- Yao, Y.; Zhao, Y.; Wei, Y.; Zhou, F.; Chen, D.; Zhang, Y.; Xiao, X.; Li, M.; Dong, J.; Yu, S.; et al. Highly Integrated Dual-Modality Microwave Frequency Identification System. Laser Photonics Rev. 2022, 16, 2200006. [Google Scholar] [CrossRef]
- Marpaung, D. On-Chip Photonic-Assisted Instantaneous Microwave Frequency Measurement System. IEEE Photonics Technol. Lett. 2013, 25, 837–840. [Google Scholar] [CrossRef]
- Zhu, B.; Zhang, W.; Pan, S.; Yao, J. High-Sensitivity Instantaneous Microwave Frequency Measurement Based on a Silicon Photonic Integrated Fano Resonator. J. Light. Technol. 2019, 37, 2527–2533. [Google Scholar] [CrossRef]
- Fandino, J.S.; Munoz, P. Photonics-based microwave frequency measurement using a double-sideband suppressed-carrier modulation and an InP integrated ring-assisted Mach-Zehnder interferometer filter. Opt. Lett. 2013, 38, 4316–4319. [Google Scholar] [CrossRef]
- Liu, L.; Jiang, F.; Yan, S.; Min, S.; He, M.; Gao, D.; Dong, J. Photonic measurement of microwave frequency using a silicon microdisk resonator. Opt. Commun. 2015, 335, 266–270. [Google Scholar] [CrossRef]
- Chen, Y.; Zhang, W.; Liu, J.; Yao, J. On-chip two-step microwave frequency measurement with high accuracy and ultra-wide bandwidth using add-drop micro-disk resonators. Opt. Lett. 2019, 44, 2402–2405. [Google Scholar] [CrossRef]
- Wang, X.; Zhou, F.; Gao, D.S.; Wei, Y.X.; Xiao, X.; Yu, S.H.; Dong, J.J.; Zhang, X.L. Wideband adaptive microwave frequency identification using an integrated silicon photonic scanning filter. Photonics Res. 2019, 7, 172–181. [Google Scholar] [CrossRef]
- Zhou, F.; Chen, H.; Wang, X.; Zhou, L.; Dong, J.; Zhang, X. Photonic Multiple Microwave Frequency Measurement Based on Frequency-to-Time Mapping. IEEE Photonics J. 2018, 10, 1–7. [Google Scholar] [CrossRef]
- Wang, H.; Dong, Y. High-performance transient SBS-based microwave measurement using high-chirp-rate modulation and advanced algorithms. Opt. Lett. 2023, 48, 3291–3294. [Google Scholar] [CrossRef]
- Wang, H.; Dong, Y. Real-Time and High-Accuracy Microwave Frequency Identification Based on Ultra-Wideband Optical Chirp Chain Transient SBS Effect. Laser Photonics Rev. 2023, 17, 2200239. [Google Scholar] [CrossRef]
- Liu, J.; Shi, T.; Chen, Y. High-Accuracy Multiple Microwave Frequency Measurement with Two-Step Accuracy Improvement Based on Stimulated Brillouin Scattering and Frequency-to-Time Mapping. J. Light. Technol. 2021, 39, 2023–2032. [Google Scholar] [CrossRef]
- Jiang, H.; Marpaung, D.; Pagani, M.; Vu, K.; Choi, D.-Y.; Madden, S.J.; Yan, L.; Eggleton, B.J. Wide-range, high-precision multiple microwave frequency measurement using a chip-based photonic Brillouin filter. Optica 2016, 3, 30–34. [Google Scholar] [CrossRef] [Green Version]
- Long, X.; Zou, W.; Chen, J. Broadband instantaneous frequency measurement based on stimulated Brillouin scattering. Opt. Express 2017, 25, 2206–2214. [Google Scholar] [CrossRef]
- Hao, T.; Tang, J.; Shi, N.; Li, W.; Zhu, N.; Li, M. Multiple-frequency measurement based on a Fourier domain mode-locked optoelectronic oscillator operating around oscillation threshold. Opt. Lett. 2019, 44, 3062–3065. [Google Scholar] [CrossRef] [PubMed]
- Nguyen, L. Microwave Photonic Technique for Frequency Measurement of Simultaneous Signals. IEEE Photonics Technol. Lett. 2009, 21, 642–644. [Google Scholar] [CrossRef]
- Cao, R.; He, Y.; Zheng, R.; He, Z.; Zhi, Y.; Wang, X.; Zhang, J.; Yao, J. Microwave frequency measurement using a silicon integrated microring resonator. Appl. Opt. 2022, 61, 6671–6676. [Google Scholar] [CrossRef] [PubMed]


| Structure | Range (GHz) | Error (MHz) | Reference |
|---|---|---|---|
| Silicon MRR | 14–25 | 200 | [34] |
| InP MZI | 5–15 | 200 (rms) * | [22] |
| TriPleX MRR | 0.5–4 | 93.6 (rms) | [20] |
| Silicon Microdisk | 1.6–40 | 60 | [24] |
| Silicon MRR | 3–19 | 500 | [21] |
| Silicon MRR | 1–30 | 237.3 (rms) | [25] |
| Silicon waveguide Bragg grating | 0–32 | 773 (rms) | [18] |
| Magnesium fluoride microdisk | 14.25–17.25 | 10 | This work |
Disclaimer/Publisher’s Note: The statements, opinions and data contained in all publications are solely those of the individual author(s) and contributor(s) and not of MDPI and/or the editor(s). MDPI and/or the editor(s) disclaim responsibility for any injury to people or property resulting from any ideas, methods, instructions or products referred to in the content. |
© 2023 by the authors. Licensee MDPI, Basel, Switzerland. This article is an open access article distributed under the terms and conditions of the Creative Commons Attribution (CC BY) license (https://creativecommons.org/licenses/by/4.0/).
Share and Cite
Zhao, M.; Wang, W.; Shi, L.; Che, C.; Dong, J. Photonic-Assisted Microwave Frequency Measurement Using High Q-Factor Microdisk with High Accuracy. Photonics 2023, 10, 847. https://doi.org/10.3390/photonics10070847
Zhao M, Wang W, Shi L, Che C, Dong J. Photonic-Assisted Microwave Frequency Measurement Using High Q-Factor Microdisk with High Accuracy. Photonics. 2023; 10(7):847. https://doi.org/10.3390/photonics10070847
Chicago/Turabian StyleZhao, Mengyao, Wenyu Wang, Lei Shi, Chicheng Che, and Jianji Dong. 2023. "Photonic-Assisted Microwave Frequency Measurement Using High Q-Factor Microdisk with High Accuracy" Photonics 10, no. 7: 847. https://doi.org/10.3390/photonics10070847