Non-Contact Real-Time Measurement of Refractive Index of Flowing Liquid Based on Optical Coherence Tomography


Abstract
:1. Introduction
2. Principles and Methods
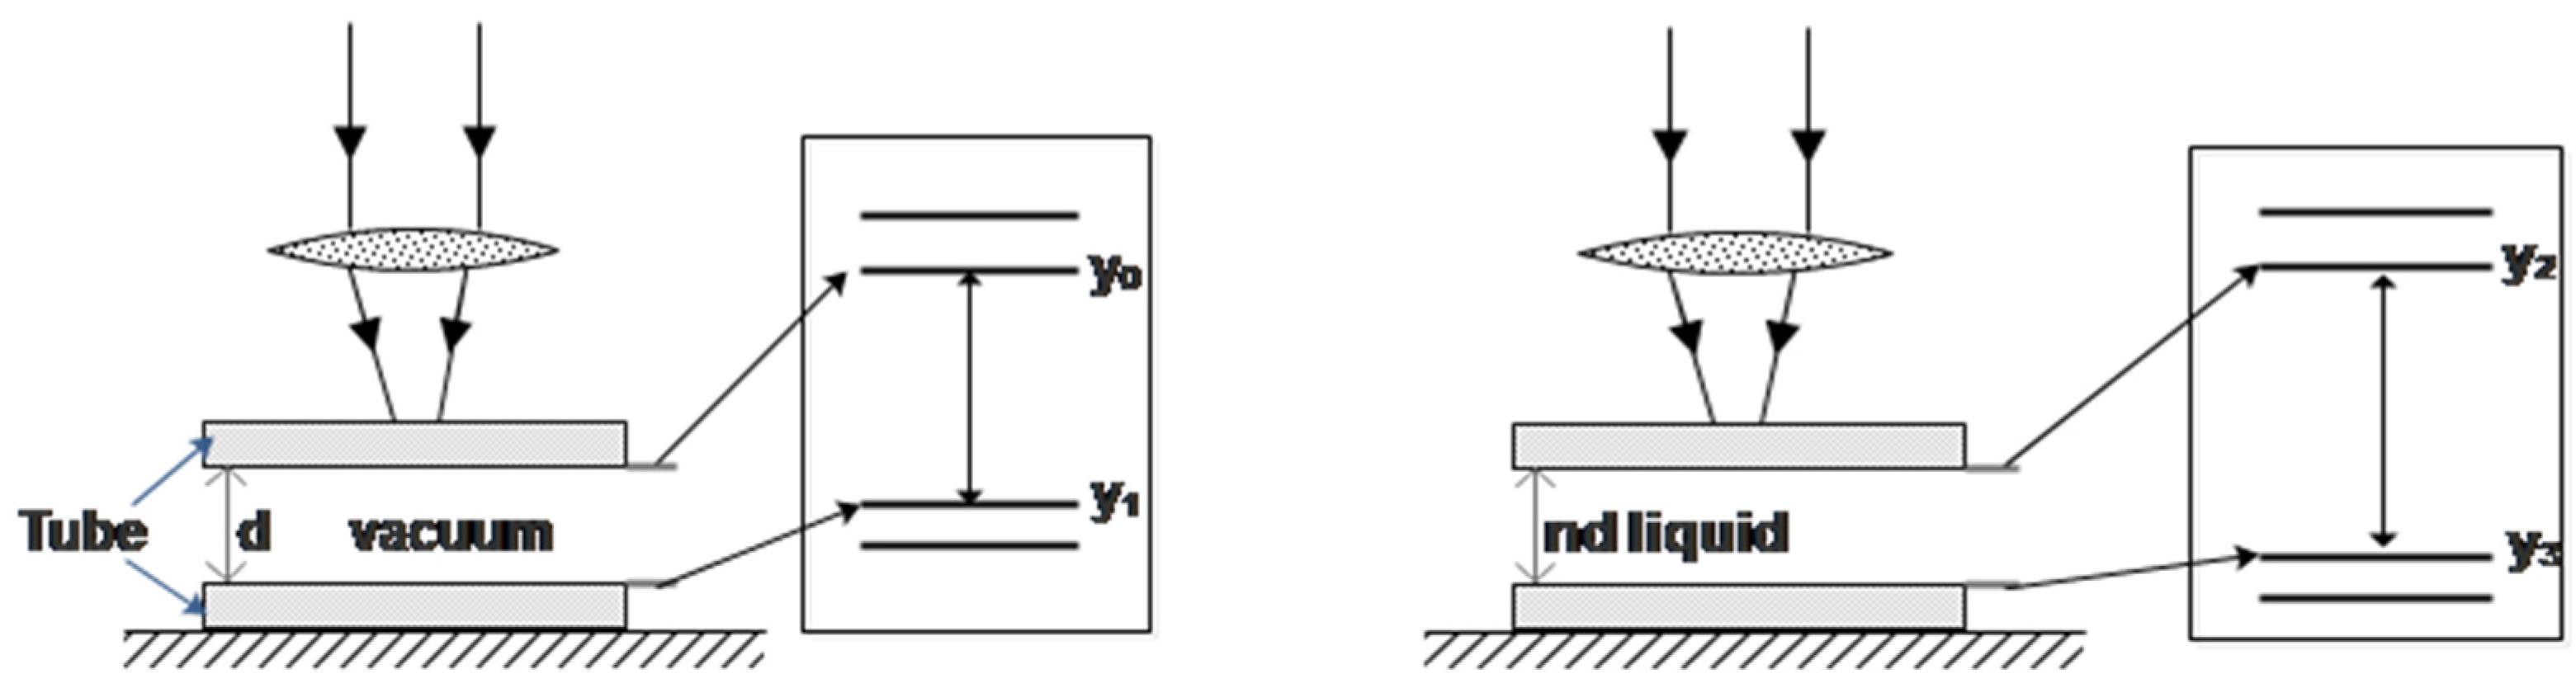
- (1)
- Physical Principles
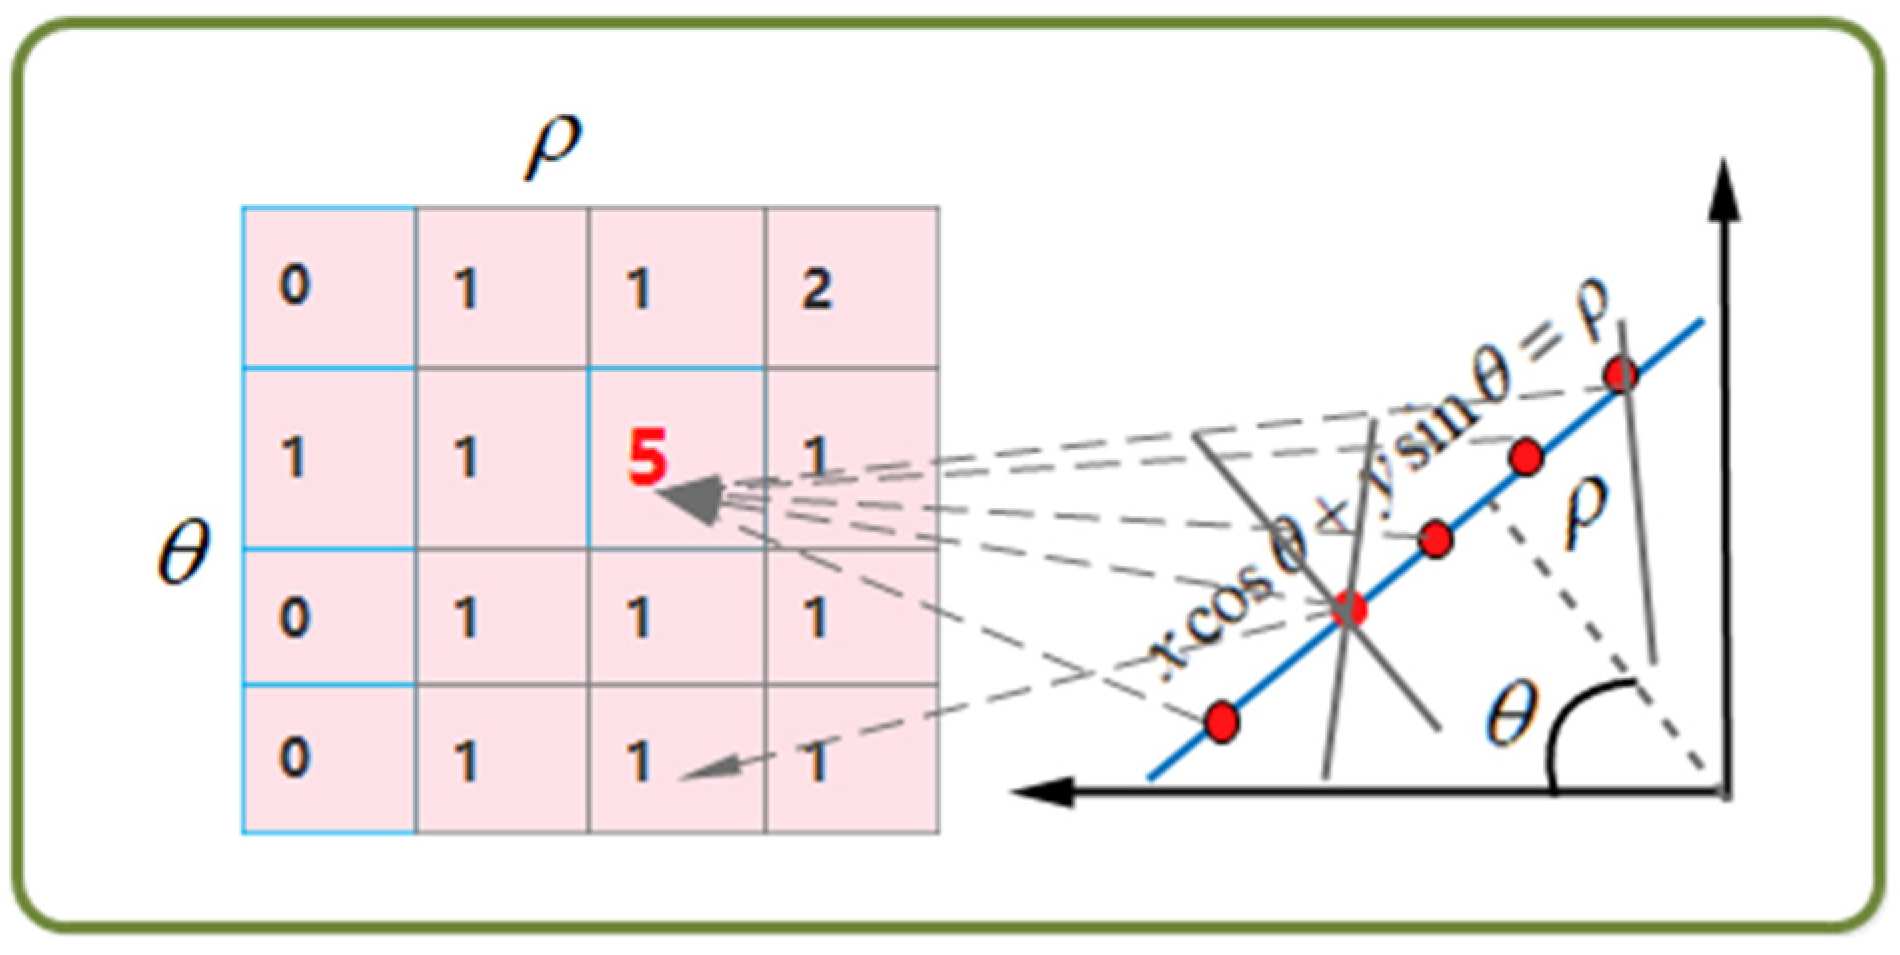
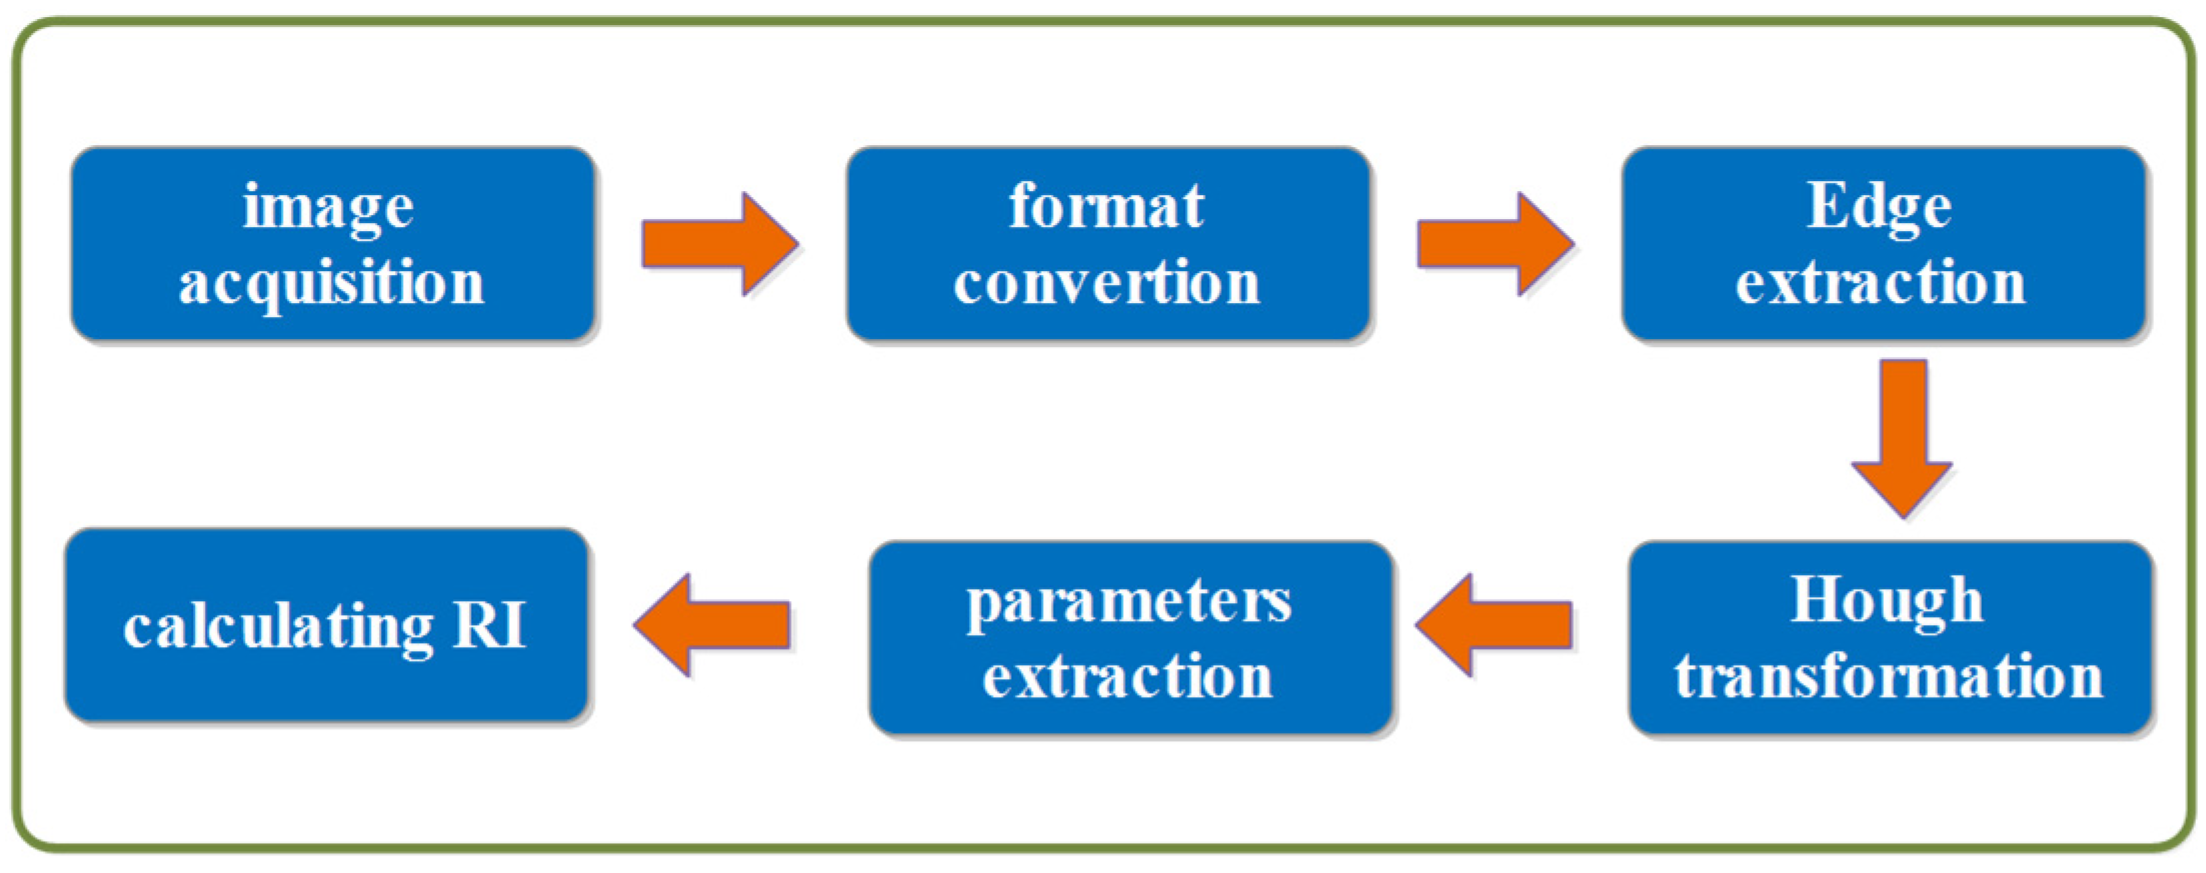
- (2)
- Image Processing Algorithm
3. Experimental Setup and Materials
4. Results
5. Discussion
6. Conclusions
Author Contributions
Funding
Institutional Review Board Statement
Informed Consent Statement
Data Availability Statement
Conflicts of Interest
References
- Singh, V.K.; Jaswal, B.B.S.; Kumar, V.; Prakash, R.; Rai, P. Application of He-Ne laser to study of the variation of refractive index of liquid solutions with the concentration. J. Integr. Sci. Technol. 2013, 1, 13–18. [Google Scholar]
- Syed, M.B. Analysis of biodiesel by high-performance liquid chromatography using refractive index detector. MethodsX 2017, 4, 256–259. [Google Scholar] [CrossRef] [PubMed]
- Hifzhi, A.; Soedarmawan, L.; Pambudi, S.; Sudarmaji, A.; Handoko, D. Simple Liquid-Liquid Diffusion Coefficient Measurement System Based on Refractive Index Gradients. In Proceedings of the 2017 International Seminar on Sensor, Instrumentation, Measurement and Metrology: Innovation for the Advancement and Competitiveness of the Nation, ISSIMM 2017, Surabaya, Indonesia, 25–26 August 2017; Institute of Electrical and Electronics Engineers Inc.: Piscataway, NJ, USA, 2017; pp. 65–68. [Google Scholar]
- Yan, X.; Li, B.; Cheng, T.; Li, S. Analysis of high sensitivity photonic crystal fiber sensor based on surface plasmon resonance of refractive indexes of liquids. Sensors 2018, 18, 2922. [Google Scholar] [CrossRef] [PubMed] [Green Version]
- Mitu, S.A.; Aktar, M.N.; Ibrahim, S.M.; Ahmed, K. Surface Plasmon Resonance–Based Refractive Index Biosensor: An External Sensing Approach. Plasmonics 2022, 17, 1581–1592. [Google Scholar] [CrossRef]
- Yang, A.; Li, W.; Yuan, G.; Dong, J.; Zhang, J. Measuring the refractive indices of liquids with a capillary tube interferometer. Appl. Opt. 2006, 45, 7993–7998. [Google Scholar] [CrossRef]
- Khashan, M.A.; Nassif, A.Y. Accurate measurement of the refractive indices of solids and liquids by the double-layer interferometer. Appl. Opt. 2000, 39, 5991–5997. [Google Scholar] [CrossRef] [PubMed]
- Tang, J.; Qiu, G.; Zhang, X.; Wang, J. A 3D-cascade-microlens optofluidic chip for refractometry with adjustable sensitivity. Lab Chip 2021, 21, 3784–3792. [Google Scholar] [CrossRef]
- Polynkin, P.; Polynkin, A.; Peyghambarian, N.; Mansuripur, M. Evanescent field-based optical fiber sensing device for measuring the refractive index of liquids in microfluidic channels. Opt. Lett. 2005, 30, 1273–1275. [Google Scholar] [CrossRef]
- Calixto, S.; Aguilar, M.R.; Hernandez, D.M.; Milkovich, V.P. Capillary refractometer integrated in a microfluidic configuration. Appl. Opt. 2008, 47, 843–848. [Google Scholar] [CrossRef]
- Chen, M.; Jia, W.; He, J.; Geiser, M.; Zheng, G. A miniaturized system for measurement of the refractive index of sub-microliter liquid. Chin. Opt. Lett. 2019, 17, 041201. [Google Scholar] [CrossRef] [Green Version]
- Tai, Y.H.; Wei, P.K. Sensitive liquid refractive index sensors using tapered optical fiber tips. Opt. Lett. 2010, 35, 944–946. [Google Scholar] [CrossRef]
- Murade, C.U.; Oh, J.M.; Van den Ende, D.; Mugele, F. Electrowetting driven optical switch and tunable aperture. Opt. Express 2011, 19, 15525–15531. [Google Scholar] [CrossRef]
- Singh, S. Measuring the refractive index of a liquid using a laser. Phys. Educ. 2002, 37, 152. [Google Scholar] [CrossRef]
- Rheims, J.; Köser, J.; Wriedt, T. Refractive-index measurements in the near-IR using an Abbe refractometer. Meas. Sci. Technol. 1997, 8, 601. [Google Scholar] [CrossRef]
- Liu, C.; Wang, D.; Wang, Q.H. Variable aperture with graded attenuation combined with adjustable focal length lens. Opt. Express 2019, 27, 14075–14084. [Google Scholar] [CrossRef] [PubMed]
- Xu, M.; Liu, Y.; Yuan, Y.; Lu, H.; Qiu, L. Variable-focus liquid lens based on electrically responsive fluid. Opt. Lett. 2022, 47, 509–512. [Google Scholar] [CrossRef]
- Duangkanya, K.; Kopwitthaya, A.; Chanhorm, S.; Infahsaeng, Y. Oxygen plasma treatment time induced hydrophilicity of polydimethylsiloxane (PDMS) thin films for liquid lenses application. Mater. Today Proc. 2022, 65, 2442–2445. [Google Scholar] [CrossRef]
- Li, S.L.; Nie, Z.Q.; Tian, Y.T.; Liu, C. Liquid refractive index measurement system based on electrowetting lens. Micromachines 2019, 10, 515. [Google Scholar] [CrossRef] [Green Version]
- Goodman, J.W. Introduction to Fourier Optics, 2nd ed.; McGraw-Hill, Inc.: New York, NY, USA, 1996; pp. 32–61. [Google Scholar]
- Sun, J.H.; Wang, M. Measuring the refractive index of liquid by optical fiber Young’s interference experiment. Phys. Exp. Coll. 2005, 18, 8–10. [Google Scholar]
- Deng, G.; Cai, Z.; Zhang, Y.; Xu, Y.; Wu, S.; Zhou, J. Refraction index measurement of transparent materials by using diffraction grating and CCD. Acta Opt. Sin. 2004, 24, 99–103. [Google Scholar]
- Calixto, S.; Bruce, N.C.; Rosete-Aguilar, M. Diffraction grating-based sensing optofluidic device for measuring the refractive index of liquids. Opt. Express 2016, 24, 180–190. [Google Scholar] [CrossRef]
- Calixto, S.; Piazza, V.; Gonzalez-Suarez, A.M.; Garcia-Cordero, J.L.; Bruce, N.C.; Rosete-Aguilar, M.; Garnica, G. Liquid refractive index measured through a refractometer based on diffraction gratings. Opt. Express 2019, 27, 34705–34720. [Google Scholar] [CrossRef] [PubMed]
- Lin, Y.; Xiang, X.; Chen, T.; Mao, G.; Deng, L.; Zeng, L.; Zhang, J. In vivo monitoring the dynamic process of acute retinal hemorrhage and repair in zebrafish with spectral-domain optical coherence tomography. J. Biophoton. 2019, 12, e201900235. [Google Scholar] [CrossRef] [PubMed]
- Lin, Y.; Chen, T.; Mao, G.; Qiu, T.; Lan, Y.; Xiang, X.; Huang, J.; Huang, J.; Lu, T.; Gan, S.; et al. Long-term and in vivo assessment of Aβ protein-induced brain atrophy in a zebrafish model by optical coherence tomography. J. Biophoton. 2020, 13, e202000067. [Google Scholar] [CrossRef]
- Huang, D.; Swanson, E.A.; Lin, C.P.; Schuman, J.S.; Stinson, W.G.; Chang, W.; Hee, M.R.; Flotte, T.; Gregory, K.; Puliafito, C.A.; et al. Optical coherence tomography. Science 1991, 254, 1178–1181. [Google Scholar] [CrossRef] [PubMed] [Green Version]
- Sun, J.; Lee, S.J.; Wu, L.; Sarntinoranont, M.; Xie, H. Refractive index measurement of acute rat brain tissue slices using optical coherence tomography. Opt. Express 2012, 20, 1084–1095. [Google Scholar] [CrossRef] [PubMed] [Green Version]
- Tearney, G.J.; Brezinski, M.E.; Southern, J.F.; Bouma, B.E.; Hee, M.R.; Fujimoto, J.G. Determination of the refractive index of highly scattering human tissue by optical coherence tomography. Opt. Lett. 1995, 20, 2258–2260. [Google Scholar] [CrossRef]
- Knuettel, A.R.; Boehlau-Godaum, M. Spatially confined and temporally resolved refractive index and scattering evaluation in human skin performed with optical coherence tomography. J. Biomed. Opt. 2000, 5, 83–92. [Google Scholar] [CrossRef]
- Binding, J.; Arous, J.B.; Léger, J.F.; Gigan, S.; Boccara, C.; Bourdieu, L. Brain refractive index measured in vivo with high-NA defocus-corrected full-field OCT and consequences for two-photon microscopy. Opt. Express 2011, 19, 4833–4847. [Google Scholar] [CrossRef] [Green Version]
- Photiou, C.; Pitris, C. Dual-angle optical coherence tomography for index of refraction estimation using rigid registration and cross-correlation. J. Biomed. Opt. 2019, 24, 106001. [Google Scholar] [CrossRef]
- Duda, R.O.; Hart, P.E. Use of the Hough transformation to detect lines and curves in pictures. Commun. ACM 1972, 15, 11–15. [Google Scholar] [CrossRef]
- Spaide, R.F.; Koizumi, H.; Pozonni, M.C. Enhanced depth imaging spectral-domain optical coherence tomography. Am. J. Ophthalmol. 2008, 146, 496–500. [Google Scholar] [CrossRef] [PubMed]
- Shao, Y.; Tao, A.; Jiang, H.; Shen, M.; Zhu, D.; Lu, F.; Karp, C.L.; Ye, Y.; Wang, J. Long scan depth optical coherence tomography on imaging accommodation: Impact of enhanced axial resolution, signal-to-noise ratio and speed. Eye Vis. 2018, 5, 16–27. [Google Scholar] [CrossRef] [PubMed] [Green Version]
- Gong, Z.; Shi, Y.; Wang, R.K. De-aliased depth-range-extended optical coherence tomography based on dual under-sampling. Opt. Lett. 2022, 47, 2642–2645. [Google Scholar] [CrossRef] [PubMed]


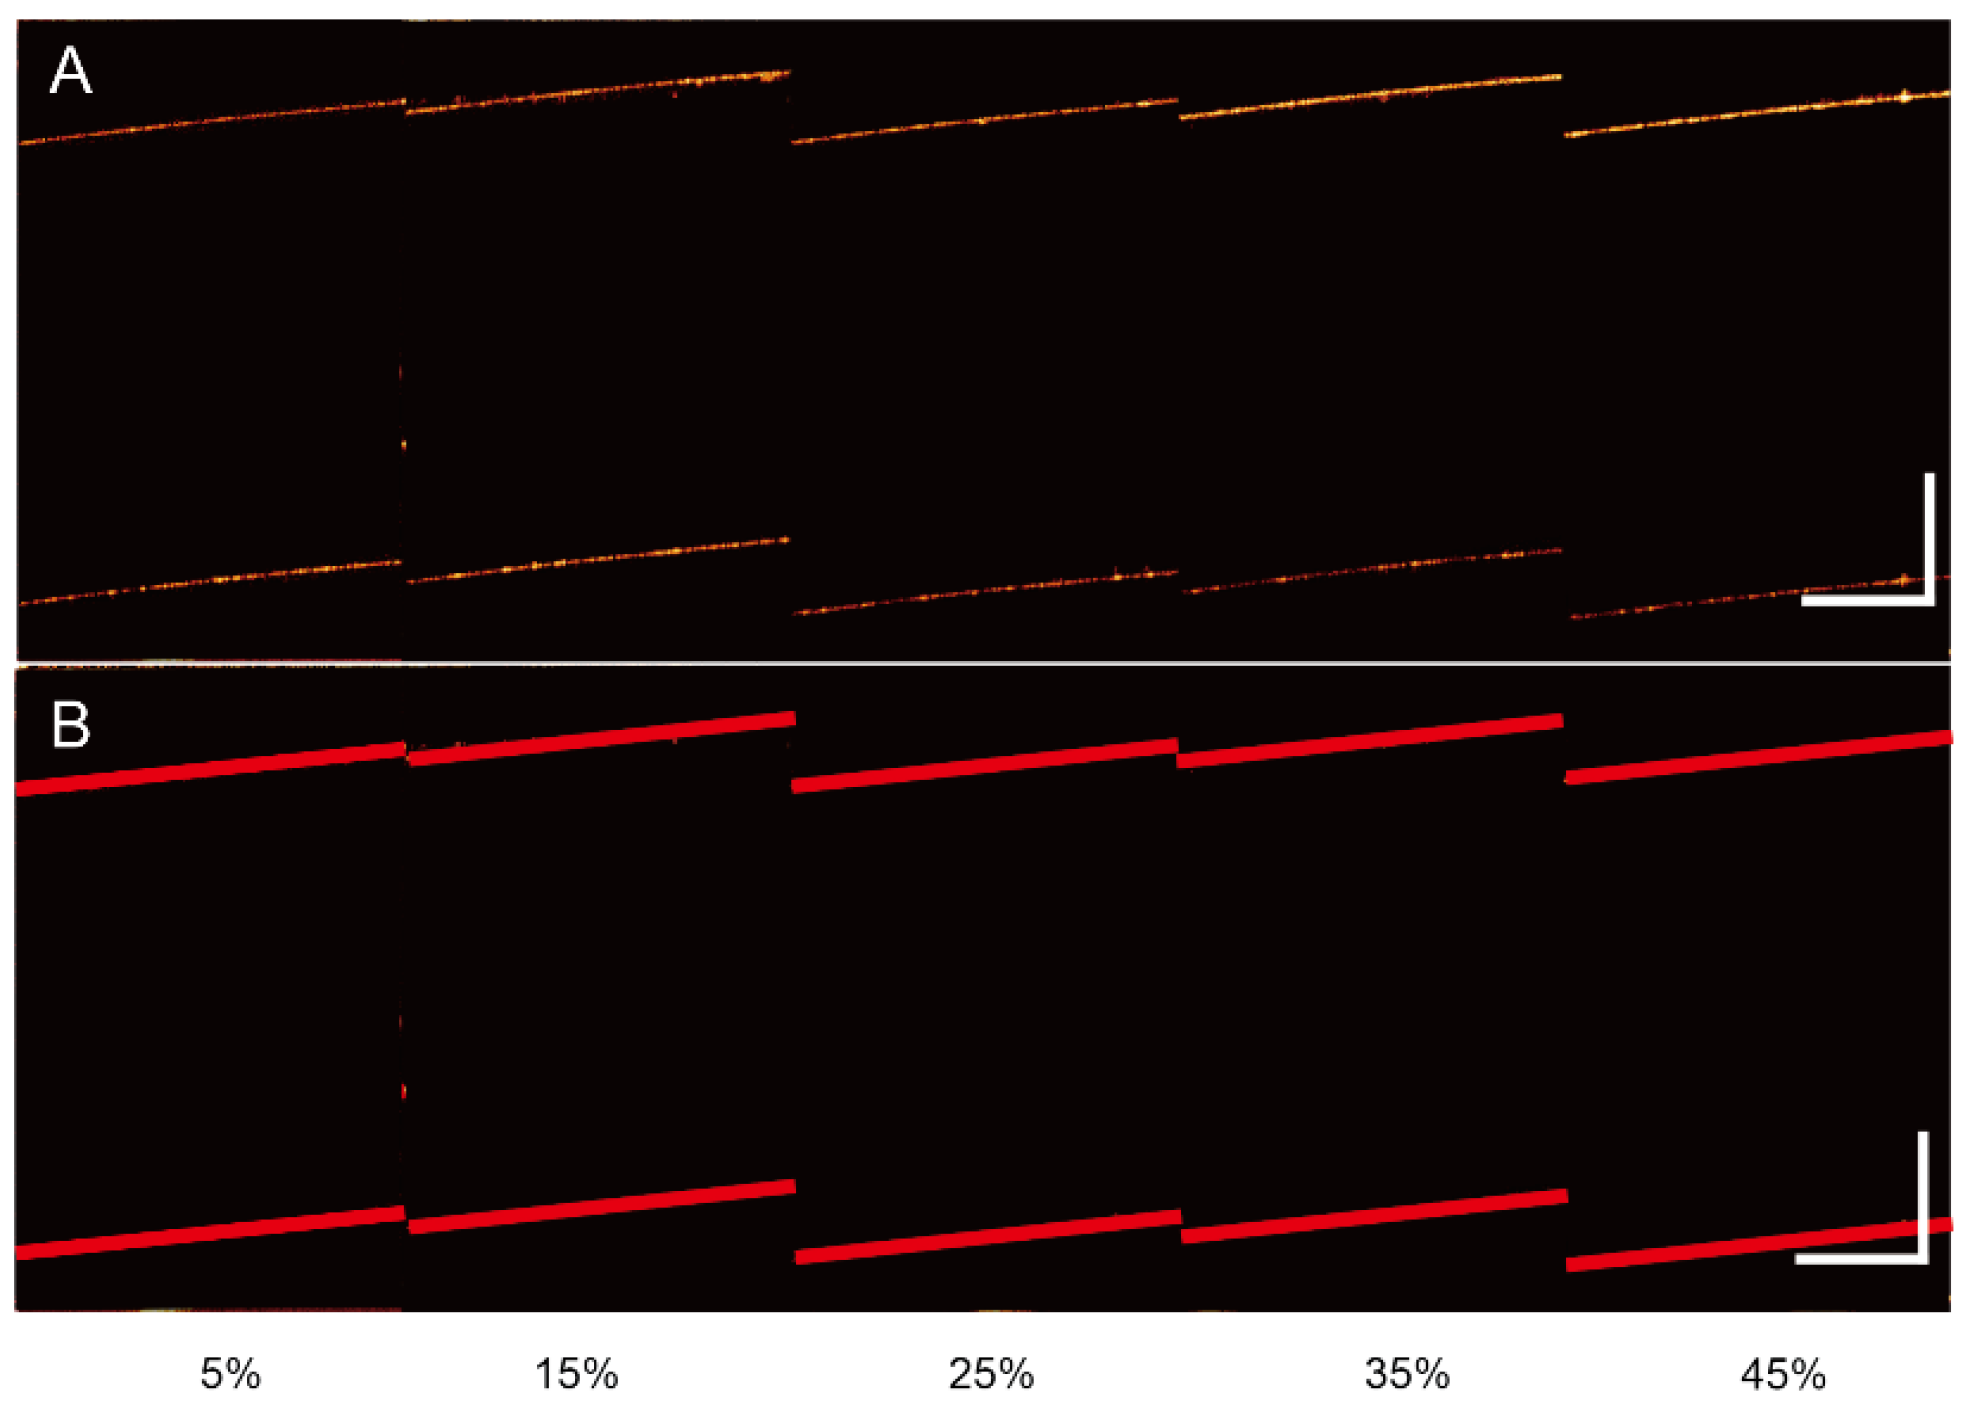
| Air | Water | 5% | 15% | 25% | 35% | 45% | |
|---|---|---|---|---|---|---|---|
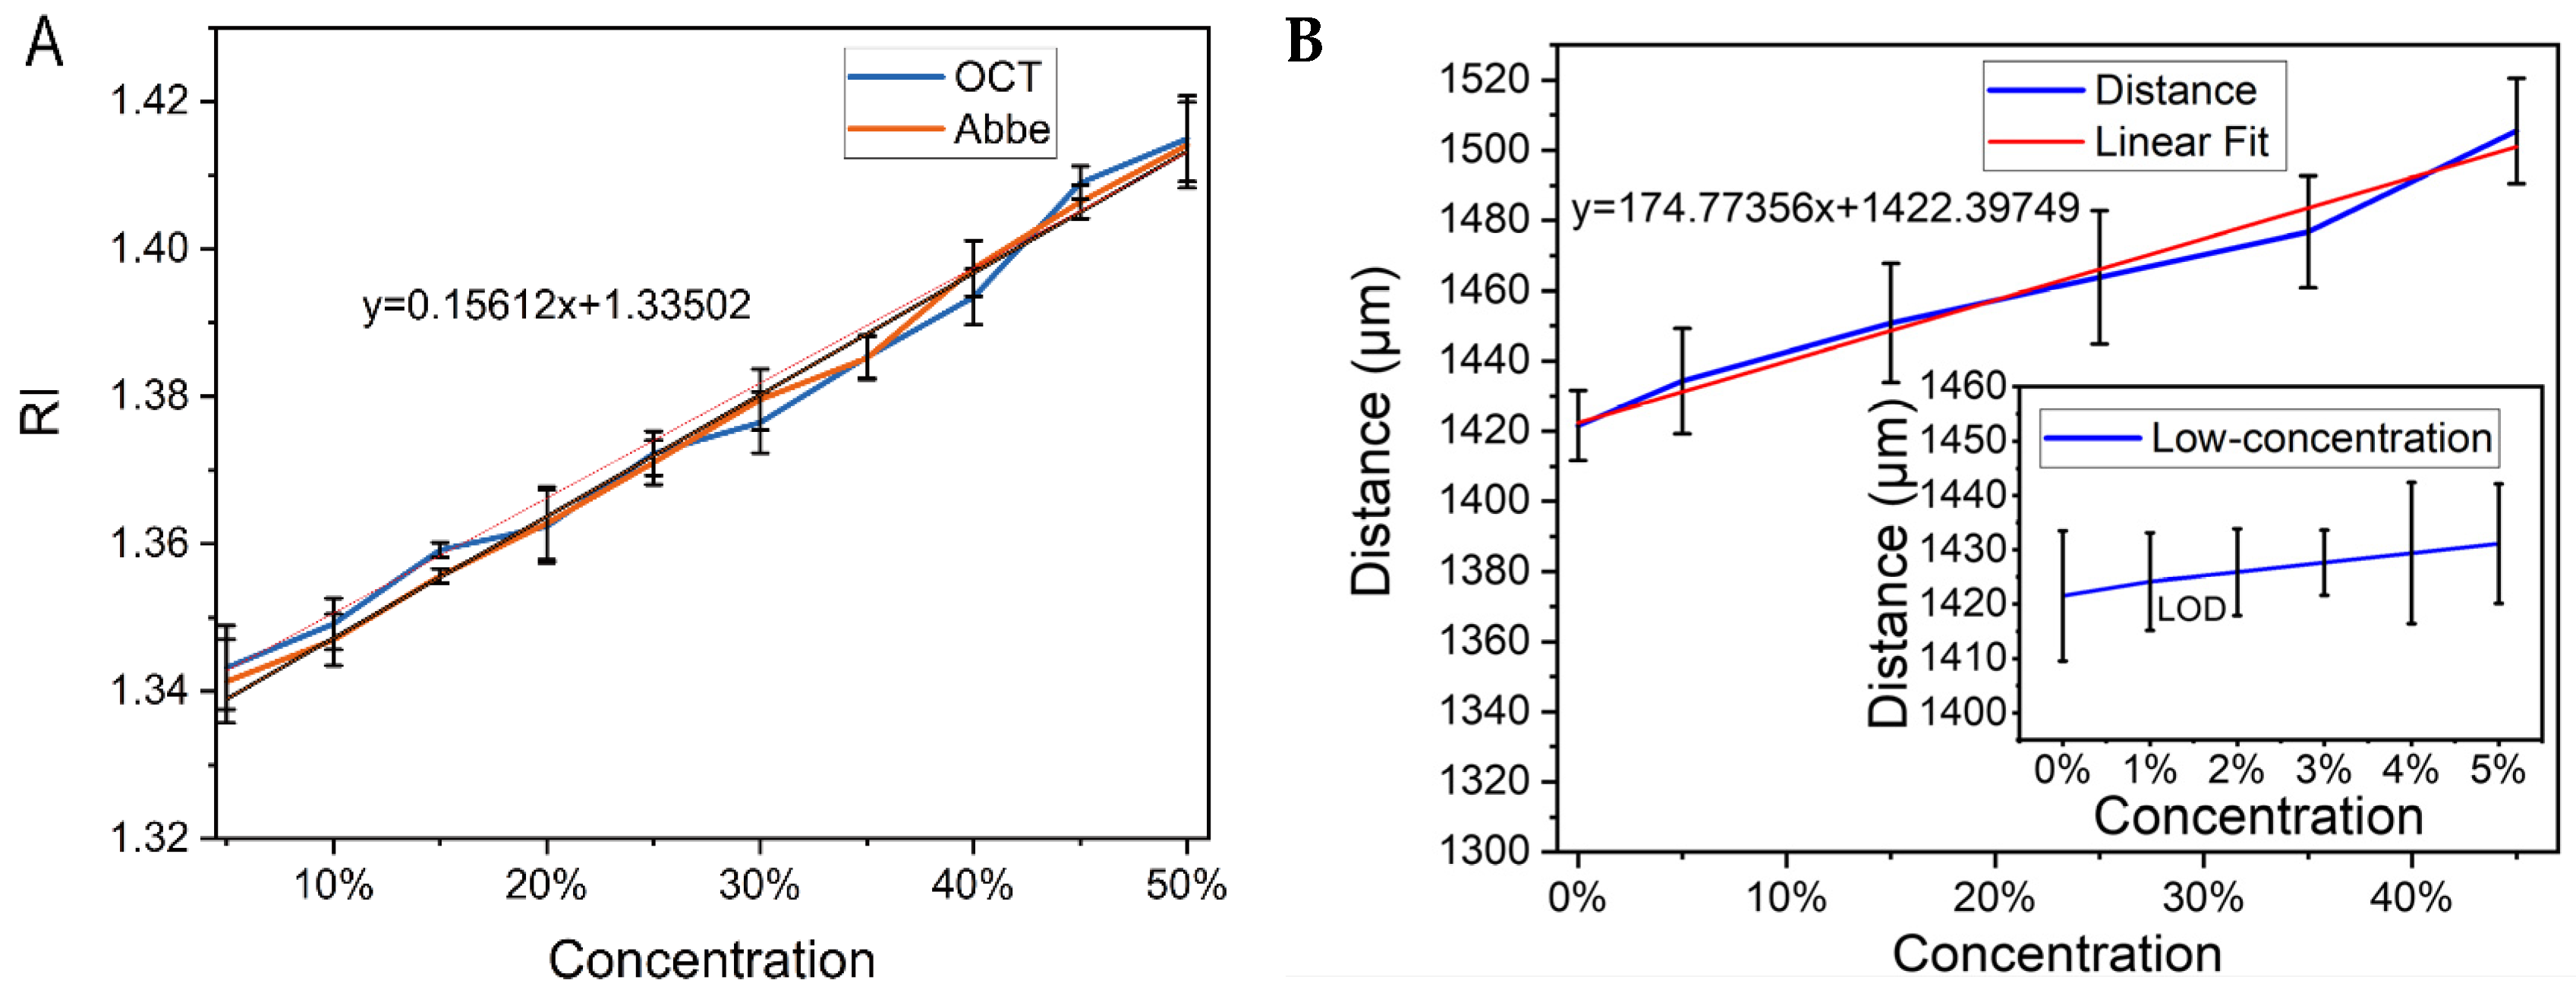
| Image distance(μm) | 1068.83 | 1421.54 | 1434.23 | 1450.81 | 1463.78 | 1476.76 | 1505.59 |
| RI of OCT | 1 | 1.331 | 1.342 | 1.351 | 1.370 | 1.382 | 1.409 |
| RI of AR | 1 | 1.3334 | 1.341 | 1.356 | 1.371 | 1.385 | 1.406 |
| water | 1% | 2% | 3% | 4% | 5% | ||
| Image distance(μm) | 1421.53 | 1424.14 | 1425.89 | 1427.64 | 1429.38 | 1434.25 |
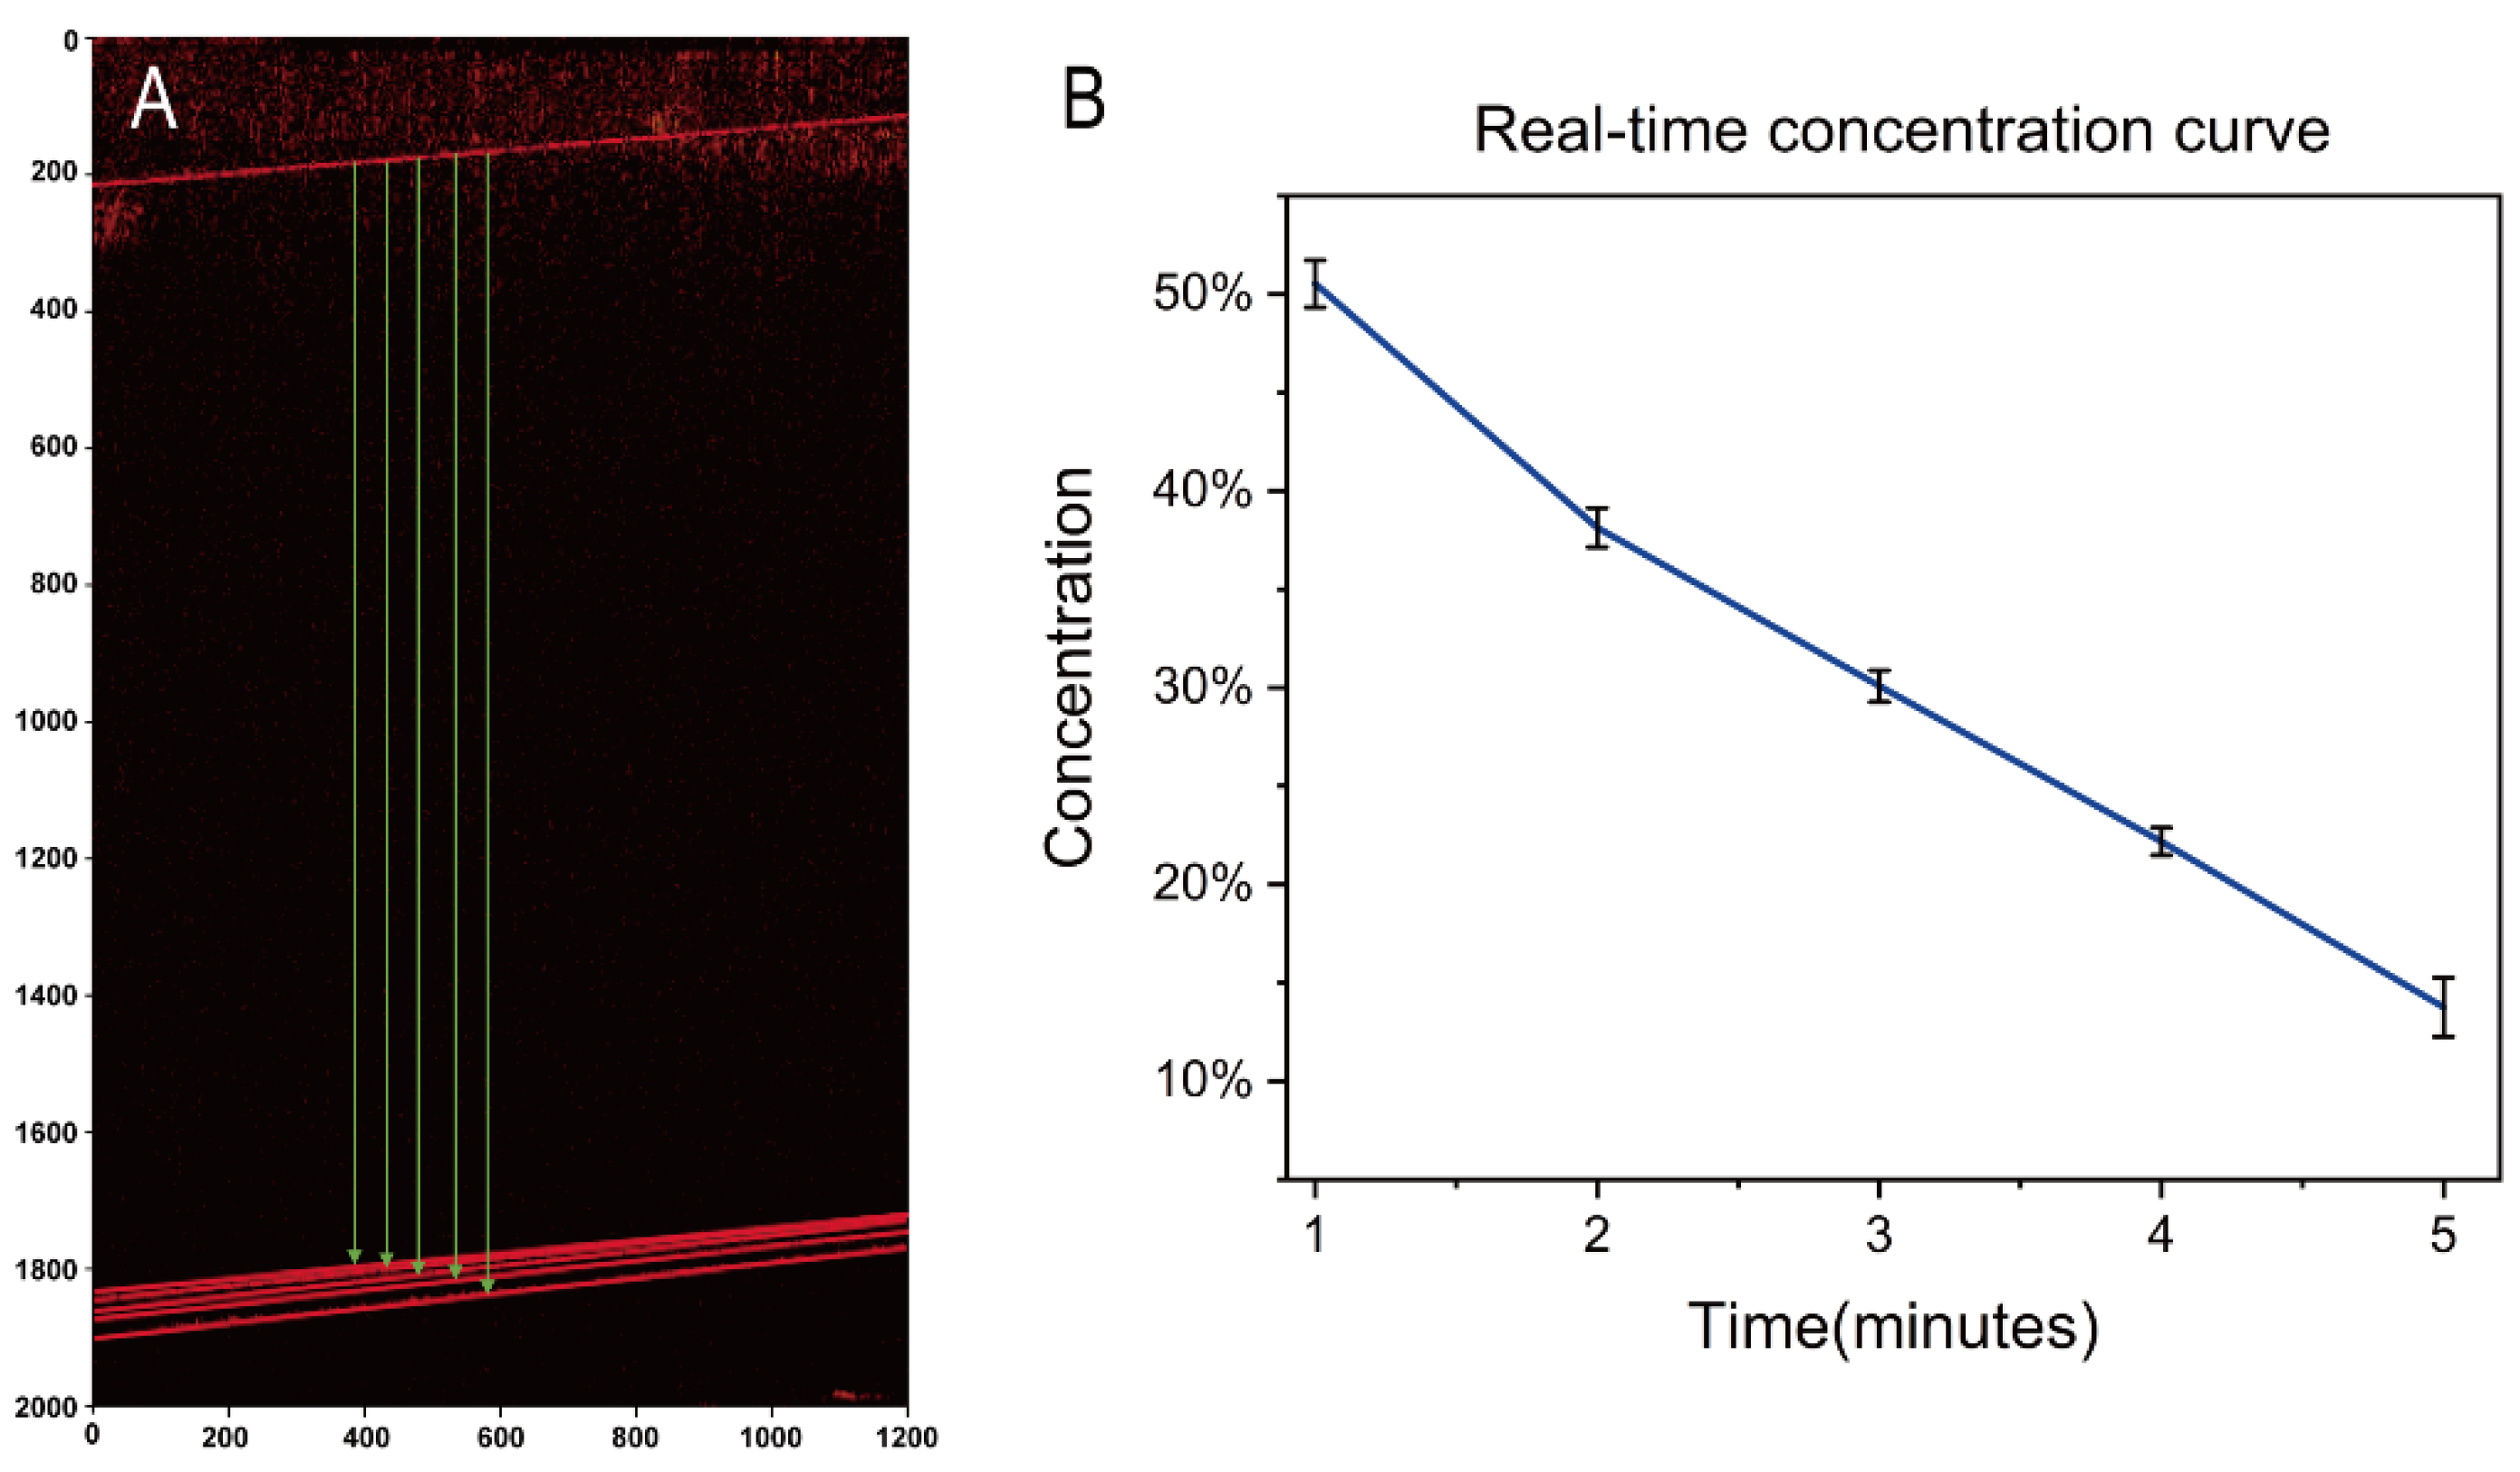
| Time/Minutes | 1 | 2 | 3 | 4 | 5 |
|---|---|---|---|---|---|
| Image distance (μm) | 1509.302 | 1488.392 | 1474.808 | 1461.476 | 1447.269 |
| Solution concentration | 50.54% | 38.14% | 30.08% | 22.18% | 13.75% |
Disclaimer/Publisher’s Note: The statements, opinions and data contained in all publications are solely those of the individual author(s) and contributor(s) and not of MDPI and/or the editor(s). MDPI and/or the editor(s) disclaim responsibility for any injury to people or property resulting from any ideas, methods, instructions or products referred to in the content. |
© 2023 by the authors. Licensee MDPI, Basel, Switzerland. This article is an open access article distributed under the terms and conditions of the Creative Commons Attribution (CC BY) license (https://creativecommons.org/licenses/by/4.0/).
Share and Cite
Fu, H.; Gao, W.; Lin, Z.; Zeng, Z.; Shi, W.; Zhang, J. Non-Contact Real-Time Measurement of Refractive Index of Flowing Liquid Based on Optical Coherence Tomography. Photonics 2023, 10, 841. https://doi.org/10.3390/photonics10070841
Fu H, Gao W, Lin Z, Zeng Z, Shi W, Zhang J. Non-Contact Real-Time Measurement of Refractive Index of Flowing Liquid Based on Optical Coherence Tomography. Photonics. 2023; 10(7):841. https://doi.org/10.3390/photonics10070841
Chicago/Turabian StyleFu, Hongbo, Weijian Gao, Zixin Lin, Zhemin Zeng, Wen Shi, and Jian Zhang. 2023. "Non-Contact Real-Time Measurement of Refractive Index of Flowing Liquid Based on Optical Coherence Tomography" Photonics 10, no. 7: 841. https://doi.org/10.3390/photonics10070841