Hierarchical Feature Enhancement Algorithm for Multispectral Infrared Images of Dark and Weak Targets

Abstract
:1. Introduction
2. Methods
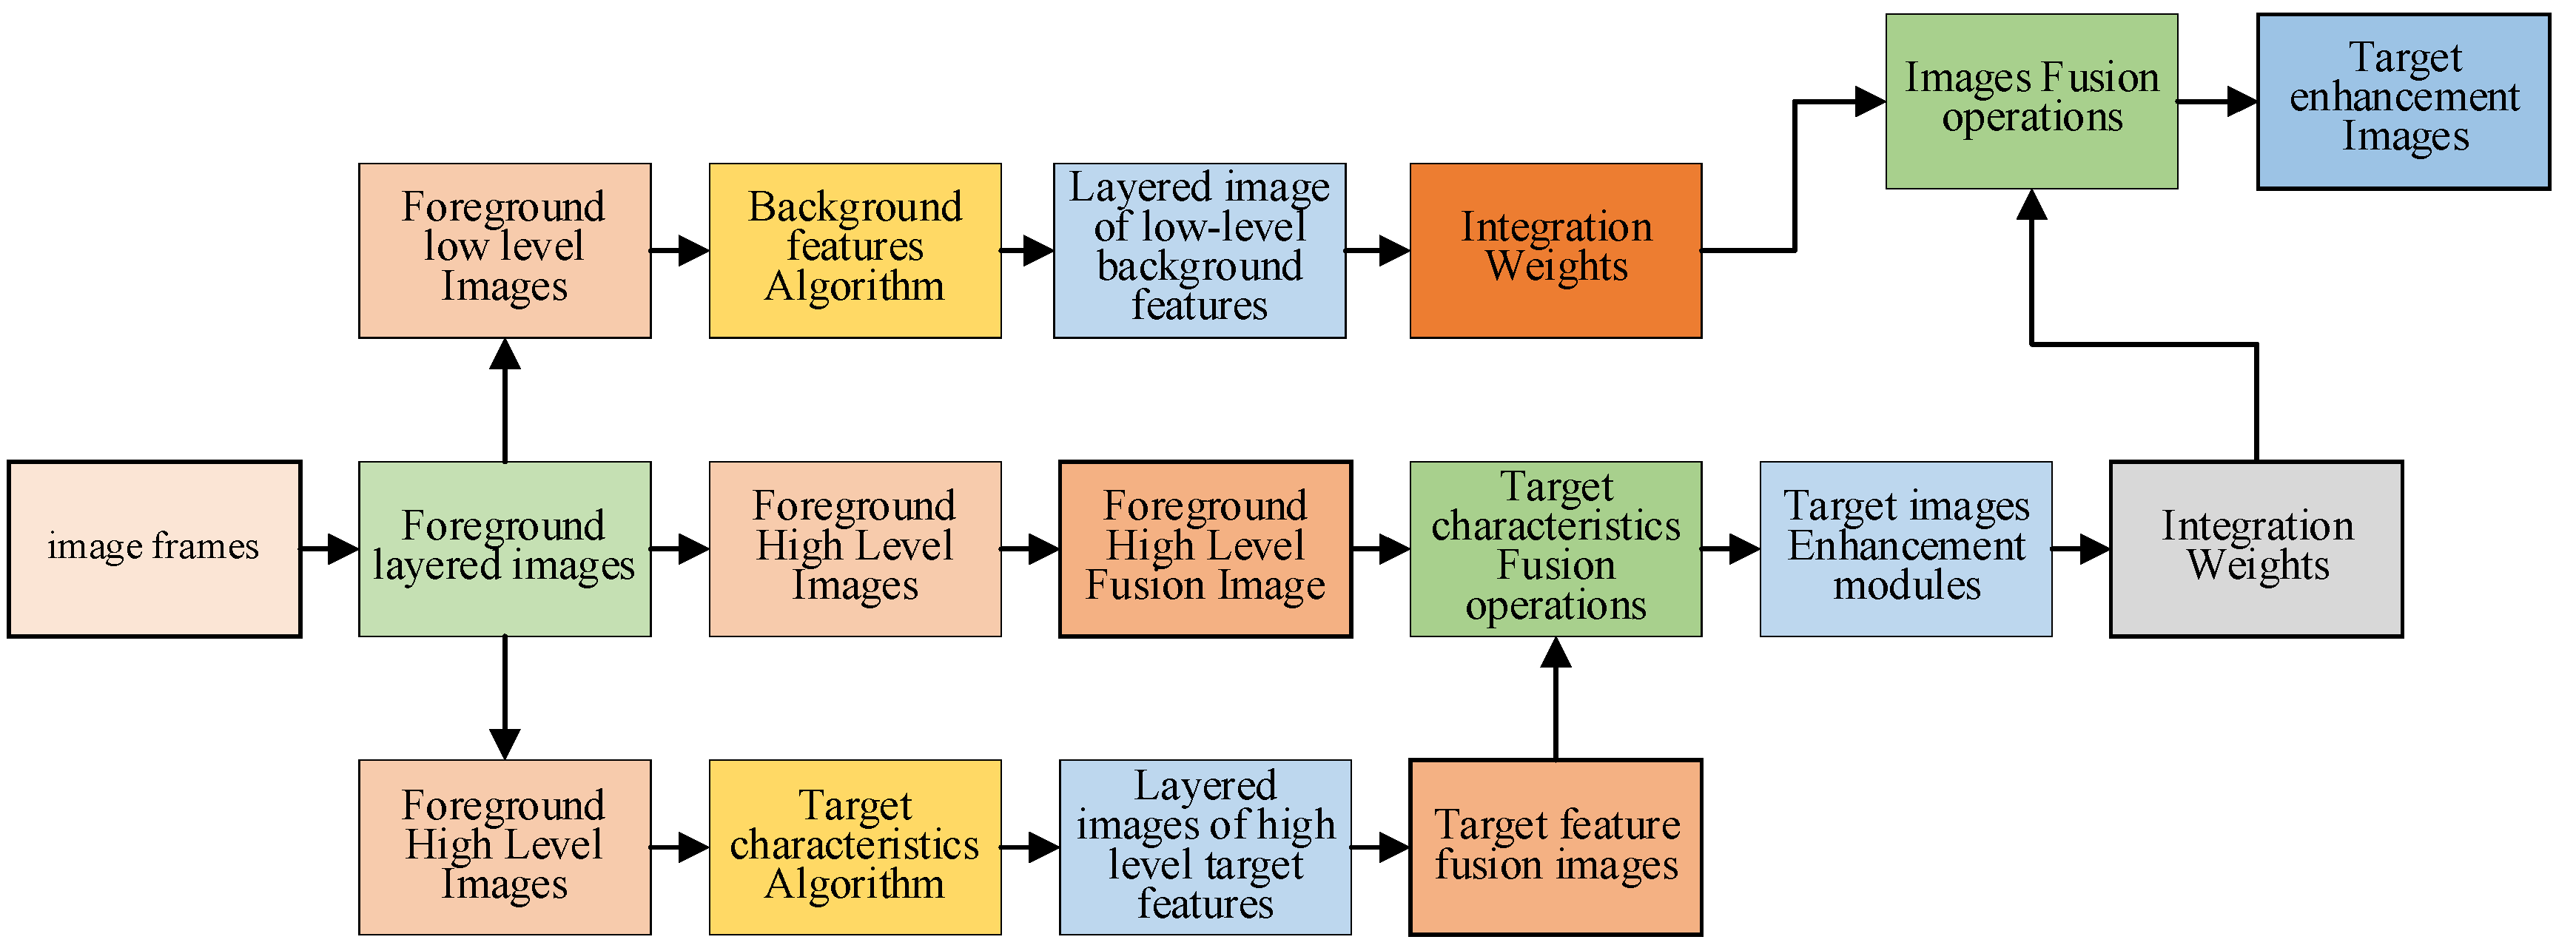
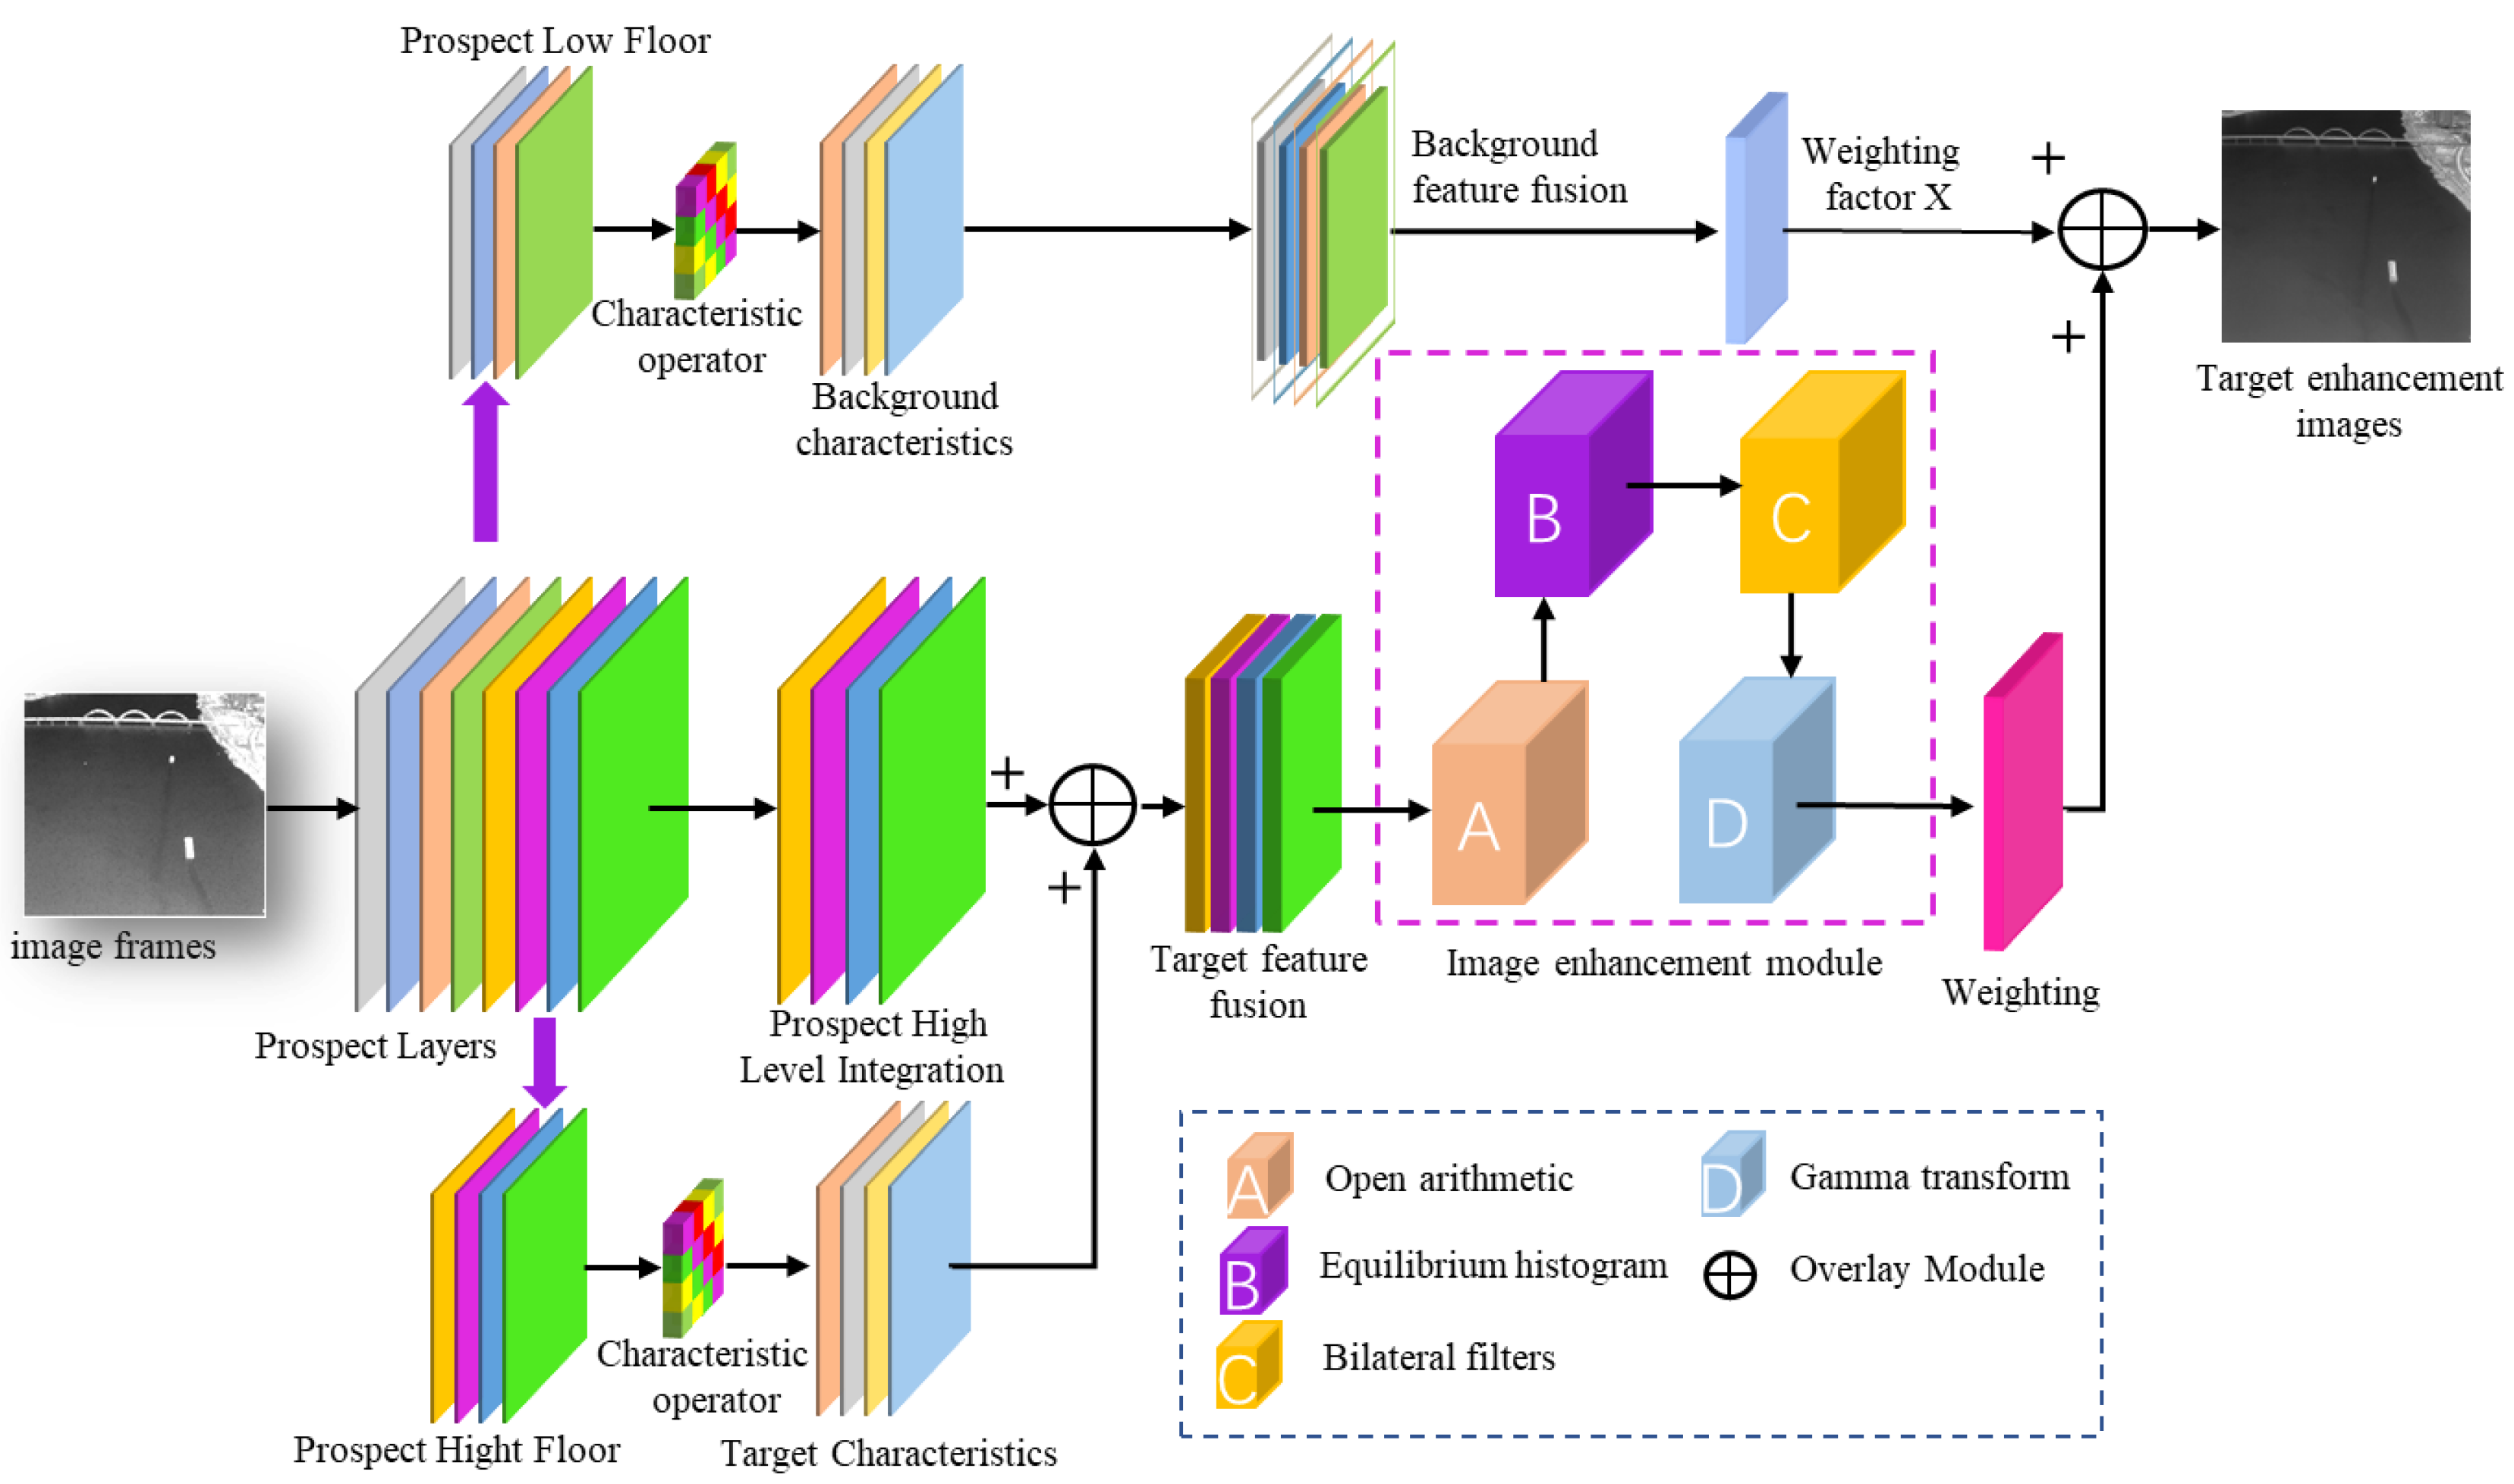
2.1. Model Overview
2.2. Improved Bootstrap Filtering Algorithm
2.3. Spatial–Temporal Feature Fusion and Siamese Network Learning
2.4. Multi-Layer Image Fusion Algorithm
3. Simulation and Analysis
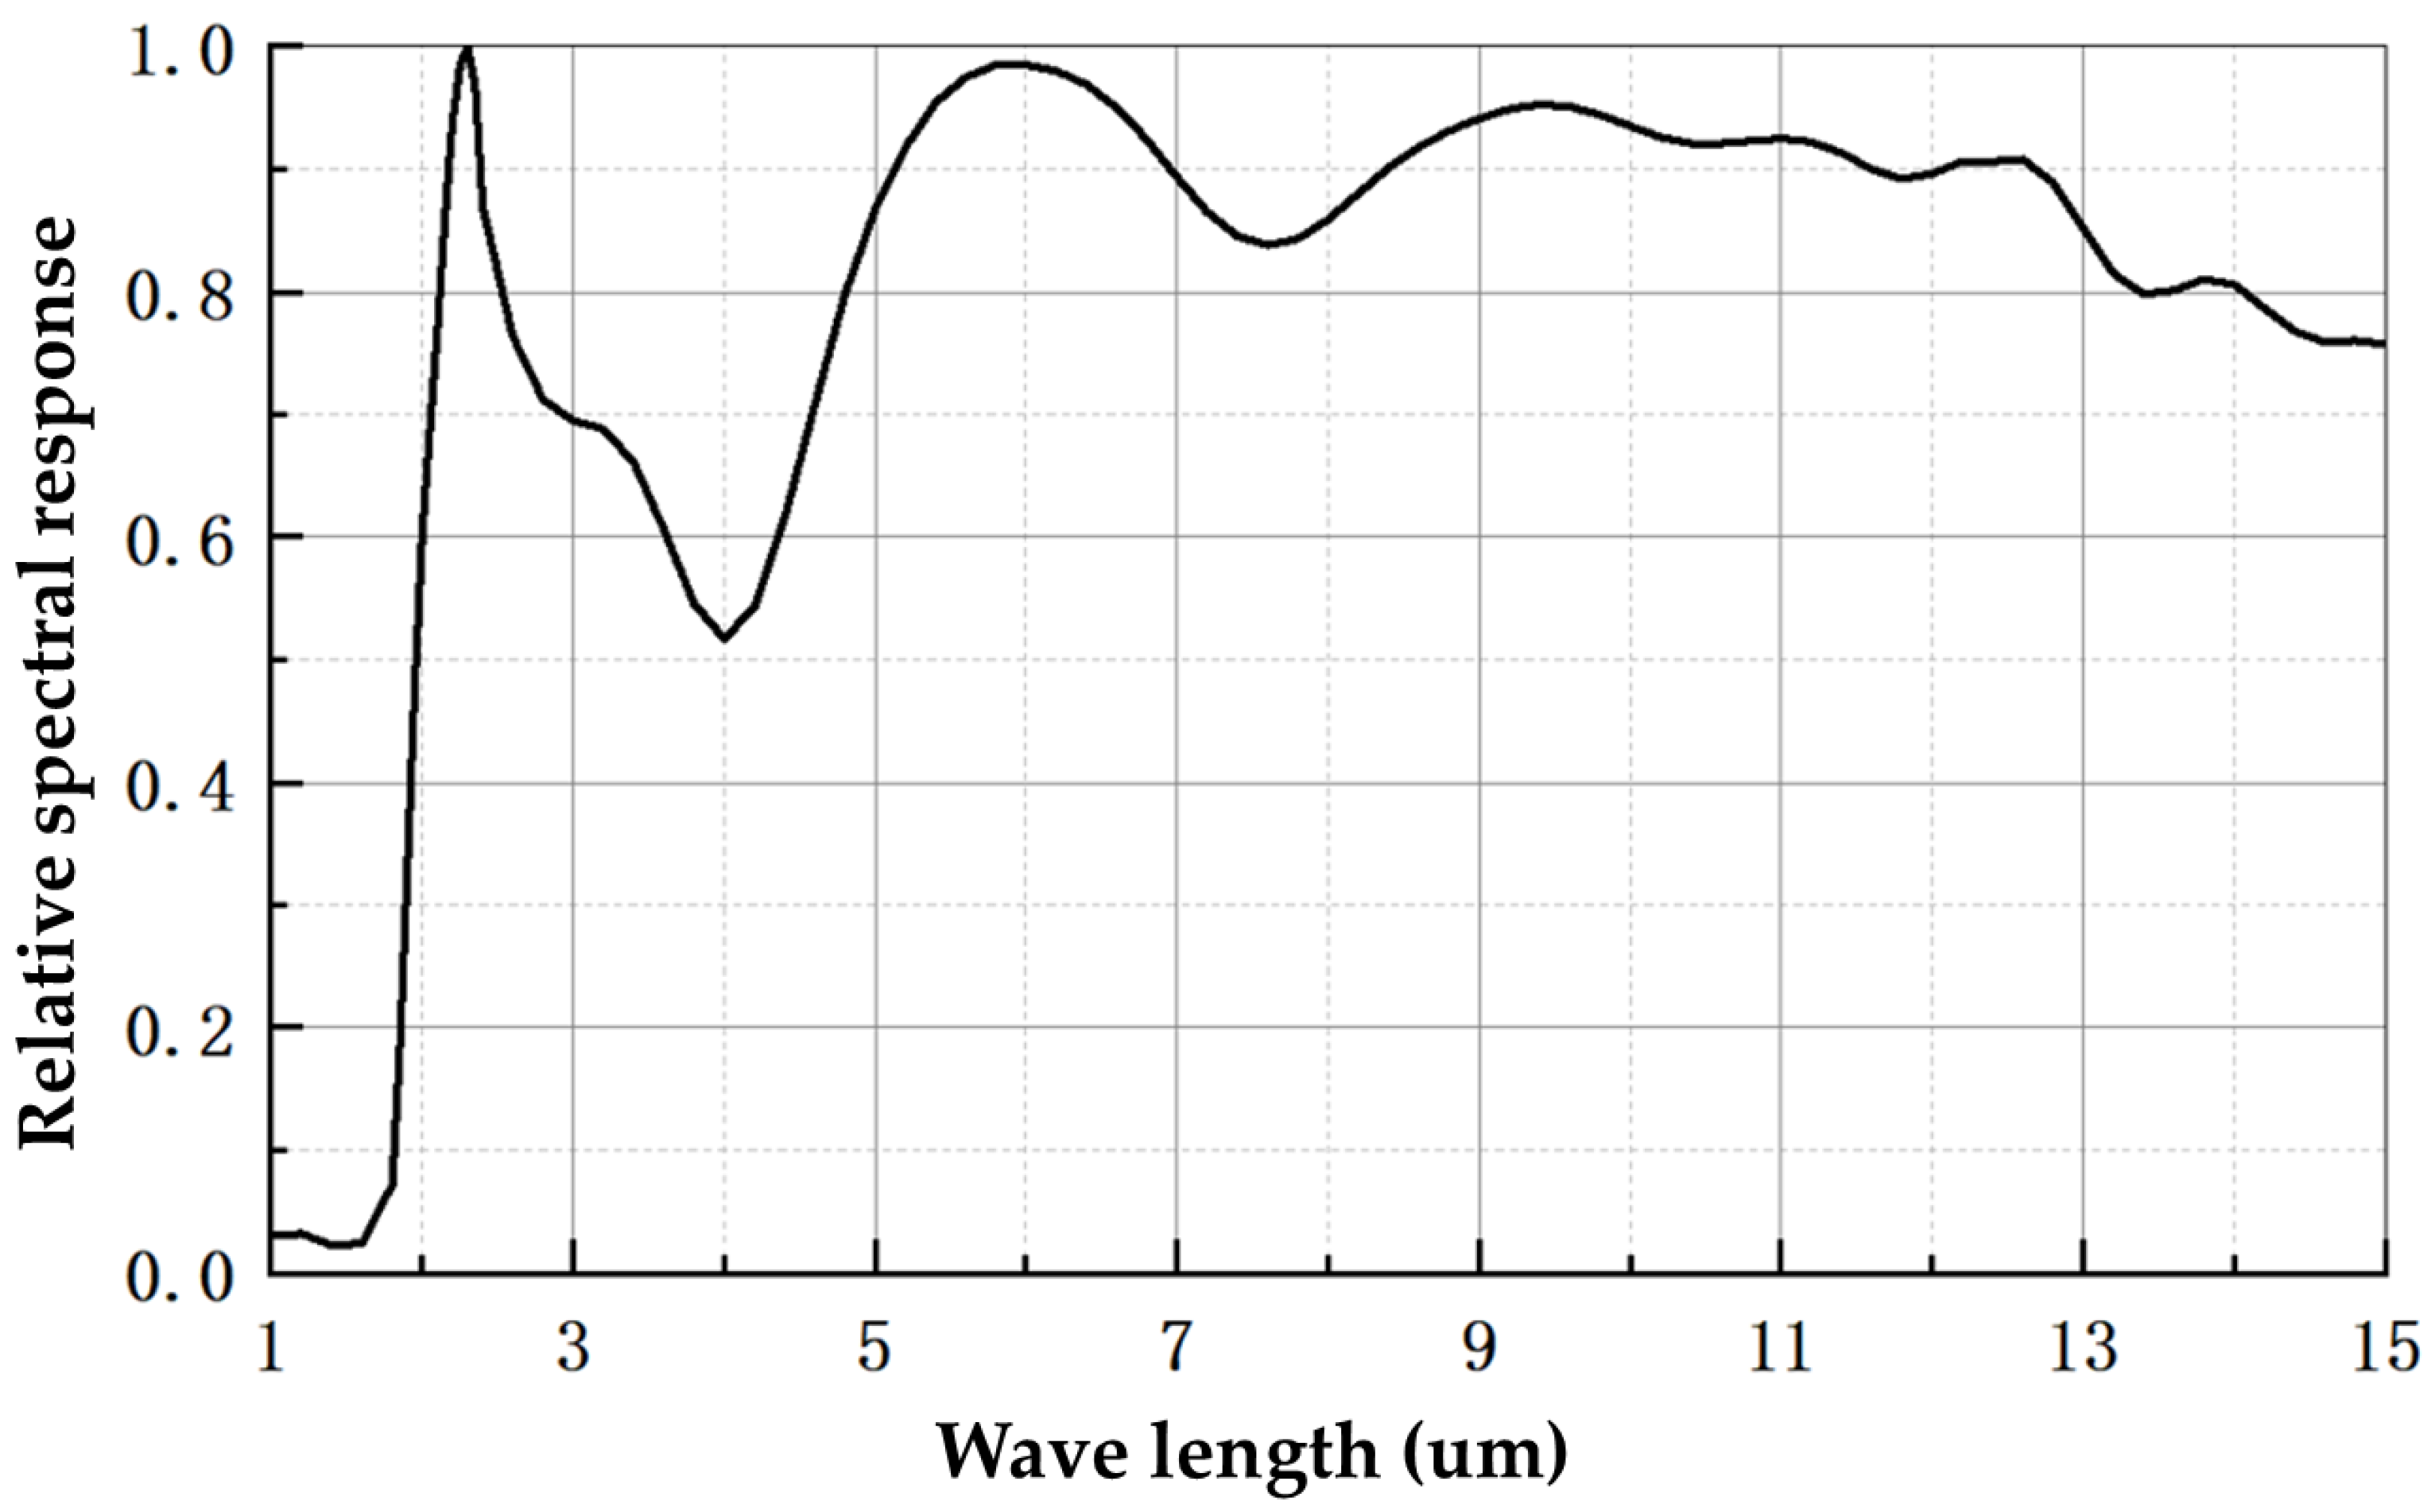
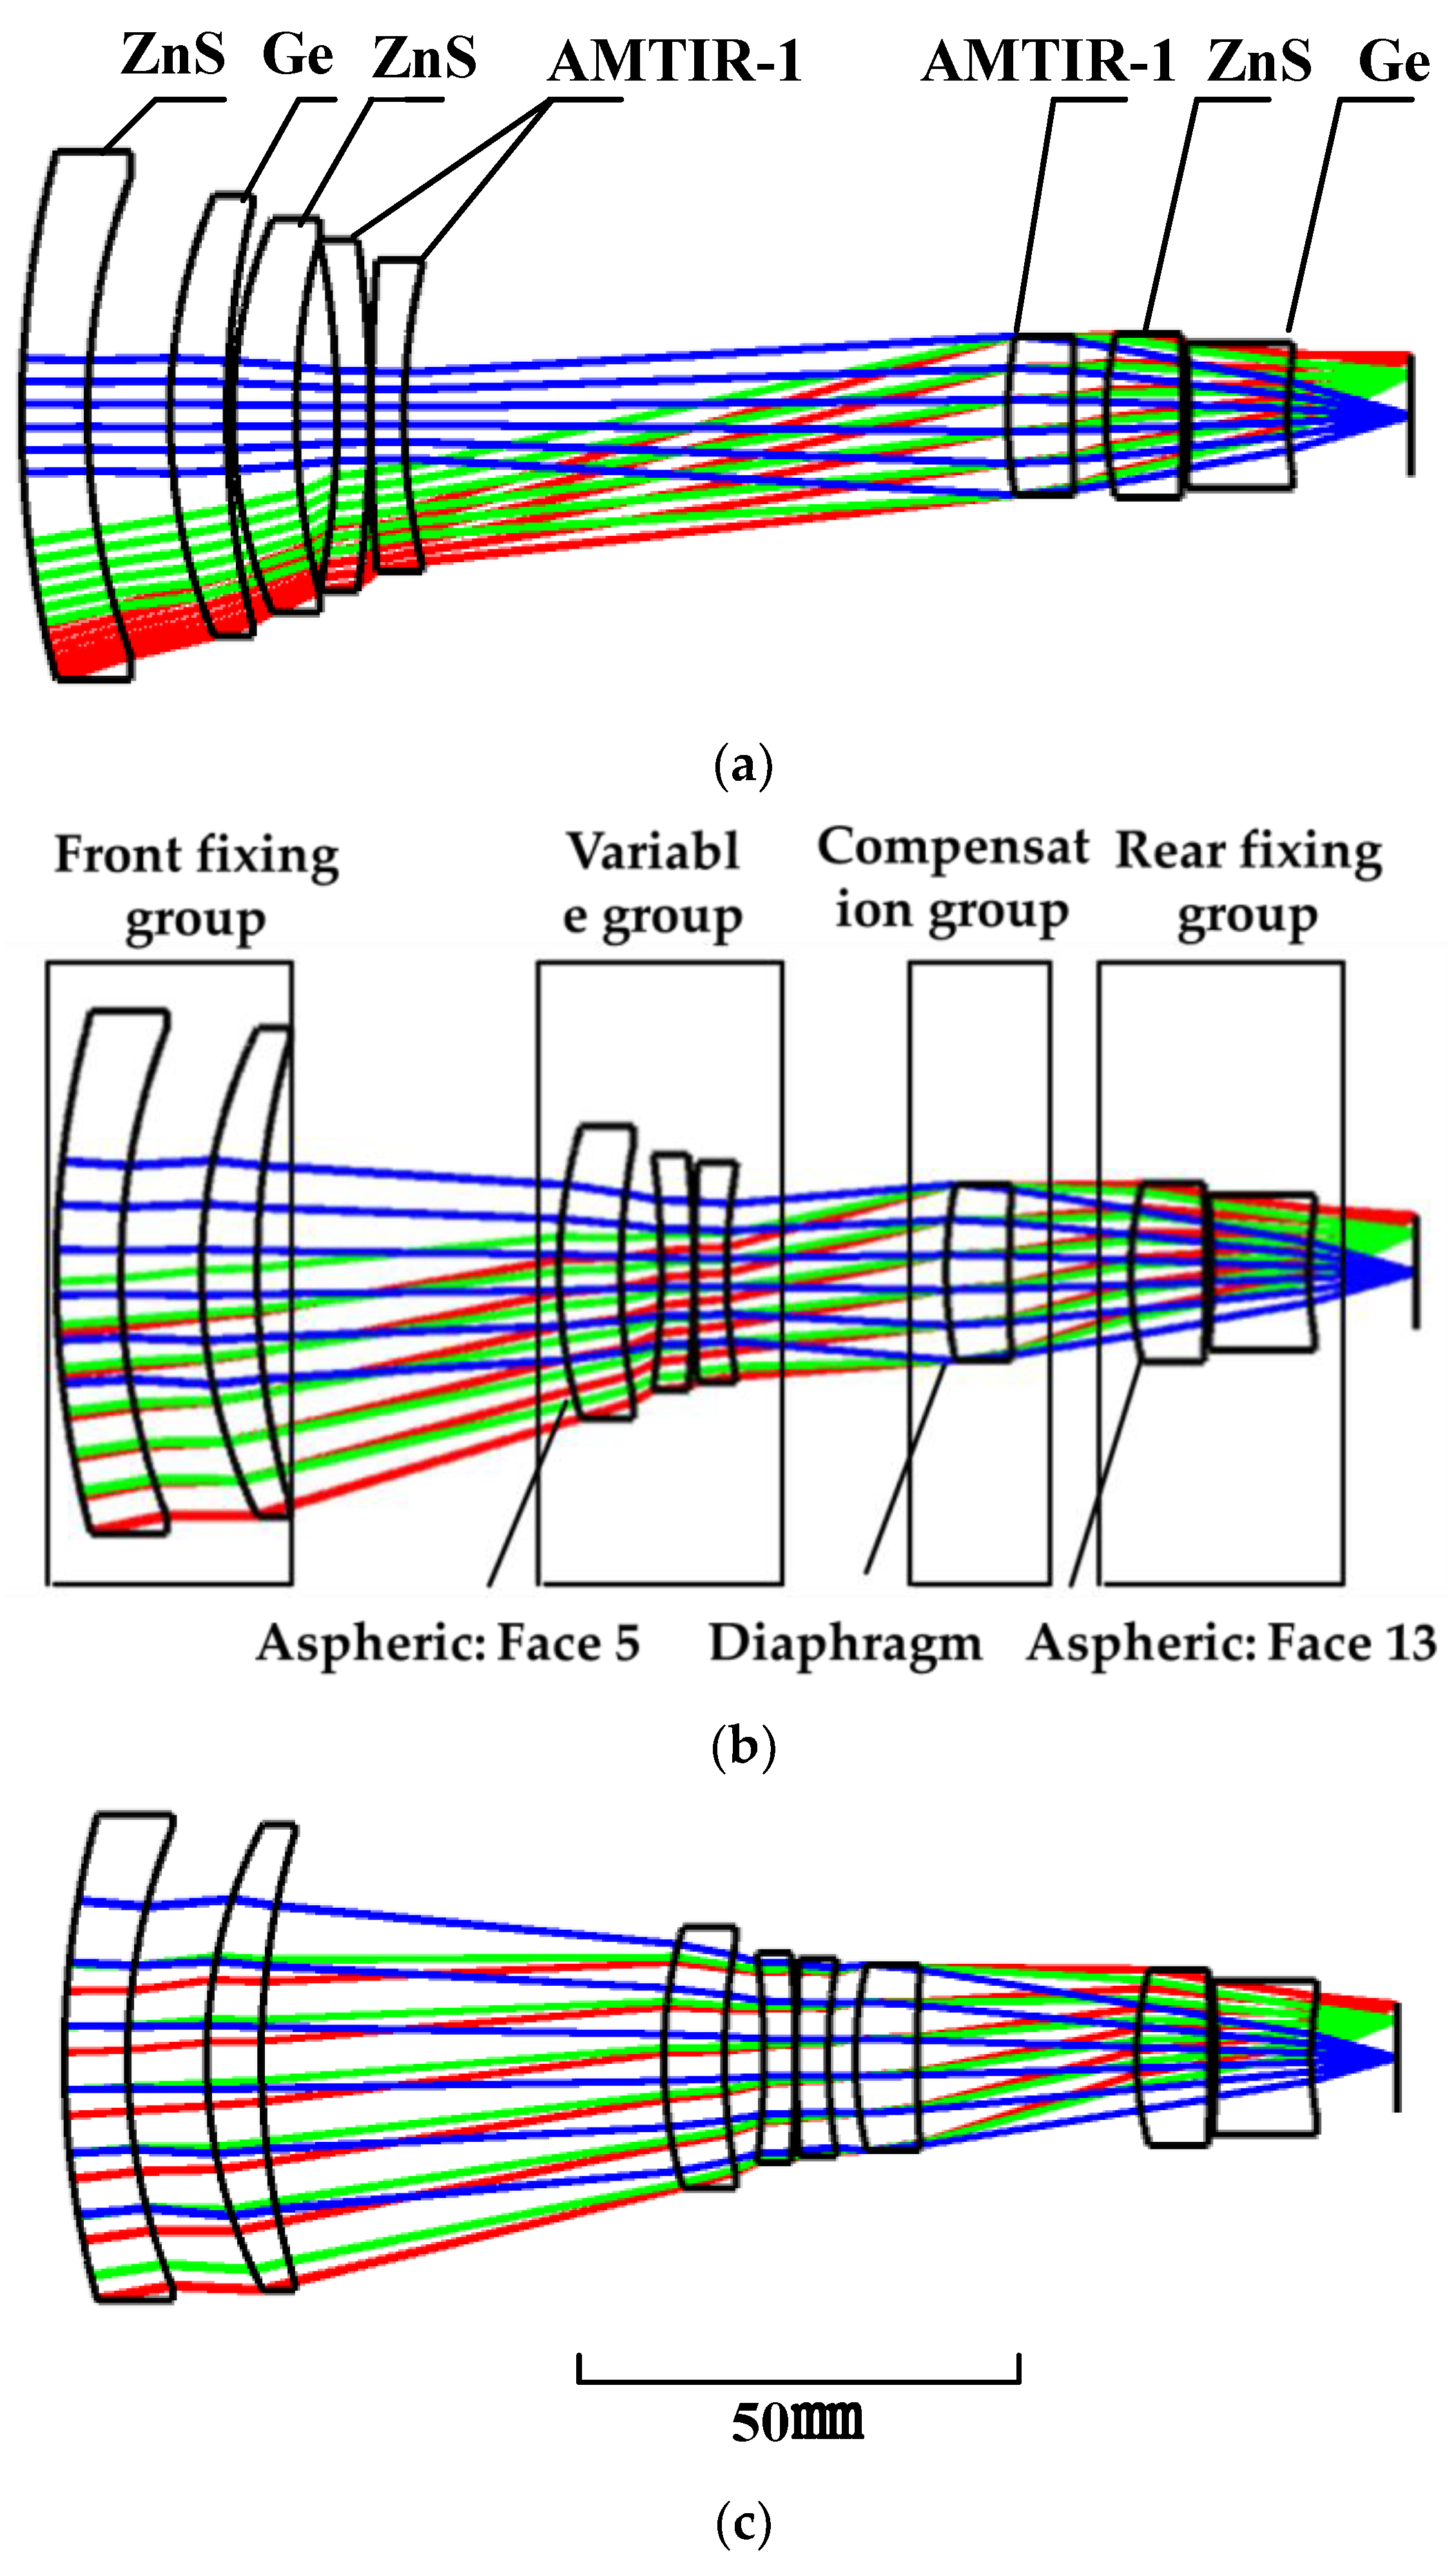
3.1. Technical Specifications and Design
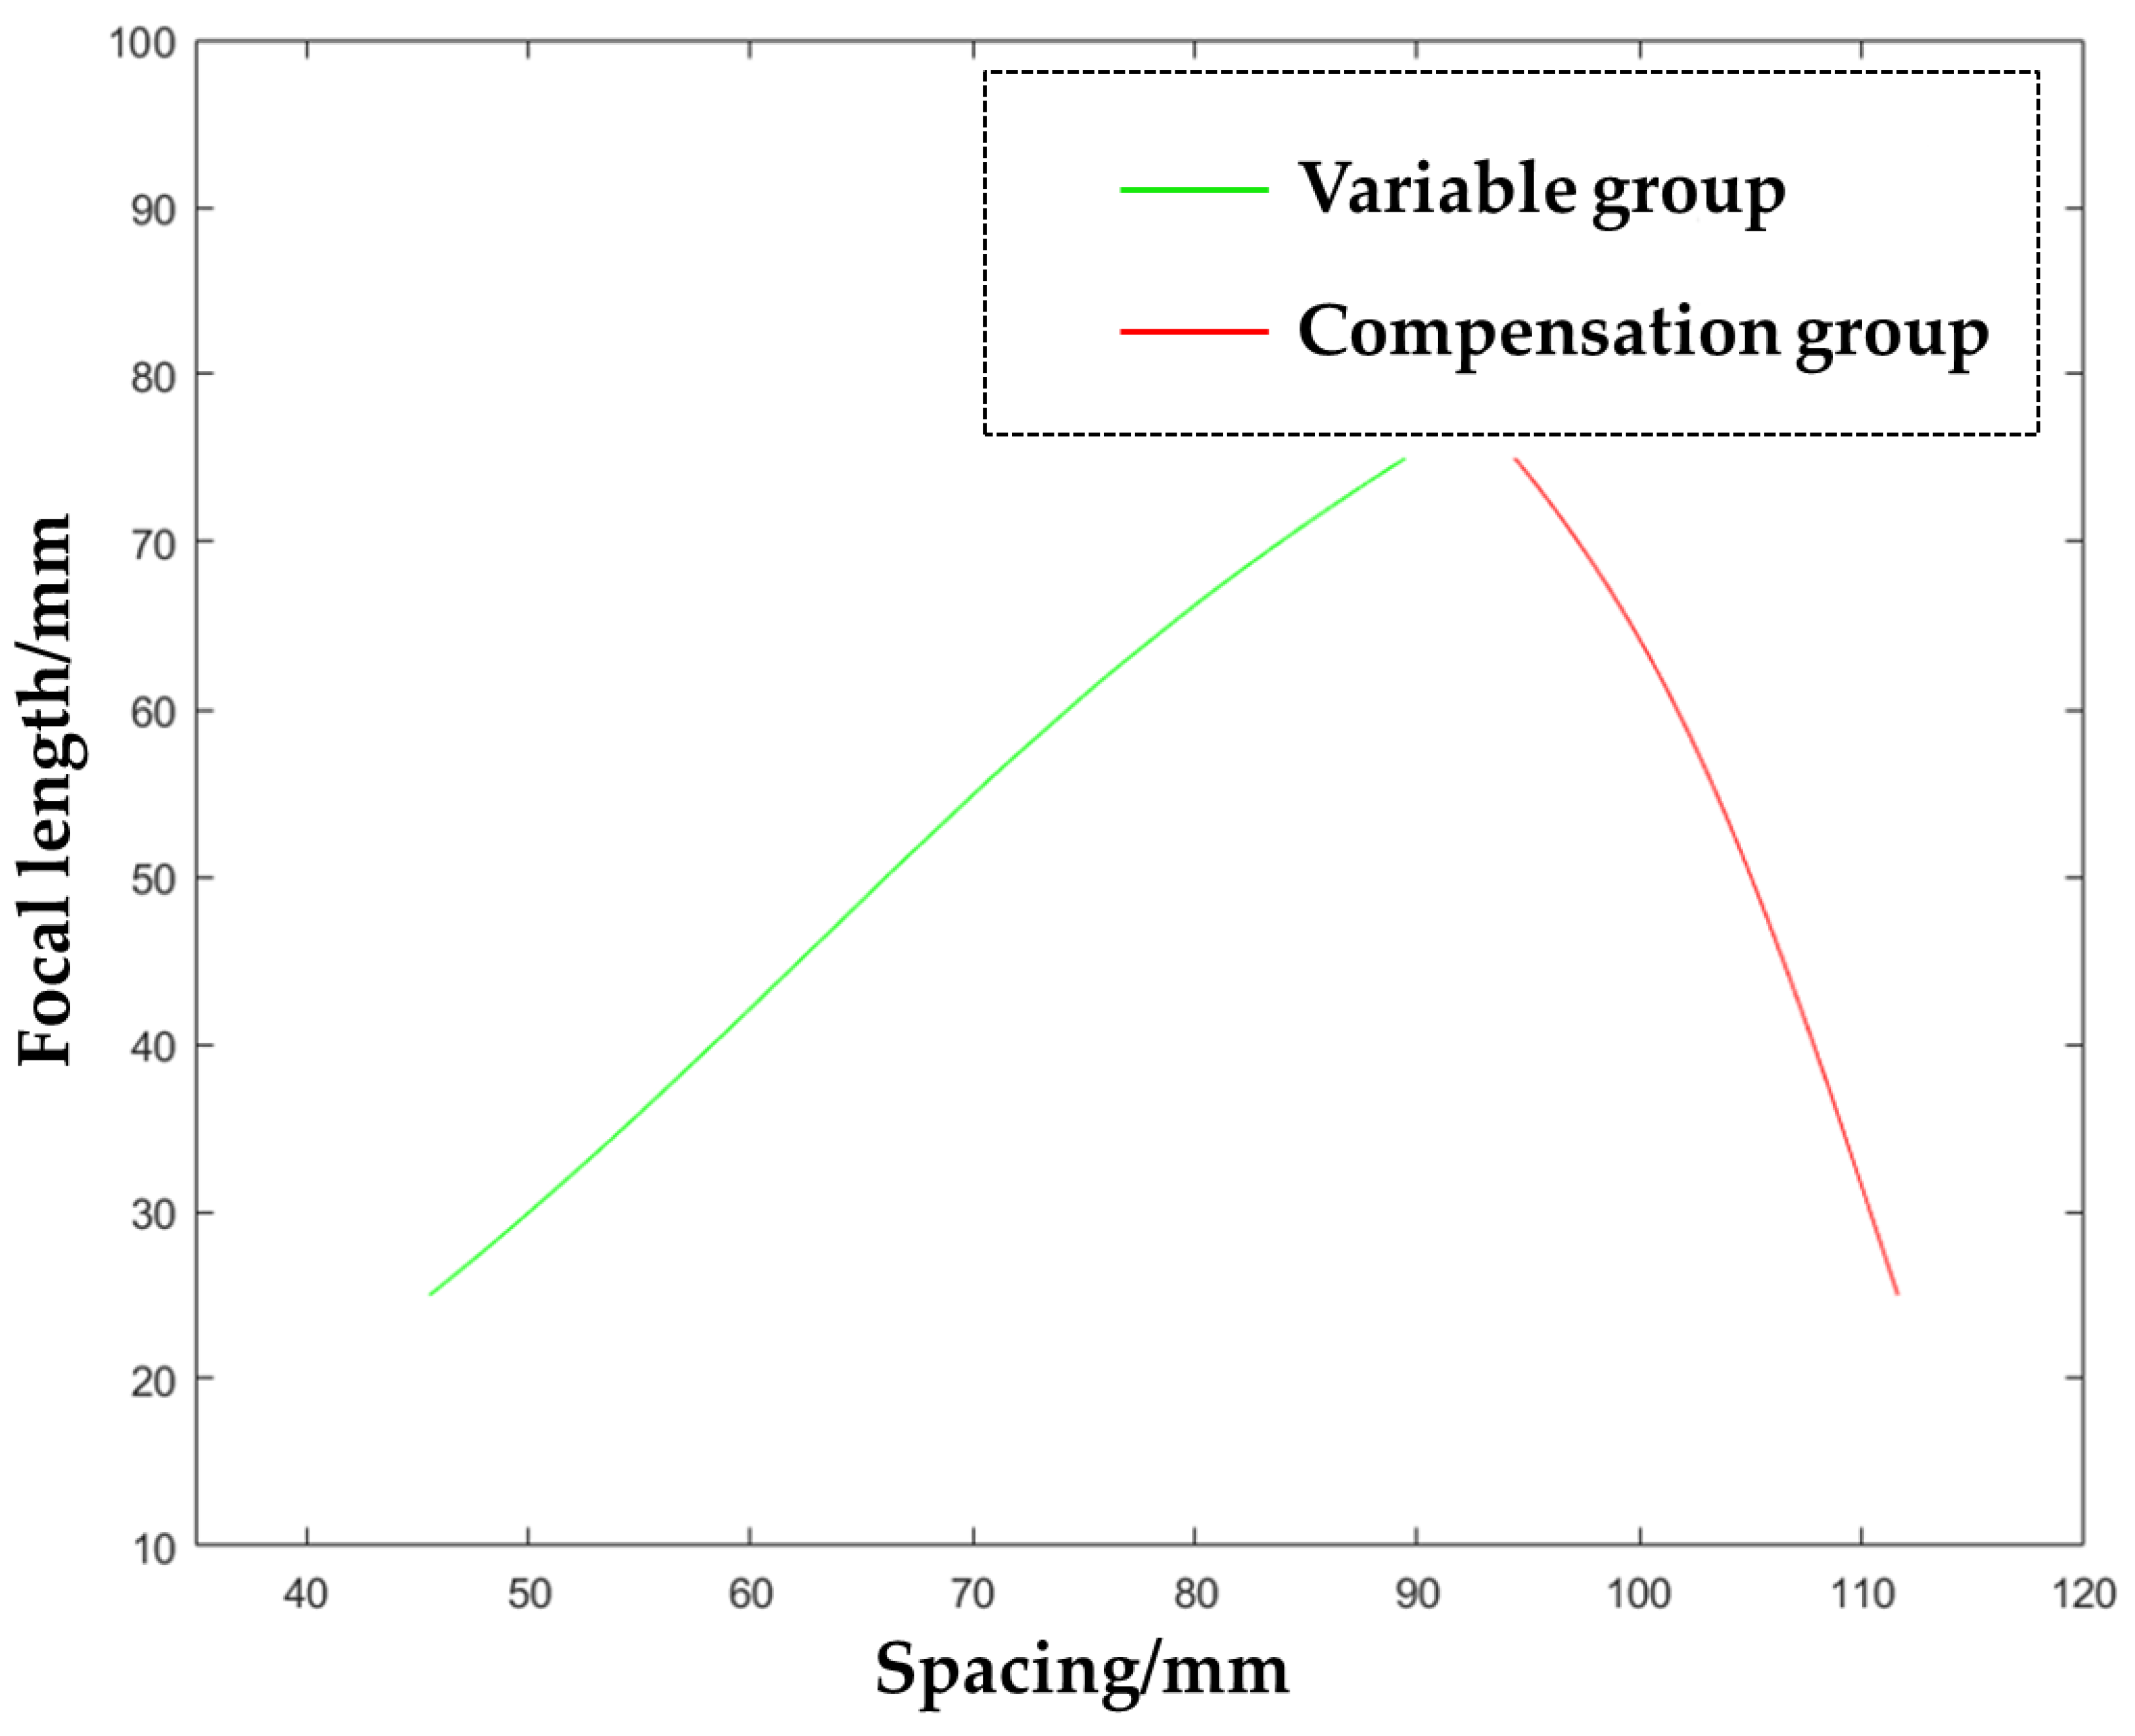
3.2. Design Results
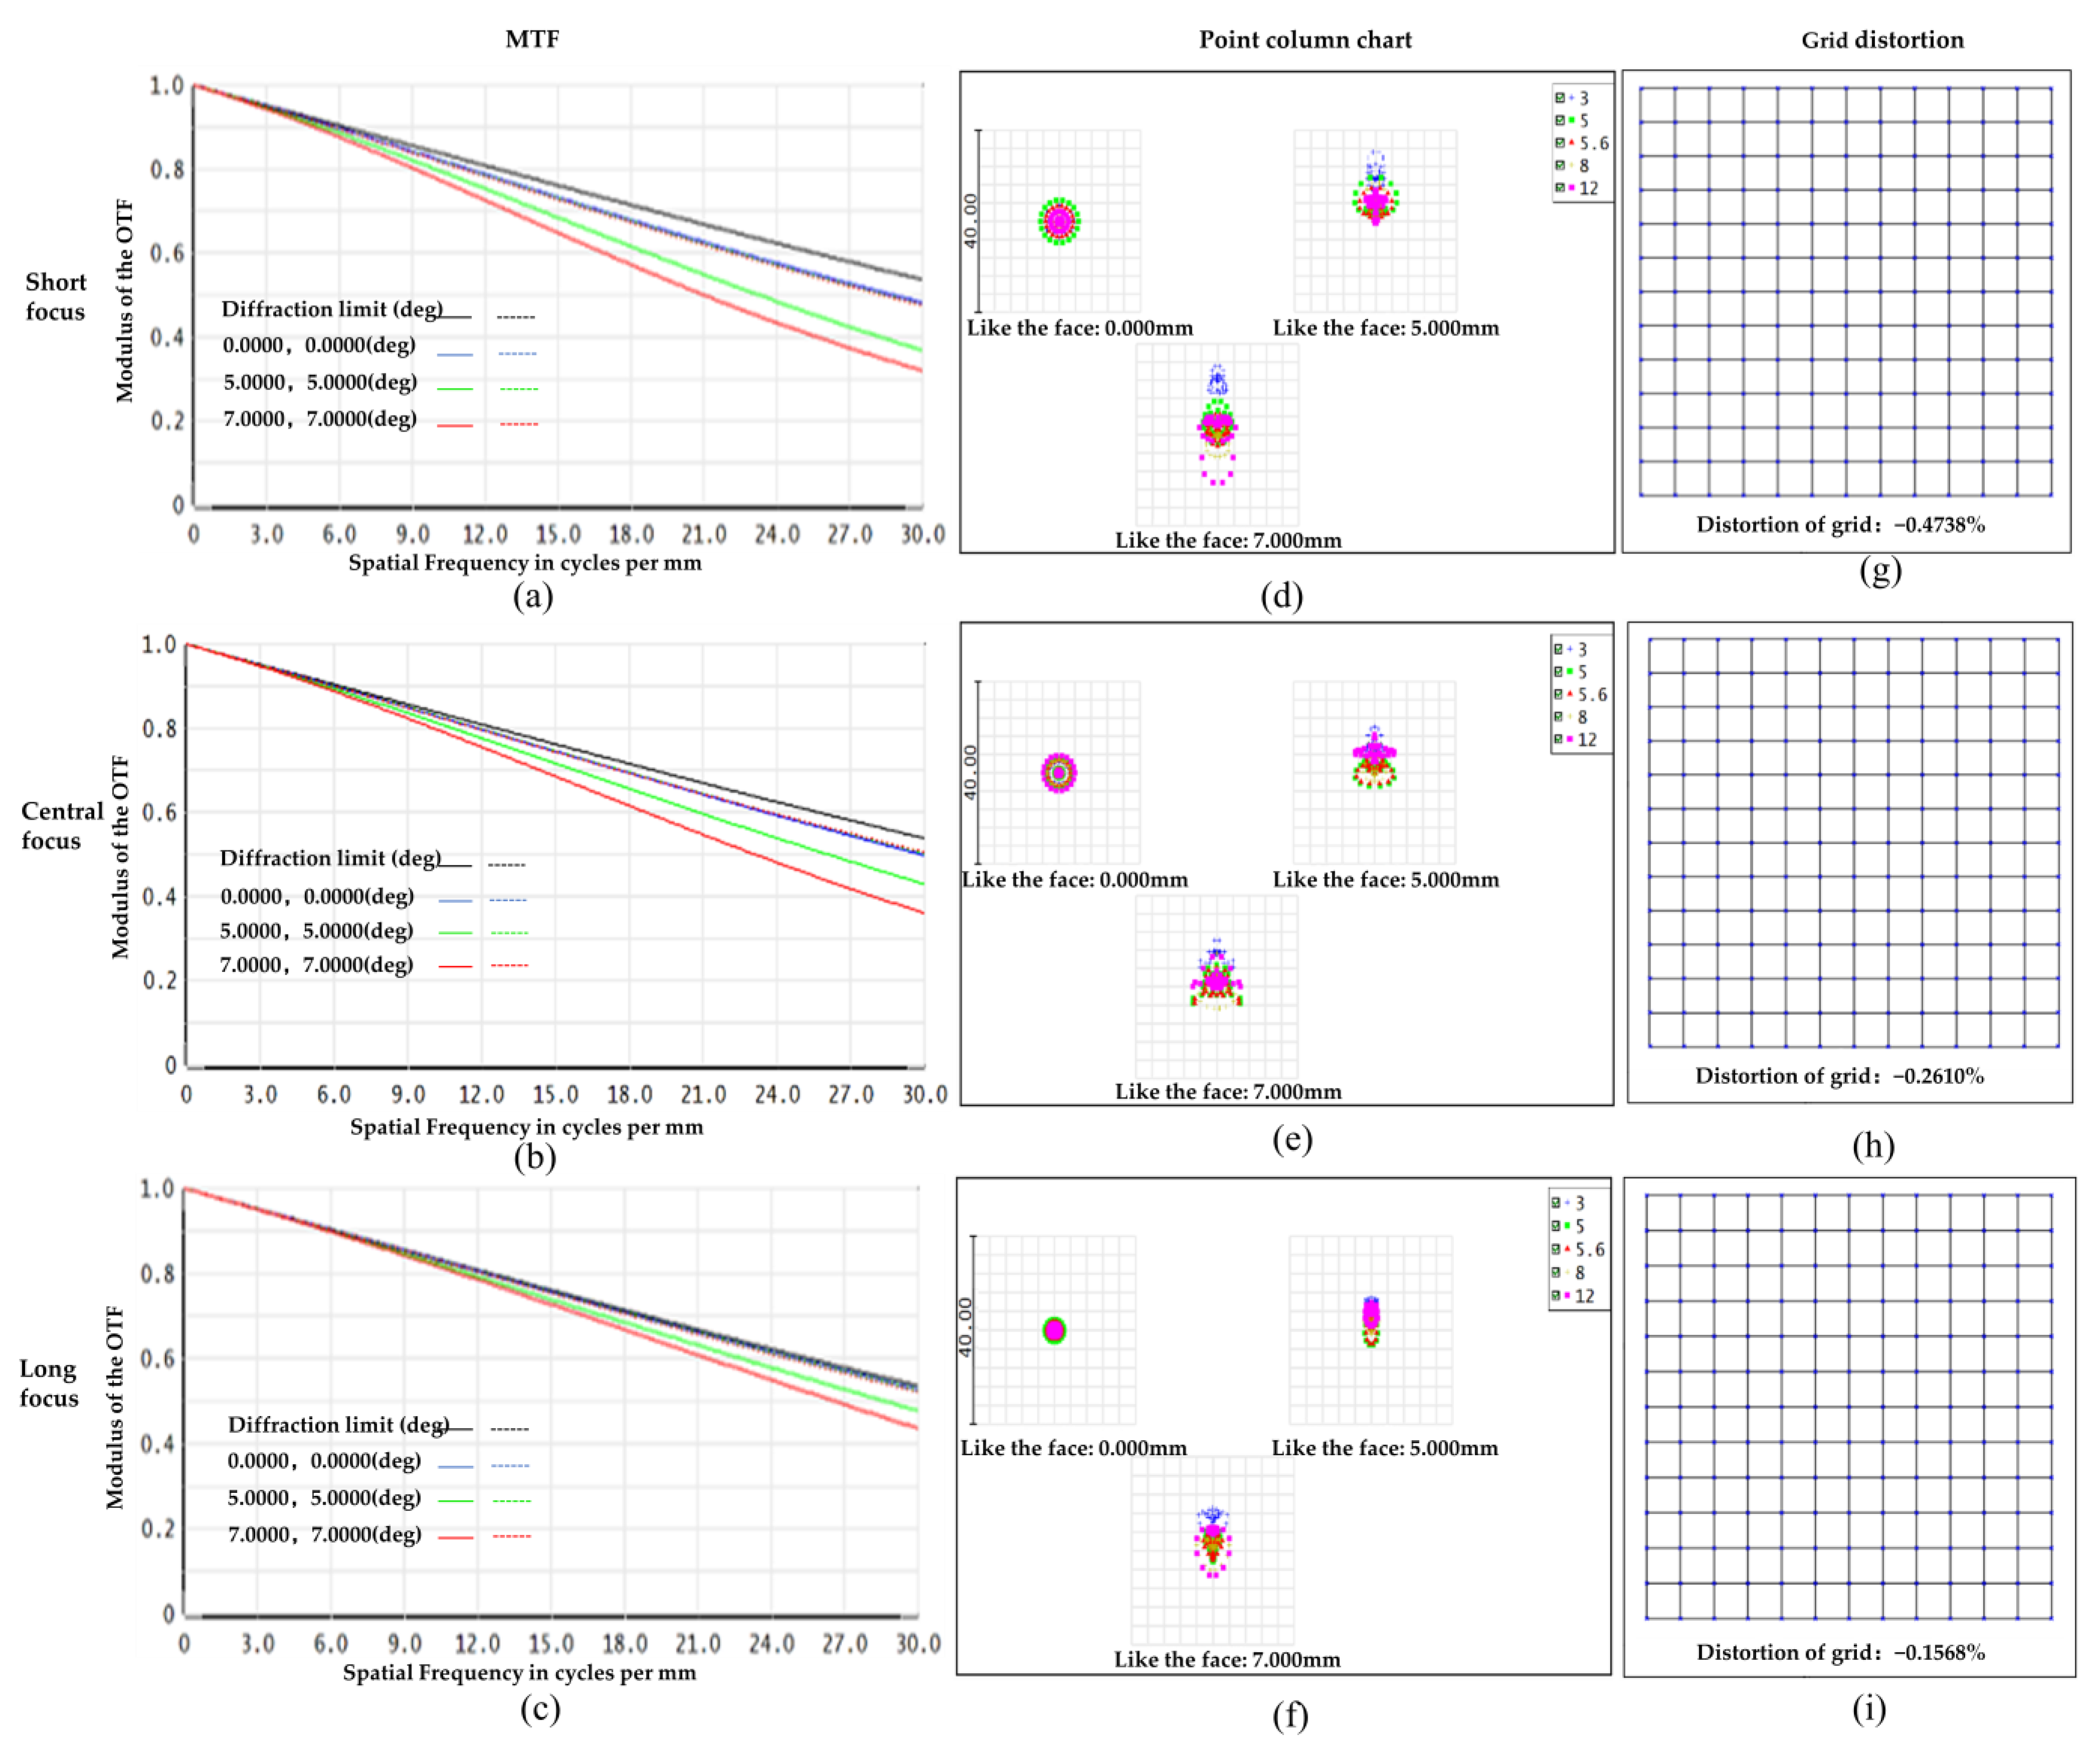
3.3. Image Quality Analysis
3.4. Cam Curve Drawing
3.5. Tolerance Analysis
3.6. Simulation Results
4. Experimental and Results
4.1. Experimental Equipment and Conditions
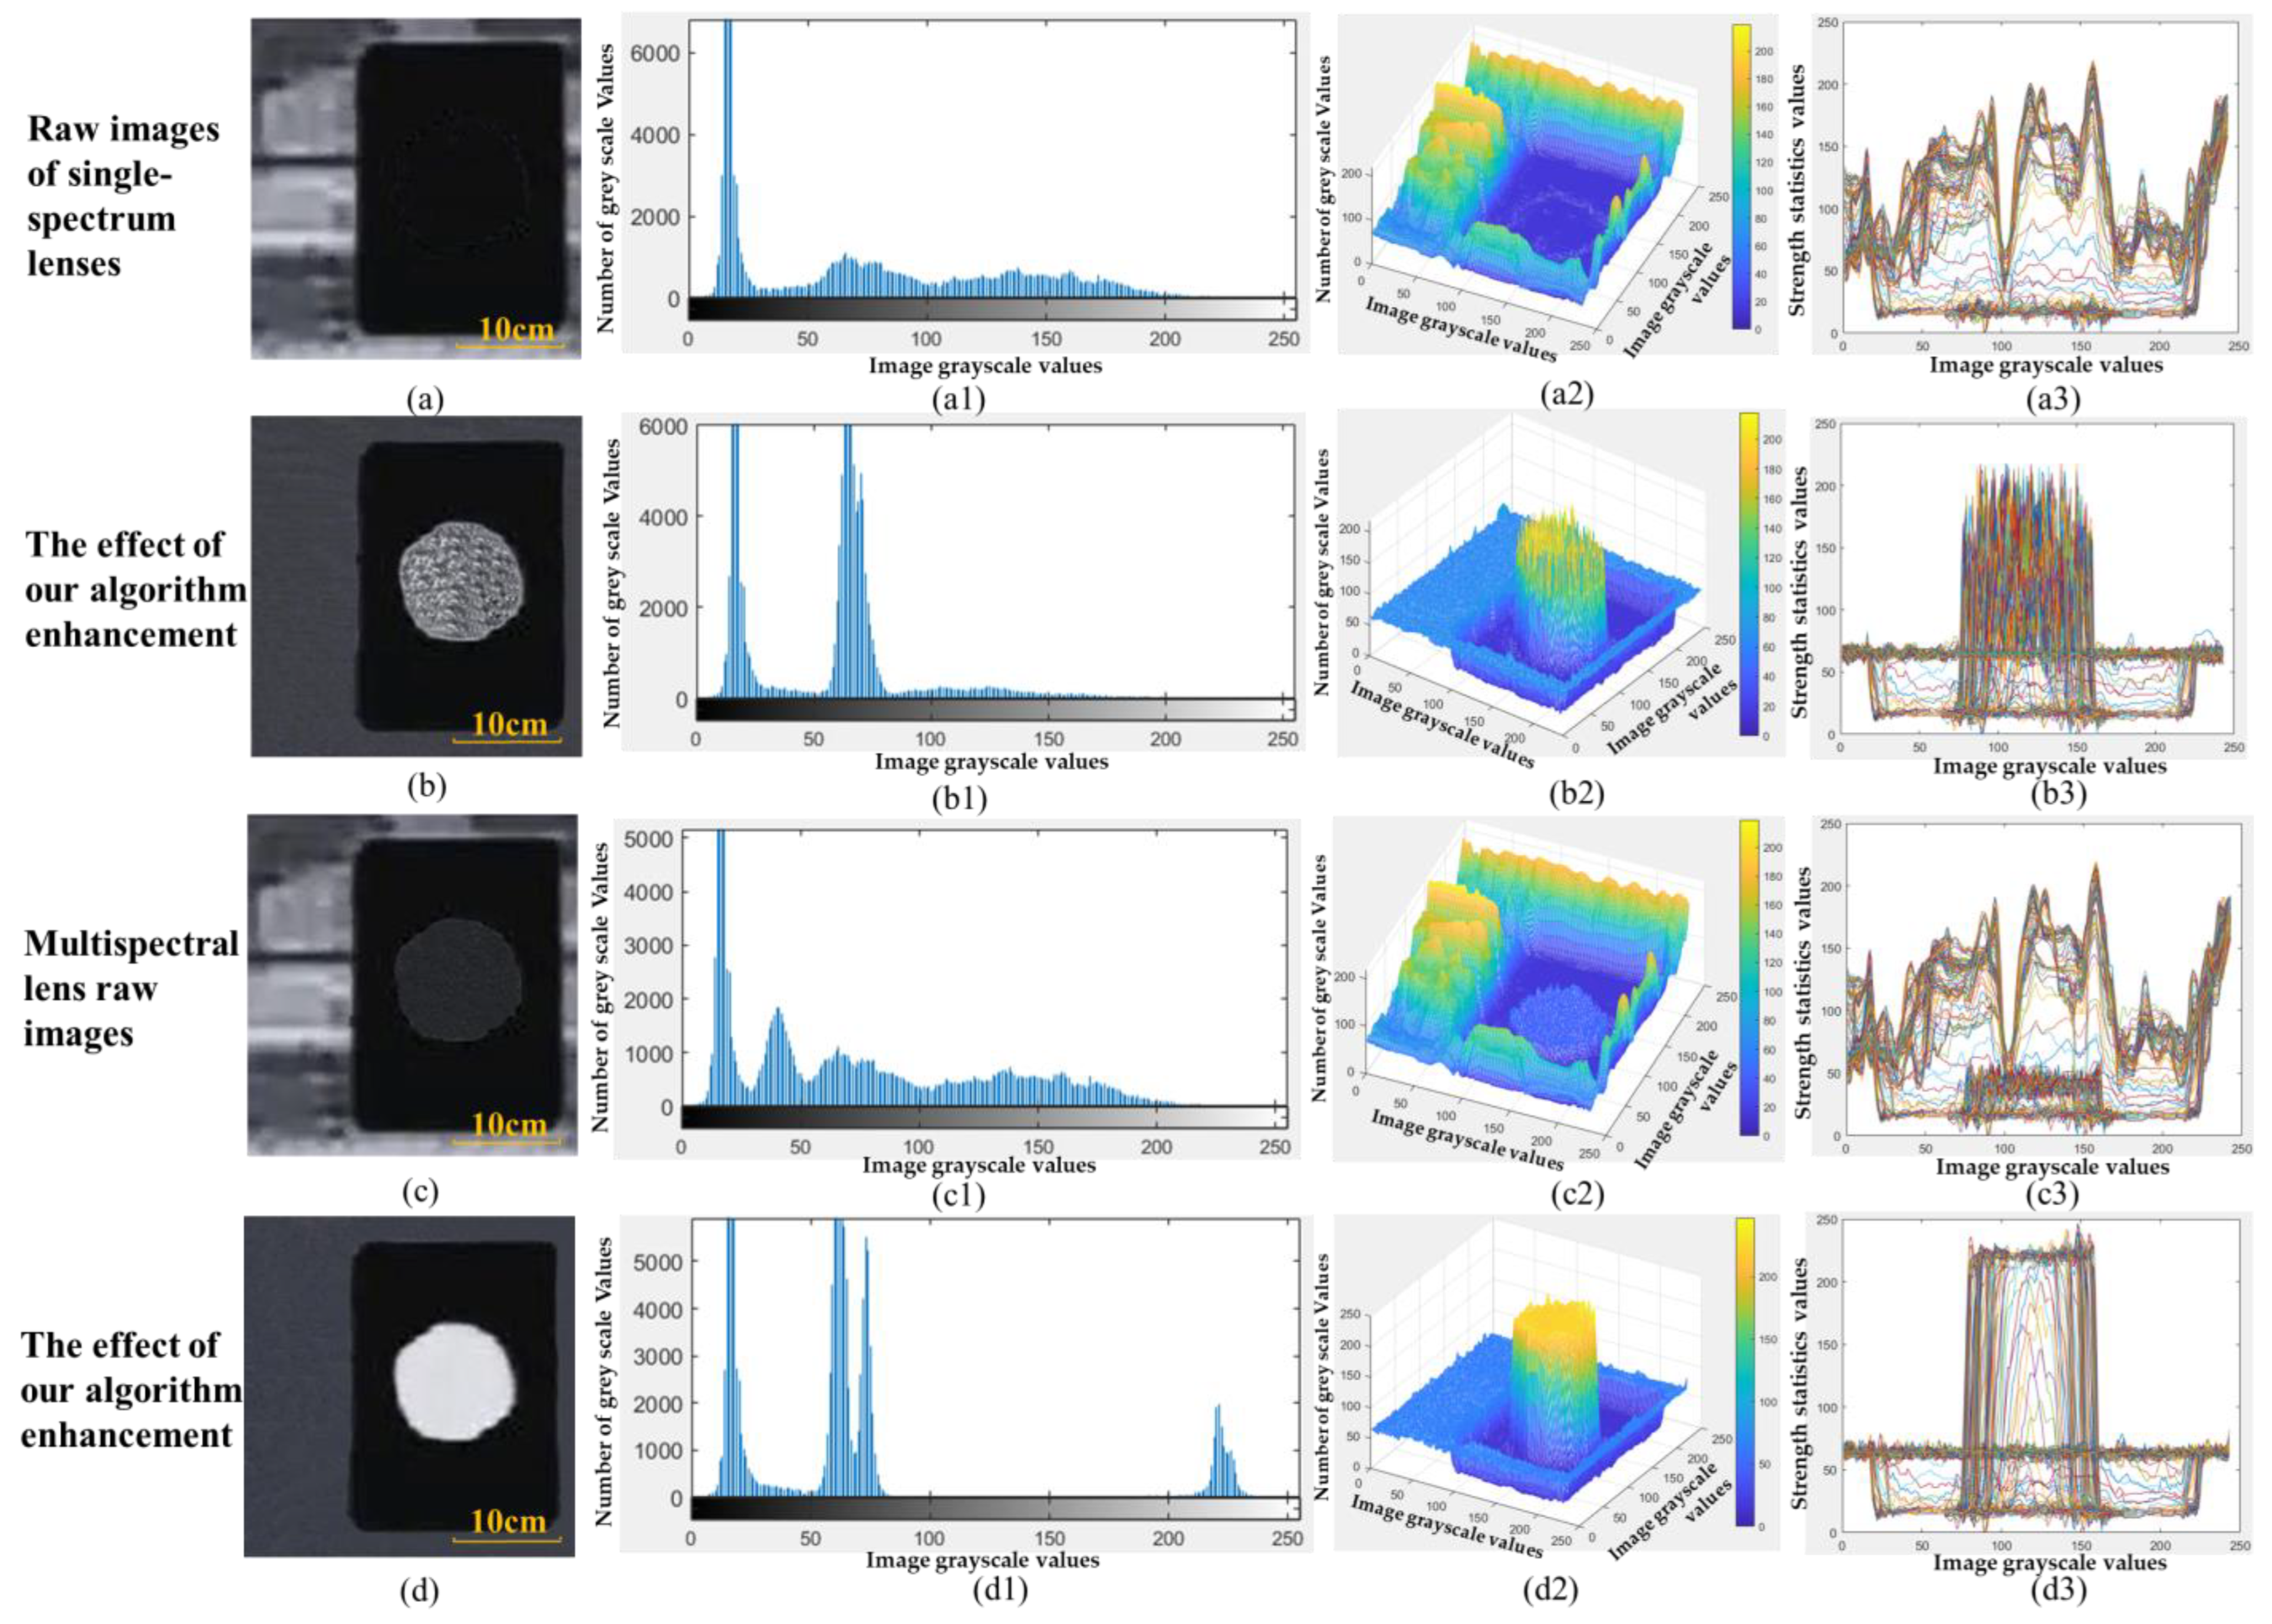
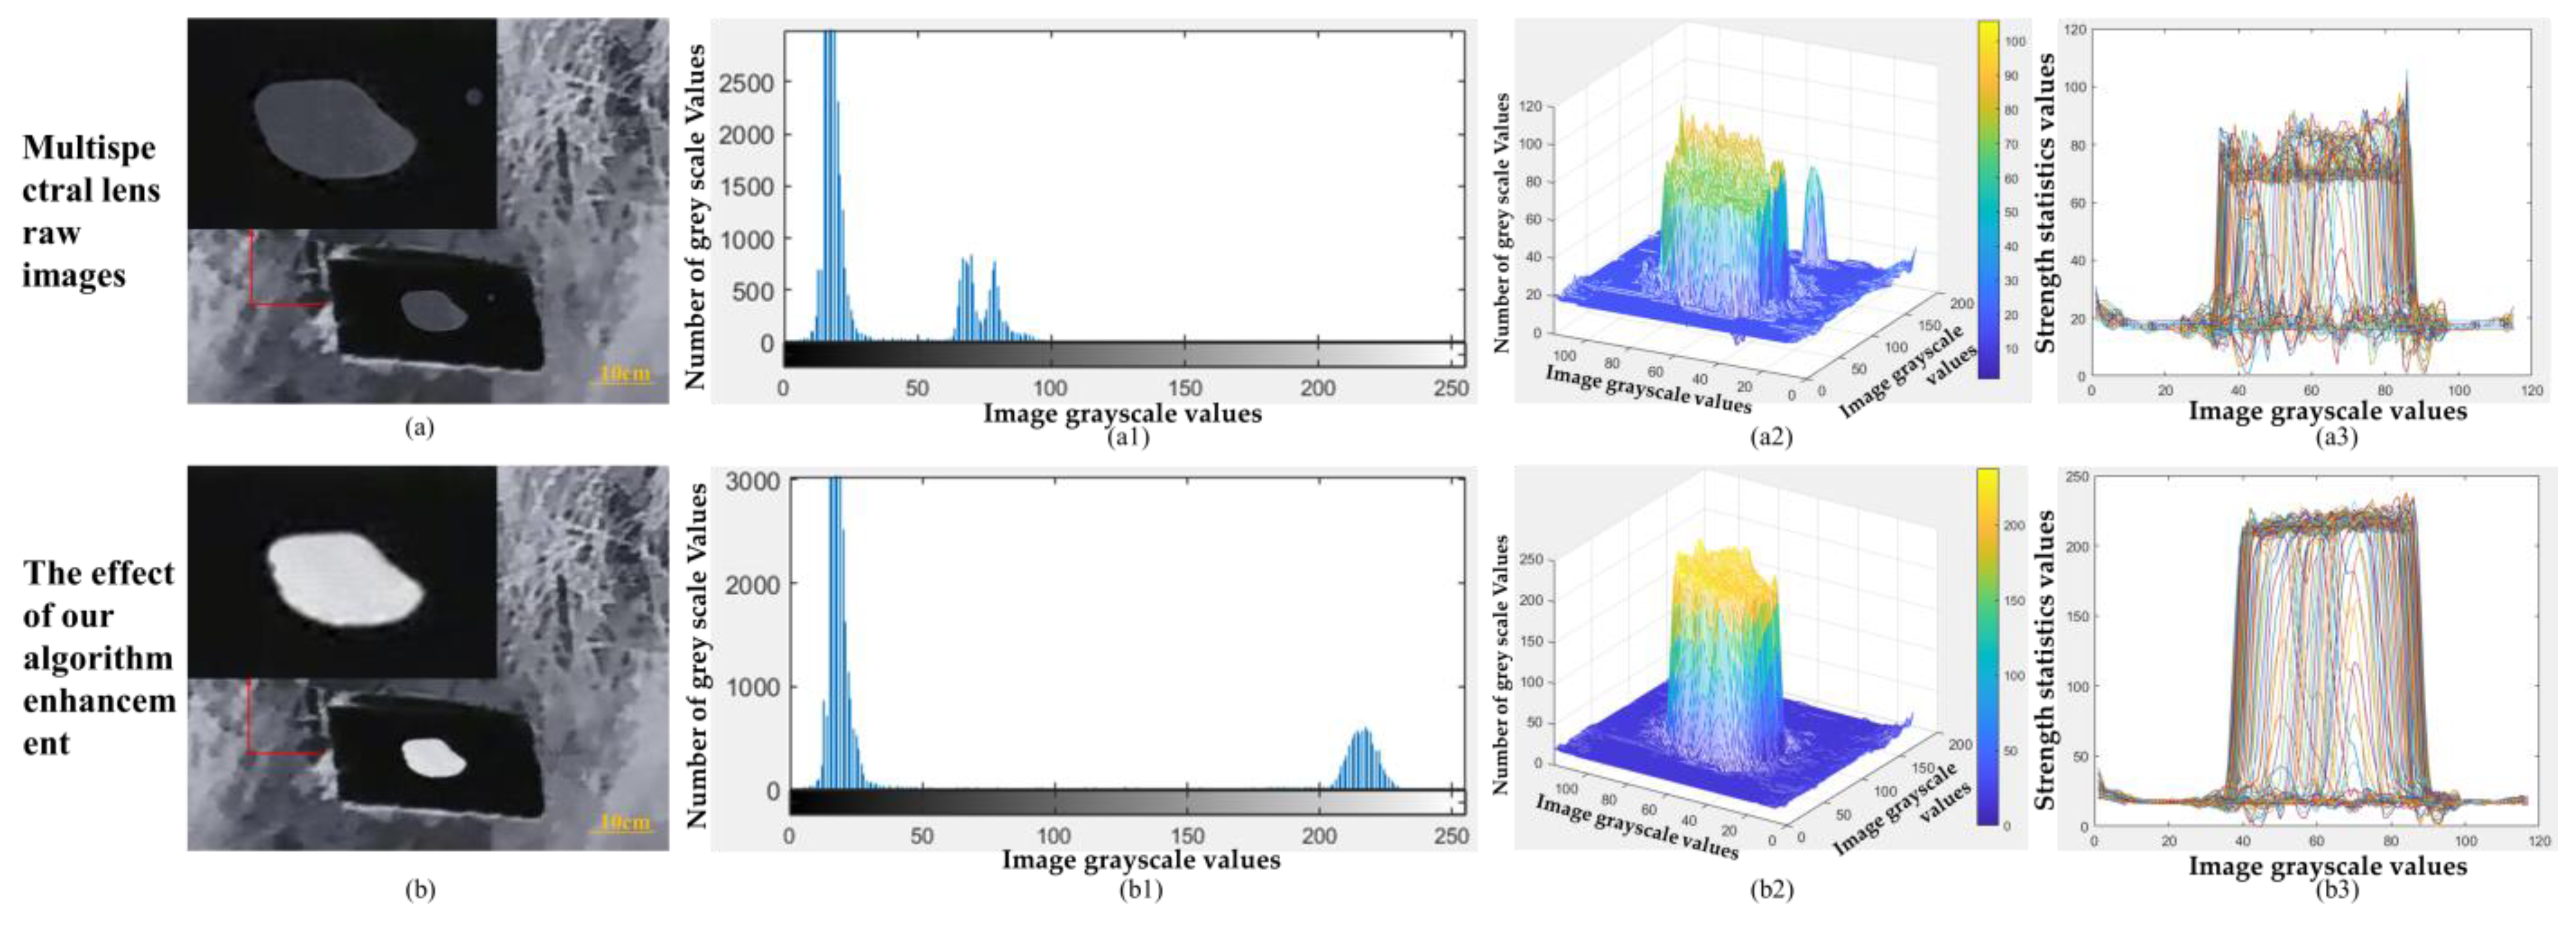
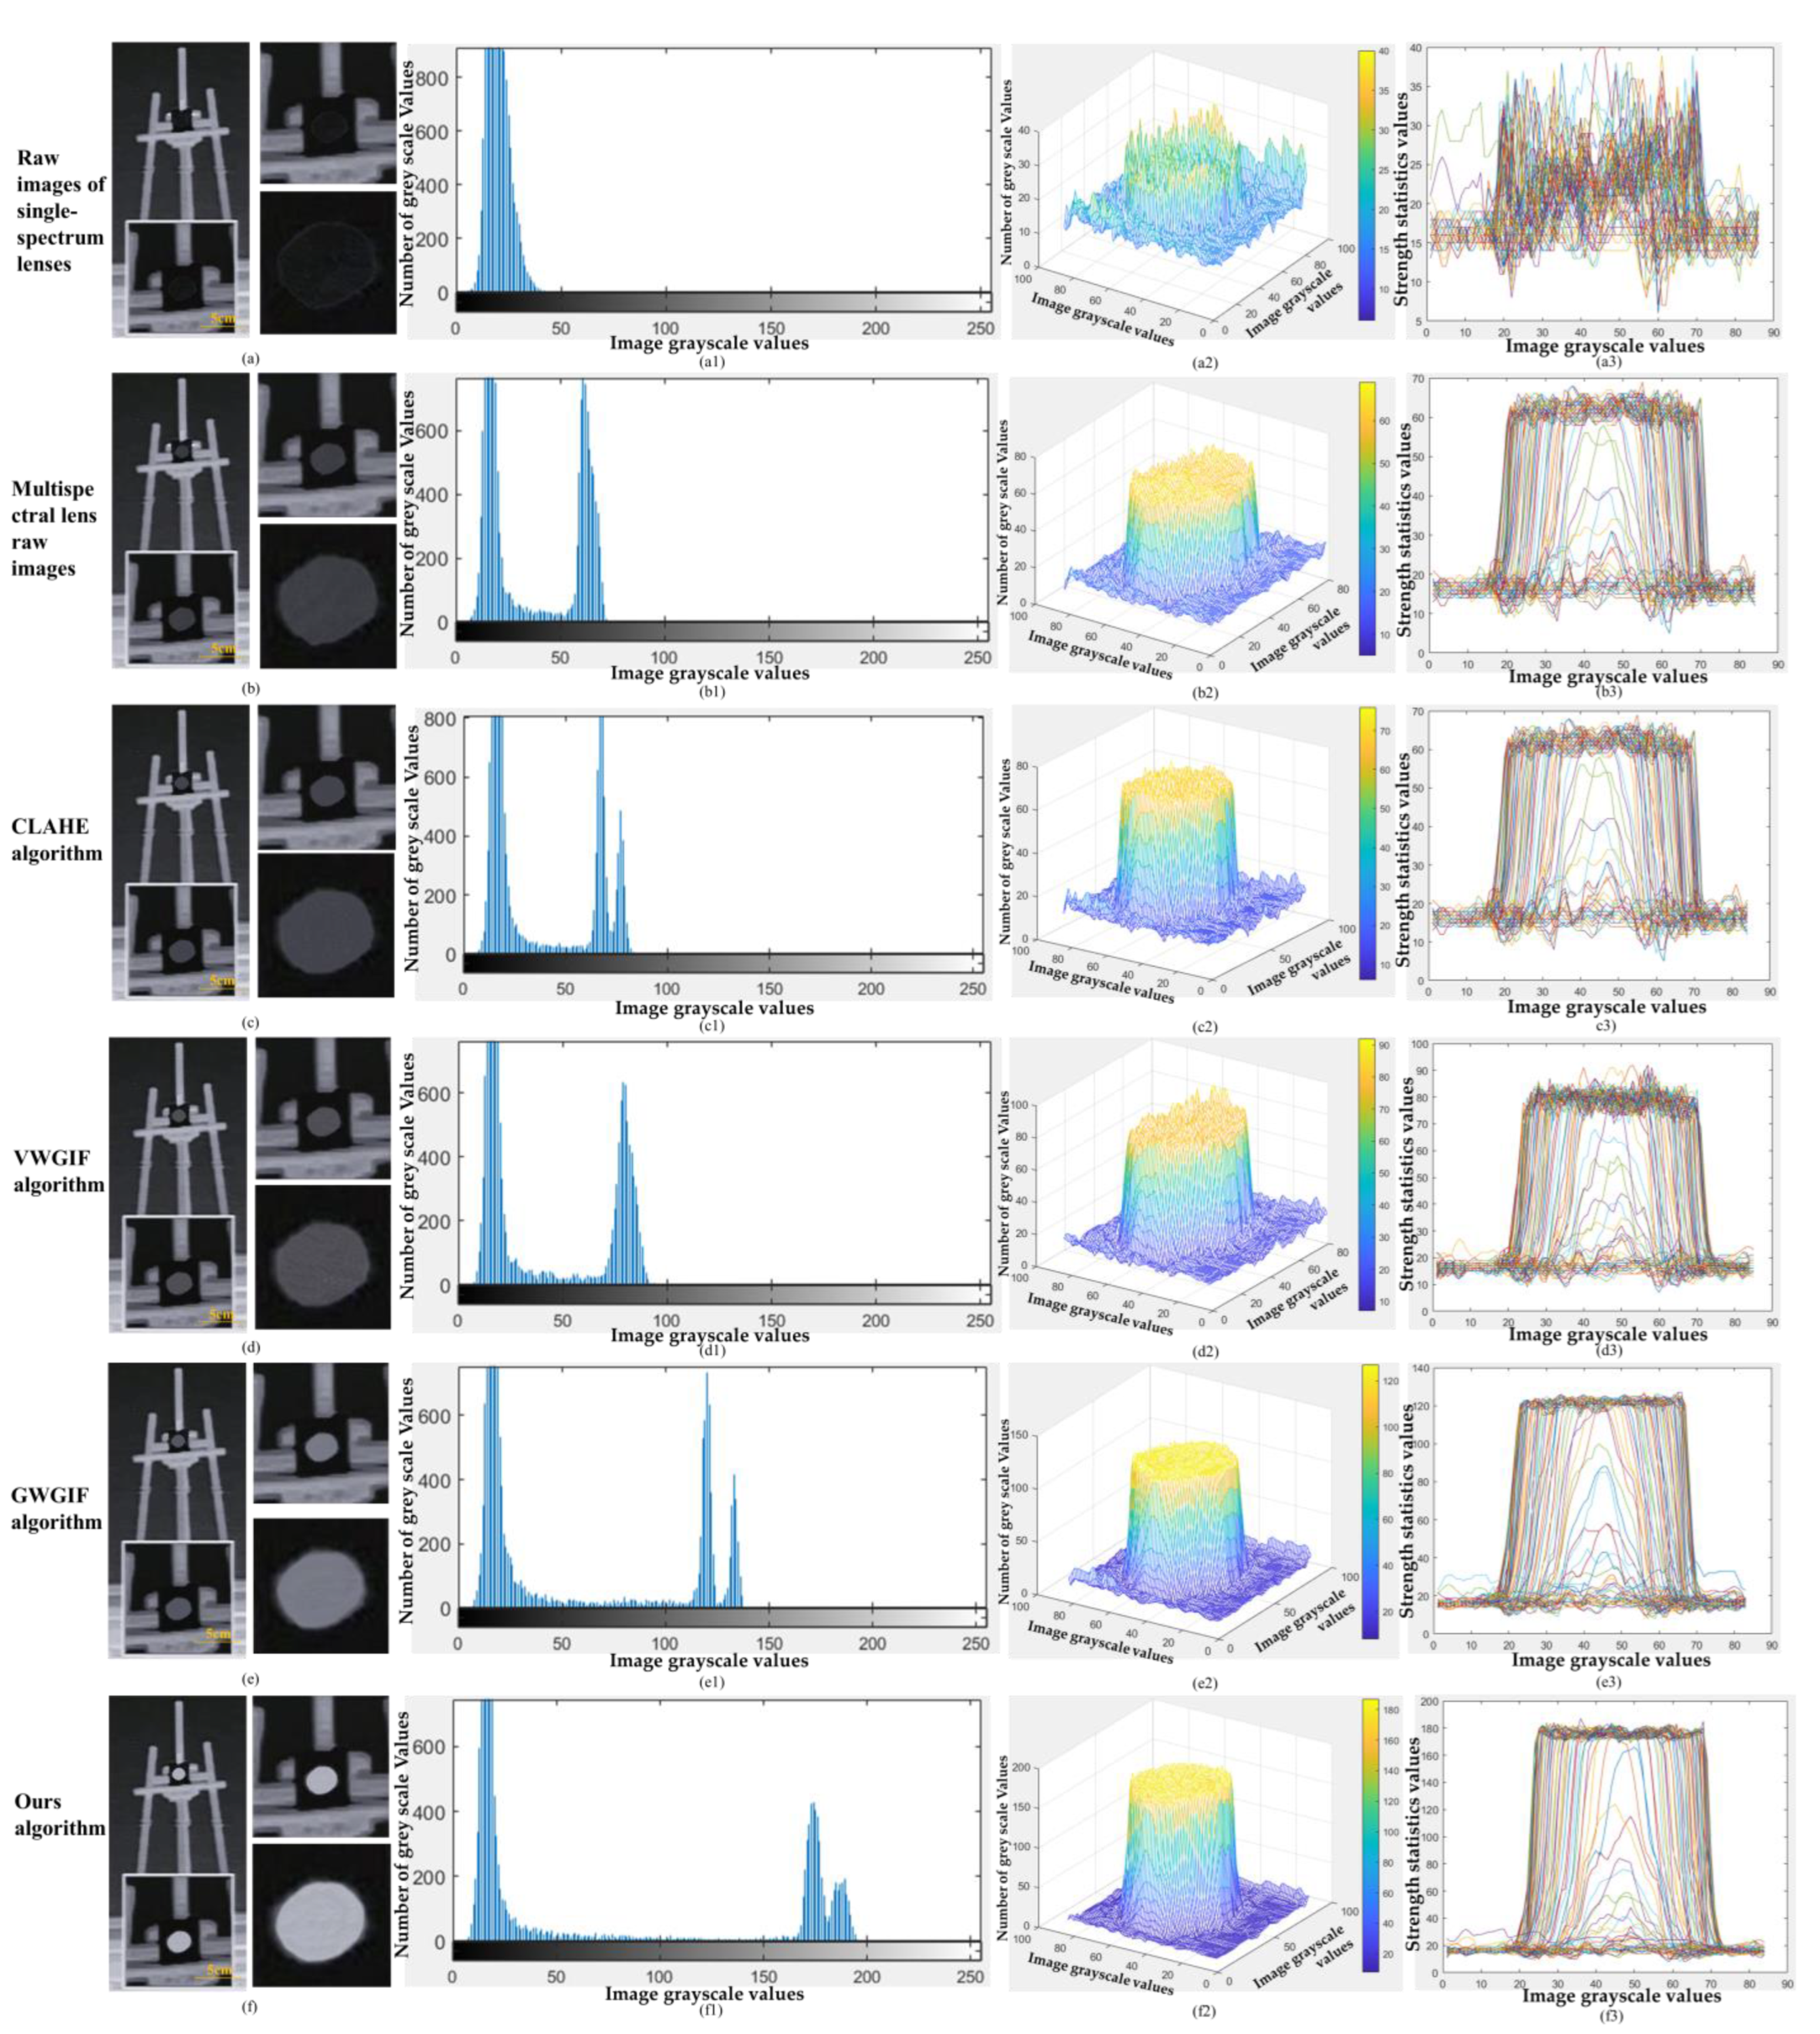
4.2. Analysis of Experimental Data
4.3. Comparison to State-of-the-Art Methods
4.4. Evaluation Metrics
4.5. Discussion
5. Conclusions
Author Contributions
Funding
Institutional Review Board Statement
Informed Consent Statement
Data Availability Statement
Conflicts of Interest
References
- Zhang, X.; Ji, W.; Li, L.; Wang, X.; Qin, C. Research progress on passive infrared imaging detection technology and system performance evaluation of natural gas leakage. Infrared Laser Eng. 2019, 9, 805–812. [Google Scholar] [CrossRef]
- Yang, W.; Liu, J.; Han, P.; Shao, X.; Zhao, X. Design of infrared zoom imaging system based on concentric spherical lens with wide Fov and high resolution. J. Infrared Millim Waves 2019, 12, S204001-1–S204001-13. [Google Scholar]
- Reshidko, D.; Reshidko, P.; Ran, C. Optical design study and prototyping of a dual-field zoom lens imaging in the 1-5 micron infrared waveband. In SPIE Conference on Zoom Lenses; SPIE: Bellingham, WA, USA, 2015. [Google Scholar]
- Malka, D.; Berke, B.A.; Tischler, Y.; Zalevsky, Z. Improving Raman spectra of pure silicon using super-resolved method. J. Opt. 2019, 2, 75801–75812. [Google Scholar] [CrossRef]
- Yang, H.; Yang, X.; Mei, C.; Chen, W. Design of hybrid refractive-diffractive infrared dual-band zoom optical system. Infrared Laser Eng. 2020, 10, 20200036-1–20200036-8. [Google Scholar]
- Li, Y.; Yang, J.; Peng, J.; Liu, L. Design of cooled infrared dual-band wide angle athermal optical system. Laser Infraed 2023, 5, 712–715. [Google Scholar]
- Deng, C.; Zhou, Y. Infrared image enhancement algorithm based on low frequency redistribution and edge enhancement. Laser Infrared 2023, 1, 146–152. [Google Scholar] [CrossRef]
- Ge, P.; Yang, B.; Han, Q.; Liu, P.; Chen, S.; Hu, D.; Zhang, Q. Infrared Image Detail Enhancement Algorithm Based on Hierarchical Processing by Guided Image Filter. Infrared Technol. 2018, 12, 1161–1169. [Google Scholar]
- Soliman, N.F.; Alabdulkreem, E.A.; Algarni, A.D.; Banby, G.M. Efficient Deep Learning Modalities for Object Detection from Infrared Images. Comput. Mater. Contin. 2022, 2, 2546–2563. [Google Scholar] [CrossRef]
- Zhou, H.; Li, B.; Wang, H.; Bian, C. Fast and accurate detection of infrared dim small target in low altitude complex scenes. J. Natl. Univ. Def. Technol. 2023, 2, 74–85. [Google Scholar] [CrossRef]
- Zhang, Y.; Zhu, H.; Cheng, H.; Zhang, J.; Zhang, Q. Infrared small target detection algorithm based on frequency domain saliency analysis and morphological filtering. Laser Infrared 2022, 10, 1488–1492. [Google Scholar]
- Li, X. Infrared image filtering and enhancement processing method based upon image processing technology. J. Electron. Imaging 2022, 5, 051408. [Google Scholar] [CrossRef]
- Hua, X.; Ge, Y. Image enhancement algorithm for the dim targets in infrared images. Electron. Des. Eng. 2016, 12, 148–150. [Google Scholar] [CrossRef]
- Cao, C.; Liao, Z.; Bai, Y.; Liao, S.; Fan, Z. design of high zoom ratio LWIR zoom system with large relative aperture. J. Appl. Opt. 2018, 11, 773–779. [Google Scholar] [CrossRef]
- Zhang, Q.; Xu, X.; Pan, Y.; Hu, M. Design of projection optical system for dynamic star simulator with long exit pupil distance. J. Chang. Univ. Sci. Technol. (Nat. Sci. Ed.) 2021, 12, 13–18. [Google Scholar]
- Shi, C.; Lin, Y. Objective image quality assessment based on image color appearance and gradient features. Acta Phys. Sin. 2020, 22, 228701. [Google Scholar] [CrossRef]
- Yang, B.; Pan, D.; Jiang, Z.; Huang, J.; Gui, W. A Cross-Scale Decomposition Method for Low-Light Image Enhancement. Signal Process. 2022, 8, 108752. [Google Scholar] [CrossRef]
- Ma, T.; Yang, Z.; Luo, Y.; Zhuang, C. Infrared dim small target detection method based on depth feature fusion. J. Zhengzhou Univ. (Nat. Sci. Ed.) 2023, 5, 65–72. [Google Scholar] [CrossRef]
- Wang, H.; Cao, D.; Zhao, Y.; Yang, Y. Survey of infrared dim small target detection algorithm based on deep learning. Laser Infrared 2022, 9, 1275–1279. [Google Scholar] [CrossRef]
- Malka, D.; Vegerhof, A.; Cohen, E.; Rayhshtat, M.; Libenson, A.; Aviv Shalev, M.; Zalevsky, Z. Improved Diagnostic Process of Multiple Sclerosis Using Automated Detection and Selection Process in Magnetic Resonance Imaging. Appl. Sci. 2017, 7, 831. [Google Scholar] [CrossRef] [Green Version]


| Parameters | Design Indicators |
|---|---|
| Wavelength/μm | 3~12 |
| Focal length/mm | 25~75 |
| F/# | 1.8 |
| Field of view (°) | 10.6~31.2 |
| Aberrations/% | ≤0.5 |
| Total system length/mm | ≤160 |
| Cut-off frequency requirements | 30 lp ≥ 0.3 |
| Air Spacing | Short Focus/mm | Central Focus/mm | Long Focus/mm |
|---|---|---|---|
| 2.16 | 36.98 | 51.41 | |
| 71.65 | 28.48 | 5.93 | |
| 5.35 | 15.23 | 24.73 |
| Aspheric | Cone Factor | 4th Order Term Coefficient | 6th Order Term Coefficient | 8th Order Term Coefficient |
|---|---|---|---|---|
| 5 | 4.499 | 2.282−6 | 3.075−8 | −7.677−10 |
| 13 | 0.362 | −5.486−6 | 5.038−8 | −1.594−10 |
| Grade | Refractive Index | Number of Apertures | Thickness/mm | Irregularity | Lens Prism/(′) | Abbey Error/% | Lens Tilt/(′) | Lens Eccentricity/mm | Mirror Set Position/mm | Tilt of the Mirror set/(′) | Mirror Set Eccentric/mm |
|---|---|---|---|---|---|---|---|---|---|---|---|
| Q1 | 0.0001 | 0.5 | 0.01 | 0.1 | 0.17 | 0.01 | 0.17 | 0.001 | 0.01 | 0.17 | 0.001 |
| Q2 | 0.0003 | 1 | 0.01 | 0.1 | 0.3 | 0.03 | 0.3 | 0.003 | 0.01 | 0.3 | 0.003 |
| Q3 | 0.0005 | 1 | 0.0125 | 0.25 | 0.5 | 0.05 | 0.5 | 0.005 | 0.0125 | 0.5 | 0.005 |
| Q4 | 0.0008 | 2 | 0.025 | 0.25 | 0.8 | 0.08 | 0.8 | 0.008 | 0.025 | 0.8 | 0.008 |
| Q5 | 0.001 | 2 | 0.0375 | 0.5 | 1 | 0.1 | 1 | 0.01 | 0.0375 | 1 | 0.01 |
| Q6 | 0.003 | 3 | 0.05 | 0.5 | 1.5 | 0.3 | 1.5 | 0.03 | 0.05 | 1.5 | 0.03 |
| Q7 | 0.008 | 3 | 0.075 | 1 | 2 | 0.5 | 2 | 0.05 | 0.075 | 2 | 0.05 |
| Q8 | 0.008 | 3 | 0.1 | 2 | 3 | 0.8 | 3 | 0.08 | 0.1 | 3 | 0.08 |
| Name | Short Focus | Central Focus | Long Focus |
|---|---|---|---|
| Nominal (mm) | 0.286 | 0.307 | 0.382 |
| Best (mm) | 0.496 | 0.502 | 0.531 |
| Worst (mm) | 0.239 | 0.286 | 0.335 |
| Average (mm) | 0.324 | 0.358 | 0.401 |
| Compensator statistics | |||
| Post-focus change | |||
| Minimum (mm) | −0.821 | −0.685 | −0.316 |
| Maximum (mm) | 1.719 | 1.536 | 0.447 |
| Average (mm) | −0.025 | −0.061 | 0.056 |
| Standard deviation (mm) | 0.412 | 0.325 | 0.294 |
| Monte Carlo Analysis | Short Focus DIFF.MTF Mean | Centrally Focused DIFF.MTF Mean | Long Focus DIFF.MTF Mean |
|---|---|---|---|
| 90%> | 0.25019852 | 0.30114021 | 0.36342636 |
| 80%> | 0.25635879 | 0.30890703 | 0.38552938 |
| 50%> | 0.26025144 | 0.31151765 | 0.38924014 |
| 20%> | 0.28580429 | 0.32224147 | 0.41818301 |
| 10%> | 0.30251004 | 0.34857056 | 0.44751512 |
| Configuration Types | Specific Configuration | Configuration Data |
|---|---|---|
| The hardware | CPU | Intel(R) Core i7 |
| Frequency | 1.8 GHz | |
| RAM | 32 G | |
| Software | The operating system | Win 10 |
| The development tools | IRController_V3.02 | |
| Cameras | Operating bands | 3~12 μm |
| Pixel resolution | 640 × 512 | |
| Pixel spacing | 17 μm | |
| NETD | ≤60 mK@25 °C | |
| Frame rate | 50 Hz | |
| Experimental environment | Ambient temperature | 21.7 °C |
| Ambient humidity | 67% |
| Evaluation Indicators | 1 | 2 | 3 | 4 | 5 | 6 | 7 | 8 | 9 | 10 | Average | |
|---|---|---|---|---|---|---|---|---|---|---|---|---|
| MSE | Ours | 37.64 | 36.28 | 37.07 | 37.6 | 34.24 | 36.54 | 36.72 | 34.61 | 37.26 | 33.26 | 36.12 |
| VWGIF | 89.25 | 87.51 | 89.64 | 87.36 | 90.28 | 89.37 | 89.39 | 90.08 | 90.57 | 91.32 | 89.48 | |
| GIF | 108.64 | 110.28 | 109.36 | 114.32 | 110.08 | 108.35 | 107.64 | 107.29 | 119.37 | 108.29 | 110.36 | |
| GWGIF | 47.57 | 50.06 | 49.37 | 51.08 | 48.25 | 51.27 | 51.36 | 49.58 | 52.17 | 53.66 | 50.44 | |
| CLAHE | 133.48 | 134.54 | 135.67 | 132.18 | 134.72 | 132.19 | 130.58 | 130.61 | 134.28 | 132.19 | 133.04 | |
| SNR | Ours | 31.26 | 30.18 | 29.89 | 31.24 | 30.67 | 31.05 | 32.01 | 31.89 | 31.78 | 31.47 | 31.14 |
| VWGIF | 22.67 | 20.18 | 18.79 | 18.96 | 19.27 | 18.74 | 19.06 | 19.18 | 18.11 | 19.85 | 19.48 | |
| GIF | 18.64 | 18.05 | 17.98 | 16.87 | 17.02 | 15.46 | 16.02 | 16.07 | 16.74 | 16.26 | 16.91 | |
| GWGIF | 21.03 | 20.18 | 19.72 | 18.73 | 19.06 | 19.24 | 19.07 | 17.62 | 20.18 | 20.18 | 19.50 | |
| CLAHE | 18.43 | 17.62 | 18.17 | 18.34 | 16.28 | 17.26 | 16.98 | 16.05 | 19.07 | 17.25 | 17.55 | |
| PSNR | Ours | 38.26 | 37.89 | 37.06 | 39.27 | 41.03 | 40.65 | 39.76 | 38.79 | 41.28 | 40.85 | 39.48 |
| VWGIF | 28.15 | 26.38 | 26.04 | 26.64 | 27.01 | 25.37 | 26.31 | 27.11 | 25.63 | 24.31 | 26.30 | |
| GIF | 26.15 | 25.49 | 24.06 | 25.03 | 24.87 | 25.06 | 24.67 | 25.08 | 23.87 | 25.09 | 24.94 | |
| GWGIF | 28.66 | 27.62 | 26.35 | 27.52 | 25.64 | 27.16 | 26.48 | 25.01 | 25.89 | 26.75 | 26.70 | |
| CLAHE | 21.87 | 18.87 | 20.86 | 20.18 | 21.65 | 22.85 | 22.06 | 20.83 | 21.65 | 22.06 | 21.29 | |
| SSIM | Ours | 0.95 | 0.94 | 0.95 | 0.96 | 0.95 | 0.94 | 0.93 | 0.94 | 0.95 | 0.96 | 0.95 |
| VWGIF | 0.76 | 0.72 | 0.75 | 0.79 | 0.74 | 0.76 | 0.78 | 0.81 | 0.79 | 0.78 | 0.77 | |
| GIF | 0.71 | 0.73 | 0.69 | 0.72 | 0.3 | 0.68 | 0.74 | 0.67 | 0.66 | 0.69 | 0.66 | |
| GWGIF | 0.87 | 0.85 | 0.81 | 0.82 | 0.79 | 0.81 | 0.79 | 0.81 | 0.79 | 0.78 | 0.81 | |
| CLAHE | 0.52 | 0.51 | 0.49 | 0.48 | 0.43 | 0.42 | 0.51 | 0.53 | 0.49 | 0.47 | 0.49 | |
Disclaimer/Publisher’s Note: The statements, opinions and data contained in all publications are solely those of the individual author(s) and contributor(s) and not of MDPI and/or the editor(s). MDPI and/or the editor(s) disclaim responsibility for any injury to people or property resulting from any ideas, methods, instructions or products referred to in the content. |
© 2023 by the authors. Licensee MDPI, Basel, Switzerland. This article is an open access article distributed under the terms and conditions of the Creative Commons Attribution (CC BY) license (https://creativecommons.org/licenses/by/4.0/).
Share and Cite
Yang, S.; Zou, Z.; Li, Y.; Shi, H.; Fu, Q. Hierarchical Feature Enhancement Algorithm for Multispectral Infrared Images of Dark and Weak Targets. Photonics 2023, 10, 805. https://doi.org/10.3390/photonics10070805
Yang S, Zou Z, Li Y, Shi H, Fu Q. Hierarchical Feature Enhancement Algorithm for Multispectral Infrared Images of Dark and Weak Targets. Photonics. 2023; 10(7):805. https://doi.org/10.3390/photonics10070805
Chicago/Turabian StyleYang, Shuai, Zhihui Zou, Yingchao Li, Haodong Shi, and Qiang Fu. 2023. "Hierarchical Feature Enhancement Algorithm for Multispectral Infrared Images of Dark and Weak Targets" Photonics 10, no. 7: 805. https://doi.org/10.3390/photonics10070805