Article

Hyperspectral Imaging Combined with Deep Learning to Detect Ischemic Necrosis in Small Intestinal Tissue

1
School of Opto-Electronic Engineering, Changchun University of Science and Technology, Changchun 130000, China
2
Zhongshan Research Institute, Changchun University of Science and Technology, Zhongshan 528400, China
3
Pediatric General Surgery, The Second Affiliated Hospital and Yuying Children’s Hospital of Wenzhou Medical University, Wenzhou 325000, China
4
College of Electrical and Electronic Engineering, Wenzhou University, Wenzhou 325000, China
*
Authors to whom correspondence should be addressed.
Photonics 2023, 10(7), 708; https://doi.org/10.3390/photonics10070708
Submission received: 4 May 2023 / Revised: 17 June 2023 / Accepted: 19 June 2023 / Published: 21 June 2023
(This article belongs to the Topic Biomedical Photonics)

Abstract

:
Obtaining adequate resection margins in small intestinal necrotic tissue remains challenging due to the lack of intraoperative feedback. Here, we used hyperspectral imaging (HSI), an imaging technique for objective identification, combined with deep learning methods for automated small intestine tissue classification. As part of a prospective experimental study, we recorded hyperspectral datasets of small intestine biopsies from seven white rabbits. Based on the differences in the spectral characteristics of normal and ischemic necrotic small intestinal tissues in the wavelength range of 400–1000 nm, we applied deep learning techniques to objectively distinguish between these two types of tissues. The results showed that three-dimensional convolutional neural networks were more effective in extracting both spectral and spatial features of small intestine tissue hyperspectral data for classification. The combination of a deep learning model and HSI provided a new idea for the objective identification of ischemic necrotic tissue in the small intestine.

1. Introduction

Acute mesenteric ischemia (AMI) is a serious clinical condition [1,2]. Blockage of blood vessels around the small intestine tissue and weakened blood supply can cause ischemic necrosis of the tissue [3]. Superior mesenteric artery embolism, arterial thrombosis, and superior venous thrombosis are the main causes of AMI [4]. Signs of AMI are usually characterized by sudden abdominal pain of varying degrees and persistent pressure or distension in the abdomen [5]. In the context of AMI, elderly patients may also present with psychotic symptoms. Different causes of mesenteric ischemia often have different clinical manifestations and physiological features. The mortality rate of AMI has not decreased despite improvements in medical care [2]. Moreover, the incidence of AMI increases with population growth. In recent years, AMI has attracted a lot of attention from pathologists [6]. Severe necrosis of small intestinal tissue occurs in AMI, leading to a high mortality rate in cases where patients do not receive timely treatment. Long-term ischemia of the small intestine can lead to the breakdown of the tissue’s mucosal barrier, which allows bacteria to move into the intestinal canal and cause gangrene of the intestinal wall. In addition, bacterial infiltration within the patient’s small intestinal tissue can cause intestinal obstruction, peritonitis, and even death due to multi-organ failure. Therefore, rapid and precise excision of necrotic small intestinal tissue is essential. The elevation of blood lactate in the body is due to the anaerobic metabolism of the ischemic gut. Blood lactate indicators can be used as a reference for ischemic bowel disease in hospitals. However, elevated blood lactate levels in critically ill patients can also be caused by acute liver failure. This is because liver failure can affect the elimination of lactate, making lactate an insensitive parameter [7]. CT scans are also sometimes used to identify patients with AMI, but patients with AMI show a diverse array of imaging presentations. Amber et al. have highlighted that the chance of detecting ischemic bowel through CT scans is about 50% [8]. Thus, this method is also unreliable. This fact emphasizes the need for surgical exploration as the ultimate diagnostic and therapeutic tool in cases of suspected AMI.
Currently, clinical judgment of necrotic small intestinal tissue often relies on the subjective experience of physicians [9]. Based on traits, including the color and morphology of the small intestine tissue, doctors can distinguish between normal and necrotic regions, and doctors with varying levels of experience may make different diagnoses. Only skilled medical professionals can pinpoint the exact location of necrotic small intestinal tissue. Incomplete removal of necrotic tissue in the small intestine can lead to abdominal inflammation. After a time, the patient may have to face another resection. If the extent of resection is too much, it can lead to a reduction in the normal small bowel tissue. This can lead to short bowel syndrome and affect the patient’s quality of life after surgery. Therefore, there is an urgent clinical need for an objective way to assist physicians in the identification of normal and necrotic sites of small intestine tissue.
The propagation of light in biological tissues is fundamental to medical diagnostic techniques. The irradiating light on biological tissues can undergo scattering, reflection, and absorption, both at the surface and inside the tissue [10]. The pathological information of the tissue can usually be reflected based on the interaction of light with the tissue. In this regard, hyperspectral imaging (HSI) is a non-contact and non-destructive way of acquiring information [11]. In addition to the spatial data of objects in the field of view, it can also collect spectral data from numerous wavelength bands across the image pixel points. HSI was originally applied in the field of remote sensing [12]. Currently, this technology is used in many fields, such as food quality inspection [13], vegetation observation [14], archaeological [15], criminal investigation [16], etc. In recent years, HSI techniques have received increasing attention and applications in the biomedical field [17]. It not only captures image information of biological tissues but also responds to the pathological conditions in the area of interest based on spectral information [18]. For example, it can assist doctors in diagnosing retinal lesions [19], healing skin burns [20], and identifying cancerous tissue [17]. HSI combined with microscopy can assist pathologists in the examination of sections such as cholangiocarcinoma [21], acute lymphocytic leukemia cells [22], and tumor tissue [23]. HSI has been used to detect nanoparticles within cells and applied to the development of nanomedicines [24,25].
HSI can acquire more wavelengths of image information than traditional RGB imaging, so each pixel point of a hyperspectral image has a complete line of spectral information [26]. Computers can classify or recognize this rich information based on artificial intelligence algorithms to assist humans in automating some tasks. Deep learning is a hot topic in artificial intelligence and has been widely used in recent years for tasks such as target recognition and image classification [27]. It can mine the deep information inside the data and obtain abstract features. Convolutional neural network (CNN) is the most representative method in deep learning. Related research has shown that CNNs can achieve better target object classification results in the HSI application field compared to traditional machine learning methods [28].
In this study, a self-built HSI system was used to acquire small intestinal tissue data from seven white rabbits. The normal and necrotic parts of small intestine tissues were classified by using a CNN model. The 1D-CNN, 2D-CNN, and 3D-CNN models were built to extract the feature information of spectral dimension, image dimension, and spectral-image dimension of small intestine tissue hyperspectral data, respectively. The trained CNN model was used to objectively classify the small intestine tissue of the new sample. The results showed that the 3D-CNN model achieved better performance with an average accuracy of 89.60%, an average sensitivity and specificity of 81.93% and 99.85%, and an average kappa coefficient of 81.34% for all the predicted samples.

2. Materials and Methods

The experimental framework of this study is shown in Figure 1. Firstly, an ischemic necrosis model of small intestinal tissues of white rabbits was developed by an experienced physician. The development of the tissue model was based on the deliberate obstruction of the mesenteric vessels, thereby rendering a part of the small intestinal tissue inaccessible to its normal blood supply. The ultimate aim was to create a site of ischaemic necrosis of the small intestinal tissue. Consequently, the biopsies from the rabbit samples showed both normal and ischemic necrotic areas in the small intestinal tissue. These conditions were obtained through biomedical means. Secondly, the hyperspectral data of small intestinal tissue were acquired by a self-built HSI system. Third, the acquired raw hyperspectral data were calibrated. In order to facilitate the selection of the region of interest (ROI) of the small intestine tissue, the background information around the tissue was removed. Finally, the classification model was constructed using CNN after building the dataset. Additionally, the classification performance of the model was evaluated.

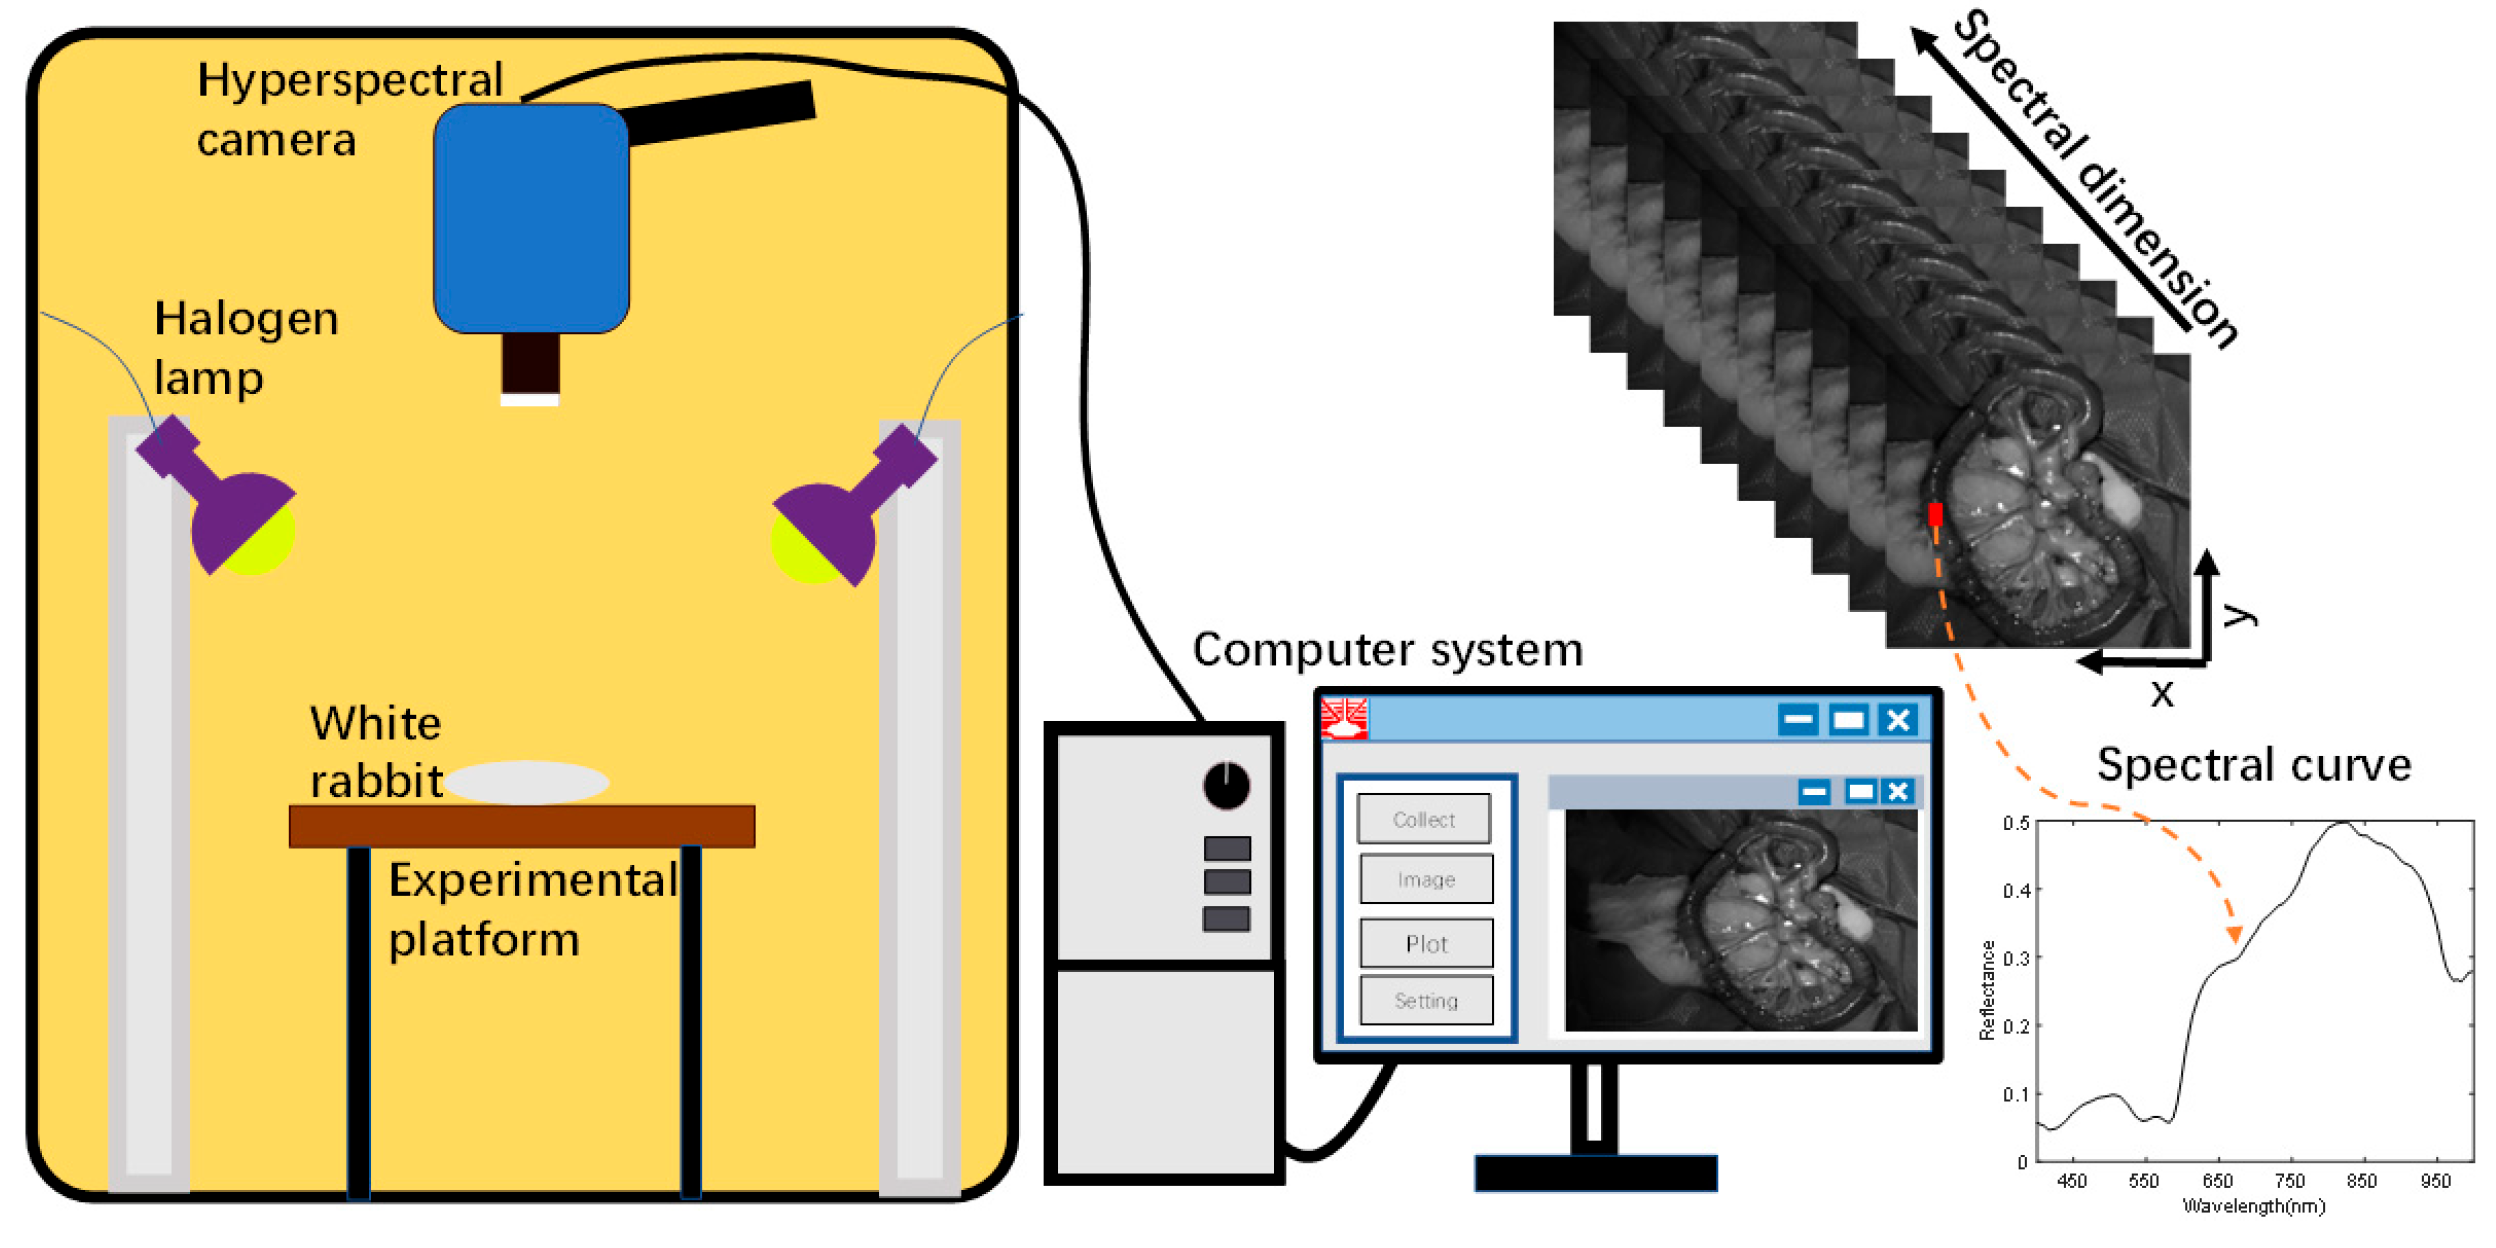
2.1. Small Intestine Tissue HSI Dataset

In this study, a white rabbit was used as an experimental sample. The rabbit was treated with cough suppression, analgesia, and anesthesia before the experiment [29]. As shown in Figure 2a, anesthetic drugs were injected intravenously. After the anesthetic treatment, the rabbit was in a sleeping state. The hairs on the abdomen of the rabbit were removed, and dissection was performed (Figure 2b). As shown in Figure 2c, the small intestinal tissue of the rabbit was exposed by the physician. Then, the blood supply to a portion of the intestine was blocked, and the model of ischemic necrosis of the small intestinal tissue was developed by experienced doctors. Vascular clamps were used to clamp the mesenteric vessels in the right place, blocking the flow of blood to the downstream part of the intestinal tissue. A suture was also used to ligate the site of ischemic necrosis by blocking the collateral circulation between the normal and ischemic parts of the intestine. The rest of the mesenteric vessels and intestinal canal were with normal blood flow through the mesenteric artery to the intestinal tissues [29]. In this way, a control group was formed.
Acquisition of small intestine biopsy data from rabbits using a self-built hyperspectral acquisition system is displayed in Figure 3. The system mainly consists of a hyperspectral camera, a halogen light source, data acquisition software, and an optical darkroom [29]. The hyperspectral camera (SOC710VP, San Diego, CA, USA) has a spectral range of 376–1038 nm and a spectral step size of 4.69 nm in 128 bands. The spatial resolution of the images under each band was 696 × 520. A halogen lamp (LOWEL PRO, Burbank, CA, USA) was used as the light source for the system, which covered the operating wavelength of the hyperspectral camera. The hyperspectral camera lens recorded the photographs of small intestinal tissue vertically downward, and the halogen light source was maintained at 45° on both sides of the sample to provide uniform and stable light intensity to the sample tissue region. A data acquisition software, Hyper-Scanner (SOC, San Diego, CA, USA), was applied, which allows the computer to acquire raw hyperspectral information of small intestinal tissues. In order to avoid contamination by ambient light, all samples were collected in a dark room with a size of 2 m × 1.5 m × 2 m. The hyperspectral system acquired small intestine tissue data with 128 bands of spectral information per pixel point.
The time required to scan the entire sample was about 6 s. In order to explore the direct application of HSI in a real clinical setting, we macroscopically captured small intestine biopsy tissue information through a hyperspectral camera. The light penetrated the intestinal wall of the small intestine and was absorbed by substances such as water, oxyhemoglobin, and deoxyhemoglobin in the biological tissues. Based on the difference in the reflected spectral information between normal and ischemic necrotic areas of small intestinal tissue, the normal and necrotic areas of small intestinal tissue were identified. In the actual acquisition process, specular reflection was observed due to local areas of wetness on the surface of the living tissue. This was observed in the localized areas of exposure; however, no significant impact was noted on the ability to distinguish between normal and necrotic sites of small intestinal tissue.

2.2. Preprocessing

In addition, to acquire hyperspectral data of rabbit small intestine tissue, it was necessary to acquire light intensity information from a standard reflectance white plate and dark background noise signal of the device in the same environment. A black-and-white correction was required to eliminate the interference of uneven light sources and equipment dark background noise on the data [30]. The light intensity values of both the small intestine tissue hyperspectral image and the white standard plate were simultaneously removed from the device’s dark current signal, and then the ratio operation was performed. Finally, normalized band by band. As shown in Equation (1):
X r e f = X R d a r k R w h i t e R d a r k
The sensitivity of the spectrometer and CCD camera inside the hyperspectral camera was not high at the first and last edges of the band. It made the noise at the head and tail of the spectral band large. Therefore, only the spectral information in the range of 400–1000 nm was retained. To facilitate the selection of the region of interest, the background information around the small intestinal tissue was removed using the One-class algorithm [31,32]. It is worth noting that the presence of water on the surface of the small intestine tissue causes specular reflection on the surface of the tissue. The background information around the small intestine tissue was removed along with the exposed area. This avoided interference with the subsequent training and classification of the model. The experienced physician selected the ROI in the hyperspectral image with the background removed, depending on the site of ischemia.
The small intestinal tissue data obtained from all rabbits were analyzed. For the raw data of each sample, we separately performed black-and-white correction, removal of small intestinal tissue background, and selection of ROI operations [29]. The size of the ROI for each sample was 120 × 150 for normal and ischemic necrotic sites. The spectral information of each pixel point was in the range of 400–1000 nm. The number of spectral points in the ROI for each sample is shown in Table 1.

2.3. Deep Learning

CNN is a classic deep learning algorithm. It is used in pattern recognition and feature extraction in various scenarios. CNN is a deep feedforward neural network with the characteristics of local connection and weight sharing [23]. The entire structure of a CNN consists of an input layer, a hidden layer, and an output layer, where the hidden layer contains a convolutional layer, a pooling layer, and a fully connected layer. In recent years, there have been many applications of CNN combined with HSI in the medical field [16]. Figure 4 shows the input of hyperspectral image information of small intestinal tissue into the CNN model. The trained model has objectively discriminated between normal and ischaemic necrotic areas in small bowel tissue. The model contains a large number of neurons and parameters internally.

2.4. Experiment Description

CNN model was applied to extract features from HSI data of small intestinal tissue. Three different cases were used. Each case extracted features from hyperspectral data of different dimensions. The details are as follows.
Case study 1 (CS1): In this case, a one-dimensional convolutional neural network (1D-CNN) model was developed based on the spectral information of each pixel. The original three-dimensional data was converted into a one-dimensional spectral form. The one-dimensional spectral information of each pixel was directly input into the network model for training. The network model included a convolutional layer, a pooling layer, an activation layer, and a fully connected layer. The convolution kernel only performed convolution operations along a one-dimensional spectral vector.
Case study 2 (CS2): Two-dimensional convolutional neural networks (2D-CNN) were trained on hyperspectral data of small intestinal tissue. Convolutional kernels performed sliding convolution operations in the two-dimensional space of hyperspectral data to extract spatial information from small bowel tissue. The number of channels in the convolutional kernel was the same as the number of channels in the input training model data. During the convolution process, the convolution kernel and data were convolved separately in the channel direction. The convolution values of each channel were then added together. Each convolution layer has multiple convolution kernels, and convolution operations were performed separately. Finally, the output of each convolution was concatenated in the channel dimension.
Case study 3 (CS3): In this case, one-dimensional spectral and two-dimensional spatial information from hyperspectral data were combined to develop a three-dimensional convolutional neural network (3D-CNN) model. The 3D-CNN model extracted deep feature information of the small intestine tissue. This model performed convolution not only in two-dimensional space but also in spectral dimensions. The convolutional kernel moved in three directions (height, width, and channel) of the data cube. Due to the fact that the convolutional kernel was slid through a 3D space, the output values were also arranged according to the 3D space.
The model was trained in a way to closely simulates a real clinical application scenario. Generally, doctors rely on prior experience when diagnosing disease of small bowel tissue in a patient. Inspired by this approach, the CNN model was trained using cross-validation between the samples. For example, for the prediction of sample 1, the model was trained using samples numbered 2–7 with a total of 99,594 spectral points. For the prediction of sample 7, the model was trained using samples numbered 1–6 with a total of 104,783 spectral points. During the model training process, a ten-fold cross-validation approach was used to validate the model. This allowed the model to be more generalizable. Two important metrics, cross-entropy loss function and accuracy, were used to measure the performance and accuracy of the model, respectively.

2.5. Metrics

In this study, the overall accuracy, sensitivity, specificity, and Kappa coefficient were used to measure the classification performance of the proposed CNN models. The overall accuracy was the percentage of correctly classified small intestinal tissue regions to the overall number. Sensitivity was the percentage of true positives (TP) to all necrotic tissues. Specificity measured the ability of the classifier to identify true negatives (TN). FP and FN represent false positives and false negatives, respectively [33]. They are as shown in Equations (2)–(4). In addition, this study also measured the performance of the classification model using the kappa coefficient [16].
A c c u r a c y = T P + T N T P + F P + T N + F N
S e n s i t i v i t y = T P T P + F N
S p e c i f i c i t y = T N T N + F P

3. Results

This section presents the results of the CNN model for small bowel tissue classification mentioned in Section 2. In all three different cases, the performance of the model was evaluated using a clinically realistic application scenario. In real clinical situations, physicians often rely on their experience with previous patients when diagnosing new patients. In the present study, the classification of each rabbit’s small intestine tissue was performed by relying on models built on data from other samples. The models were trained in Python using a 3.5 GHz Intel Core i9-10920X computer for this study.

3.1. Case1: 1D-CNN

Each pixel point in a hyperspectral image contains a one-dimensional piece of spectral information [34]. In this case, 1D-CNN was used to convolve the spectral vectors of the pixel points of the hyperspectral image of small intestinal tissue. As shown in Figure 5, the one-dimensional spectral information of the small intestine tissue alone was used as input information to train the model in a convolutional neural network. In this case, a three-layer convolutional neural network was used, each layer consisting of a convolutional layer, an activation layer, a normalization layer, and a pooling layer. Each pixel point was composed of 116 dimensions of spectral information. The size of the first convolutional kernel was 3 × 1, a number of 16, and the pooling layer size was 3 × 1. The output size after the first convolutional layer was 38 × 16. The size of the second layer of convolution kernels was 3 × 1, with a channel count of 16 and a number of 64. The pooling layer size was 3 × 1, and the step size was 3. The output size was 12 × 64. The size of the third layer of convolutional kernels was 1 × 1, and the pooling layer size was 3 × 1, with a step size of 3. The output size was 4 × 64. The fully connected layer was composed of 256 neurons and an output size of 2. After the spectral information of different types of small intestinal tissue was trained, the model recorded its features based on manual markers.
The model was trained with hyperspectral data from other rabbits to predict the small intestine tissue data of a new sample. The results of the cross-validation between samples are shown in Table 2. The results showed that the normal and necrotic parts of the small intestinal tissue were well distinguished using the 1D-CNN model. The average accuracy of the 1D CNN model proposed in this case for the classification of these seven rabbits’ small intestine hyperspectral data was 84.95%. The average sensitivity was 80.40%, the average specificity was 89.55%, and the kappa coefficient was 69.77%. It showed good classification performance.
Four of the samples showed an overall accuracy of over 90% across all samples. The sensitivity of S1, S4, and S7 and the specificity of S2, S3, and S4 all exceeded 99%. The kappa coefficients for S1, S2, S4 and S7 all exceeded 80%.

3.2. Case2: 2D-CNN

This case was based on 2D-CNN to build a classification model to distinguish between normal and ischemic necrotic parts of the small intestine. The 2D-CNN model could extract spatial information from hyperspectral images [35]. As the dimension of the hyperspectral data in this study dataset is 116, the network model requires a large number of parameters during training. These parameters not only increase the training cost of the model but also have a high risk of overfitting the model. To build a more effective 2D CNN model, we first downscaled the hyperspectral data. Principal Component Analysis (PCA) is a commonly used method for dimensionality reduction in hyperspectral data. It extracted the main features of the spectral dimension of the small intestine hyperspectral data to approximate the full band information. In this case, PCA was used to reduce the 116-dimensional hyperspectral data to 30 dimensions. This greatly reduced the training cost without losing the spectral features of the original data.
The network structure of this case is shown in Figure 6. The input size of the training data for the model was 5 × 5 × 116. The spatial dimension of each patch was 5 × 5, and the number of spectral channels was 116. The PCA was first scaled down in the spectral dimension to 5 × 5 × 30. The size of the first layer of convolution kernels was 3 × 3, the number of kernels was 32, the padding was 1 × 1, and the step size was 1 × 1. After the first layer of convolution, the size became 5 × 5 × 32. The pooling layer size was 2 × 2, and the step size was 2 × 2. After the first pooling layer, the data size became 2 × 2 × 32. The size of the second layer convolutional kernel was 3 × 3, with a number of 64, a padding of 1 × 1, and a step size of 1 × 1. The pooling size for this layer was 2 × 2, and the step size was 2 × 2. After this layer, the data size was 1 × 1 × 64. The size of the third convolution kernel was 1 × 1, and the number was 128. After the third convolution layer, the size becomes 1 × 1 × 128. After the fully connected layer, the output dimension was 2.
Table 3 shows the results of these seven samples when classified using the 2D-CNN model. As in case 1, cross-validation between samples was used. The average accuracy was 84.30%, the average sensitivity was 79.94%, the average specificity was 91.19%, and the kappa coefficient was 71.07%. The classification results were good. For five of these seven samples, the overall classification accuracy was above 95%, with S1, S4, S6, and S7 reached to 99%. For S5, the overall accuracy was 41.43%, but the specificity was 95.93%. The sensitivity for S6 and the specificity for S4 both reached 100%, and the kappa coefficients for S1, S2, S4, S6, and S7 were all above 90%.

3.3. Case3: 3D-CNN

The 1D CNN model mentioned in case1 was aimed at extracting spectral information from hyperspectral images of small intestinal tissue. While the 2D-CNN model in case2 mainly extracted the spatial feature information of hyperspectral data. This case uses 3D-CNN to process hyperspectral data of small intestine tissue. The spatial information was extracted along with the spectral information of each pixel point. The fusion of spatial and spectral information can provide richer information about hyperspectral data [36].
The structure of the network model proposed in this case is shown in Figure 7. During the training of the model, the data input size was 5 × 5 × 116, where the spatial dimension of each patch was 5 × 5, and the number of spectral channels was 116. The size of the first convolution kernel was 3 × 3 × 32, the number of channels was 1, the number of pieces was 32, the padding was 1 × 1 × 0, and the step size was 1 × 1 × 1. After the first convolution layer, the size became 5 × 5 × 85 × 32. The size of the first pooling layer was 1 × 2 × 2, and the step size was 1 × 2 × 2. After the first pooling layer, the size became 2 × 2 × 85 × 32. The size of the convolution kernel in the second layer was 3 × 3 × 32, and the number of pieces was 64. After the second convolution layer, the size was 2 × 2 × 54 × 64. The size of the second pooling layer was 1 × 2 × 2 and the step size was 1 × 2 × 2. After the second pooling layer, the data size was 1 × 1 × 54 × 64. The size of the third convolution kernel was 1 × 1 × 1 × 54, and the number of kernels was 128. After the third convolution layer, the size became 1 × 1 × 1 × 1 × 128.
The results of the 3D CNN proposed in this case are shown in Table 4. There were five samples with overall accuracies above 90%. The overall accuracy of S3 was 89.48%, which was close to 90%. The average accuracy, sensitivity, specificity, and kappa for all the samples were: 89.60%, 81.93%, 99.85%, and 81.34%, respectively. All these measures were higher than the results of case1 and case2.
As shown in Figure 8a, a model of ischemic necrosis of the small intestinal tissue was developed by the surgeon. The mesenteric vessels were clamped with a vascular clamp to block blood flow to the downstream portion of the intestine, as shown by the green arrow in the image. In addition, to prevent blood flow from the normal intestine to the ischemic intestine, sutures were used to block the site of collateral circulation between the normal and ischemic parts of the intestine. In this way, the area of the intestine (between the yellow arrows in the diagram) was completely devoid of blood flow, creating a site of ischemic necrosis. The rest of the mesenteric vessels and the intestinal tube did not interfere, and normal blood flow was maintained through the mesenteric arteries to the intestinal tissue. Based on the actual operation of the procedure, the surgeon successfully performed accurate labeling of the normal and ischemic necrotic areas of small bowel tissue in the hyperspectral data.
Representative classification results of the CNN models in the three cases for normal and necrotic sites of small intestinal tissue are shown in Figure 8. Figure 8b shows the ground truth of the experienced physician labeling normal and necrotic areas of small intestinal tissue. Above the yellow line is the area of ischemic necrosis of the small intestinal tissue, while below is the area of normal tissue. This indicated different spectral characteristics of normal and ischemic necrotic areas of small intestinal tissue. The classification effect of 1D-CNN on the ROI regions is shown in Figure 8c. It can be seen that most of the normal and necrotic areas were identified. However, some pixel points within both normal and necrotic areas were misidentified, and the boundary between the two types of tissue was not clear. Figure 8d demonstrates the differentiation effect of the 2D-CNN model. Most of the ischemic necrotic sites were correctly classified, with only a few areas identified as normal tissue. However, for normal tissue sites, a considerable amount of the area was identified as normal tissue. Additionally, the boundaries between the two types of tissue were incorrect. The recognition performance of 3D-CNN is shown in Figure 8e. It can be seen that it is classified very well. Its predictions were very close to the real annotations made by experienced physicians. The boundaries between the two tissue types were clear and correct. In addition, we have added the scale bar in Figure 8c, Figure 8d, and Figure 8e, respectively. The width of the intestinal canal is roughly in the range of 1–2 cm.

4. Discussion

Obtaining the margins of ischemic necrotic tissue in the small intestine is essential to prevent the recurrence of the condition after surgery. However, this is still difficult as there are currently no boundary assessment techniques that can provide real-time feedback during the procedure. With the ability to image small bowel tissue in a short period of time, HSI has the potential to overcome the current limitations. In this study, we combined HSI with advanced deep learning techniques to demonstrate the automatic classification of normal and necrotic areas of small bowel tissue. Most of the recently published studies of HSI combined with deep learning for medical applications have been performed under the microscope or on ex vivo tissue, which are different from studying in vivo living tissue. The pathological state of living tissue in the body is often related to factors such as blood oxygen levels and blood flow. The objective classification of small intestinal biopsies in this study was closer to the real clinical scenario. Therefore, it could be used as a reference for clinical applications.
We used a hyperspectral camera in the 400–1000 nm wavelength range to collect small intestine tissue in vivo from rabbits. The light source used was a halogen light source, and data acquisition was carried out in a dark room. Experienced physicians blocked the mesenteric artery to develop an ischemic necrosis model of small intestinal tissue. The drug was administered to the rabbits prior to the development of the tissue necrosis model. The rabbits breathed steadily, and the area of intestinal tissue remained stationary during data collection. The doctor kept the rabbits fasting for more than 12 h before the experiment to reduce the amount of digested food in the intestinal canal. This avoided the effect of frequent intestinal peristalsis on the hyperspectral images. Although occasional peristalsis occurred in small intestinal tissue, hyperspectral data was not collected during such events. This ensured the hyperspectral data of small intestinal tissue without motion artifacts. However, when human small bowel tissue is clinically imaged, motion artifacts due to factors such as the patient’s breathing or the peristaltic movement of the small bowel tissue cannot be eliminated. This requires the use of alignment techniques to eliminate the interference caused by motion artifacts [37]. For future work, we will investigate this issue in order to move closer to clinical applications.
Deep learning techniques are a hot topic in the field of artificial intelligence. In recent years, hyperspectral technology combined with deep learning has made breakthroughs in many areas. We used CNN to train different structural classification models on the acquired data. In evaluating model performance, approaches that were close to real-life clinical application scenarios were applied. All data was cross-validated between the samples. The input to the 1D CNN model was the spectral information of each pixel point of the hyperspectral data of the small bowel tissue. Although this model only extracted information for the spectral features of hyperspectral data, it also showed good classification performance. The 2D-CNN model used in case2 was widely used in the field of image processing. It performed convolutional operations on the spatial information of an image. Unlike traditional RGB imagery, which has only three channels of information, hyperspectral data has hundreds of channels. The input to the model, in this case, was two-dimensional spatial information with all spectral dimensions. To take advantage of the fact that hyperspectral data has both spatial and spectral information, we used 3D-CNN to convolve the small intestine tissue data in case3. The average classification of normal and necrotic parts of the small intestine using 3D-CNN was better than that of 1D-CNN and 2D-CNN.
While HSI techniques can provide a wealth of information, there can also be some redundancy, such as the correlation of information in adjacent bands. In future work, we can use the specific bands of normal and necrotic parts of the small intestinal tissue for model training. This could remove redundant information and improve the speed and accuracy of model training [38]. In addition, for CNN models, factors such as the number of convolutional layers, the size of the convolutional kernel, the activation function, and the size of the fully connected layers may all affect the final classification result.
From the results of this study, it can be seen that the average accuracy, sensitivity, specificity, and kappa coefficient of the developed 3D-CNN model to differentiate between normal and ischemic necrotic sites of small intestinal tissue was better than 1D-CNN and 2D-CNN. However, the 3D-CNN model was not always the best for each sample. That is, the models are not universally applicable. In the next study, we will continue to collect hyperspectral data from small intestinal tissue and expand the data set. We will optimize the model structure and parameters to obtain a more stable and generalized model to discriminate between normal and necrotic parts of small intestinal tissue.

5. Conclusions

This paper explores the potential application of HSI and deep learning techniques for small intestine tissue classification. We used a self-built HSI system to acquire data on rabbit small intestine tissues in vivo. After preprocessing, CNN models with three different structures were built separately. The results show that the 3D-CNN model developed in this paper has the best average performance for all the samples. It could assist physicians in objectively identifying ischemic necrosis sites in clinical practice and serve as a reference for more accurate excision of necrotic small intestinal tissues during surgery.

Author Contributions

Conceptualization, L.Z. (Lechao Zhang) and D.H.; methodology, L.Z. (Lechao Zhang), Y.Z., X.C. (Xiaojing Chen) and D.H.; software, Y.Z. and Z.X.; validation, X.C. (Xiaoqing Chen), G.H. and L.Z. (Libin Zhu); formal analysis, L.Z. (Lechao Zhang) and G.C.; investigation, X.C. (Xiaoqing Chen) and L.Z. (Libin Zhu); resources, X.C. (Xiaojing Chen); data curation, L.Z. (Libin Zhu); writing—original draft preparation, L.Z. (Lechao Zhang); writing—review and editing, L.Z. (Lechao Zhang) and S.A.; visualization, S.A.; supervision, X.C. (Xiaojing Chen); project administration, X.C. (Xiaoqing Chen); funding acquisition, G.H. and X.C. (Xiaojing Chen). All authors have read and agreed to the published version of the manuscript.

Funding

This work was supported by Wenzhou Social Development (Medical and Health) Science and Technology Project (ZY2021027), Changchun University of Science and Technology Zhongshan Research Institute Project (No. 20211201-20231231-H21-10-05), Natural Science Foundation of China (62105245), and the Zhejiang Provincial Medical and Health Project (2021PY014).

Institutional Review Board Statement

The animal study protocol was approved by the Ethics Committee of the Animal Experimentation Center of Wenzhou Medical University (protocol code “wydw2021-0299” and the date of approval is August 2021).

Informed Consent Statement

Not applicable.

Data Availability Statement

The data that support the findings of this study are available on request from the corresponding author. The data are not publicly available due to privacy or ethical restrictions.

Acknowledgments

We are grateful for the support of all the funding during the progress of the project.

Conflicts of Interest

The authors declare no conflict of interest.

References

  1. Emile, S.H. Predictive factors for intestinal transmural necrosis in patients with acute mesenteric ischemia. World J. Surg. 2018, 42, 2364–2372. [Google Scholar] [CrossRef]
  2. Luther, B.; Mamopoulos, A.; Lehmann, C.; Klar, E. The ongoing challenge of acute mesenteric ischemia. Visc. Med. 2018, 34, 215–221. [Google Scholar] [CrossRef] [PubMed]
  3. Akbari, H.; Kosugi, Y.; Kojima, K.; Tanaka, N. Detection and analysis of the intestinal ischemia using visible and invisible hyperspectral imaging. IEEE Trans. Biomed. Eng. 2010, 57, 2011–2017. [Google Scholar] [CrossRef] [PubMed]
  4. Yasuhara, H. Acute mesenteric ischemia: The challenge of gastroenterology. Surg. Today 2005, 35, 185–195. [Google Scholar] [CrossRef]
  5. Sinha, D.; Kale, S.; Kundaragi, N.G.; Sharma, S. Mesenteric ischemia: A radiologic perspective. Abdom. Radiol. 2022, 47, 1514–1528. [Google Scholar] [CrossRef]
  6. Wyers, M.C. Acute mesenteric ischemia: Diagnostic approach and surgical treatment. Semin. Vasc. Surg. 2010, 23, 9–20. [Google Scholar] [CrossRef]
  7. Mehdorn, M.; Köhler, H.; Rabe, S.M.; Niebisch, S.; Lyros, O.; Chalopin, C.; Gockel, I.; Jansen-Winkeln, B. Hyperspectral imaging (HSI) in acute mesenteric ischemia to detect intestinal perfusion deficits. J. Surg. Res. 2020, 254, 7–15. [Google Scholar] [CrossRef] [PubMed]
  8. Ambe, P.C.; Kang, K.; Papadakis, M.; Zirngibl, H. Can the preoperative serum lactate level predict the extent of bowel ischemia in patients presenting to the emergency department with acute mesenteric ischemia? Biomed. Res. Int. 2017, 2017, 8038796. [Google Scholar] [CrossRef] [Green Version]
  9. Wang, Y.; Tiusaba, L.; Jacobs, S.; Saruwatari, M.; Ning, B.; Levitt, M.; Sandler, A.D.; Nam, S.-H.; Kang, J.U.; Cha, J. Unsupervised and quantitative intestinal ischemia detection using conditional adversarial network in multimodal optical imaging. J. Med. Imaging 2022, 9, 064502. [Google Scholar] [CrossRef]
  10. Lu, G.; Fei, B. Medical hyperspectral imaging: A review. J. Biomed. Opt. 2014, 19, 010901. [Google Scholar] [CrossRef] [PubMed]
  11. Jansen-Winkeln, B.; Holfert, N.; Köhler, H.; Moulla, Y.; Takoh, J.; Rabe, S.; Mehdorn, M.; Barberio, M.; Chalopin, C.; Neumuth, T. Determination of the transection margin during colorectal resection with hyperspectral imaging (HSI). Int. J. Color. Dis. 2019, 34, 731–739. [Google Scholar] [CrossRef]
  12. Jia, J.; Wang, Y.; Chen, J.; Guo, R.; Shu, R.; Wang, J. Status and application of advanced airborne hyperspectral imaging technology: A review. Infrared Phys. Technol. 2020, 104, 103115. [Google Scholar] [CrossRef]
  13. Saha, D.; Manickavasagan, A. Machine learning techniques for analysis of hyperspectral images to determine quality of food products: A review. Curr. Res. Food Sci. 2021, 4, 28–44. [Google Scholar] [CrossRef] [PubMed]
  14. Yan, Y.; Deng, L.; Liu, X.; Zhu, L. Application of UAV-based multi-angle hyperspectral remote sensing in fine vegetation classification. Remote Sens. 2019, 11, 2753. [Google Scholar] [CrossRef] [Green Version]
  15. Lugli, F.; Sciutto, G.; Oliveri, P.; Malegori, C.; Prati, S.; Gatti, L.; Silvestrini, S.; Romandini, M.; Catelli, E.; Casale, M. Near-infrared hyperspectral imaging (NIR-HSI) and normalized difference image (NDI) data processing: An advanced method to map collagen in archaeological bones. Talanta 2021, 226, 122126. [Google Scholar] [CrossRef] [PubMed]
  16. Ozdemir, A.; Polat, K. Deep learning applications for hyperspectral imaging: A systematic review. J. Inst. Electron. Comput. 2020, 2, 39–56. [Google Scholar] [CrossRef]
  17. Notarstefano, V.; Sabbatini, S.; Conti, C.; Pisani, M.; Astolfi, P.; Pro, C.; Rubini, C.; Vaccari, L.; Giorgini, E. Investigation of human pancreatic cancer tissues by Fourier Transform Infrared Hyperspectral Imaging. J. Biophoton. 2020, 13, e201960071. [Google Scholar] [CrossRef]
  18. Daukantas, P. Hyperspectral imaging meets biomedicine. Opt. Photonics News 2020, 31, 32–39. [Google Scholar] [CrossRef]
  19. Yoon, J. Hyperspectral imaging for clinical applications. Biochip J. 2022, 16, 1–12. [Google Scholar] [CrossRef]
  20. Promny, D.; Aich, J.; Püski, T.; Edo, A.M.; Reichert, B.; Billner, M. Evaluation of hyperspectral imaging as a modern aid in clinical assessment of burn wounds of the upper extremity. Burns 2022, 48, 615–622. [Google Scholar] [CrossRef]
  21. Sun, L.; Zhou, M.; Li, Q.; Hu, M.; Wen, Y.; Zhang, J.; Lu, Y.; Chu, J. Diagnosis of cholangiocarcinoma from microscopic hyperspectral pathological dataset by deep convolution neural networks. Methods 2022, 202, 22–30. [Google Scholar] [CrossRef]
  22. Wang, Q.; Wang, J.; Zhou, M.; Li, Q.; Wang, Y. Spectral-spatial feature-based neural network method for acute lymphoblastic leukemia cell identification via microscopic hyperspectral imaging technology. Biomed. Opt. Express 2017, 8, 3017–3028. [Google Scholar] [CrossRef] [PubMed] [Green Version]
  23. Hu, B.; Du, J.; Zhang, Z.; Wang, Q. Tumor tissue classification based on micro-hyperspectral technology and deep learning. Biomed. Opt. Express 2019, 10, 6370–6389. [Google Scholar] [CrossRef] [PubMed]
  24. Jena, P.V.; Gravely, M.; Cupo, C.; Safaee, M.M.; Roxbury, D.; Heller, D.A. Hyperspectral counting of multiplexed nanoparticle emitters in single cells and organelles. ACS Nano 2022, 16, 3092–3104. [Google Scholar] [CrossRef] [PubMed]
  25. Roth, G.A.; Tahiliani, S.; Neu-Baker, N.M.; Brenner, S.A. Hyperspectral microscopy as an analytical tool for nanomaterials. Wiley Interdiscip. Rev. Nanomed. Nanobiotechnol. 2015, 7, 565–579. [Google Scholar] [CrossRef] [PubMed]
  26. Pham, Q.T.; Liou, N.-S. The development of on-line surface defect detection system for jujubes based on hyperspectral images. Comput. Electron. Agric. 2022, 194, 106743. [Google Scholar] [CrossRef]
  27. Sarker, I.H. Deep learning: A comprehensive overview on techniques, taxonomy, applications and research directions. SN Comput. Sci. 2021, 2, 420. [Google Scholar] [CrossRef]
  28. Hu, X.; Xie, C.; Fan, Z.; Duan, Q.; Zhang, D.; Jiang, L.; Wei, X.; Hong, D.; Li, G.; Zeng, X. Hyperspectral anomaly detection using deep learning: A review. Remote Sens. 2022, 14, 1973. [Google Scholar] [CrossRef]
  29. Zhang, L.; Huang, D.; Chen, X.; Zhu, L.; Chen, X.; Xie, Z.; Huang, G.; Gao, J.; Shi, W.; Cui, G. Visible near-infrared hyperspectral imaging and supervised classification for the detection of small intestinal necrosis tissue in vivo. Biomed. Opt. Express 2022, 13, 6061–6080. [Google Scholar] [CrossRef]
  30. Lu, G.; Little, J.V.; Wang, X.; Zhang, H.; Patel, M.R.; Griffith, C.C.; El-Deiry, M.W.; Chen, A.Y.; Fei, B. Detection of Head and Neck Cancer in Surgical Specimens Using Quantitative Hyperspectral ImagingHyperspectral Imaging for Head and Neck Cancer Detection. Clin. Cancer Res. 2017, 23, 5426–5436. [Google Scholar] [CrossRef] [Green Version]
  31. Mũnoz-Marí, J.; Bovolo, F.; Gómez-Chova, L.; Bruzzone, L.; Camp-Valls, G. Semisupervised one-class support vector machines for classification of remote sensing data. IEEE Trans. Geosci. Remote Sens. 2010, 48, 3188–3197. [Google Scholar] [CrossRef] [Green Version]
  32. Zhang, L.; Huang, D.; Chen, X.; Zhu, L.; Xie, Z.; Chen, X.; Cui, G.; Zhou, Y.; Huang, G.; Shi, W. Discrimination between normal and necrotic small intestinal tissue using hyperspectral imaging and unsupervised classification. J. Biophoton. 2023, e202300020. [Google Scholar] [CrossRef]
  33. Ortega, S.; Halicek, M.; Fabelo, H.; Camacho, R.; Plaza, M.d.l.L.; Godtliebsen, F.; Callicó, G.M.; Fei, B. Hyperspectral imaging for the detection of glioblastoma tumor cells in H&E slides using convolutional neural networks. Sensors 2020, 20, 1911. [Google Scholar]
  34. Li, X.; Jiang, H.; Jiang, X.; Shi, M. Identification of geographical origin of Chinese chestnuts using hyperspectral imaging with 1D-CNN algorithm. Agriculture 2021, 11, 1274. [Google Scholar] [CrossRef]
  35. Hao, Q.; Pei, Y.; Zhou, R.; Sun, B.; Sun, J.; Li, S.; Kang, X. Fusing multiple deep models for in vivo human brain hyperspectral image classification to identify glioblastoma tumor. IEEE Trans. Instrum. Meas. 2021, 70, 1–14. [Google Scholar] [CrossRef]
  36. Fırat, H.; Asker, M.E.; Bayindir, M.İ.; Hanbay, D. Spatial-spectral classification of hyperspectral remote sensing images using 3D CNN based LeNet-5 architecture. Infrared Phys. Technol. 2022, 127, 104470. [Google Scholar] [CrossRef]
  37. Lu, G.; Wang, D.; Qin, X.; Halig, L.; Muller, S.; Zhang, H.; Chen, A.; Pogue, B.W.; Chen, Z.G.; Fei, B. Framework for hyperspectral image processing and quantification for cancer detection during animal tumor surgery. J. Biomed. Opt. 2015, 20, 126012. [Google Scholar] [CrossRef] [Green Version]
  38. Kumar, B.; Dikshit, O.; Gupta, A.; Singh, M.K. Feature extraction for hyperspectral image classification: A review. Int. J. Remote Sens. 2020, 41, 6248–6287. [Google Scholar] [CrossRef]
Figure 1. Framework for processing hyperspectral data of small intestine tissue.
Photonics 10 00708 g001
Figure 2. Development of ischemic necrosis model of small intestinal tissue by experienced physicians. (a) Anesthetic treatment of sample by injecting anesthetic; (b) Dissection of the sample by the doctor; (c) Blocking mesenteric vessels and developing a model of ischemic necrosis of small intestinal tissue in vivo.
Photonics 10 00708 g002
Figure 3. HSI acquisition system.
Photonics 10 00708 g003
Figure 4. The architecture of neural networks for small intestinal tissue classification. Red is the normal tissue label; blue is the necrotic tissue label.
Photonics 10 00708 g004
Figure 5. The network structure of a 1D-CNN model based on spectral features for classification of normal and necrotic sites in small intestinal tissue.
Photonics 10 00708 g005
Figure 6. The network structure of the 2D-CNN model based on spatial image features for classification of normal and necrotic sites of small intestinal tissue.
Photonics 10 00708 g006
Figure 7. The network structure of a 3D-CNN model based on spectral and spatial image features for classification of normal and necrotic sites in small intestinal tissue.
Photonics 10 00708 g007
Figure 8. Effect of classification of normal and necrotic sites of small intestinal tissue. (a) Blocking the mesentery and ligating the collateral circulation. (b) Ground truth of ROI labeling by physicians. The spectral characteristics of normal and ischemic necrotic sites of small intestinal tissue curve differently. (c) Classification effect of 1D-CNN network structure on ROI regions. (d) Classification effect of 2D-CNN network structure on ROI regions. (e) Classification effect of 3D-CNN network structure on ROI regions.
Photonics 10 00708 g008
Table 1. Experimental dataset.
SampleNumber of Pixels
Normal NecrosisSum
S110,39710,82121,728
S211,63510,80622,441
S35059753112,590
S4538345639946
S58493823916,732
S6985911,48721,346
S78917762216,539
Total59,74361,069120,812
Table 2. 1D-CNN model classification results.
SampleOA (%)Sensitivity (%)Specificity (%)Kappa (%)
S199.31 99.90 98.81 98.61
S296.65 94.00 99.74 93.29
S384.34 69.07 99.15 68.53
S499.96 99.98 99.94 99.92
S566.09 61.98 72.15 32.64
S657.83 38.02 76.24 14.44
S790.50 99.82 80.79 80.92
Ave84.95 80.40 89.55 69.77
Table 3. 2D-CNN model classification results.
SampleOA (%)Sensitivity (%)Specificity (%)Kappa (%)
S199.52 99.30 99.71 99.04
S297.33 95.18 99.84 94.66
S352.38 61.00 43.44 4.45
S499.99 99.97 100.00 99.97
S541.43 4.56 95.93 0.40
S699.90 100.00 99.80 99.79
S799.58 99.54 99.62 99.16
Ave84.30 79.94 91.19 71.07
Table 4. 3D-CNN model classification results.
SampleOA (%) Sensitivity (%)Specificity (%)Kappa (%)
S199.76 99.63 99.88 99.52
S296.21 92.97 99.99 92.42
S389.48 79.40 99.95 79.04
S499.99 99.97 100.00 99.97
S547.37 11.95 99.73 9.66
S699.69 100.00 99.40 99.37
S794.69 89.59 99.99 89.39
Ave89.60 81.93 99.85 81.34
Disclaimer/Publisher’s Note: The statements, opinions and data contained in all publications are solely those of the individual author(s) and contributor(s) and not of MDPI and/or the editor(s). MDPI and/or the editor(s) disclaim responsibility for any injury to people or property resulting from any ideas, methods, instructions or products referred to in the content.

