1. Introduction
Volatile organic compounds (VOCs) exist in many fields and need to be monitored in real time for air pollution monitoring, industrial processing, food safety, living environment testing, and life and health diagnosing. They are produced by exhaust gas during transportation, various types of paint coatings, glue and adhesives in building decoration, and all kinds of fossil fuels [
1,
2,
3]. Early warning of risks, fine controlling, and disease prediction can be accomplished by precisely monitoring VOC concentrations [
4,
5]. VOC gases include alcohol, aldehydes, ketones, esters, organic acids, etc. [
6]. In addition to their flammable and explosive properties, high concentrations of VOCs are toxic and harmful to the natural environment and human health [
7]. At present, the working mechanisms of VOC sensors mainly rely on semiconductor metal oxide nanomaterials, electrochemical reactions, electrolyte detection, and optical technology [
8,
9]. Due to the low cost and high performance of semiconductor nanomaterials, these kinds of gas sensors have been widely used in gas leakage alarms in industry and the environmental protection fields. However, they have difficulty in precisely determining the concentrations of different gases. Furthermore, the high performance of semiconductor nanomaterials depends on stable catalytic efficiency at a high temperature (200–400 °C) [
10,
11], which has seriously limited their commercial applications in hazardous environments filled with flammable and explosive gases. A great deal of research has been conducted to reduce their working temperature to avoid the explosion risks caused by heat in these kinds of sensors during the in situ monitoring process for flammable and explosive gases [
12,
13,
14,
15]. The transmission and generation of current, voltage, and resistance of the electrochemical sensors is easily affected by electromagnetic interference, which will limit long-term work stability in some complex industrial environments [
16]. The enrichment of charged ions and detection of electrolytes will also be affected by complex environmental disturbances [
17], thus resulting in difficulty in integrating with other systems.
Unlike electrical signal measurement, some optical detection mechanisms, including laser spectra direct absorption, optical thermal spectra, micro/nano-photonics effects, etc., provide effective methods for accurate, real-time, and room temperature monitoring of hazardous gases with flammable and explosive properties [
18]. Among miniature and compact optical gas sensors or devices, high-precision detection performance has been demonstrated in plasmonic micro-chips based on noble metal nanostructures [
19] and micro-resonators based on dielectric metamaterials [
20,
21]. Although their excellent performance has been verified, nano-photonics devices are still seriously limited by the stringent requirements for precise nano-processing techniques and the high cost of equipment.
Optical fiber sensors have high sensitivity, accuracy, chemical corrosion resistance, anti-electromagnetic interference, and stable working properties over long distances [
22]. Especially in high-temperature and high-pressure environments, the detection process for flammable and explosive gases will become safer. Currently, practical optical fiber sensor technology is mainly limited by the repeatability of processing technology and the expensive components of demodulation equipment [
23]. When gas molecules are detected by gas sensors made from sensitive nanomaterials and optical fiber structures, the effective refractive index of the function material film will become different, thereby changing the optical signal parameters in the optical fiber [
24,
25,
26]. Therefore, the gas concentration in the environment can be determined by demodulating the change to the optical parameters of frequency domain interference spectra (recorded by an optical spectrum analyzer) or time domain variation waveforms (obtained by an optoelectronic detector and oscilloscope) [
27,
28], including attributes such as phase and intensity (power). In order to improve the sensing performance (mainly refers to sensitivity) of optical fiber sensors, the diameter of optical fiber is reduced to micro- or even nanoscale (microfiber or nanofiber), where the optical evanescent field can break free from the constraints of the fiber core, reach the outer surface, and propagate along the micro/nanofibers [
29]. In this case, full contact between the light field and the external environment or outer sensitive materials will greatly improve the response sensitivity of the optical fiber probe to the measured parameters [
30,
31].
The introduction of sensitive materials and the optimization of the corresponding augmentation methods can effectively enhance the selectivity and sensitivity for the optical fiber gas sensors. ZnO nanomaterials perform excellently in terms of electricity, light, magnetism, etc. [
32,
33], and have also been introduced as a gas-sensitive material to develop fiber gas sensors [
34]. ZnO nanomaterials are generally dispersed into polymer materials and applied to the surface of the optical fiber structure to detect VOC gases with high sensitivity [
35]. Kitture et al. modified ZnO nanoparticle-doped PMMA on the end-surfaces of optical fiber, resulting in the effective detection of H
2S gas at 5 ppm [
36]. Narasimman verified the NH
3-sensing performance of Cu/ZnO nanoflakes after modifying them on the surface of a multi-fiber grade-spliced structure [
37]. In recent years, microfiber sensors have been widely studied due to their high-sensitivity performance on strong evanescent field properties. Yahya coated the surface of microfiber tapers with Pd/ZnO nanostructures [
38] and experimentally demonstrated its sensing performance for H
2.
In this work, reflective microfiber tapers were prepared and augmented with a mixture of ZnO nanosheets and UV glue. Their ethanol-sensing performance was experimentally verified. The impacts of the dozen ratio of ZnO nanosheets, UV glue, and fiber structure morphology on the sensing performance are discussed below.
2. Sensitive Materials and Sensor Preparation
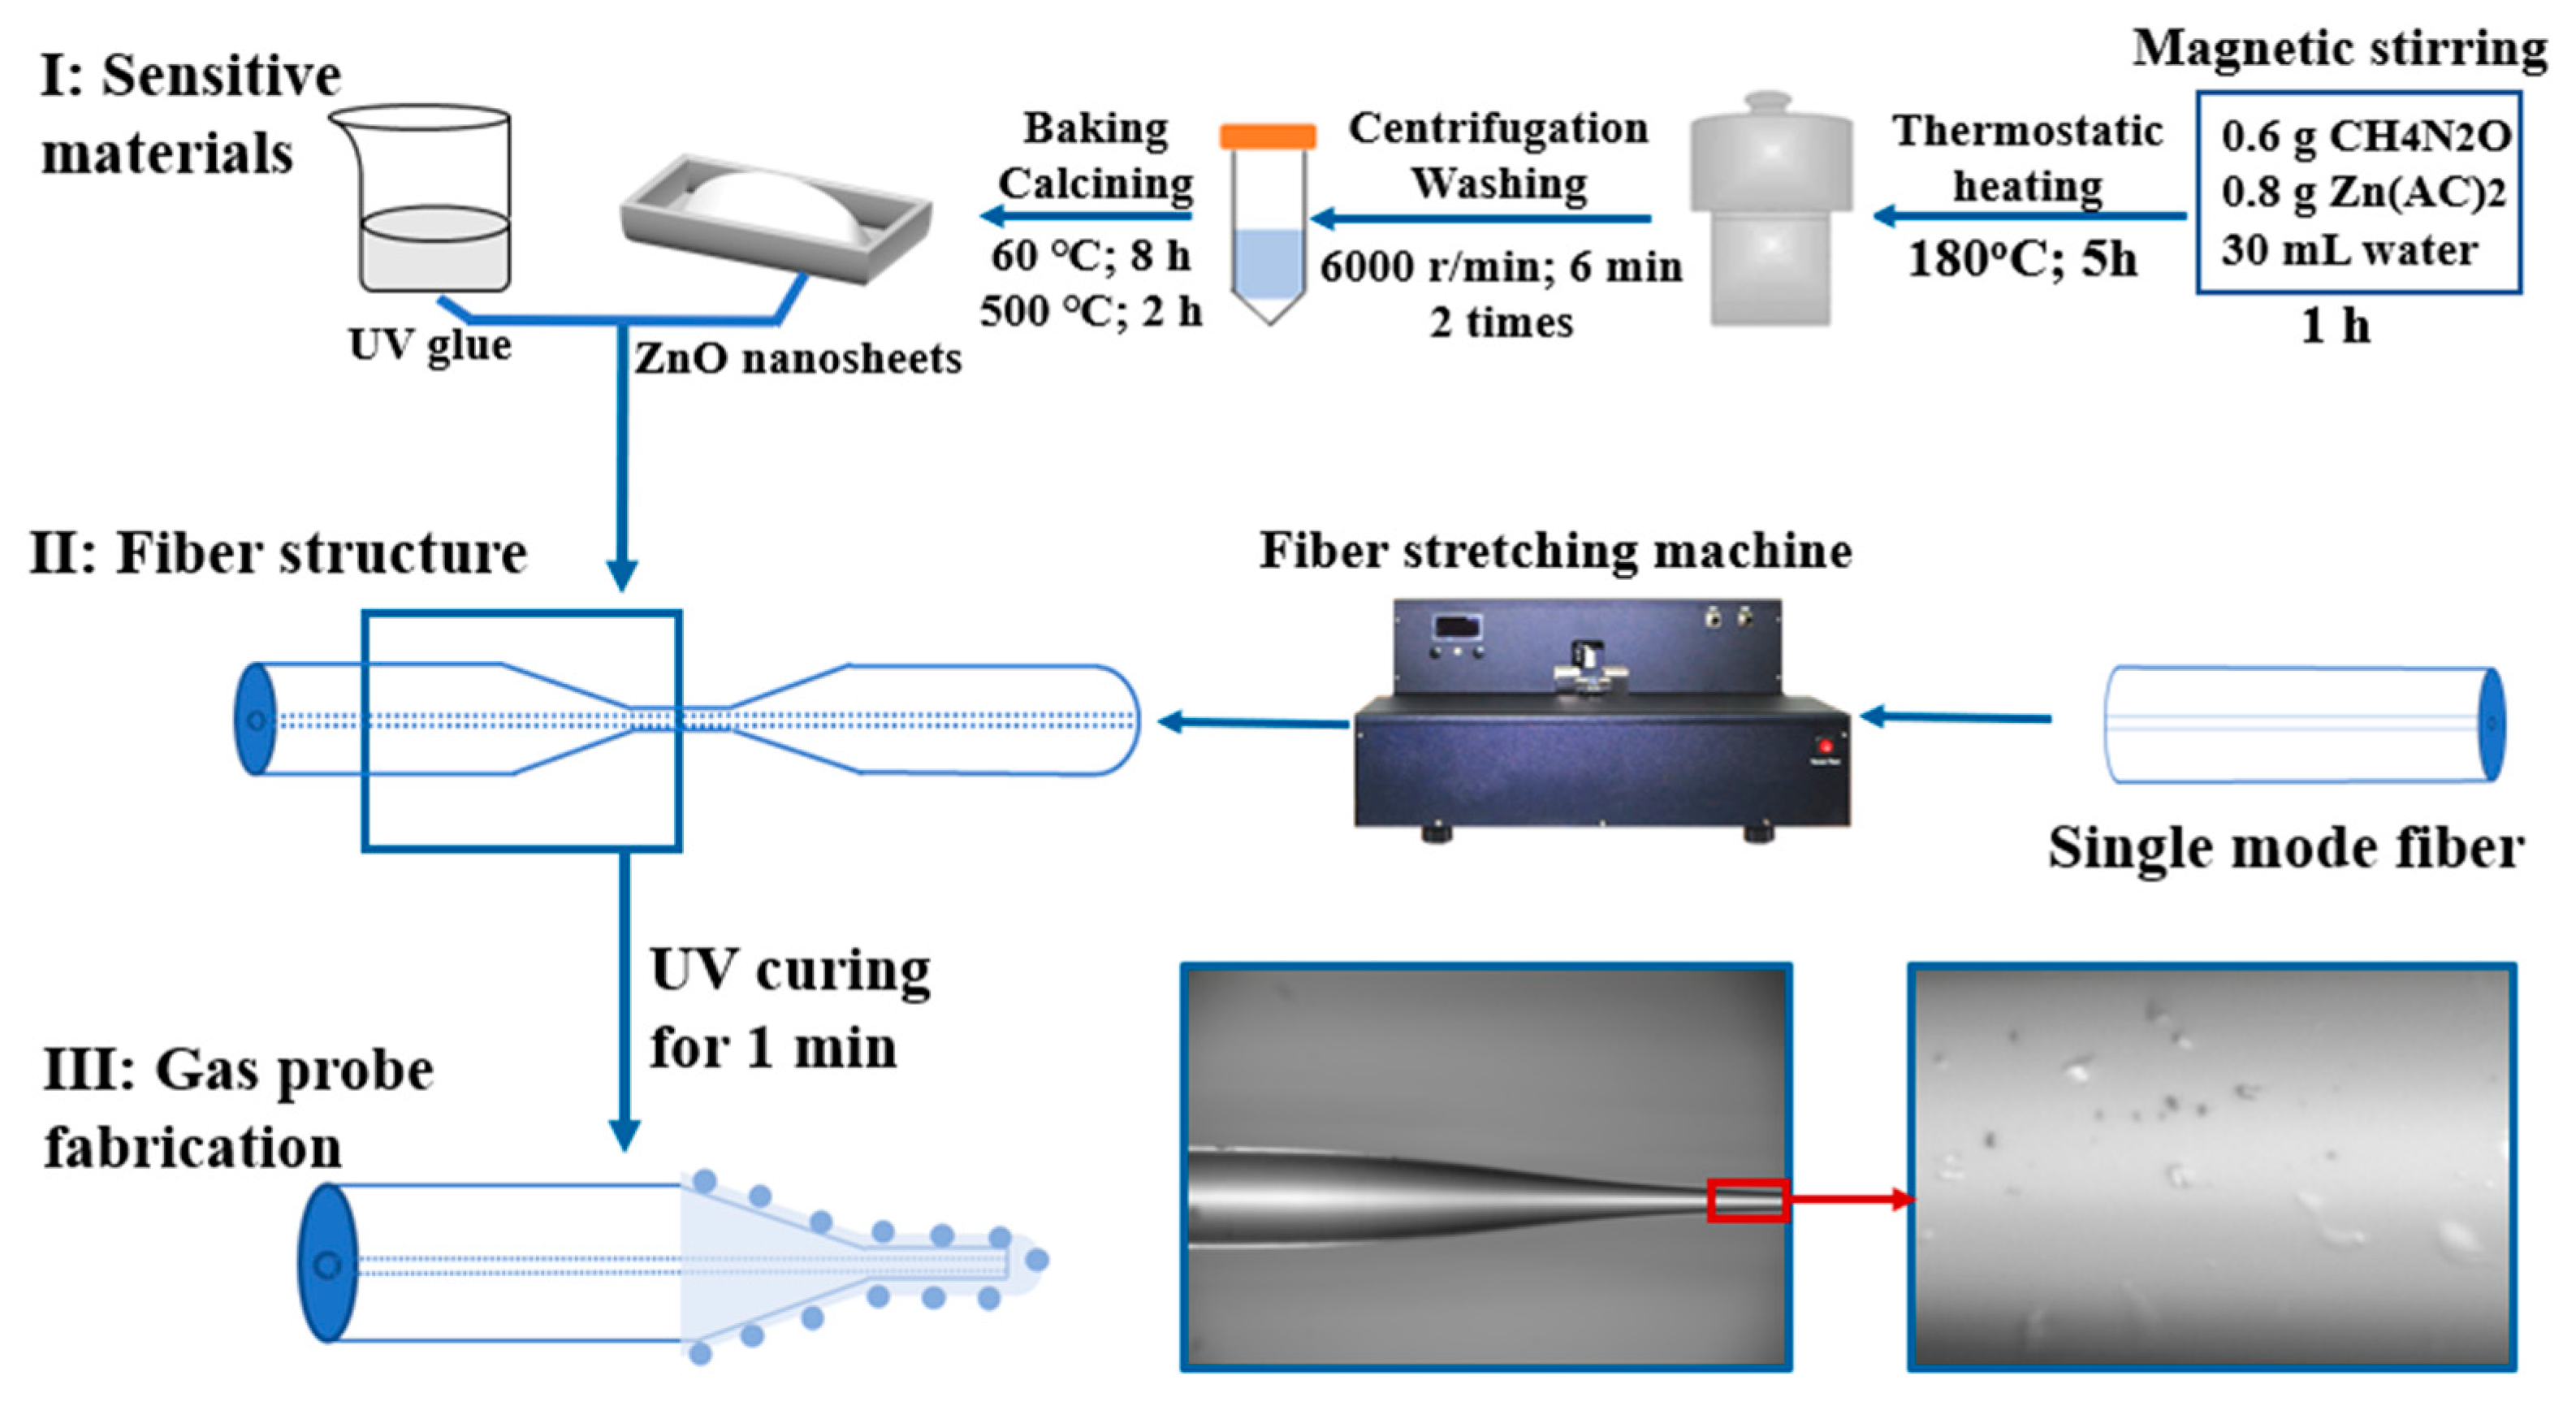
Microfiber taper reflective ethanol probes were fabricated following three steps, as shown in
Figure 1, which are the preparation of sensitive materials; the design of the fiber structure; and the fabrication of the gas probe.
2.1. Preparation of Sensitive Materials
The water thermal method was used to prepare ZnO nanosheets; 0.6 g CH4N2O and 0.8 G Zn(AC)2 were dissolved in 30 mL ultra-pure water and magnetic-stirred for 1 h. The colorless clarification solution thus obtained was placed in a high-pressure reactor, which was continually heated in a dryer at a temperature of 180 °C for 5 h and cooled down to room temperature naturally. In this way, a mixed solution containing white precipitation was obtained. The mixed solution was poured into a 50 mL centrifugal tube and centrifuged for 6 min at a speed of 6000 r/min. The clean upper liquid was removed to keep the lower layer of precipitation. Then the same volume of ultra-pure water was added and ultrasound-dispersed. This process was repeated 2 times. Subsequently, the ultra-pure water was replaced by anhydrous alcohol to repeat the centrifuging and removing process to obtain a white precipitate. The white precipitate was placed in an evaporator dish and heated at 60 °C in a dryer for 8 h to obtain the white powder. The white powder was ground in a mortar at a fixed speed. It was placed into a porcelain boat, heated to 500 °C at 2 °C/min and maintained for 2 h to obtain white ZnO nanosheets.
Low-refractive index UV glue (NOA1315, US Norland Company, New York, NY, USA, refractive index: 1.315) was used to disperse the ZnO nanosheets. The major difference in the refractive index compared to single-mode fiber (SMF) of 1.4682 results in small light loss. UV glue can uniformly and tightly stick the ZnO nanosheets on the outer surface of the optical fiber structure. UV glue is not sensitive to ethanol gas and can effectively reduce the impact of the main doping polymer. The sensor performance of ZnO nanosheets can be demonstrated more clearly.
2.2. Preparation of Optical Fiber Structure
General SMF can be used to prepare the microfiber taper structure by the heating, melting, and stretching method [
39]. Microfiber tapers were prepared by a two-step method using a fiber splicer and fiber stretching machine. First, the coating layer of SMF (G652D, Yangtze Optical Fibre and Cable Joint Stock Limited Company, Wuhan, China, cladding diameter: ~125 μm, core diameter: ~9 μm) was removed and pre-processed using a fiber splicer (S178, Furukawa Electric Cor., Tokyo, Japan). Under the high temperature of the arc discharging process, the internal stress in the radial direction of the fixed optical fiber is released when the processing region becomes soft. Therefore, the diameter of the optical fiber in the heated area is reduced slightly. In this work, the arc discharging operations were repeated three times. Then the waist diameter was reduced to ~100 μm compared to the initial 125 μm for the SMF. This fiber cone was transferred and fixed in a multi-function fiber-stretching machine (IPCS-5000-SMT, Idealphotonics Inc., Vancouver, BC, Canada). The temperature of the hydrogen and oxygen flame at the torch head can reach up to 1300 °C. The tapering region was heated and stretched simultaneously to prepare the microfiber taper. The waist diameter and tapering length could be flexibly controlled by the moving speed of the fixing motors and the scanning area of the heating torch. Because of the ultra-thin diameter of the microfiber taper at its waist region, light signals could escape from the micron-scale microfiber and reach its surrounding environment in the form of evanescent waves. It could efficiently sense small changes (which are usually transferred into the effective refractive index change of fiber sensors) in the external environment. Finally, the microfiber cone with its uniform thin diameter of ~2 μm was fabricated and cut in the middle to obtain a microfiber taper structure with a long tail.
When the sensitive material was uniformly applied to the outside of the microfiber taper, the sensing area is thus obtained and exposed to gas molecules. The effective refractive index of the coating layer will be different due to the concentration fluctuation of ethanol gas, where the intensity of the reflected light will change. The cone waist region acts as the most sensitive area of the microfiber dual-taper structure. It is only a few microns in diameter and can support strong evanescent waves. The interface efficiency of the light signal and gas molecules near the cone waist area will determine the quality of reflection spectrum and sensing performance.
2.3. Augmentation of Sensitive Materials
The dip-coating method is suitable for applying liquid material onto solid surfaces. There are two reasons for choosing manual dip-coating instead of automatic. One is the very low viscosity of UV glue (15 cps, Norland1315, Norland Products, Inc., Jamesburg, NJ, USA), in which the ZnO nanosheets were dispersed settled easily. The solid ZnO nanosheets were easily condensed and gathered during the interval of the raising, lowering, and immersion process of the pulling coater machine (SYDC-100, Shanghai Sanyan Technology Co., Ltd., Shanghai, China). The viscosity of sensitive materials needs to be carefully controlled according to different coating methods. If the pulling speed is too low for high-viscosity liquid materials, excessive sensitive materials will block the light signal from reaching the external detection environment. Conversely, if the viscosity of sensitive materials is low, the lifting speed should be increased to ensure the attachment of sufficient sensitive materials.
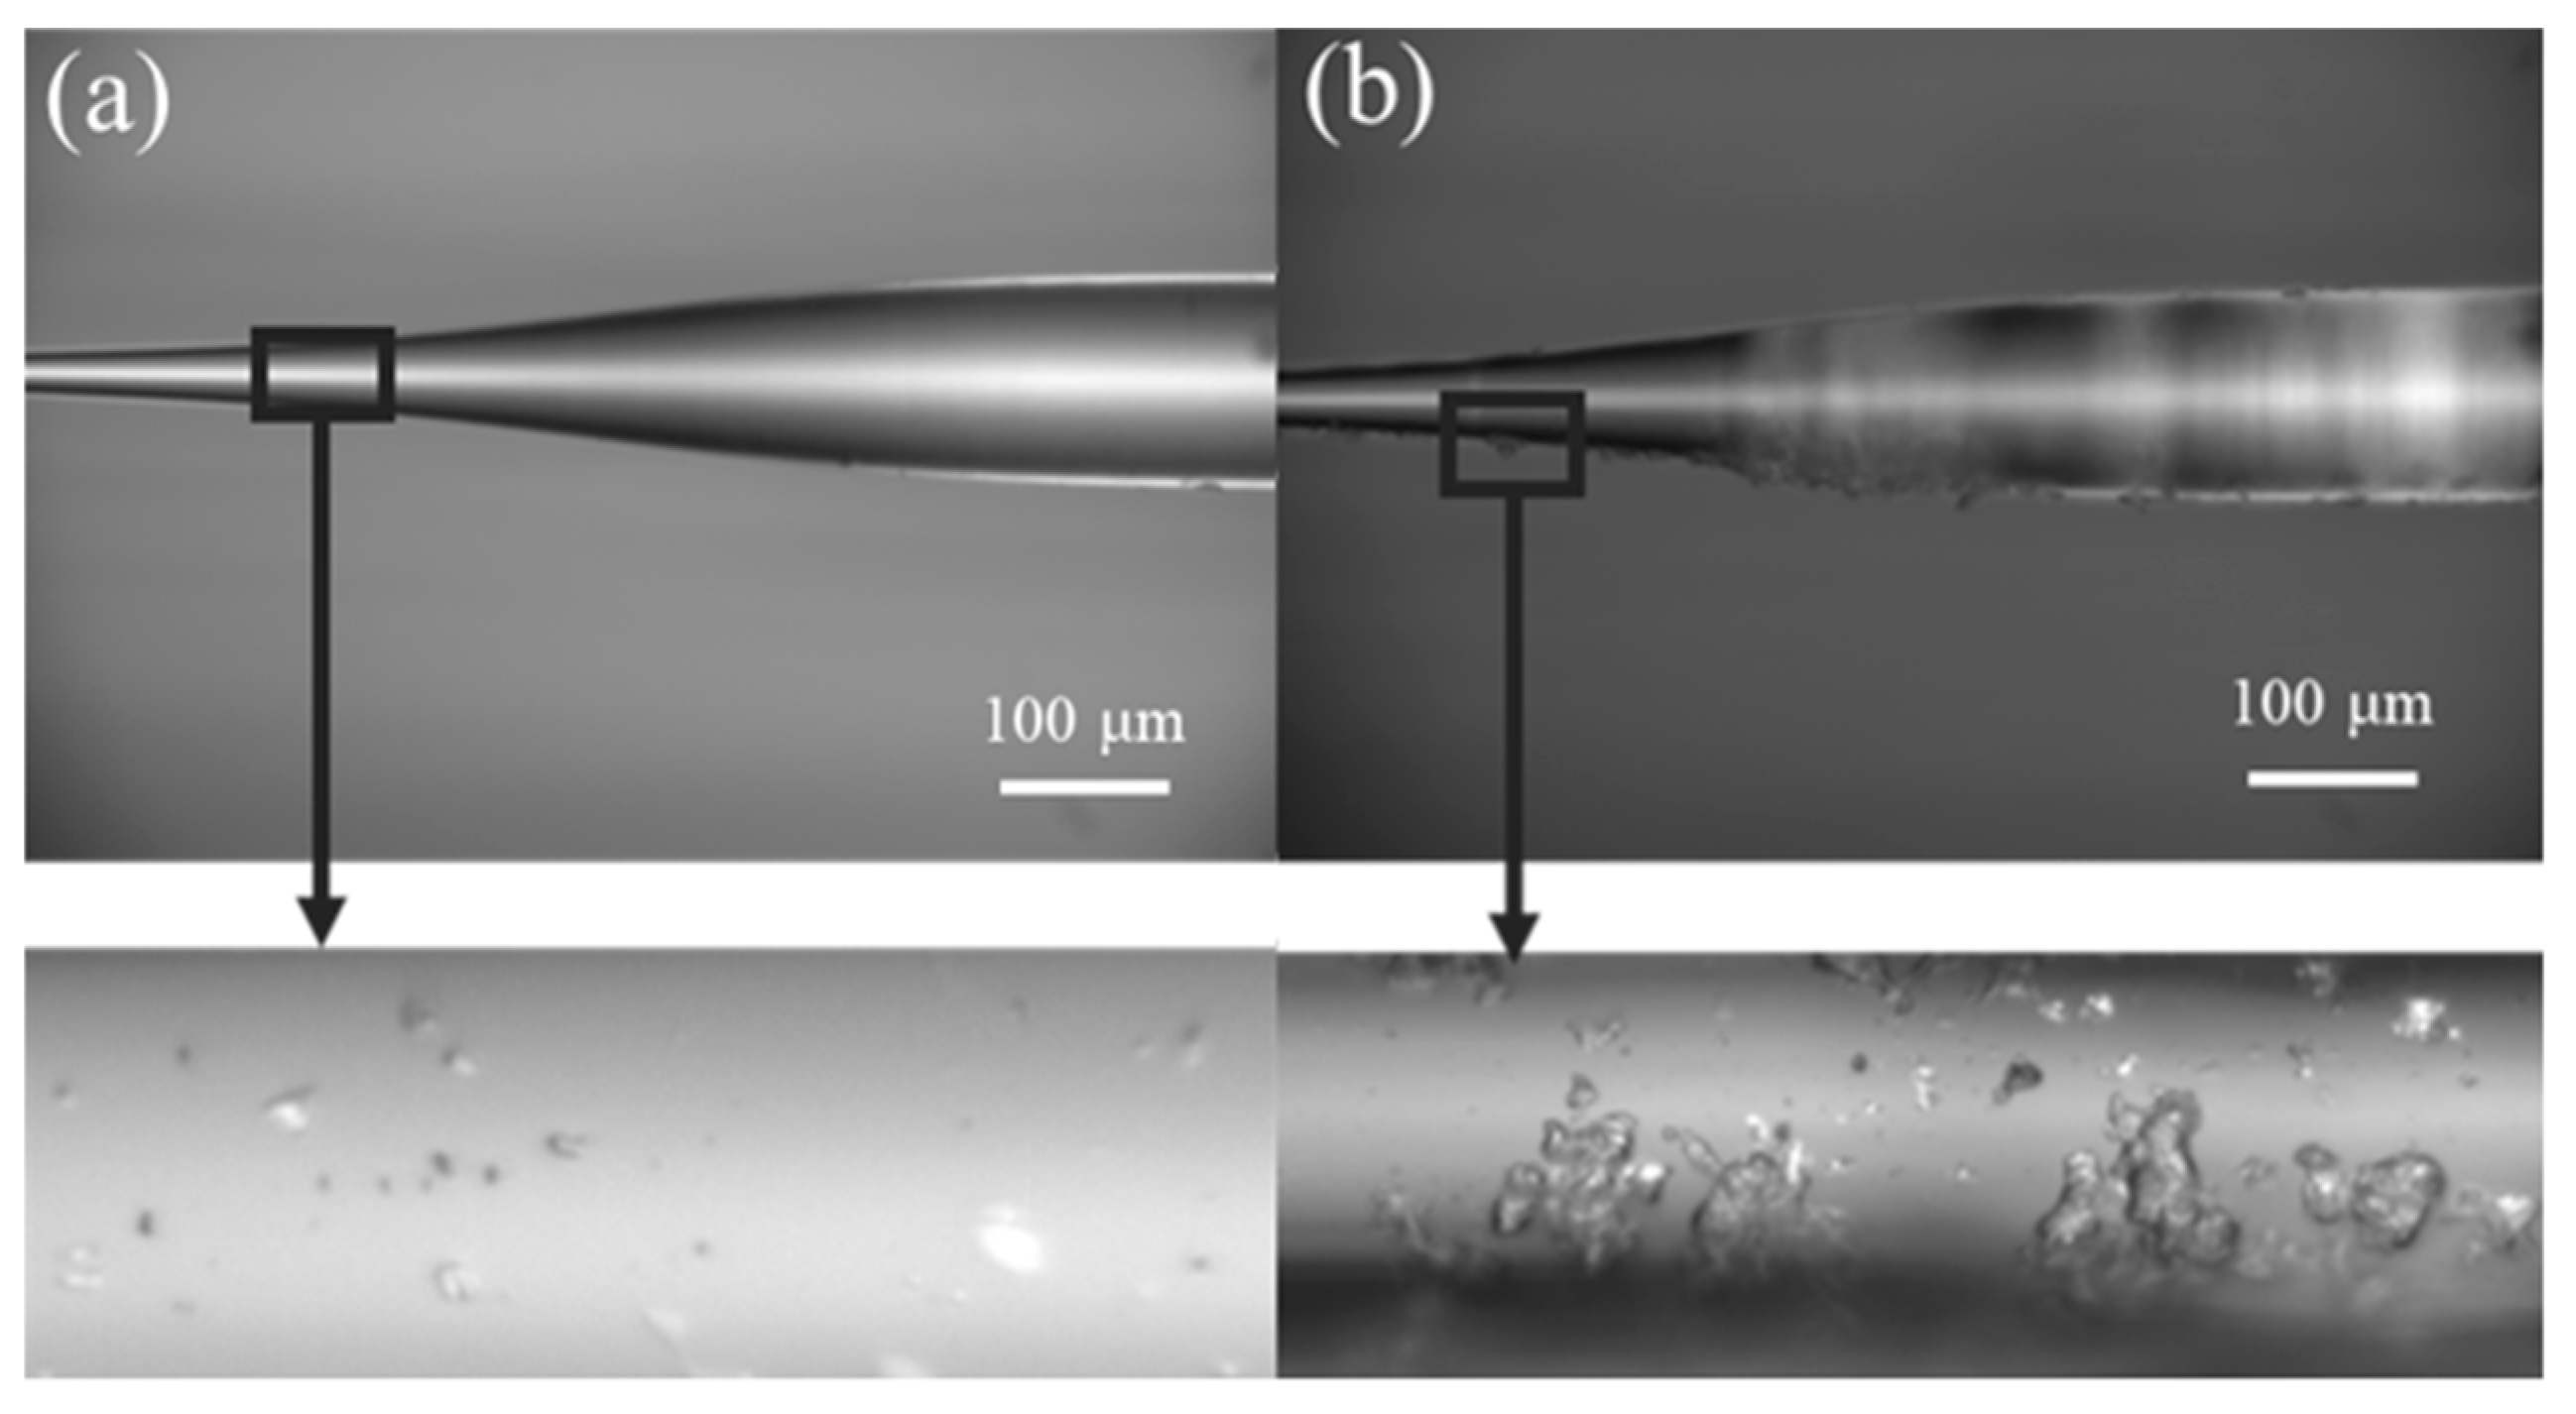
Due to the slow lifting speed of the pulling coater machine, sensitive materials attached to the outer surface of the prepared microfiber probe cannot be observed under the microscope to ensure the effective augmentation by ZnO nanosheets. We have tried our best to optimize the viscosity of the coating mixture by changing the doping amount of ZnO nanosheets in the UV glue to 500 μL. Furthermore, a high-magnification biological microscope was used to determine the quality of the coating film. To uniformly distribute the ZnO/UV glue mixture on the microfiber taper, the long tail of the microfiber taper was immersed in the sensitive materials mixture, where it remained for 5 s before being pulled out. Then ultraviolet light was used to illuminate the coated ZnO/UV glue sensitive film for 1 min to solidify it, so as to obtain the microfiber taper sensor. The final prepared microfiber taper probe is shown in
Figure 2a. Once a clean morphology surface verified that 5 mg of ZnO nanosheets were attached and dispersed evenly on the outer surface of the microfiber taper, covering both the microfiber taper and transition taper region. As the diameter was reduced along the transition taper region, the fiber core inside the SMF also became thinner. Therefore, more light signals would escape and enter the cladding layer. For the proposed microfiber taper, the coating materials outside the microfiber taper and the nearby tapering region with a thin diameter would contribute to sensitivity improvement. A localized magnified micrograph revealed that some solid materials (ZnO nanosheets) were fixed to the outer surface of the microfiber taper. To compare coating performance, a higher doping ratio of ZnO nanosheets (10 mg) was used, and the corresponding result is illustrated in
Figure 2b.
In
Figure 2, the two microfiber tapers were inspected and the obvious attachment of ZnO nanosheets to their outer surface was observed. However, in
Figure 2b, the 10 mg of ZnO nanosheets seriously gathered, showing a large particle shape, which may cause undesired optical scattering effects, thereby affecting the optical performance and sensitivity of the microfiber probe.
3. Experimental System Construction
The experimental system for sensing ethanol consists of a light source, a spectrometer, and a gas chamber, as shown in
Figure 3.
The light was supplied by an amplified spontaneous emitter (ASE, KG-ASE-CL, ASE-C, Shenzhen Golight Technology Co., Ltd., Shenzhen, China, operating wavelength: 1528–1603 nm; output power: 1–20 mW). An optical spectrum analyzer (OSA, AQ6370D, Yokogawa Electric Cor., Musashino, Japan, detection wavelength: 1200–1650 nm; resolution: 0.02 nm) was used to observe and record the phase and intensity changes of the reflected spectrum. The light signal from the ASE light source was directed into the microfiber probe; the reflected light entered the circulator, exited via another port, and was sent into the OSA to record the real-time spectra.
The microfiber probe was fixed in a homemade gas chamber, in which differing concentrations of ethanol gas were supplied by adjusting the input volume of ethanol and air. The volume of the homemade gas chamber was 2 L. It had an air intake port (after the gas measuring process, the synthetic air would be introduced through this port to clean the whole chamber) and an outlet port (used for discharging the exhaust gas). In addition, another inlet was created to inject ethanol gas. During the sensing performance experiment, the microfiber probe was usually fixed on a glass substrate to reduce the effect of air disturbance before it was placed in the gas chamber.
4. Ethanol Sensing Characteristics and Influencing Factors Analysis
In order to study the effects of ZnO nanosheet content in the film layer on sensing performance, 5 mg and 10 mg of ZnO nanosheets, respectively, were doped into sensitive materials to prepare the microfiber ethanol sensors. Their corresponding reflected spectra as a function of the ethanol concentration during 0–200 ppm can be respectively found in
Figure 4 and
Figure 5.
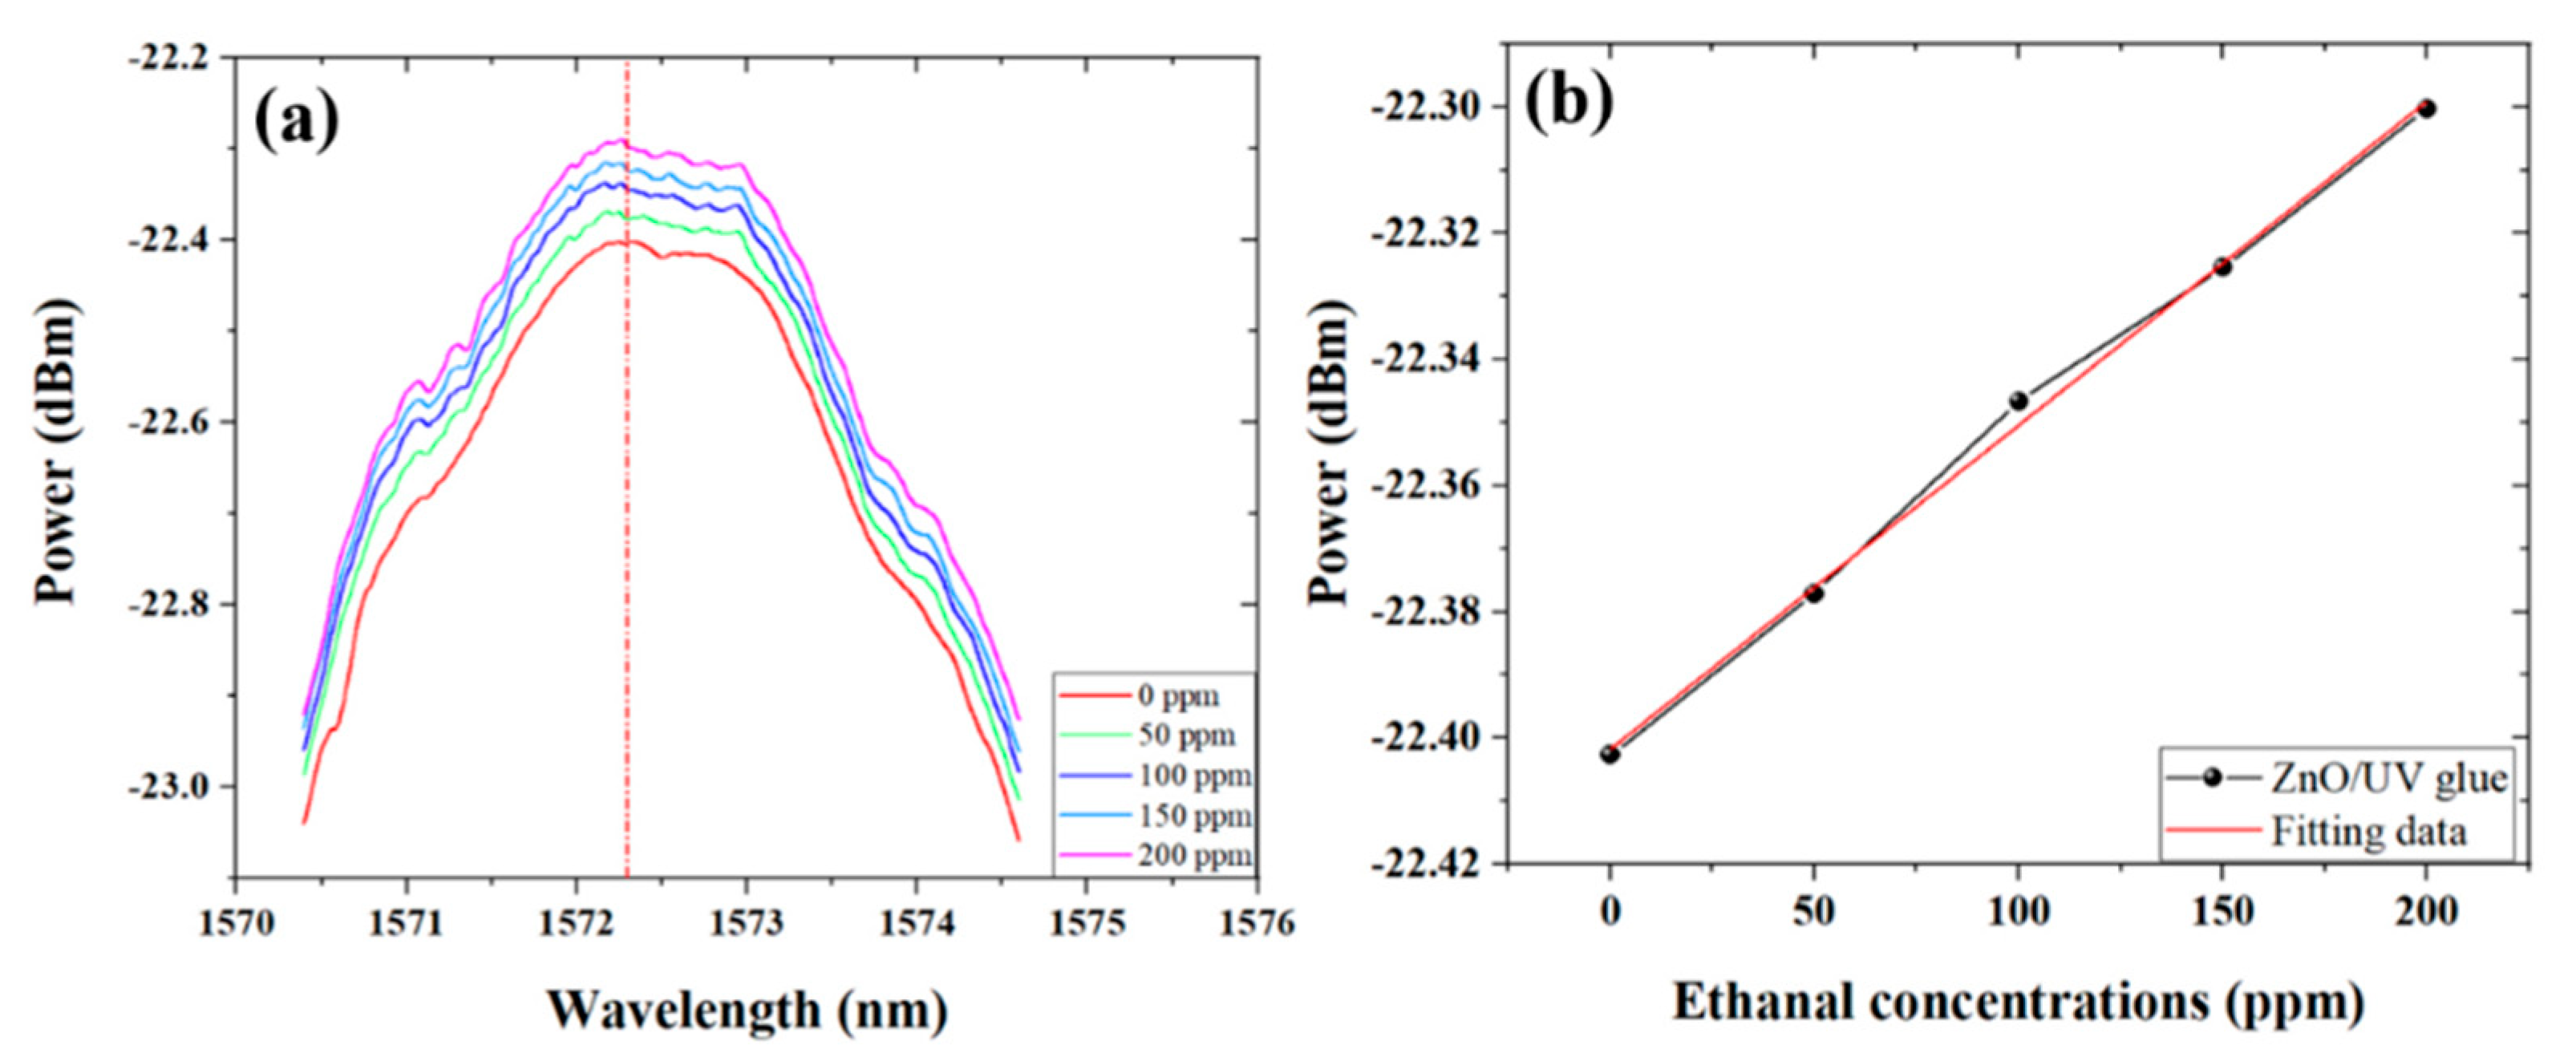
In the experiment, 0–200 ppm ethanol gas was injected into the gas chamber with an interval step of 50 ppm. As the concentration of ethanol gas increased, the reflected spectrum gradually increased from 1528–1603 nm. In
Figure 4a, one can determine the ethanol concentration by tracing the power change at the peak location 1572.32 nm (depicted as the red dot-line in
Figure 4a). The power of the reflected spectrum increased by 0.10243 dBm as the concentration increased to 200 ppm, revealing a sensitivity of 7.28 × 10
−4 dBm/ppm. The wavelength shift was also observed in the spectra, which is caused by the contribution of the interference effect near the tapering region, where the lower optical mode inside the fiber core and the higher optical modes outside the fiber surface (in the form of an evanescent field) can produce the interference effect, whose phase would be affected by the surrounding environment change, resulting in the wavelength shift in the spectra. The experimental data near 1572.32 nm is linearly fitted, as shown in
Figure 4b. It was found that the sensor spectrum intensity proportionally changes as a function of ethanol gas concentration with an excellent linearity of 0.99728.
It can be seen from
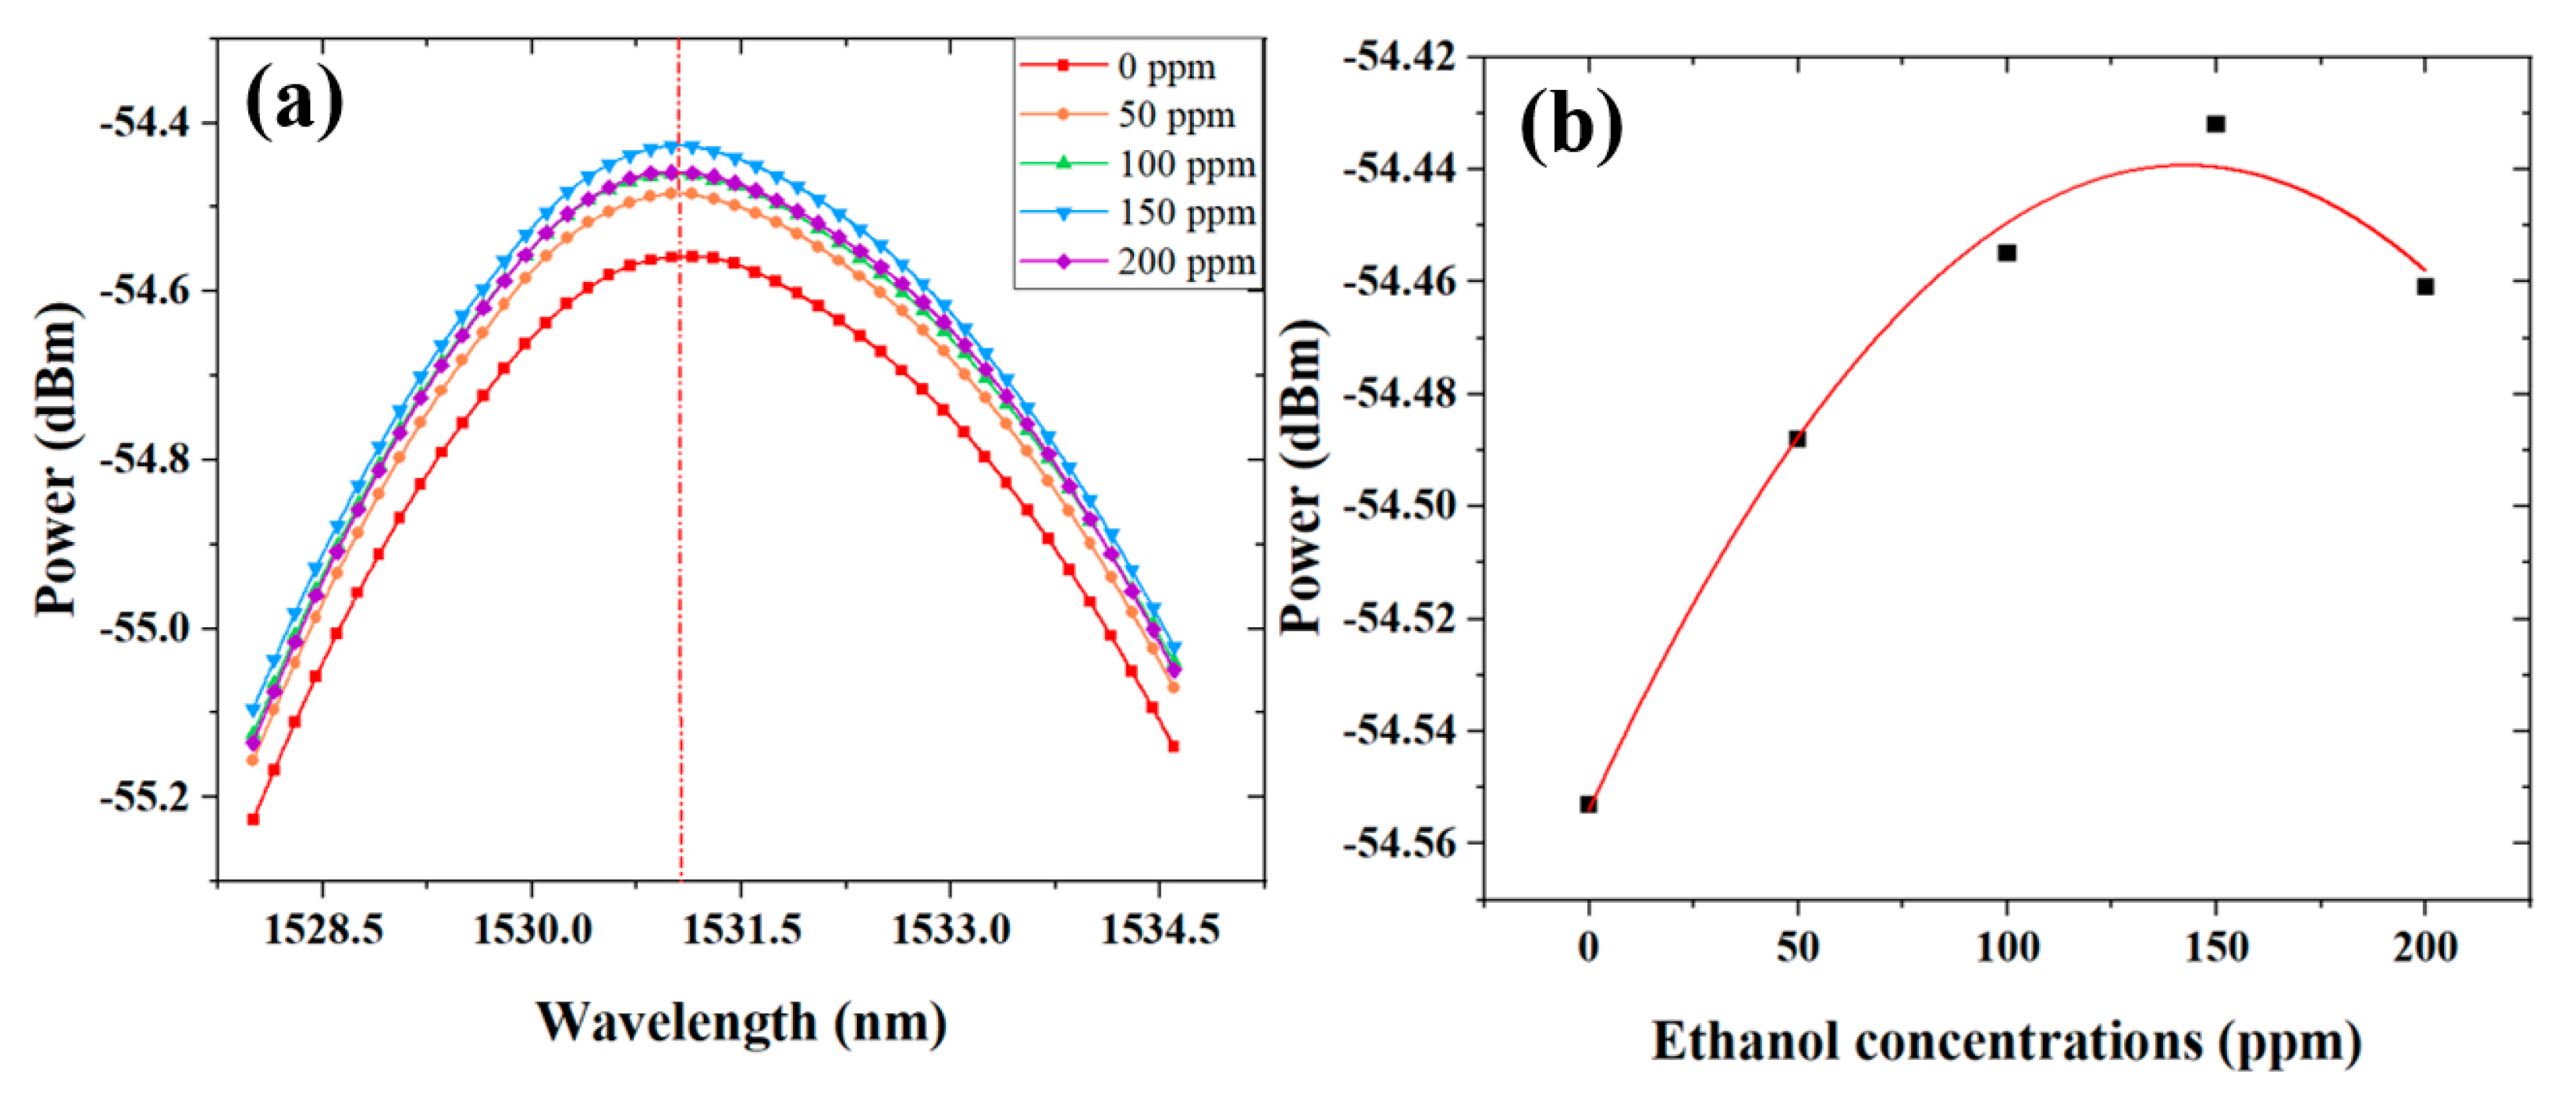
Figure 5a that when the content of ZnO nanosheets is 10 mg, the spectrum intensity becomes higher and then lower without the linear dependent relationship. Moreover, the highest intensity is about −54.4 dBm, revealing major light loss. This can be attributed to the major scattering of the optical signal on the outer surface of the optical fiber structure, where ZnO nanosheets became clusters in the sensitive material film layer. The functional mechanism for all kinds of optical fiber sensors can be explained by changes in effective refractive index either for the material-free fiber structure or thermal–optical, elastic–optical, or selective absorption effects of sensitive materials. The sensing characteristics in
Figure 5b match the nonlinearly fitting curve, which can be attributed to the balance between the optical power increase inside the microfiber taper and the optical scattering loss at the microfiber–material interface. The equivalent refractive index of the sensitive material film increases with the concentration of ethanol gas, which reduces the proportion of the evanescent field outside the microfiber taper and increases the reflected light power, similar to the calculated results in
Figure 4b. The excessive coating layers irregularly distributed on the surface of the optical fiber can cause major scattering near the micro-particles or cluster-forming materials. Therefore, the light intensity loss can be observed in the reflected spectra at the wavelength location near ~1531 nm (depicted as the red dot-line in
Figure 5a). The corresponding light intensity change as a function of ethanol concentration from 0–200 ppm is illustrated in
Figure 5b.
By comparing and discussing these two series of experimental results, it can be concluded that when the content of ZnO nanosheets is 5 mg, the response spectra illustrate higher quality and better performance for ethanol. When the ethanol concentration increases from 0 ppm to 200 ppm, the intensity of the reflected spectrum is located near −22.3 dBm and is enhanced by a better linearity. This intensity is significantly higher than that of the 10 mg case.
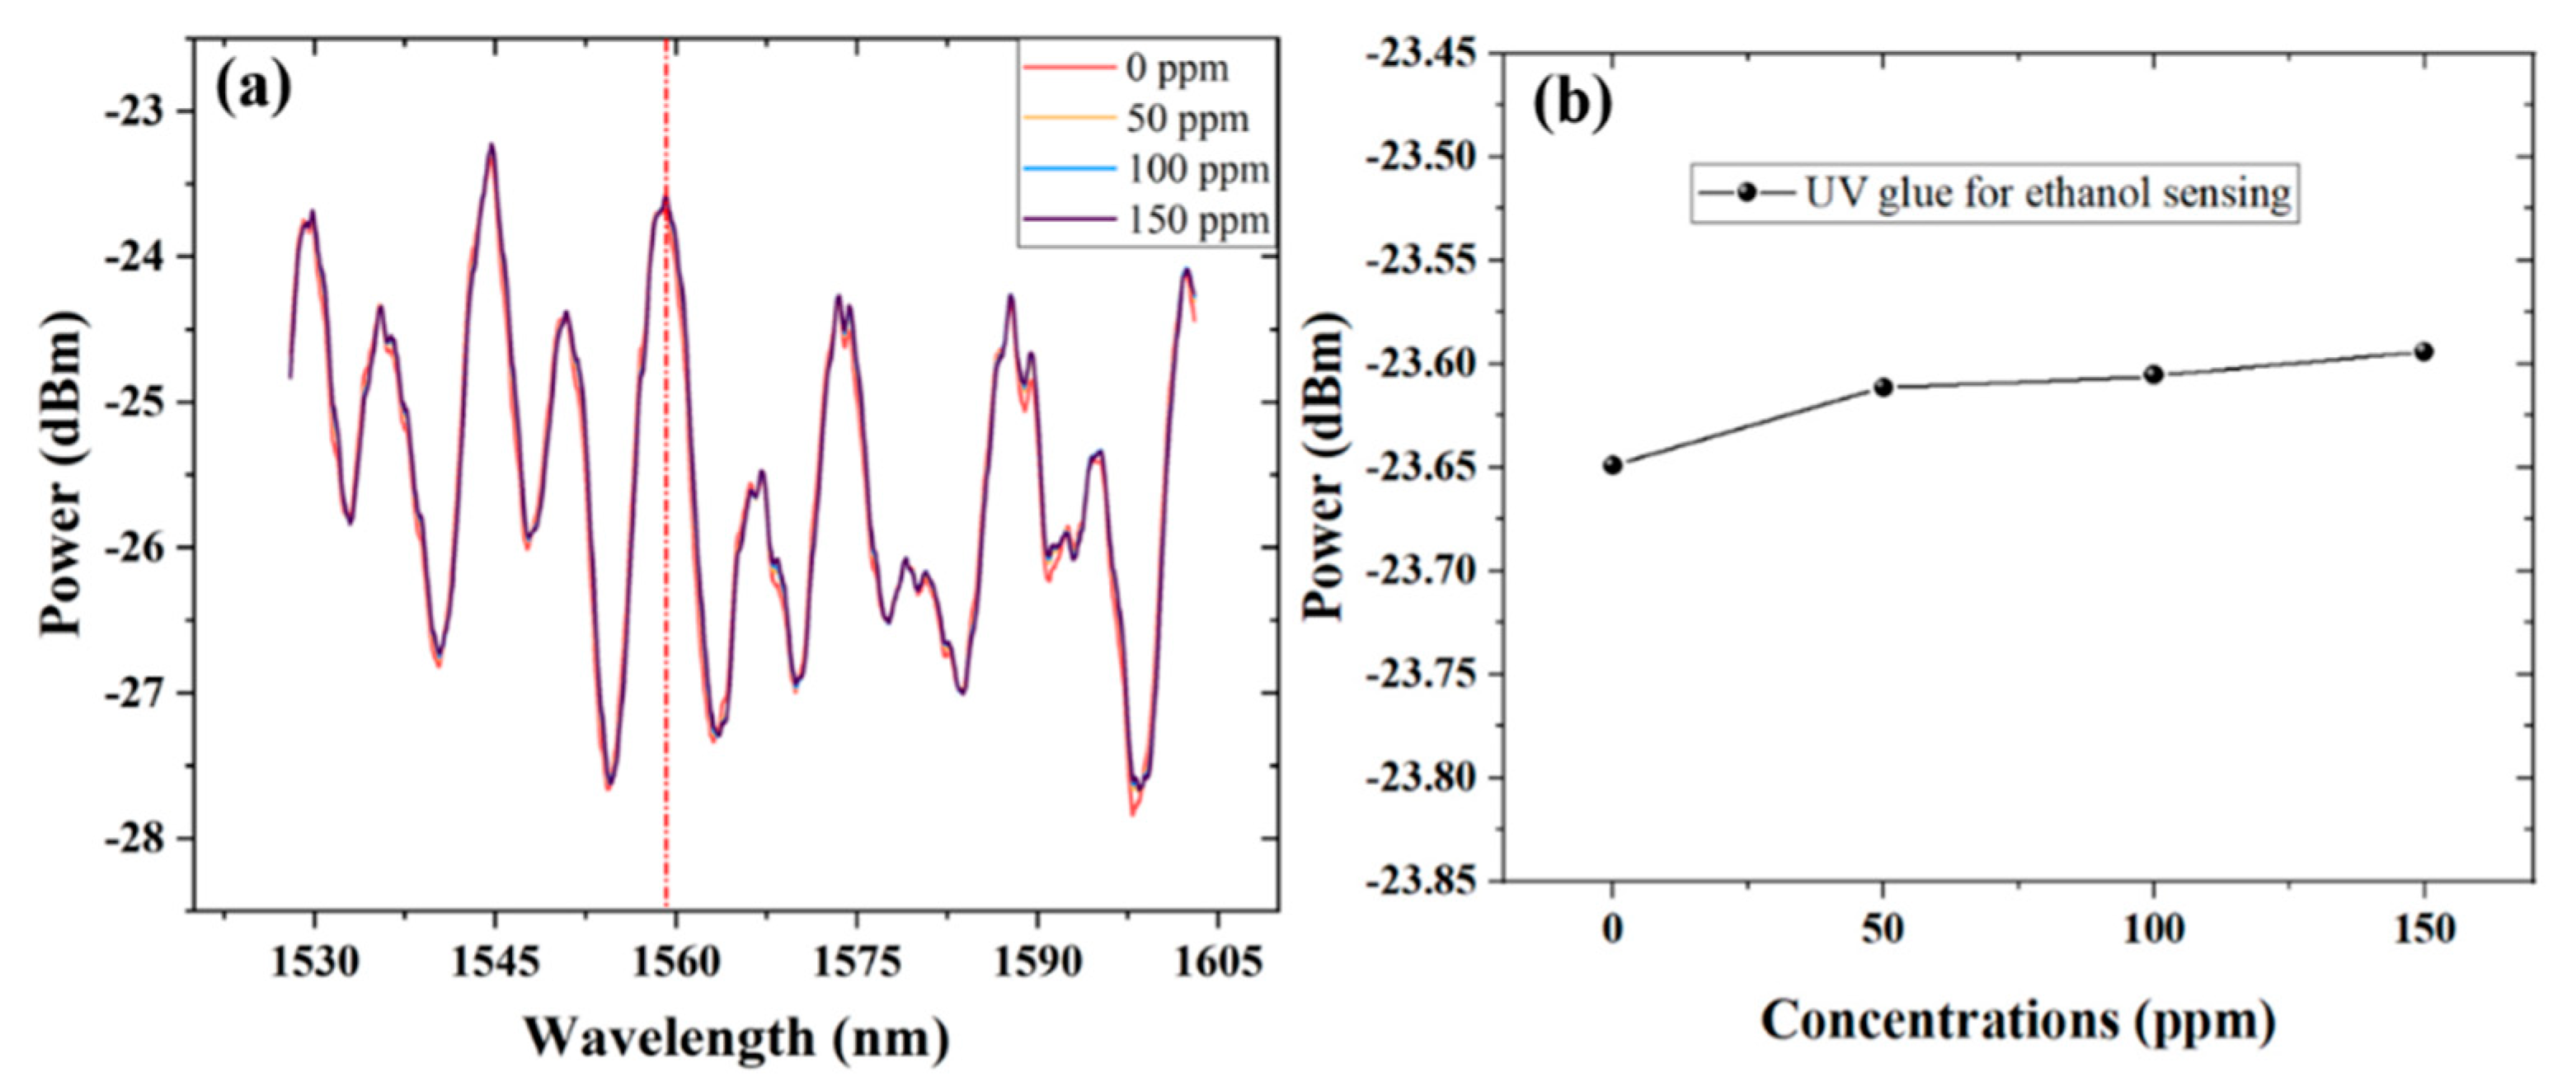
In this paper, the sensitive material film layer contains two materials, ZnO nanosheets and low-refractive index UV glue, either of which may affect sensing performance, especially for selectivity and sensitivity. To eliminate the effects of UV glue on sensing performance for ethanol concentration, pure UV glue without ZnO nanosheets was applied directly to a similar microfiber taper. The experimental results for its response to ethanol are verified in
Figure 6.
Figure 6a shows the changes in the reflective spectrum of the microfiber taper coated with pure UV glue as a function of the 0–150 ppm concentration of ethanol gas. The reflected power at the selected peak near ~1559 nm (depicted by the red dot-line in
Figure 6a) is traced and demodulated. The corresponding power intensities at the different ethanol concentrations from 0 ppm to 150 ppm are illustrated in
Figure 6b. Due to a common property of macromolecular polymers, the gaps in the molecular structure would be filled by gas molecules, which would cause sudden changes in light power. This phenomenon can be illustrated by comparing the corresponding power intensities of the 0 ppm and 50 ppm concentrations of ethanol gas. Later, no obvious change was observed during the concentration-increasing process. Therefore, the effect of low-refractive UV glue on ethanol-sensing performance can be excluded. ZnO nanosheets play the main role in the film treated with the sensitivity-augmenting mixture.
5. Selection of Optical Fiber Structure
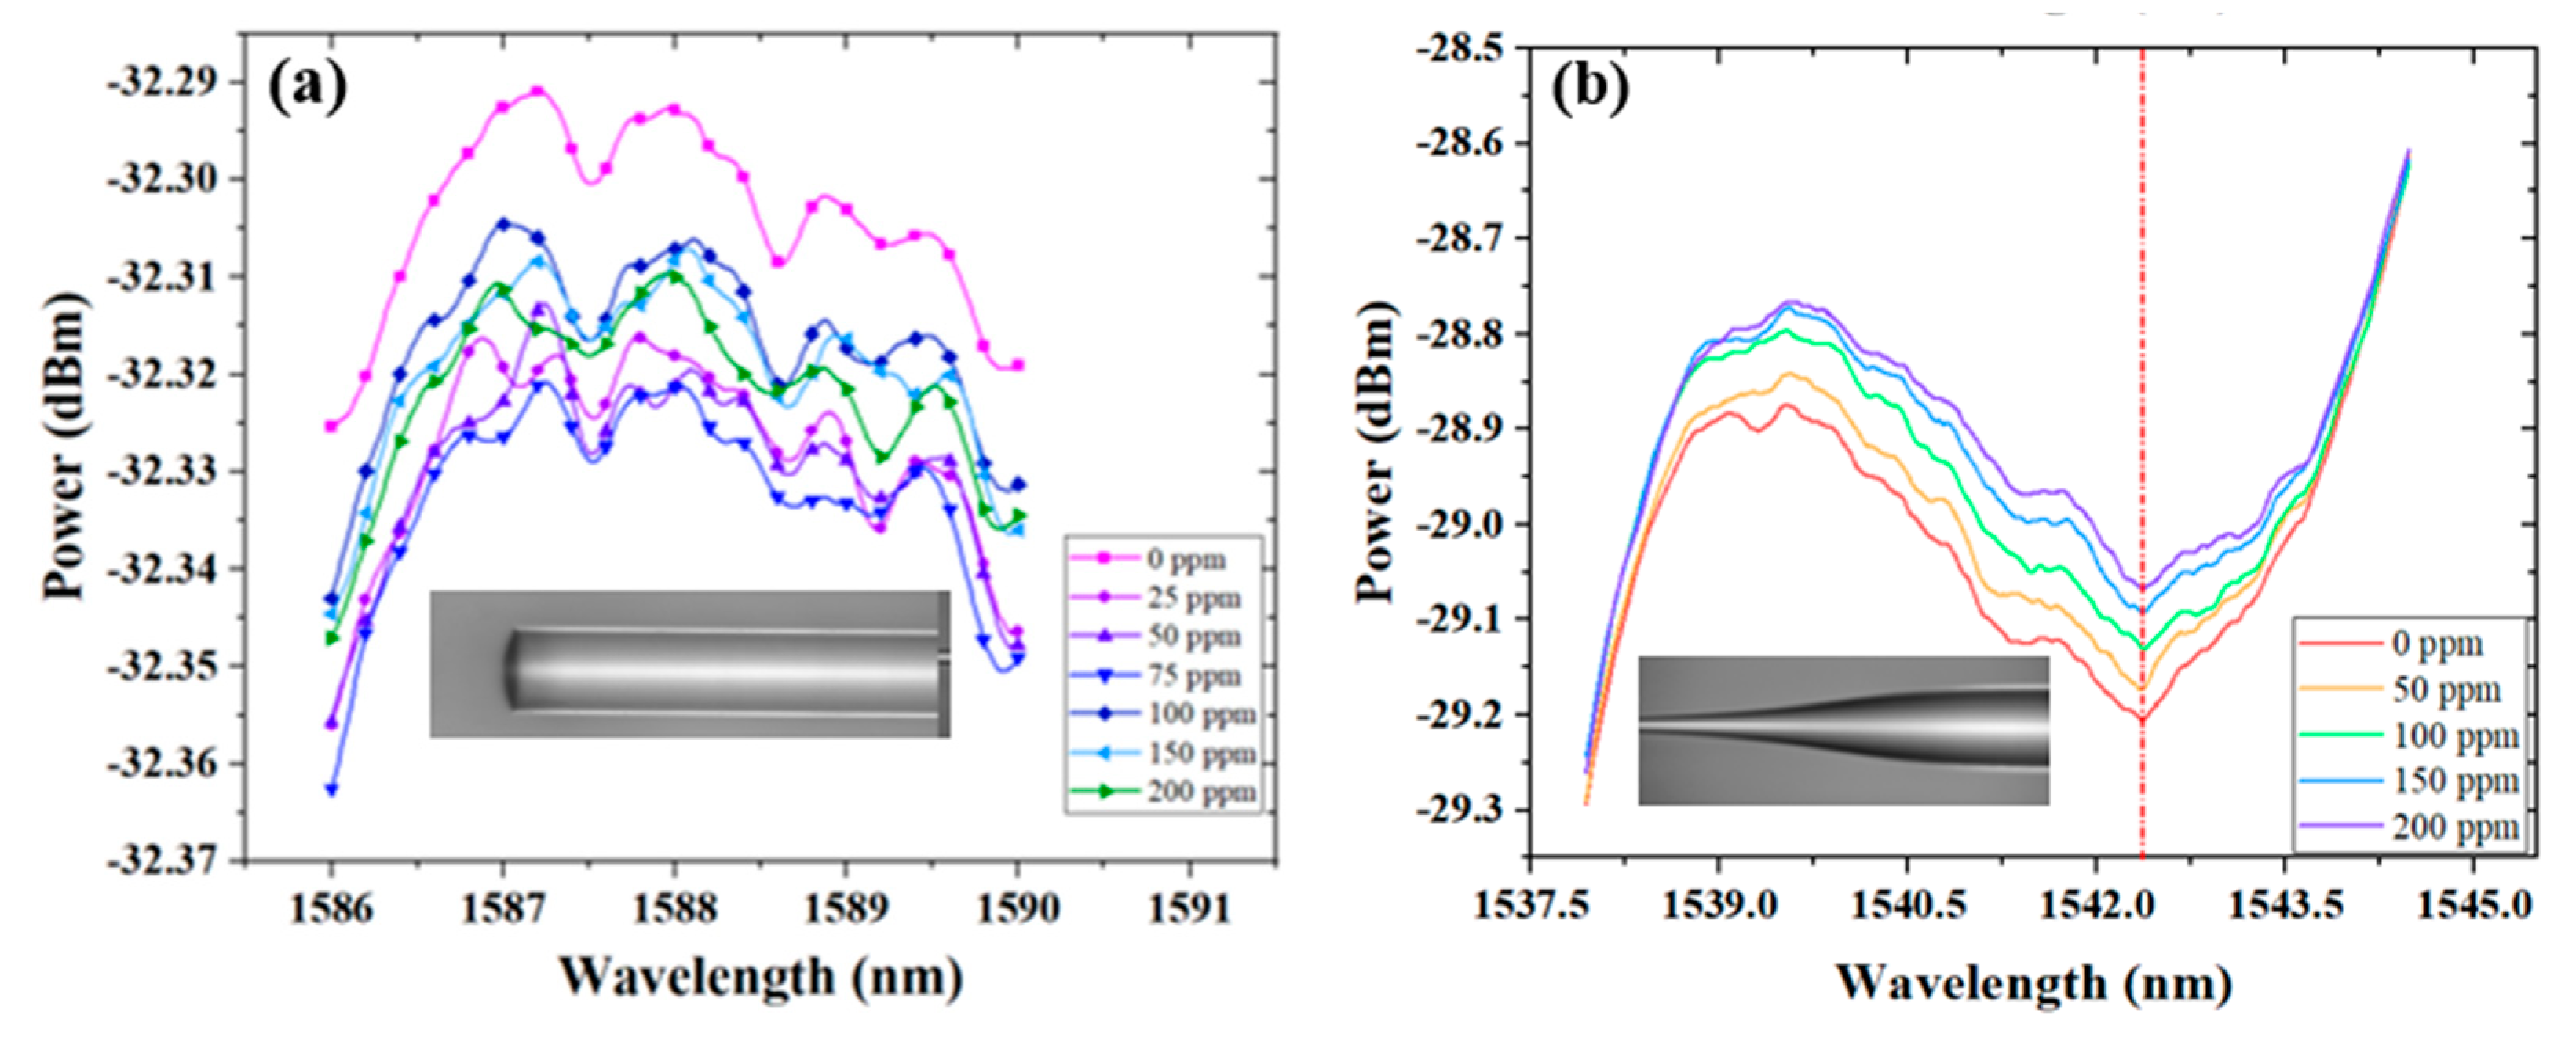
In order to verify the impact of the morphology of the end-face of the fiber structure on sensing performance, an ordinary SMF with a flatted end and a tapered end were made and coated with the ZnO/UV glue film. The response spectrum for the different concentrations of ethanol gas is shown in
Figure 7.
Figure 7a is the response spectrum of an SMF probe. As the concentration of ethanol gas increases from 0 ppm to 200 ppm, the spectral intensity changes little and irregularly, and so the fluctuations can be ignored (<0.03 dBm). The experimental results of the microfiber taper produced from the same SMF is shown in
Figure 7b. Its response to ethanol gas is relatively obvious. With the concentration increase of ethanol gas, the intensity of the reflection spectra has gradually increased (>0.13 dBm). The relationship between spectral intensity and ethanol gas concentration shows a significant steady characteristic, compared to the random fluctuation in
Figure 7a.
The sensing performances of gas sensors based on different optical fiber and sensitive materials have been compared in
Table 1. These optical fiber sensors had different fibers, such as multimode fiber (MMF), poly-methyl methacrylate (PMMA) MMF, and hollow core fiber (HCF); different structures, such as the SMF end-tip in a Fabry–Perot interferometer (FPI) and microfiber taper (tapered fiber); and different materials.
Some novel techniques have also been introduced to improve sensing performance. For example, production repeatability could be significantly improved in Refs. [
33,
34]. by using chemical methods where sensitive materials could be chemically grown on the outer surface of PMMA MMF which was pre-cleaned with acetone. Optical fiber interferometers will be an excellent choice to improve the sensitivity and stability of fiber gas sensors.


