Article

Numerical Simulation of a Light Field Structure in an Integrating Sphere via the Monte Carlo Method

1
Shirshov Institute of Oceanology of the Russian Academy of Sciences, 117997 Moscow, Russia
2
Moscow Institute of Physics and Technology, 141700 Dolgoprudny, Russia
3
Biological Department, Moscow State University, 119991 Moscow, Russia
*
Author to whom correspondence should be addressed.
Photonics 2023, 10(5), 593; https://doi.org/10.3390/photonics10050593
Submission received: 3 April 2023 / Revised: 15 May 2023 / Accepted: 16 May 2023 / Published: 19 May 2023
(This article belongs to the Special Issue Women’s Special Issue Series: Photonics)

Abstract

:
The integrated cavity absorption meter is designed to measure the seawater absorption coefficient spectra which are necessary for studying ocean productivity and heat balance. The performed numerical simulations of a light field structure made it possible to improve the measurement technique. Its results showed that the use of the Lambertian model allows to reduce the calculation time by two orders of magnitude with an acceptable loss of accuracy for these calculations. It is shown that in the case of an integrating sphere made of fluorilon, the use of different volume scattering functions does not affect the calculation result, which is not true in the case of using a sphere with a mirror coating. The effect of an air layer between quartz and fluorilon is considered, and the applicability of the diffusion approximation is verified. Examples of field measurements of the seawater absorption coefficient and its components performed in different water areas of the World Ocean in 2020–2022 are presented.

1. Introduction

Information on the absorption of light by seawater makes it possible to determine the composition of seawater and the presence of optically active impurities in the form of solutions and suspensions [1,2,3]. The energy of absorbed light can be directed to a number of processes, from which we specify two of the most important: heating seawater and photosynthesis. The first process is important in the analysis of climate variability, which is especially important in the Arctic in connection with the manifestations of global warming [4,5]. It is important to note that the negative feedback mechanism between the ice cover area and the influx of solar radiation into the seawater column in the Arctic [6,7] makes the study of the parameters that determine the absorption of light by seawater even more relevant. Data on light absorption are also necessary for marine biology, in particular, to assess the available photosynthetically active radiation at different depths [8,9,10,11], calculation of ocean primary production [12], and assessment of the taxonomic composition of phytoplankton with the combination of its pigment [13,14,15], especially to detect massive toxic blooms [16,17].
The most accurate source of data on the spectral light absorption coefficient by seawater a(λ) are the results of direct determinations made during ship expeditions. Field measurements of a(λ) are possible with the help of integrating spheres [18,19,20,21], in which an isotropic light field is created due to multiple scattering from highly reflective walls, thereby eliminating the influence of scattering for absorbance measurement. Typically, such spheres are made of fluorilon (polytetrafluoroethylene), a porous material with an albedo above 0.99 in the wavelength range of 400–800 nm [22]. In the case of spherical symmetry (the light source is located in the center of the sphere, or its surface is uniformly illuminated from the outside), it is possible to obtain relatively simple analytical expressions for describing the parameters of the light field inside the integrating sphere [18,23]. Otherwise, it is necessary to use numerical methods, for instance, Monte Carlo [2]. Monte Carlo integrating sphere modeling is widely used not only in ocean optics but also in other areas, such as photometry [24], biomedicine [25], and even the food and agricultural domain [26].
In our work, the simulation was carried out for the existing ICAM (Integrated Cavity Absorption Meter) device [21], taking into account its following configuration: a quartz flask with a diameter of 86 mm (340 mL volume) filled with a seawater sample; fluorilon cavity with a wall thickness of more than 1 cm (Fluorilon 99-W™, Avian Technologies New London, CT, USA); the light source is located outside the sphere in the horizontal plane; the light guide is at an angle of 110 degrees to the source (Figure 1). This configuration does not allow obtaining an analytical dependence for the radiance inside the sphere depending on the optical characteristics of the water sample filling it. The purpose of our work is to analyze the structure of the light field in the ICAM via the Monte Carlo method. In addition, to justify the use of fluorilon in the manufacture of integrating spheres, we performed calculations for a sphere with mirror walls.

2. Materials and Methods

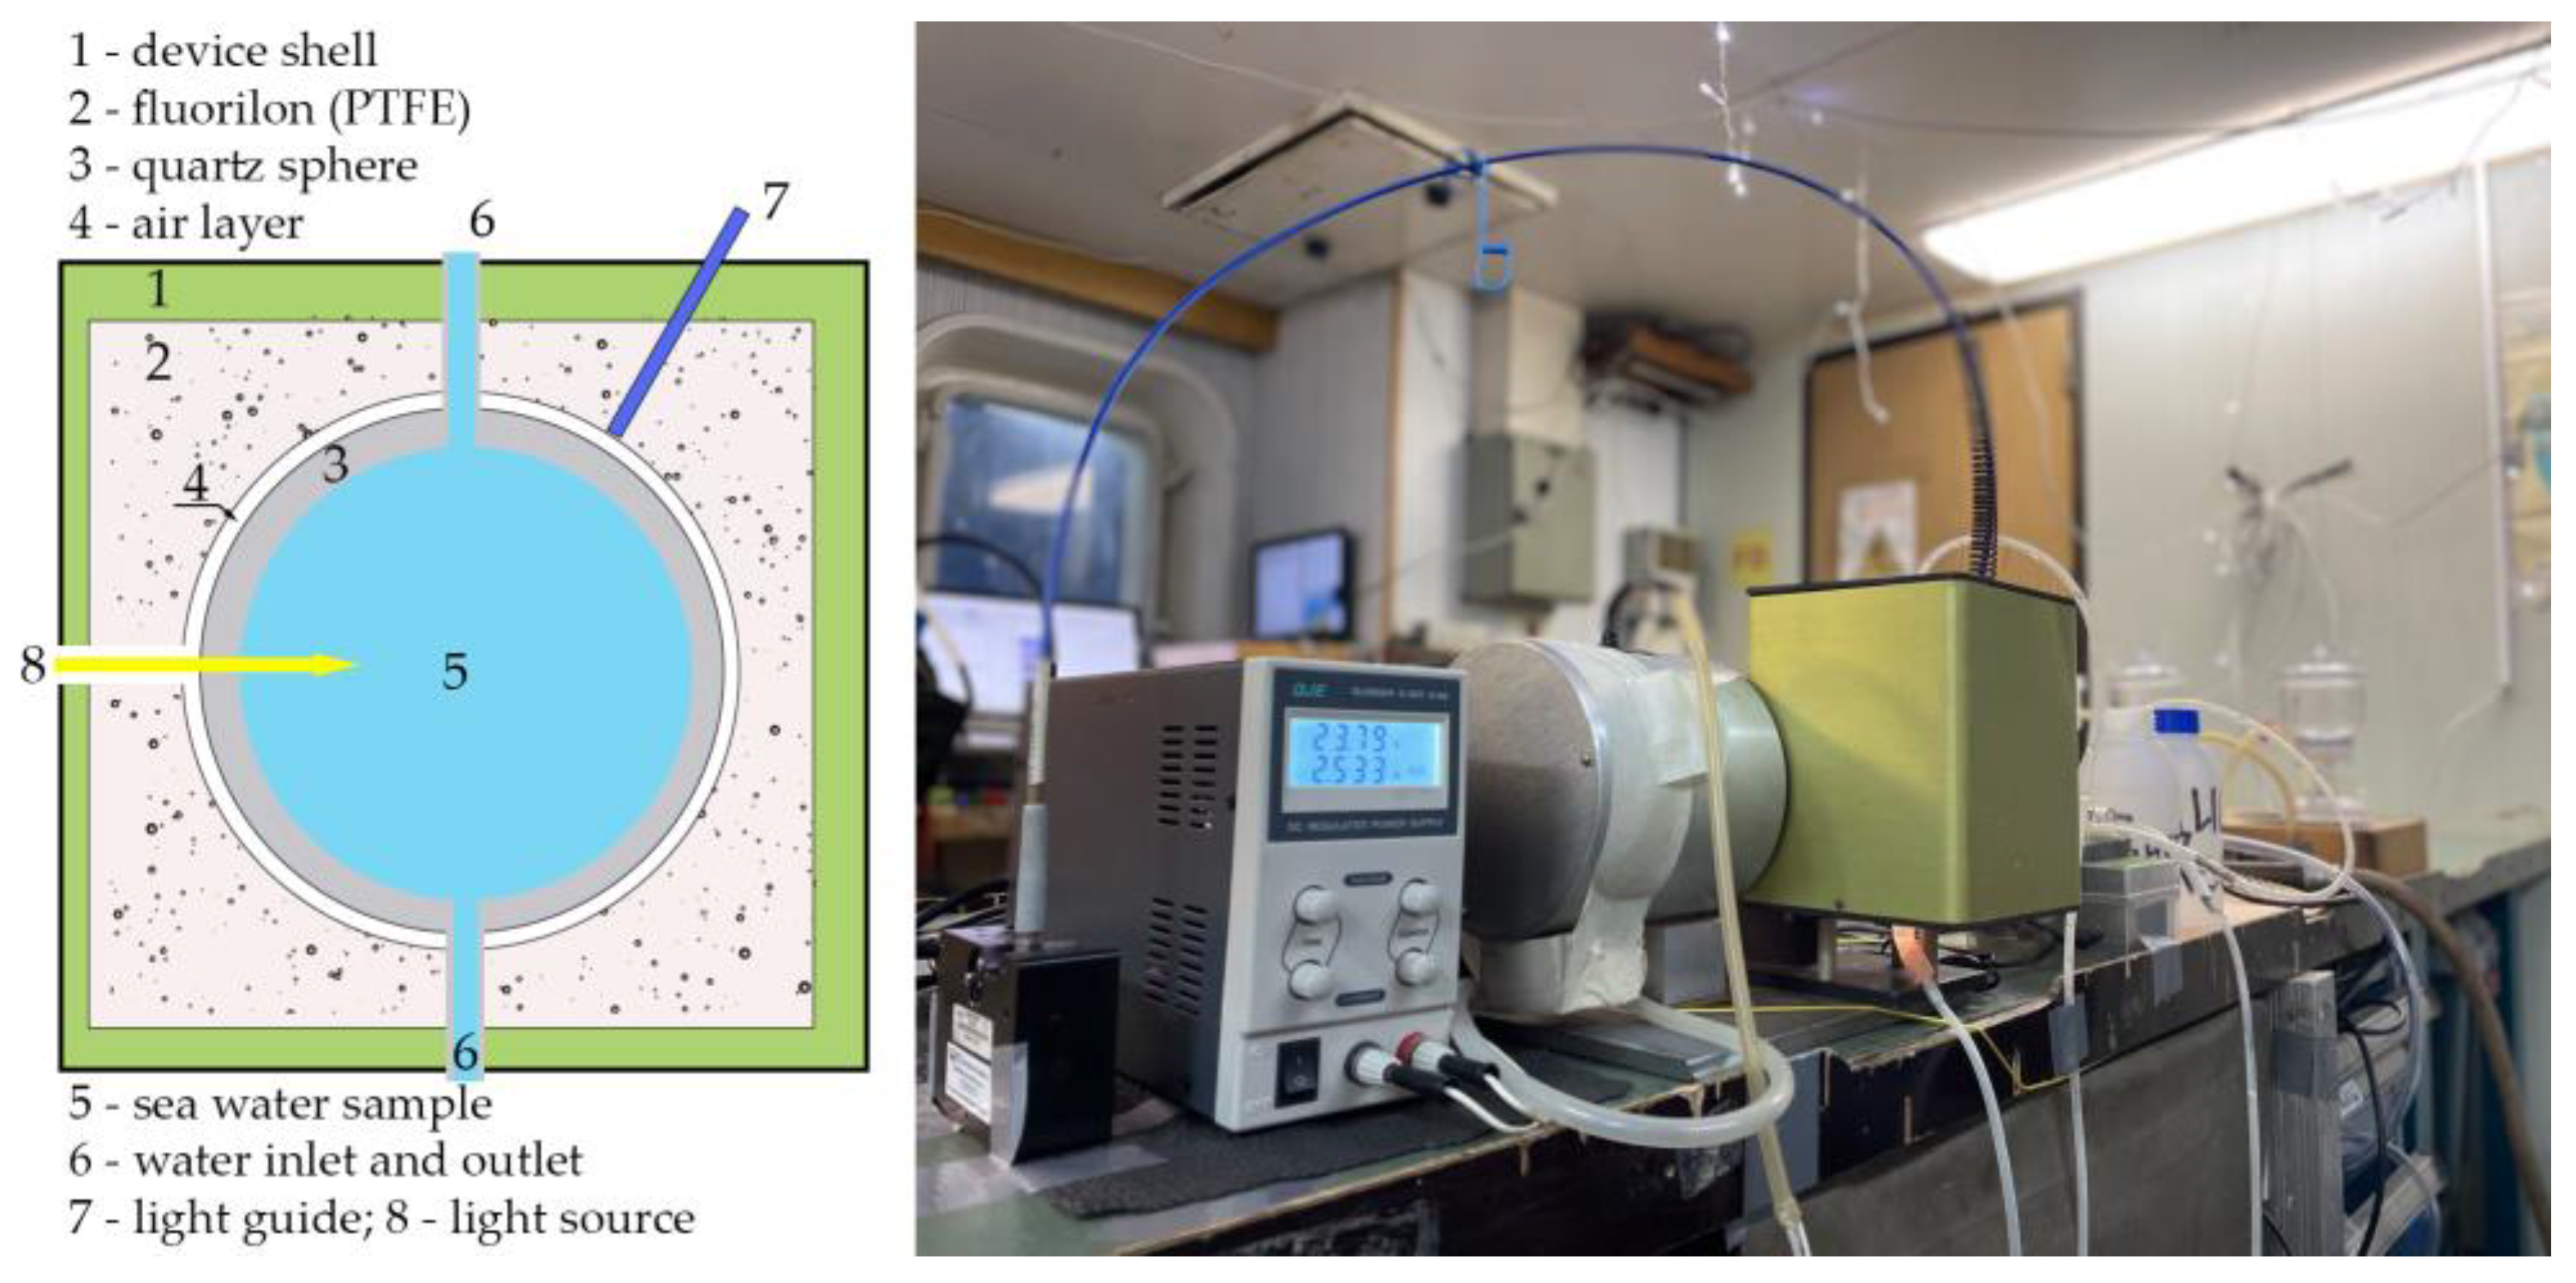
2.1. Integrated Cavity Absorption Meter

For several years, a portable spectrophotometer in the ICAM (Integrated Cavity Absorption Meter) configuration [21] has been used for field measurements of the light absorption spectra of seawater [27,28,29,30,31,32] at the Laboratory of Ocean Optics of the Shirshov Institute of Oceanology of the Russian Academy of Sciences (SIO RAS). The spectrophotometer contains an integrating quartz sphere with a radius R = 43 mm and a quartz wall thickness of 0.75 mm, placed in a sphere made of Fluorilon 99-W™. The scheme of the device is shown in Figure 1. The light source in the device is a current-stabilized halogen lamp installed outside the sphere in a horizontal plane. From the sphere, radiation is output via a light guide to the Ocean Optics USB4000 spectrometer (Ocean Insight, Orlando, FL, USA) through a side hole located at an angle of 110 degrees to the axis of the input light beam. Thus, the spectrometer registers only photons that have experienced scattering in the solution and reflections from the sphere surface. The isotropy of multiple scattering makes it possible to exclude its influence on absorption measurements.
During the processing of each sample, three measurements of the intensity of the light flux coming out of the sphere filled with seawater I λ , seawater passed through the nuclear filter I f λ , and distilled water I d λ are made. In addition, before and after each measurement, the spectra of the source (empty sphere) I s λ are recorded. Time interpolation makes it possible to take into account even the slightest changes in the radiance of the incandescent lamp that occur during the measurements.
An empirical formula for the relationship between the ratios of intensities and the extinction coefficient is presented in [20]. In the articles [2,33], a Monte Carlo model was developed based on the existing integrating sphere [21]. It is shown that model calculations via the Monte Carlo method are well approximated using the ratio of the signals of an empty sphere I s λ and one filled with seawater I λ with coefficients k 0 λ ,   u λ ,   and   v λ by the following formula:
a λ = 1 u k 0 I s λ I λ 1 v 1 .
Alternatively, u λ   and   v λ when using spheres filled with reference solution I d λ and seawater may also be expressed as follows:
a λ = 1 u I d λ I λ 1 v · 1 + u · a d λ 1 ,
where k 0 λ   is the ratio of the signal of a sphere filled with a non-absorbing liquid with the refractive index of water to the signal of an empty sphere, and a d λ is the absorption coefficient of the reference solution.
Absorption coefficient by suspended particles a p λ is calculated as the difference between the absorption coefficient of seawater and filtered through nuclear filters (0.2 µm pore size) water, and the absorption coefficient of colored dissolved organic matter (CDOM) a g λ is calculated as the difference between the absorption of the filtrate and pure water. Measurement errors can be estimated as 0.005 m−1 for a p λ measurements and 0.01 m−1 for a g λ measurements.

2.2. Numerical Simulation, Icammc Program

A new icammc program has been developed, which considers the photon survival in the ICAM sphere: absorption (a) and scattering (b) in media (seawater, quartz, and fluorilon), as well as refraction and reflection at the boundaries of quartz—the interior of the sphere (air or seawater) and quartz–fluorilon, with exit from the sphere into the light guide. An empty or filled seawater quartz sphere is in a fluorilon shell (Figure 1).
In contrast to [2], the icammc program simulates the propagation of light in the bulk of fluorilon. Previously, however, it was assumed that when a photon enters the fluorilon layer, it is reflected with a probability ρ according to the Lambert law, or it is absorbed with a probability 1 ρ . Along with setting the albedo of fluorilon, the icammc program provides the possibility of simulating the propagation of radiation in a layer of fluorilon by setting the absorption and scattering coefficients of this material. This approach allows us to investigate the possible deviation of the angular dependence of the reflection coefficient from the Lambert law. However, the use of this possibility requires significantly more computational resources due to several orders of larger magnitude number of photon-scattering events in the fluorilon layer.
The program contains three separate modules: seawater, quartz, and fluorilon; each of them simulates events that occur with a photon in the corresponding environment. The term ‘events’ here means collision of a photon with the boundary of the medium, scattering in water or fluorilon, absorption in any of the three media, exit outside the fluorilon shell, and hitting the recorder. The position of the current event in space is given by the vector r 1 , and the direction of movement after the event is determined by the unit vector x . The transition to the next event is modeled as follows: the mean free path is calculated l = ln r n d / c , where rnd is a random variable uniformly distributed over the interval [0, 1], and c = a + b is the light attenuation coefficient in the given medium. If the straight line connecting the points r 1 and r 2 = r 1 + l does not cross the boundary of any two media, then the value r 2 is assigned to the vector r 1 , the next random number rnd is calculated, and if rnd > ω 0 , where ω 0 = b / c is the single-scattering albedo, the photon is considered to be absorbed at the point r 2 . If rnd <  ω 0 , the new value of the vector x is calculated in accordance with the phase function in the given medium (quartz is considered to be a non-scattering medium). If the segment [ r 1 , r 2 ] crosses the quartz/seawater or quartz/fluorilon boundary, the photon is reflected or refracted into a medium with a different refractive index in accordance with the Fresnel formulas. The polarization effect is not taken into account in the icammc program due to a large number of reflections. The input parameters of the calculation program are as follows: the number of photons (optimal 106–107); indicators of absorption and dispersion of seawater; refractive indices of seawater (1.34), quartz (1.45), and fluorilon (1.35); radii of the spheres and sizes of their outlet. For seawater and fluorilon, the phase functions of Petzold [34], Kopelevitch [35], or Henyey–Greenstein [36] were specified.
If a photon enters a hole with a size (d = 600 µm) located at an angle of 110° to the light beam, then it is considered that the photon left the sphere and was registered by the spectrometer. The result of the program operation is I / I 0 emerging out of the light flux as a function of the absorption coefficient, as well as the number of photons absorbed in each of the media, the average photon path traveled, the albedo and the average irradiance on the sphere wall E n o r m .
In addition, two more cases are implemented in the icammc program.
(1) The existence of an air layer between quartz and fluorilon due to the fact that fluorilon is not a smooth material and is obtained via pressing and grinding. The thickness of the air layer can be estimated as 10–100 µm, which is much larger than the wavelength, so the geometrical optics approximation is applicable to our calculations.
(2) The possibility of replacing the Lambertian law with a silver mirror. Silver absorbs light more intensely than fluorilon. The reflection coefficient is calculated via the Fresnel formula, taking into account that the refractive index of the metal is a complex number ( n s = n s I · χ ). For silver, n s = 0.18, χ = 3.64 [37].

3. Results

The production of integrating spheres is associated with a number of difficulties. It is technologically easier (and cheaper) to manufacture spheres with a mirror coating than those embedded in fluorilon. Section 3.1 is devoted to the study of the applicability of mirror spheres for absorption studies of seawater based on numerical Monte Carlo simulations, and Section 3.2, Section 3.3, Section 3.4, Section 3.5 and Section 3.6, are devoted to various aspects of modeling a fluorilon sphere and the results of direct measurements performed with its help.

3.1. Mirror Integrated Sphere

A mirror sphere differs from a sphere with diffusely scattering walls as the isotropization of the angular distribution of photons due to multiple reflections occurs much slower in the first one. Moreover, it does not occur at all in the case of low values of the sample scattering coefficient. In addition, the reflection coefficient (albedo) of silver is significantly less than the albedo of fluorilon. Thus, there is a reason to believe that the intensity of the recorded signal will be largely determined not only using the absorption coefficient but also the scattering one. This hypothesis is confirmed by the calculation results. Figure 2 shows plots of the dependence of the signal on the absorption coefficient for various values of the scattering coefficient and two Henyey–Greenstein phase functions [36] with different average cosines g = 0.6 and g = 0.9 .
For each absorption coefficient value, the intensity of the recorded signal grows with an increase in the scattering coefficient, reaching the limiting value, which depends on the absorption coefficient. The speed of reaching the limit value also depends on the phase functions: it is higher for the phase function, which is less extended forward ( g = 0.6 ).
The effect of using two Henyey–Greenstein phase functions with parameters g = 0.6 and g = 0.9 while calculating the light field inside the mirror sphere for the absorption coefficient in pure waters a  = 0.02 is shown in Figure 3; the number of photons is 109. The standard error Re, % for some values is presented in Table 1. The calculation results show that the choice of the phase function, and, consequently, the influence of scattering, cease to determine the parameters of the light field inside the sphere at values of the scattering coefficient exceeding 15 m−1. Such values are an order of magnitude higher than the ones characteristic of the most turbid natural waters of the World Ocean [3,38].

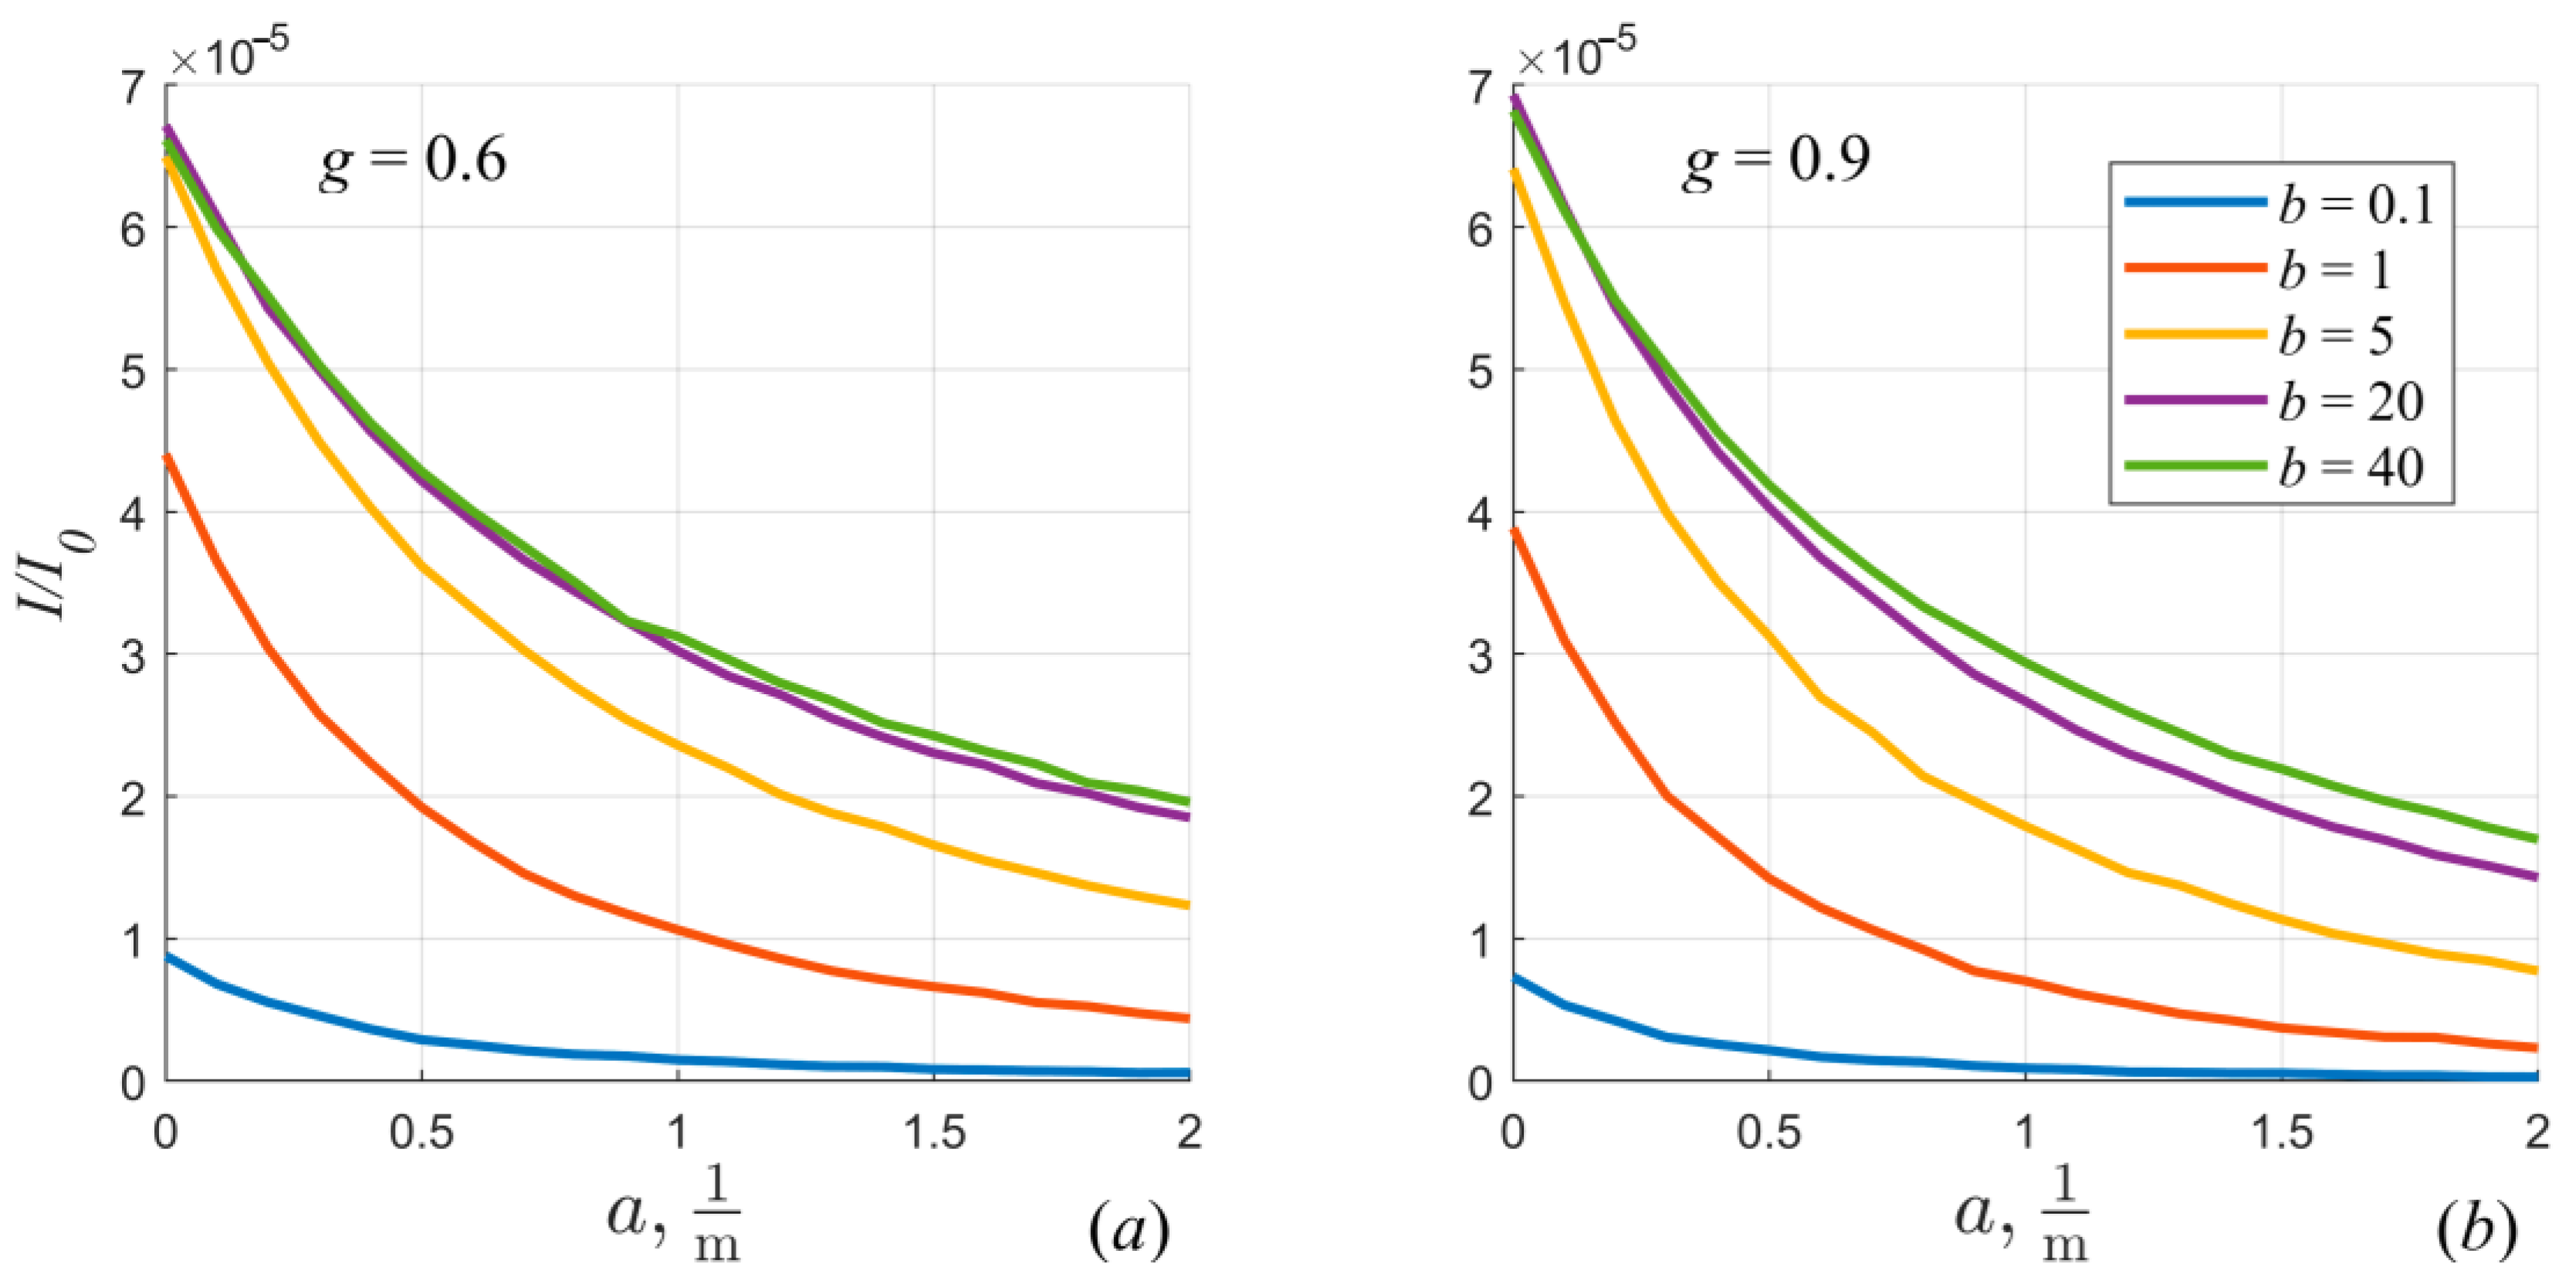
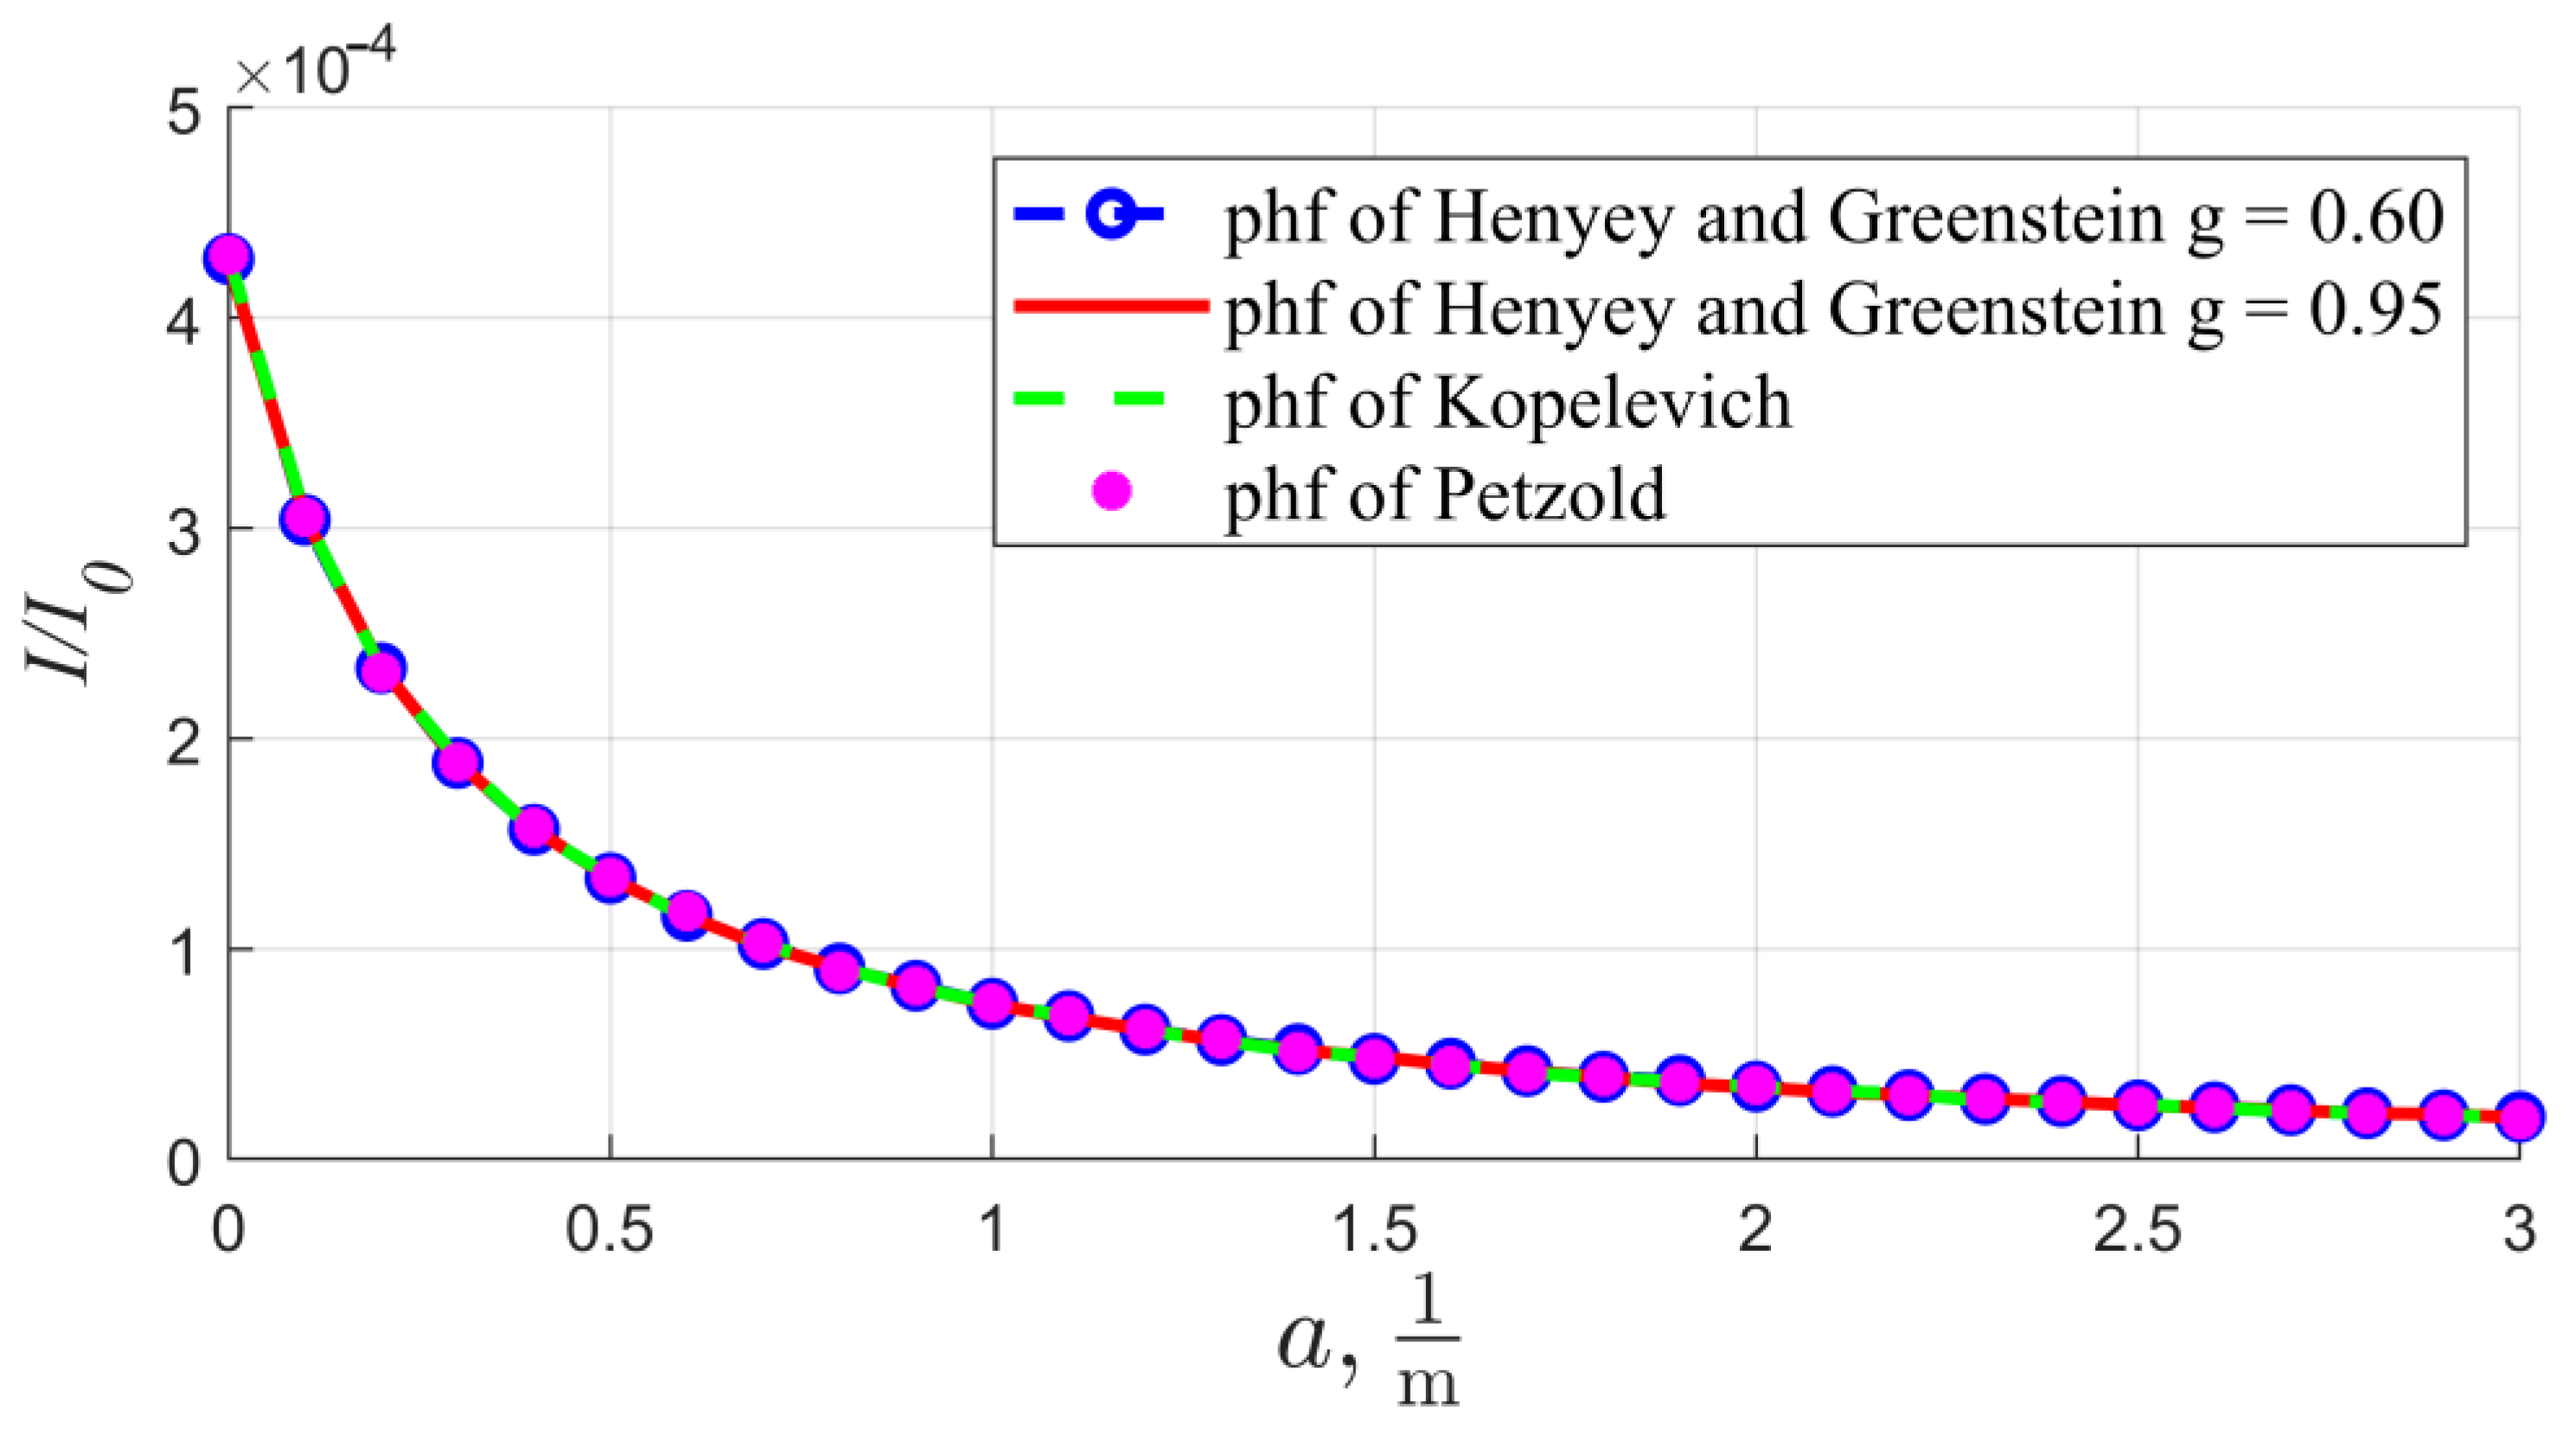
3.2. Fluorilon Sphere. Applicability of Various Phase Functions

To assess the influence of various scattering phase functions on the results of calculations of the absorption coefficient, the phase functions of Petzold [34], Kopelevich [35], and Henyey–Greenstein [36] were used. In the case of the latter one, the calculations were carried out with different average cosines at g = 0.95 (the phase function is strongly extended forward, which corresponds to seawater) and g = 0.6 .
The results obtained show (Figure 4) that the choice of the model of light scattering in seawater does not affect the dependence of the intensity of the outgoing flux on the values of the absorption coefficient. This result, along with the conclusions of [2], confirms the exclusion of the influence of light scattering in the integrating sphere. The mean standard deviation was 1%.

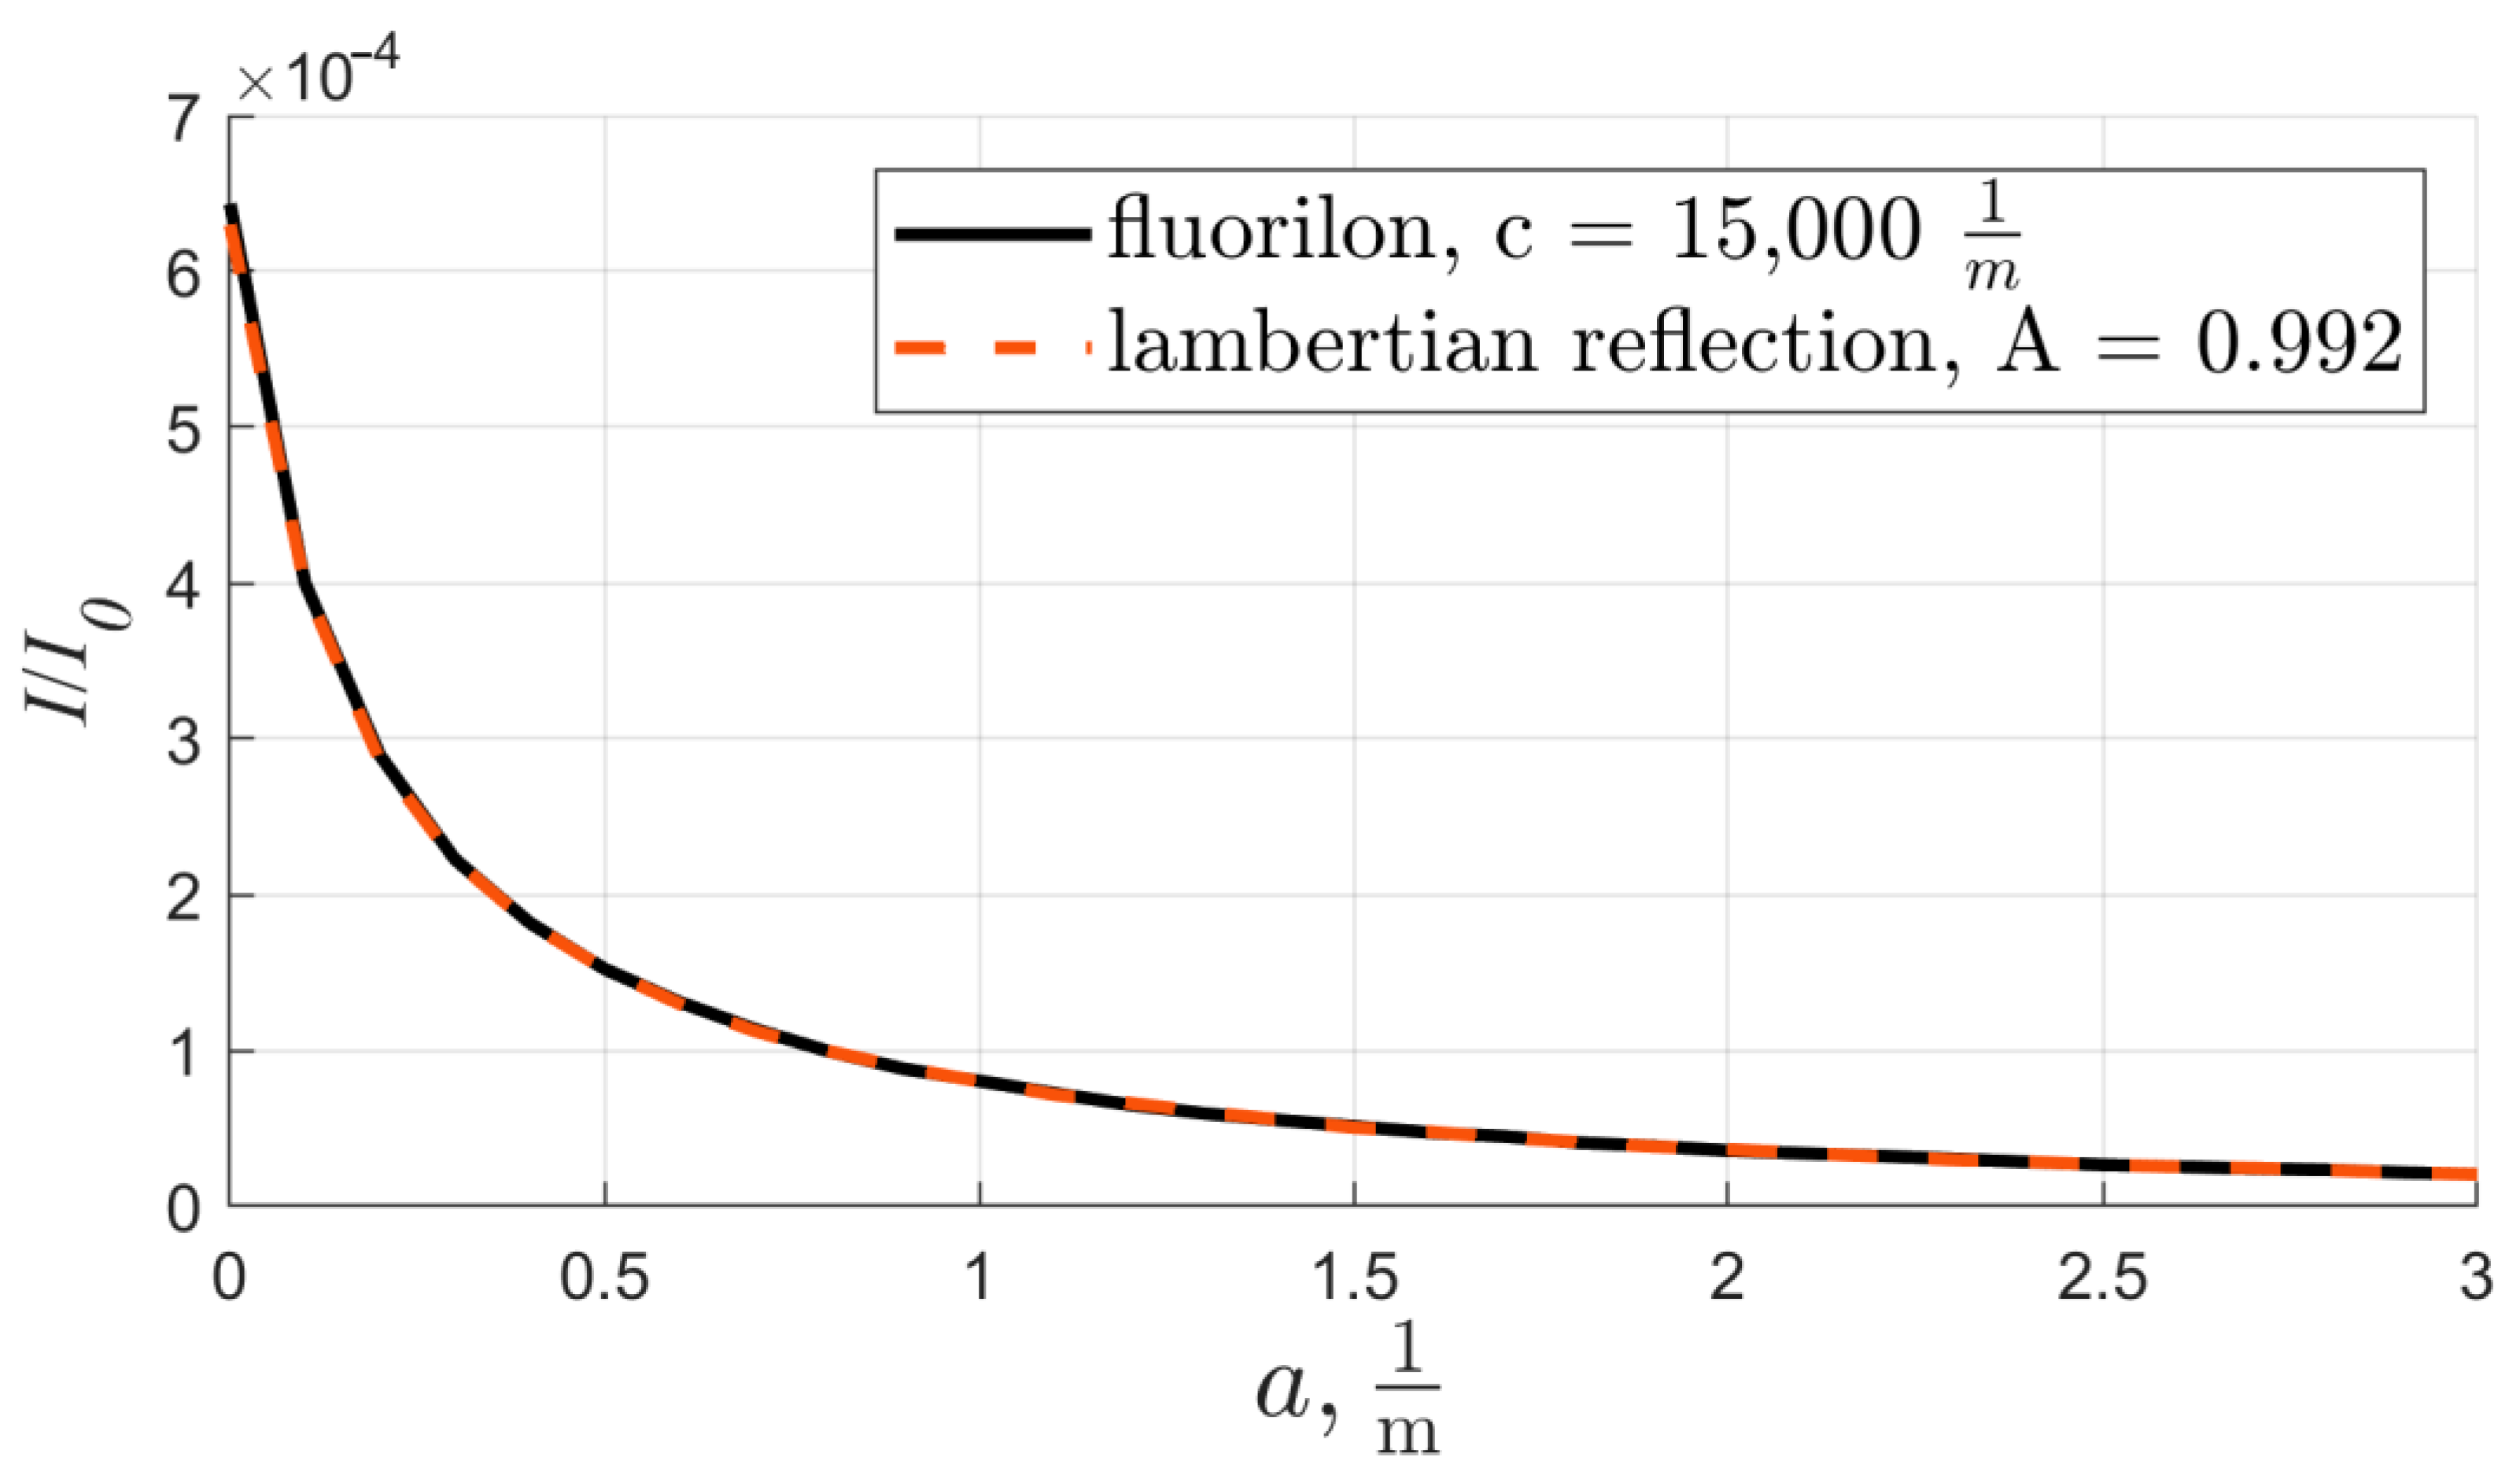
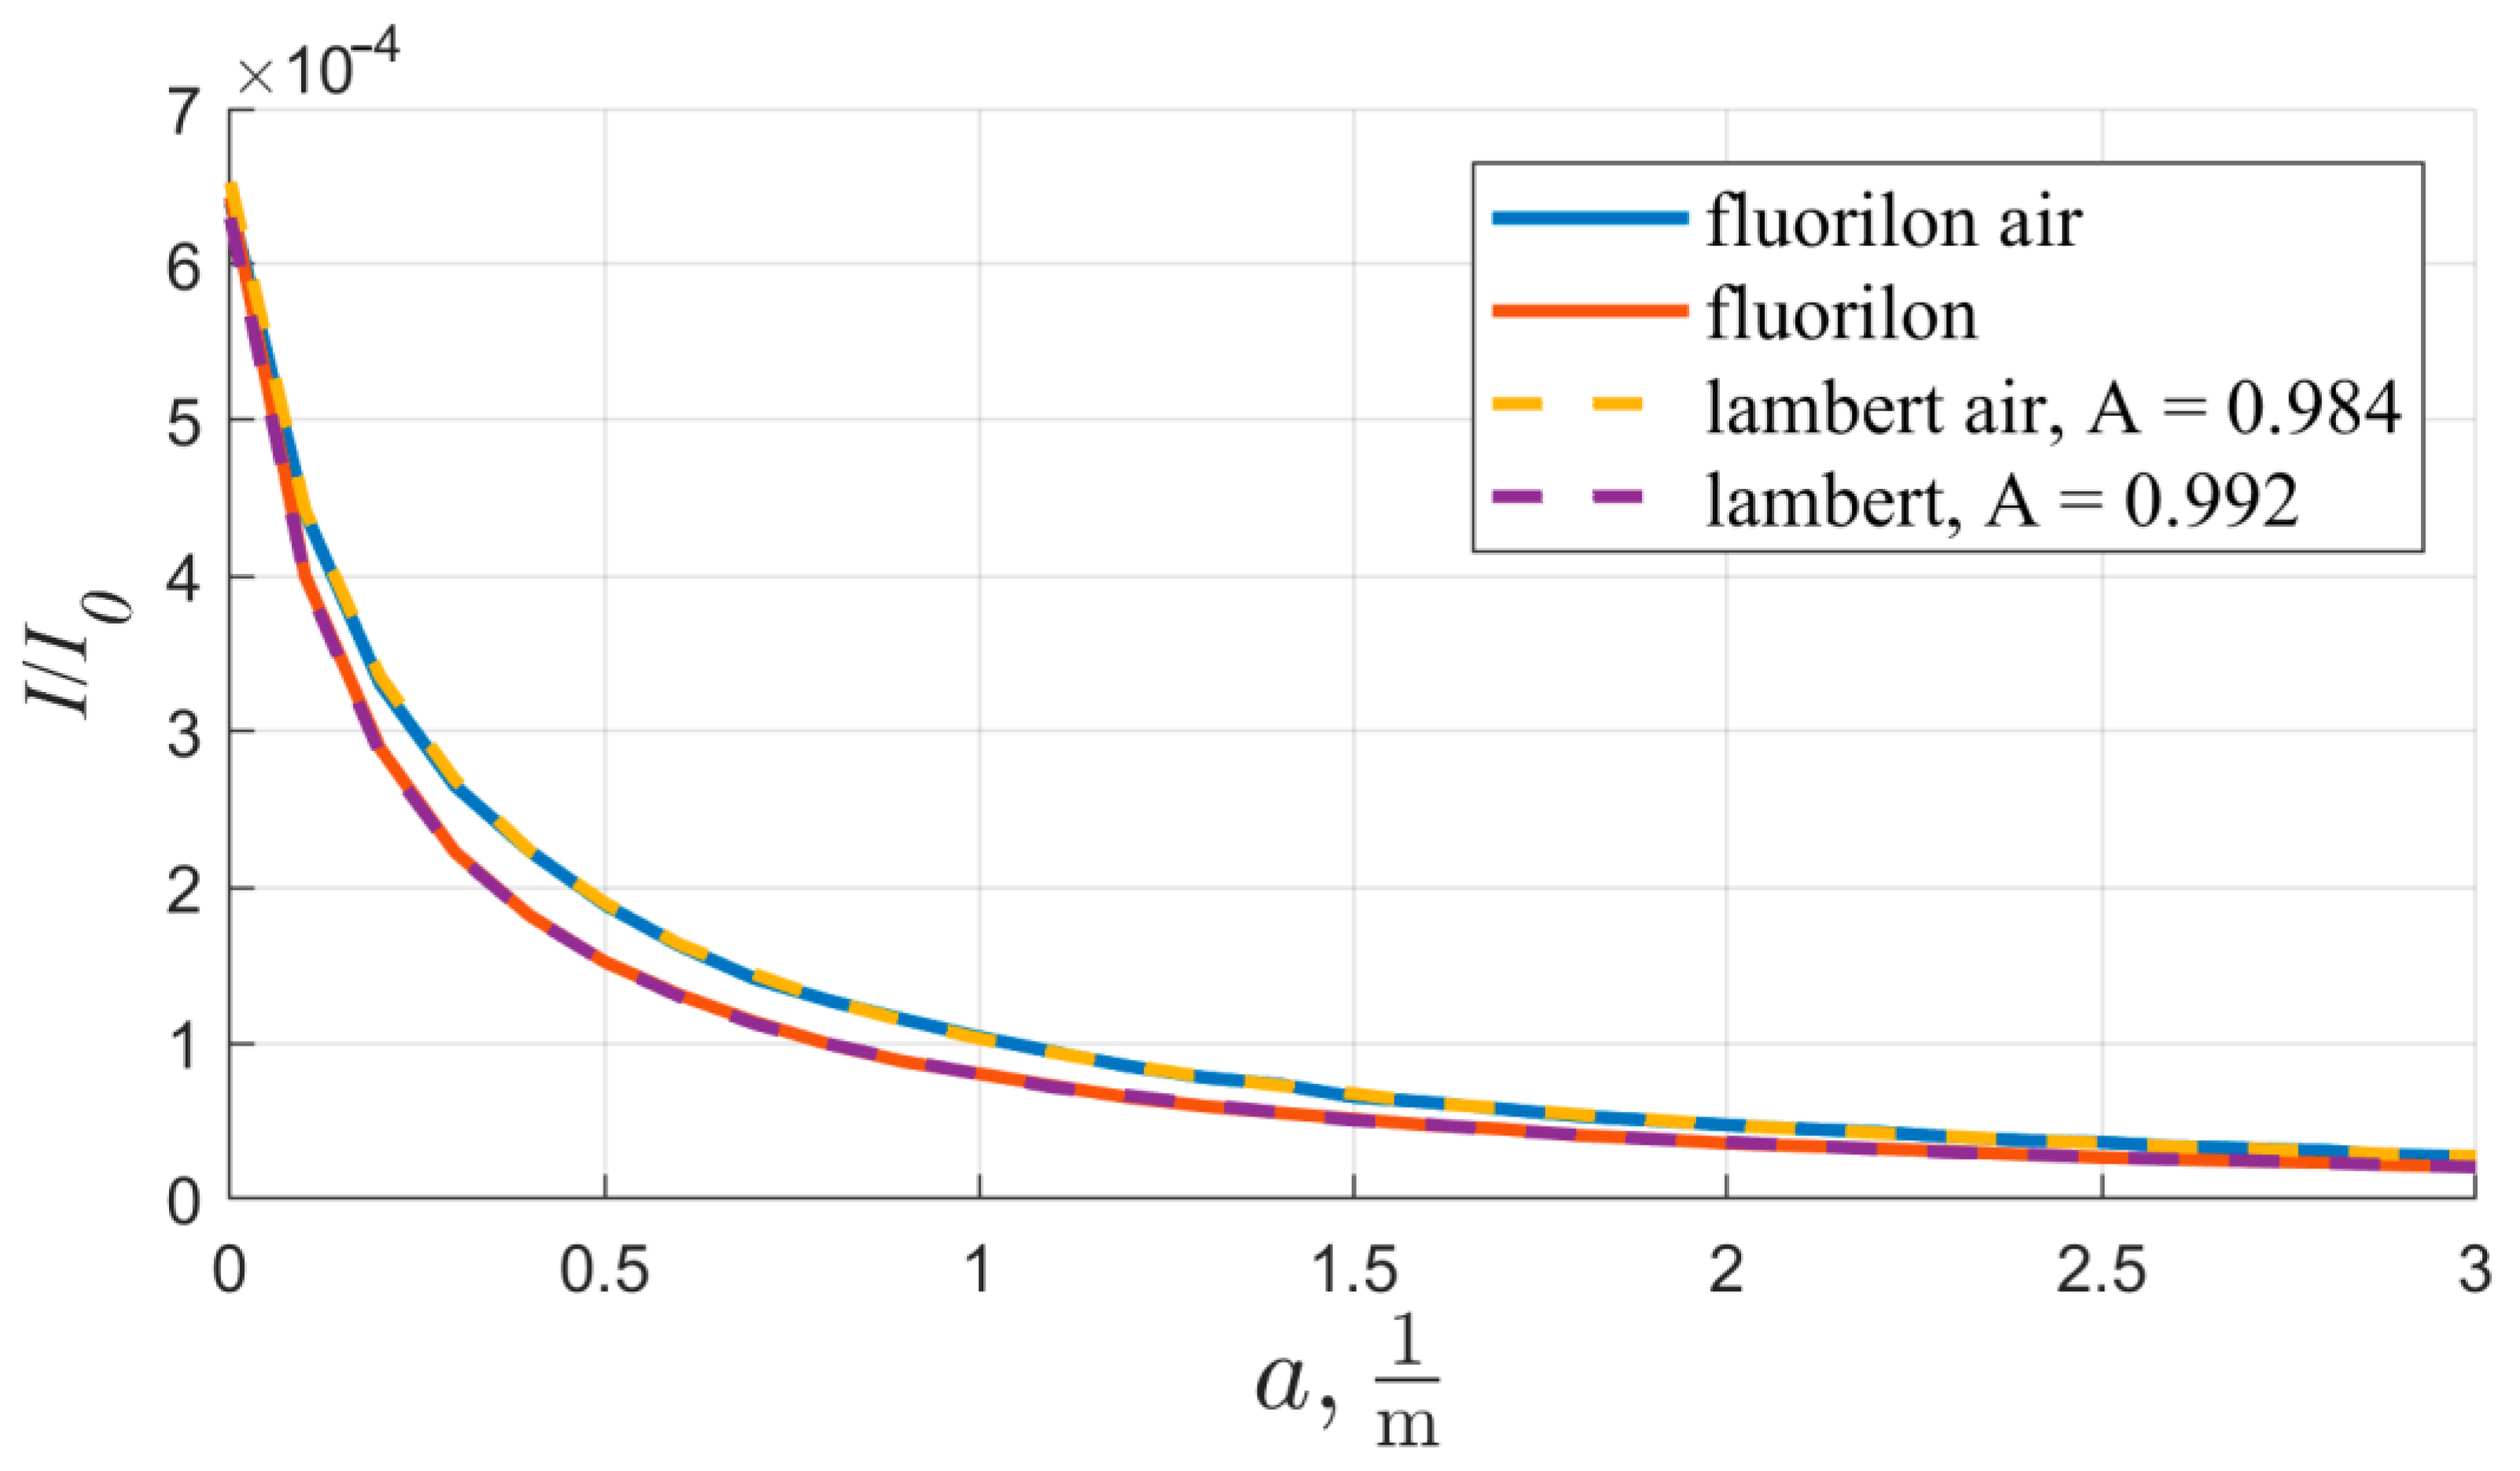
3.3. Applicability of the Lambert Approximation

Previously, in [2], it was assumed that a photon colliding with fluorilon is either reflected according to the Lambertian law or absorbed depending on the albedo value. The new program icammc simulates the propagation of light radiation throughout the thickness of fluorilon. Absorption in fluorilon is negligible and is not taken into account; instead, with some small probability, a photon can ‘jump’ out of it. This approach allows us to investigate the possible deviation of the angular dependence of the reflection coefficient from the Lambert law. However, the use of this feature requires large computational resources due to the huge number of scattering events on the path of a photon in the fluorilon layer: for example, with an absorption coefficient value of 0.1 m−1 (which corresponds to the absorption of pure seawater in the region of 500 nm) the average path of a photon in fluorilon with a scattering coefficient of 15 × 103 m−1 was 11 m.
The result of testing the hypothesis of the applicability of the Lambertian approximation for speeding up the calculations is shown in Figure 5. They performed calculations without taking into account the air interlayer (Section 3.4) for fluorilon with the value of the attenuation coefficient equal to 15,000 m−1 and the parameter of the Henyey–Greenstein phase function with g = 0.6 and for the Lambertian surface with albedo A = 0.992 are comparable. The use of the Lambertian model makes it possible to reduce the calculation time via two orders of magnitude with a relative error Re less than 1%.

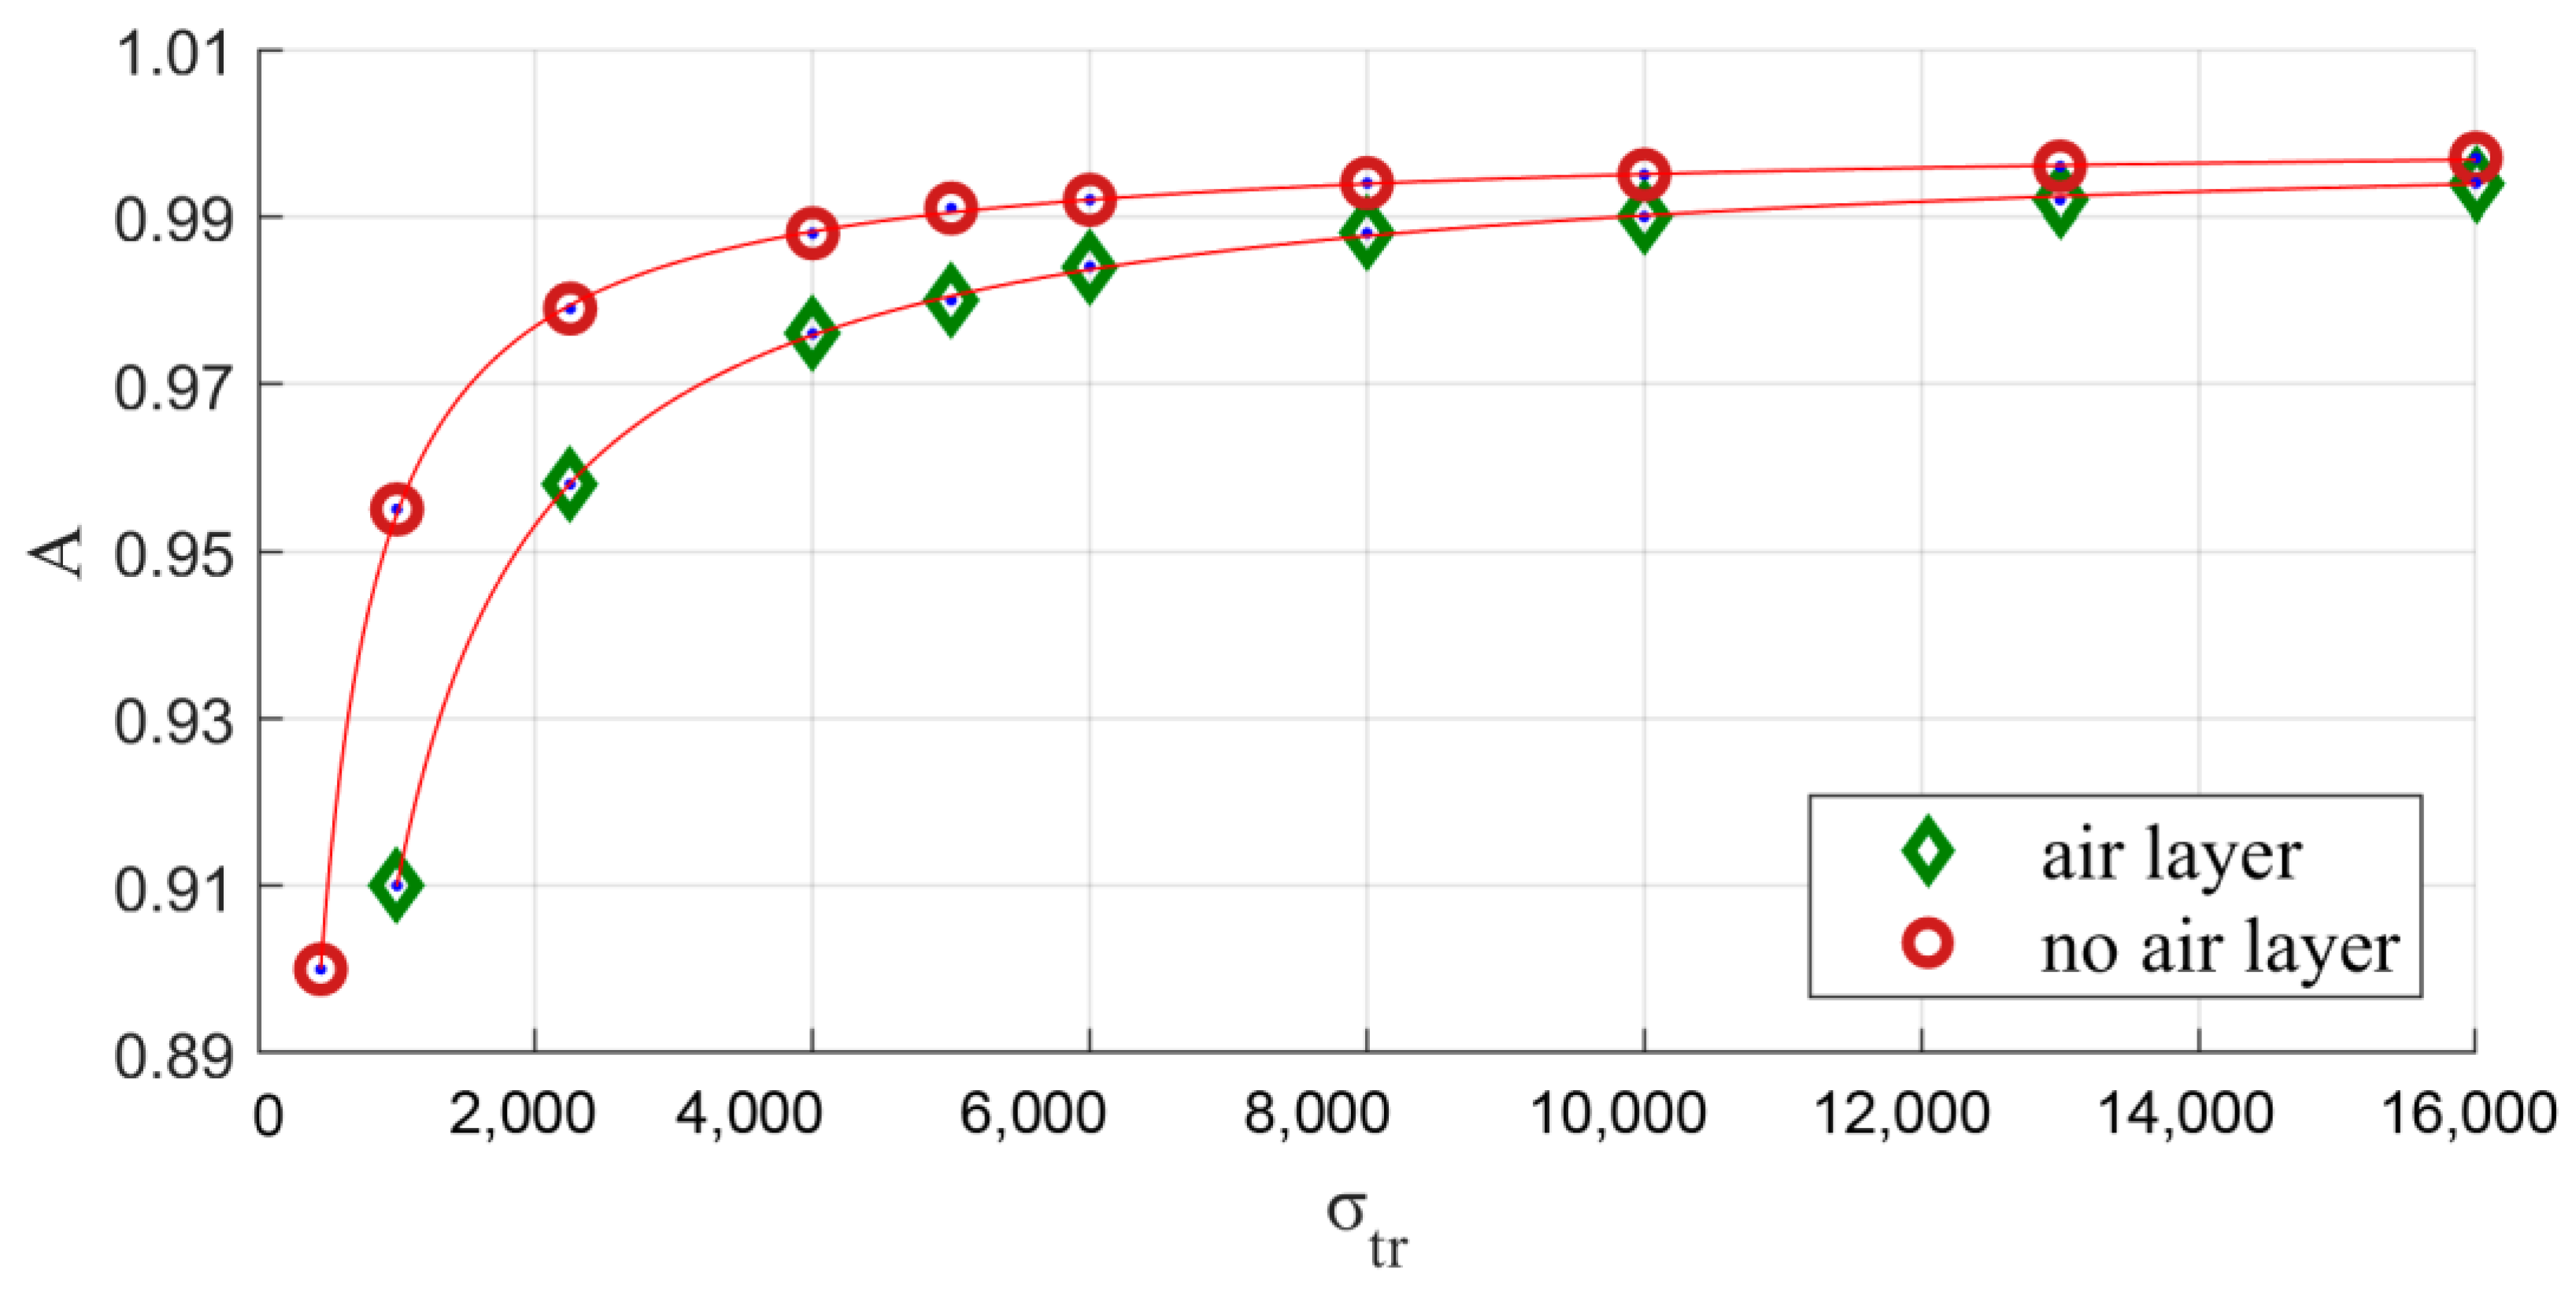
3.4. Air Layer between Quartz and Fluorilon

Fluorilon (polytetrafluoroethylene) is a porous substance, a polymer that is obtained via pressing and grinding. Since the parts manufactured in this way have a rough surface, there is an air layer between it and quartz in the ICAM-integrating sphere, which affects both the parameters of the light field inside the sphere and the intensity of the output radiation recorded during measurements. In our earlier works [2], this feature was not taken into account. In this work, the reflection coefficient is calculated considering the air layer effect as the sum of the probabilities of events according to the geometric progression formula [37]. Total internal reflection in the case of an air layer occurs at an angle of incidence of a photon above 44°, without it—at 69°.
For the same conditions presented in Section 3.3, the intensity of the output signal is simulated depending on the absorption coefficient, taking into account the air interlayer. Figure 6 shows a comparison of the intensities in the case of fluorilon and corresponds to them in the case of a Lambertian surface. As can be seen, the signal intensity in the fluorilon sphere in the presence of an air layer is somewhat higher than in its absence. This can be explained by the fact that the effective reflection coefficient at the quartz–fluorilon interface is significantly higher in the presence of an air layer, which increases the probability for a photon to enter the exit hole after multiple reflections inside the quartz shell. Additionally, accordingly, in the case of the existence of an interlayer, it is necessary to use a smaller albedo of the wall surface of the sphere in the calculations.
Thus, the air interlayer between the quartz bulb and fluorilon increases the number of photons scattering as well as the isotropy of the light field inside the sphere due to multiple reflections, which is important to take into account in numerical calculations. However, in practice, the influence of this effect is reduced by the fact that the absorption calculation is performed, taking into account calibration according to reference measurements performed on a SPECORD M400 double-beam spectrophotometer and the selection of the appropriate coefficients [2].

3.5. Diffusion Approximation

In the diffusion approximation, a light field is considered in isotropic or anisotropic media with a high albedo A ≈ 1. For optically thick layers, where this regime occurs, all light quantities are determined using a single parameter, the transport scattering coefficient σ t r , which is expressed as follows:
σ t r = b × 1 g ,
where b is the coefficient of light scattering, respectively, and g is the mean cosine of the scattering phase function. The absorption of light in fluorilon is far less than scattering, which makes it possible to neglect its effect. The factor 1 g is a correction to the scattering coefficient used in the diffusion approximation [39].
For this part of the work, the intensities of the flux leaving the integrating sphere were calculated for various values of the transport scattering coefficients σ t r in fluorilon. The corresponding albedos were matched to them in the case of the Lambertian approximation. Figure 7 shows the dependence of the transport scattering coefficient on albedo in the case of air interlayer between quartz and fluorilon and without it. A strong discrepancy is observed at low values of the transport scattering coefficient, which decreases as the scattering coefficient in fluorilon increases.
These curves are well approximated by a power law as follows:
A = 1 k 1 × σ t r k 2 .
The coefficients of the correlation equation, as well as the Pearson correlation coefficient and the standard deviation for both cases, are presented in Table 2.
Table 3 presents the numerical results of calculations in the case of a fluorilon sphere and the appropriate albedo for a Lambertian surface. For the value of σ t r obtained in different ways (by changing the attenuation coefficient or the parameter of the Henyey–Greenstein phase function), the appropriate albedo is the same. Thus, the albedo values can be described using one parameter, taking into account the empirical dependence (4). An increase in the error for an albedo below 0.9 is due to the inapplicability of the transport approximation under these conditions.

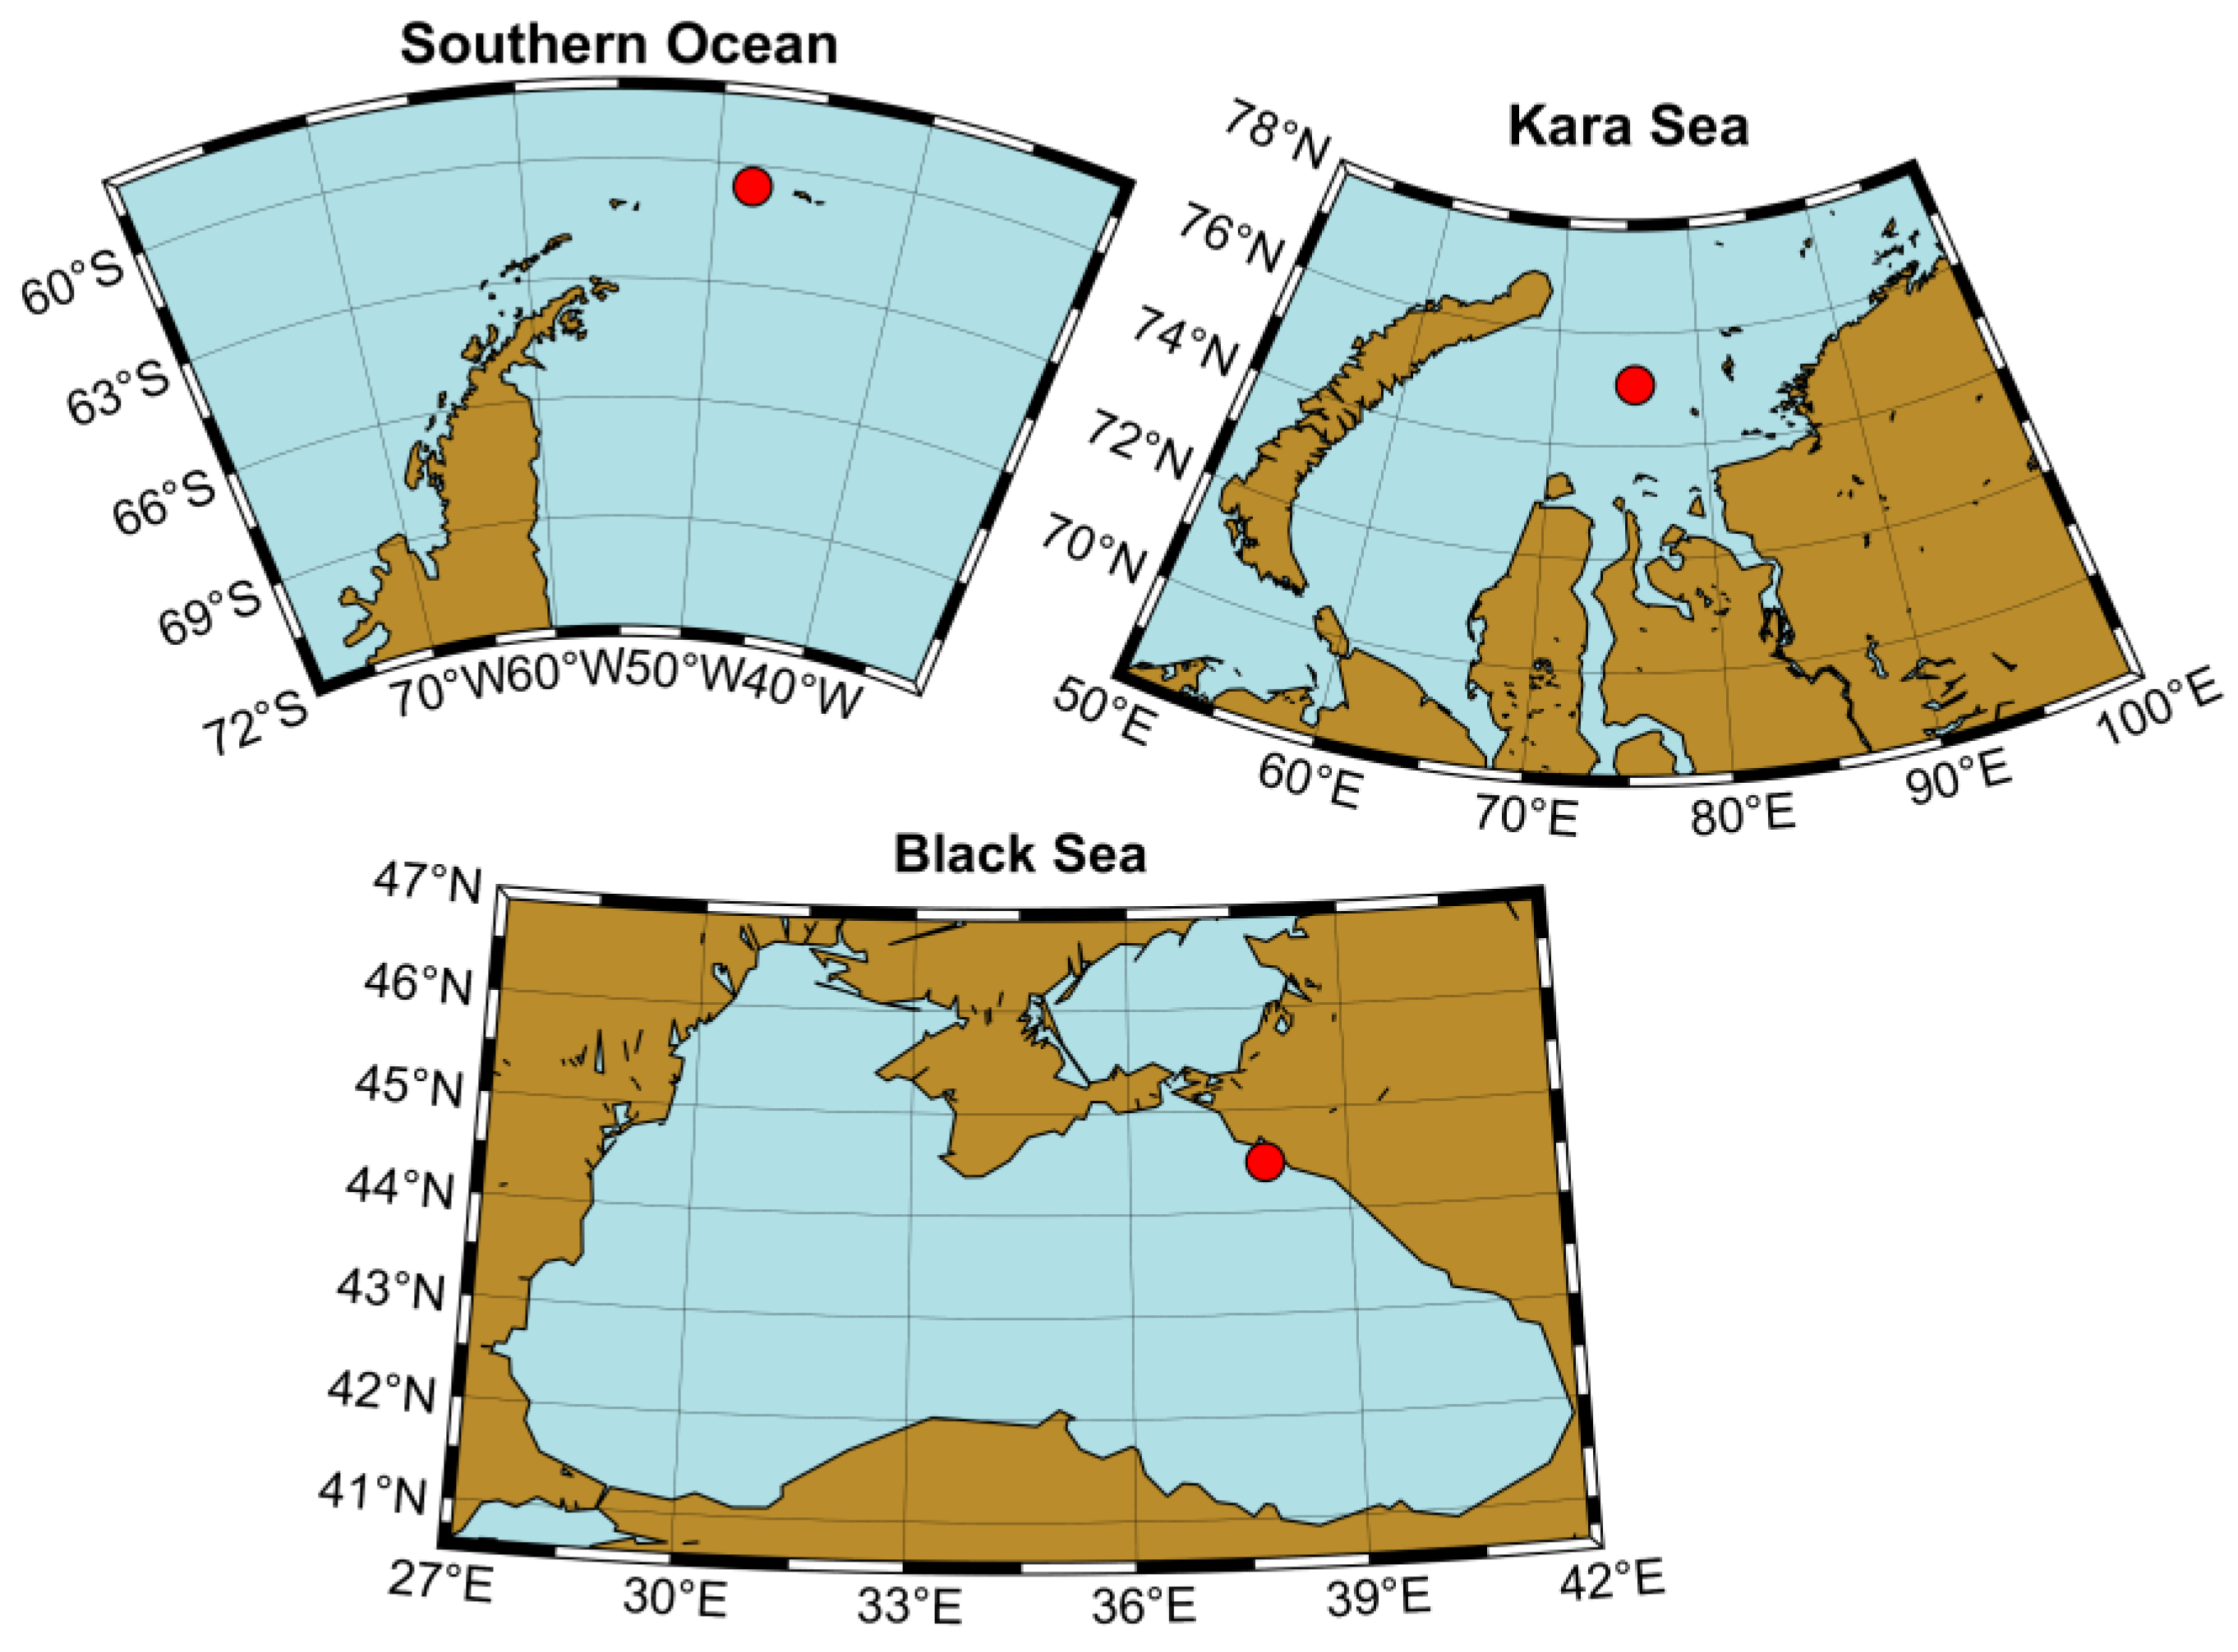
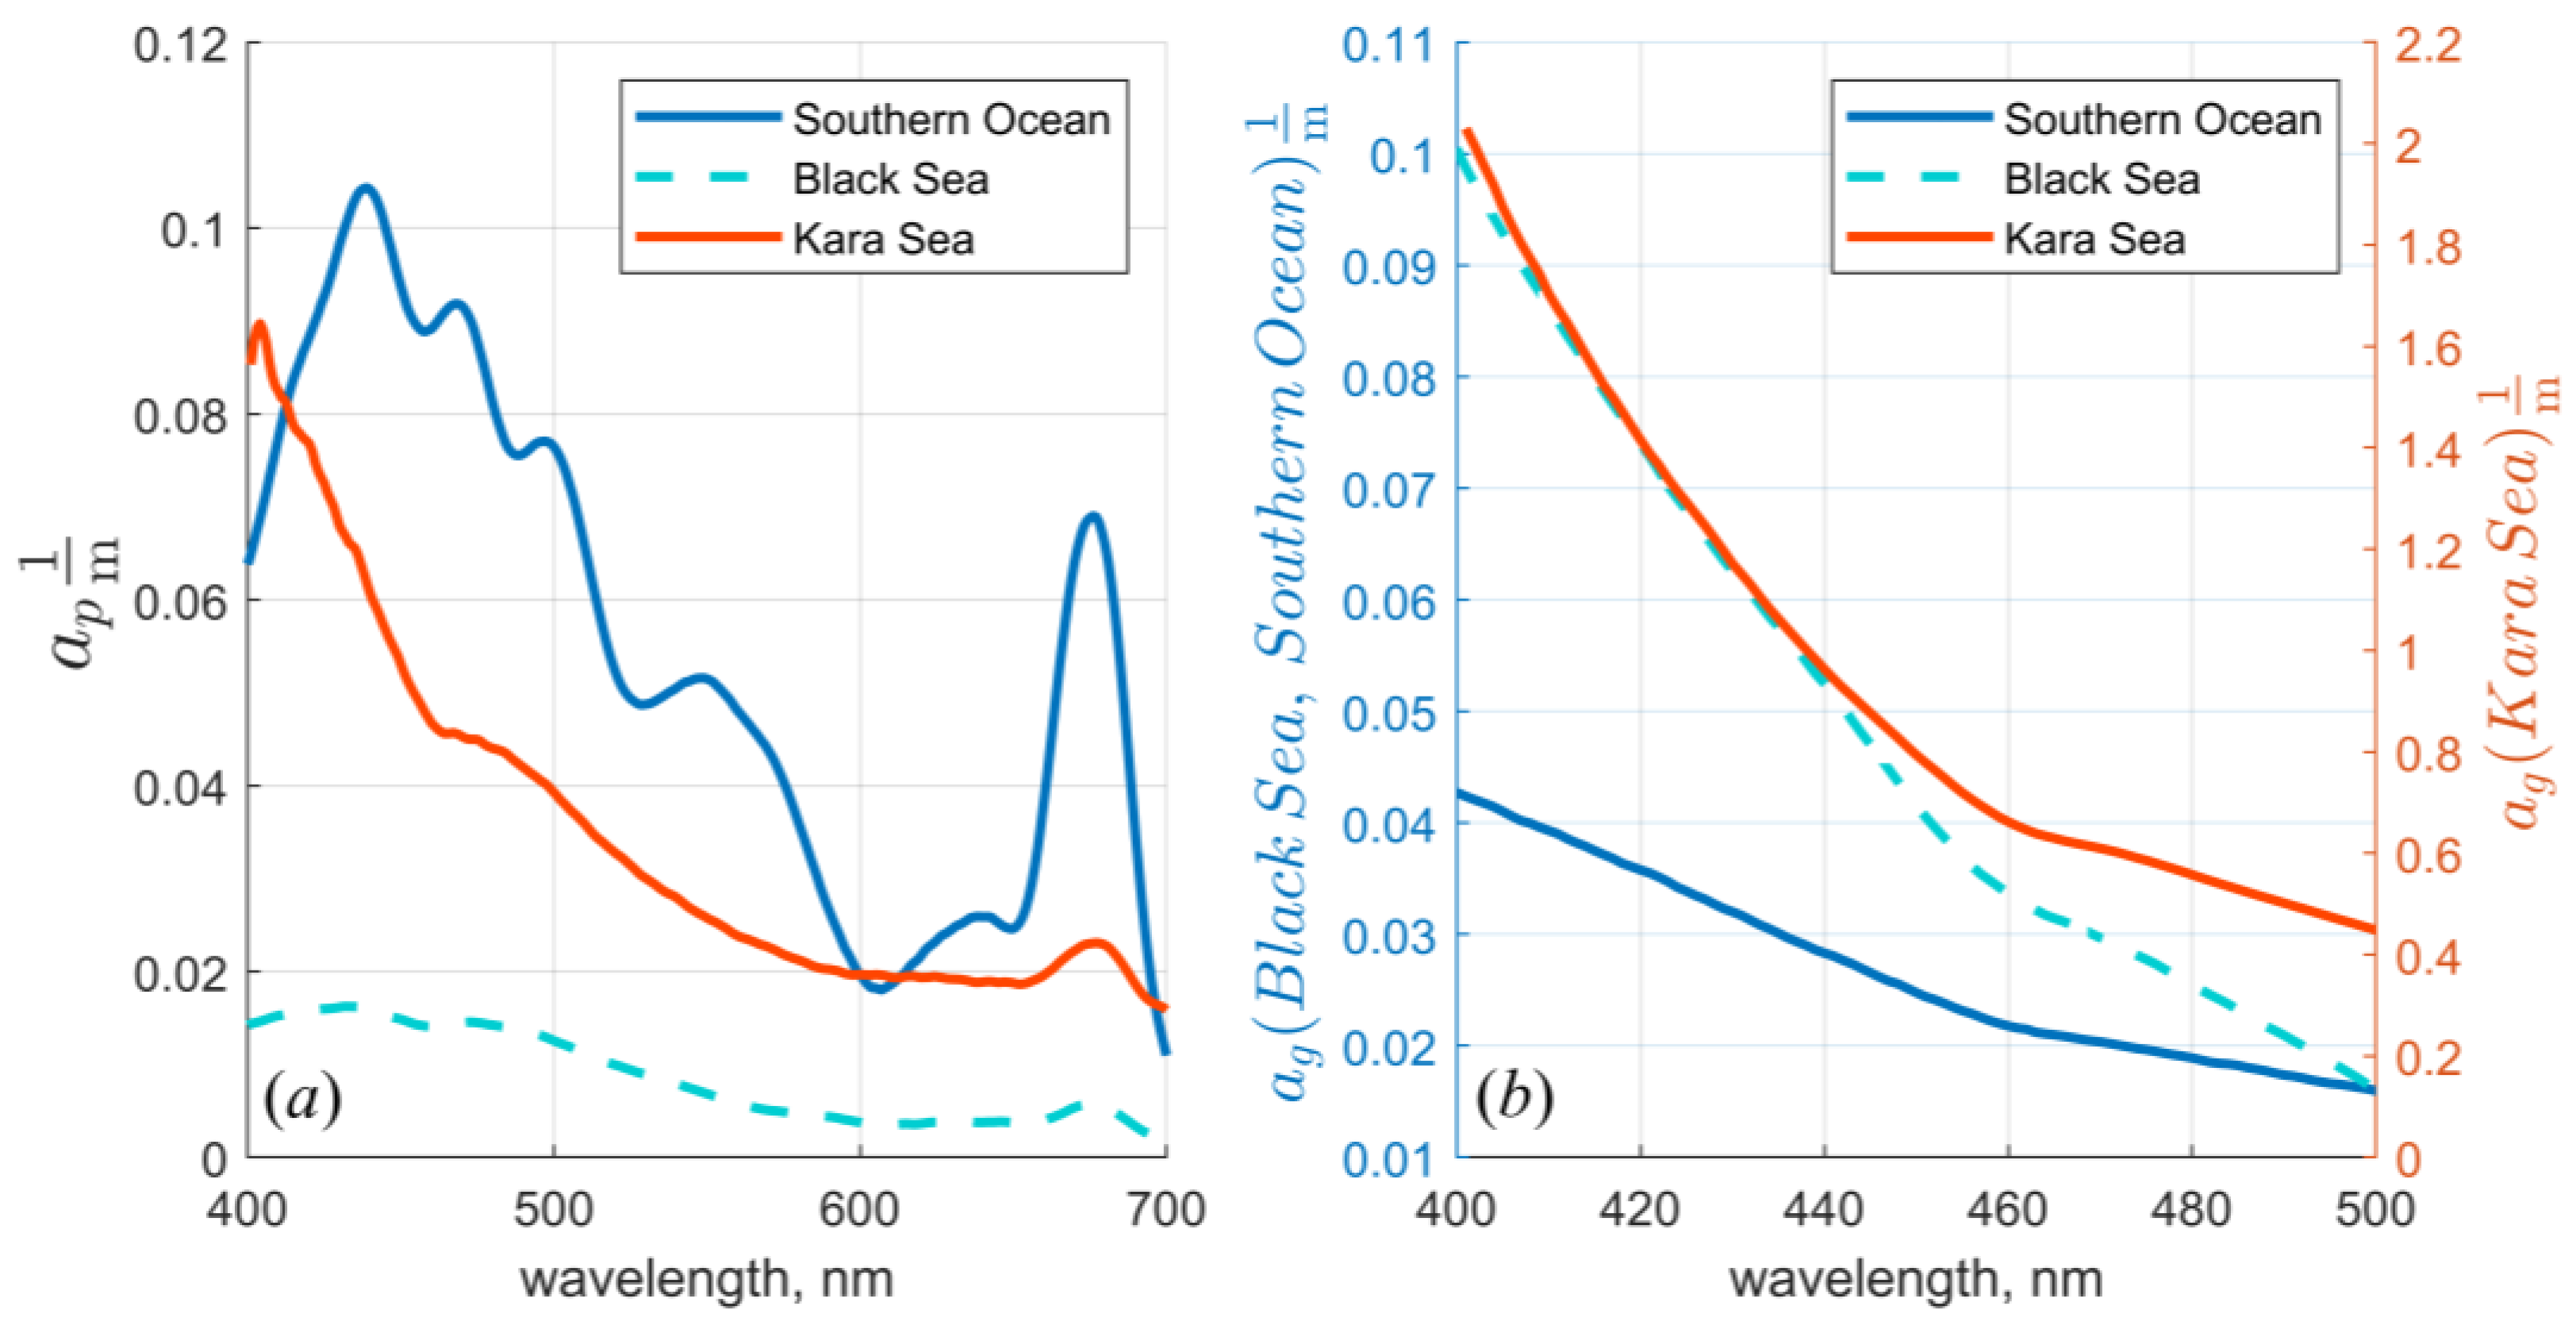
3.6. Oceanological Results Example

This part of our article presents the results of measurements of the seawater absorption coefficient performed on a fluorilon integrating sphere, taking into account the above-mentioned results. Shipborne measurement data were obtained in the surface layer of various regions of the World Ocean (Figure 8) on cruises of the Shirshov Institute of Oceanology in 2020–2022:
-
Atlantic sector of the Southern Ocean, Weddell-Scotia Confluence zone, 28 January 2020, cruise 79 of the R/V «Akademik Mstislav Keldysh» [40];
-
Kara Sea, 4 October 2022, cruise 89 of the R/V «Akademik Mstislav Keldysh» [41];
-
Black Sea, 3 June 2022, the vessel «Ashamba» [41].
The main optically active components of seawater are suspended particles and colored dissolved organic matter (CDOM). Particles’ uptake (Figure 9a) is calculated as the difference between the uptake of a seawater sample and its filtrate; CDOM uptake (Figure 9b) is calculated as the difference between the filtrate and clear water [42].
Figure 9a shows the spectra of the particulate absorption coefficient ap(λ) remaining on the filter. Suspended particles are of terrigenous (mineral) and biological origin. Terrigenous suspension is observed in large quantities in the Kara Sea [28,43,44]. The corresponding spectral behavior of the absorption coefficient using suspended particles (red color in Figure 9a) is approximated with sufficient accuracy via the exponential law [45]. In the Southern Ocean (blue color in Figure 9a), suspended particles are of biological origin [46]; absorption peaks correspond to various pigments: carotenoids absorb in the 480–520 nm band, intense peaks in the 435 and 675 nm region—absorption by chlorophyll-a, and at 550 nm is the absorption peak of phycoerythrin pigment [47], which is typical for cyanobacteria as well as red algae [48]. Significantly lower values of the particulate absorption coefficient were recorded in the Black Sea, where during the expedition in June 2022, intensive blooms of coccolithophorids (Emiliania huxleyi) were observed [49]. Despite the fact that these algae significantly increase light scattering [17,50], the use of an integrating sphere makes it possible to carry out absorption measurements even under conditions of intense coccolithophore blooms [51].
These areas also differ significantly in terms of the spectral absorption coefficient of CDOM. The Kara Sea is characterized by abundant river runoff from the Ob and Yenisei rivers, which carries out the CDOM [52,53,54]. A regional algorithm [45] was developed to estimate the CDOM absorption coefficient in the Kara Sea using satellite ocean color scanner data, the application of which gives an opportunity to study the dynamics of the spread of the surface desalinated layer formed by river runoff [45,55].
A separate scale has been added for this sea (in red on the right) since the values are several times higher than the measurement data obtained in other regions; the work in the Black Sea was carried out far from large rivers, the flow of small rivers brings much less CDOM into the sea than the waters of the Ob and Yenisei rivers to the Kara Sea; in the Southern Ocean, the CDOM content is significantly lower than in other areas of the World Ocean [56,57].
The spectral slopes of the CDOM absorption coefficient were 0.02, 0.016, and 0.011 for the Kara Sea, Black Sea, and Southern Ocean, respectively. These values are consistent with the literature data [1,3]; their differences are caused by the different origins of CDOM in the selected water areas, which makes it possible to use this parameter to analyze the origin of CDOM.
Particulate absorption spectra allow estimating chlorophyll-a (the principal pigment in phytoplankton) concentration in seawater, which has long been used as an index of phytoplankton biomass in bio-optical models and remote sensing algorithms [58]. Chlorophyll-a concentration calculated via the method [59] was 0.2 and 3.07 mg/m3, according to direct determinations of 0.3 and 2.7 for the Black Sea and the Southern Ocean, respectively. For the Kara Sea, calculations are impossible due to the significant amount of terrigenous suspension, and direct determinations have not been made there.

4. Discussion

Despite the fact that the calculations of the light field parameters via the Monte Carlo method in the integrating sphere developed for the determination of the seawater absorption coefficient were carried out several decades ago [23], the ICAM instrument [21], which we use regularly during ship expeditions, possesses unique characteristics. The results obtained for other devices cannot be applied to our integrating sphere. In our calculations, we evaluated the applicability of the Lambertian and diffusion approximations, considered the influence of the air layer between quartz and fluorilon, and also demonstrated the restricted applicability of mirror-coated integrating spheres for measuring seawater light absorption coefficients.
The manufacture of integrating spheres with mirror walls is simpler and cheaper than the manufacture of spheres made of fluorilon. However, the use of mirror spheres is associated with methodological difficulties. In order to determine the absorption coefficient using such spheres, it is necessary to know the exact value of the scattering coefficient, the measurement of which in itself is a rather difficult task in itself. An error in determining the absorption coefficient without taking into account scattering parameters can lead to an error of hundreds of percent. As a recommendation for the use of such a measurement scheme, we can suggest a method of adding a light-scattering additive (suspension) with a known scattering coefficient and low absorption to a seawater sample. Examples of the use of the Maalox suspension in hydro-optical measurements can be found in references [60,61].
Section 3.2 demonstrates that in the case of an integrating sphere made of fluorilon, the use of different scattering phase functions does not affect the result of the calculation. The phase function of Petzold [34], Kopelevich [35], or Henyey–Greenstein [36] with different mean cosines was used for the analysis. At the same time, for other configurations of the integrating sphere, for example, used in studying the optical properties of blood [62], the choice of the scattering phase function in the Monte Carlo simulation had a significant impact on the derived values.
The results of numerical simulations In Section 3.3 showed that the use of the Lambertian approximation for the instrument configuration used by us makes it possible to reduce the calculation time by two orders of magnitude. The relative error was less than 1%. Hanssen, in 1996 [63], showed that the effects of non-Lambertian surfaces on integrating sphere measurements could bring significant measurement error.
The existence of an interlayer between quartz and fluorilon, due to the non-ideal surface of fluorilon, increases the intensity of the output signal (Section 3.4). This can be explained by the fact that the effective reflection coefficient at the quartz–fluorilon interface is significantly higher in the presence of an air layer, which increases the probability for a photon to enter the exit hole after multiple reflections inside the quartz shell. These processes are not taken into account in configurations without a quartz shell [64,65,66,67,68].
In Section 3.5, the applicability of the diffusion approximation in the Monte Carlo calculations of the light field in the ICAM is shown, and a power-law dependence between the albedo and the transport scattering coefficient σ t r is obtained. This relationship is necessary for further research: calibration of the integrating sphere concerning a single parameter—albedo. At the moment, the calibration implies three coefficients, k 0 λ ,   u λ ,   and   v λ , to calculate the light absorption coefficient of seawater in the integrating sphere through the ratio of the signals of the filled and empty sphere [2]. A similar approach has been used previously in [20]. Note that in the case of our device, the calibration coefficients depend on the selected absorption interval, which complicates the calibration.
The performed calculations of the dependences of the signal on the seawater absorption coefficient can become the basis for calibrating the integrating sphere. The results of Monte Carlo calculations show that the dependence of the value P = I/I0, where I and I0 are the power of the measured and input light fluxes, respectively, on the absorption coefficient a is determined using a single parameter, for example, the albedo of the Lambertian surface A. This means that it is possible to build a lookup table P(a,A) for all values of the parameters a and A that are of interest to us. At the same time, it should be noted that the value of I0 and its dependence on the wavelength λ is not known; therefore, reference measurements with the empty sphere or reference solution should be provided. Namely, while data processing, we use not P(a,A), but F(a,A) = P(a,A)/Pes(A), where Pes(A) is I/I0 for an empty sphere. Assuming that albedo spectral dependence A(λ) is known, for each wavelength, we can solve the equation as follows:
f a λ , A λ = I λ I e s λ
for the parameter a(λ). Here, I(λ) and Ies(λ) are intensities of the output radiation flux for seawater-filled and empty spheres, respectively.
To find the spectral dependence of A(λ), a special experiment with ICAM should be performed. With a result of measurements for a solution with known spectral dependence of absorption coefficient, one can solve Equation (5) for A(λ).

5. Conclusions

Performed numerical simulation of a light field structure in an integrating sphere via the Monte Carlo method showed the possibility of using our ICAM instrument to estimate seawater absorption parameters. This device differs from many other integrating spheres by the absence of spherical symmetry and the presence of a quartz shell. This article shows that these design features do not affect the accuracy of absorption measurements since scattering in a seawater sample does not affect the measured signal. All calculations were performed for the dimensionless parameter a R ( R is the radius of the sphere), which makes the results obtained universal. This can be used in the design of integrating spheres for liquids with different absorption coefficients and corresponding sphere radii, which may be of interest to the optics and photonics world.
Our ICAM sphere is regularly used on SIO RAS cruises. Their results are used to assess bioproductivity and heat balance [2] of different water areas as well as for the development and modification of regional satellite algorithms [28,32,69]. The results can be used to study various oceanographic processes: inter-annual variability of the seawater light absorption in the surface layer of the northeastern Black Sea [52], CDOM distribution in the White Sea [70], seasonal variation of the satellite-derived phytoplankton primary production in the Kara Sea [71], suspended matter distribution in the south-eastern Baltic [72], and White seas [73,74], among other examples.

Author Contributions

Conceptualization, D.G. and S.S.; methodology, S.P., S.S. and D.G.; software, S.S. and A.Y.; validation, S.S. and A.Y.; formal analysis, S.S. and A.Y.; investigation, D.G.; resources, D.G.; data curation, S.S.; writing—original draft preparation, A.Y.; writing—review and editing, A.Y., D.G., and S.S.; visualization, A.Y.; supervision, D.G.; project administration, D.G.; funding acquisition, D.G. All authors have read and agreed to the published version of the manuscript.

Funding

Shipboard data retrieval was carried out as part of the state assignment of SIO RAS (theme No. FMWE-2021-0001). Calculations of the light field in an integrating sphere via the Monte Carlo method were performed with financial support through a grant from the Ministry of Education and Science of Russia (No. 075-15-2021-934). (The study of anthropogenic and natural factors of changes in the composition of air and environmental objects in Siberia and the Russian sector of the Arctic in conditions of rapid climate change using the Tu-134 Optik flying laboratory). Calculations of the light absorption coefficient of seawater and its components were funded by the Russian Science Foundation (research project 21-77-10059).

Institutional Review Board Statement

Not applicable.

Informed Consent Statement

Informed consent was obtained from all subjects involved in this study.

Data Availability Statement

Not applicable.

Acknowledgments

We are grateful to Moiseeva N.A. and Salyuk P.A. for their help with the measurements of the light absorption coefficient by seawater in the Southern Ocean.

Conflicts of Interest

The authors declare no conflict of interest.

References

  1. Shifrin, K.S. Physical Optics of Ocean Water; Springer Science & Business Media: Berlin/Heidelberg, Germany, 1998. [Google Scholar]
  2. Glukhovets, D.I.; Sheberstov, S.V.; Kopelevich, O.V.; Zaytseva, A.F.; Pogosyan, S.I. Measuring the sea water absorption factor using integrating sphere. Light Eng. 2018, 26, 120–126. [Google Scholar] [CrossRef]
  3. Mobley, C. The Oceanic Optics Book. 2022. Available online: https://ioccg.org/wp-content/uploads/2022/01/mobley-oceanicopticsbook.pdf (accessed on 24 January 2022).
  4. Duarte, C.M.; Lenton, T.M.; Wadhams, P.; Wassmann, P. Abrupt climate change in the Arctic. Nat. Clim. Chang. 2012, 2, 60–62. [Google Scholar] [CrossRef]
  5. Gulev, S.K.; Thorne, P.W.; Ahn, J.; Dentener, F.J.; Domingues, C.M.; Gerland, S.; Gong, D.; Kaufman, D.S.; Nnamchi, H.C.; Vose, R.S.; et al. Changing state of the climate system. In Climate Change 2021: The Physical Science Basis. Contribution of Working Group I to the Sixth Assessment Report of the Intergovernmental Panel on Climate Change; Natural Environment Research Council: Swindon, UK; New York, NY, USA; Cambridge University Press: Cambridge, UK, 2021; pp. 287–422. [Google Scholar]
  6. Perovich, D.K.; Jones, K.F.; Light, B.; Eicken, H.; Markus, T.; Stroeve, J.; Lindsay, R. Solar partitioning in a changing Arctic sea-ice cover. Ann. Glaciol. 2011, 52, 192–196. [Google Scholar] [CrossRef]
  7. Stroeve, J.C.; Markus, T.; Boisvert, L.; Miller, J.; Barrett, A. Changes in Arctic melt season and implications for sea ice loss. Geophys. Res. Lett. 2014, 41, 1216–1225. [Google Scholar] [CrossRef]
  8. Kirk, J.T.O. Light and Photosynthesis in Aquatic Ecosystems; Cambridge University Press: Cambridge, UK, 1994. [Google Scholar]
  9. Kopelevich, O.V.; Sheberstov, S.V.; Burenkov, V.I.; Vazyulya, S.V.; Likhacheva, M.V. Assessment of underwater irradiance and absorption of solar radiation at water column from satellite data. In Proceedings of the Current Research on Remote Sensing, Laser Probing, and Imagery in Natural Waters SPIE, Moscow, Russian, 13 April 2007; Volume 6615, pp. 56–66. [Google Scholar] [CrossRef]
  10. Suslin, V.V.; Korolev, S.N.; Kucheryaviy, A.A.; Churilova, T.Y.; Krivenko, O.V. Photosynthetically available radiation on surface of the Black Sea based on ocean color data. In Proceedings of the Proc. SPIE 9680, 21st International Symposium Atmospheric and Ocean Optics: Atmospheric Physics SPIE, 96800T (19 November 2015), Tomsk, Russia, 22–26 June 2015; Volume 9680, pp. 159–164. [Google Scholar] [CrossRef]
  11. Kopelevich, O.V.; Vazyulya, S.V.; Grigoriev, A.V.; Khrapko, A.N.; Sheberstov, S.V.; Sahling, I.V. Penetration of visible solar radiation in waters of the Barents Sea depending on cloudiness and coccolithophore blooms. Oceanology 2017, 57, 402–409. [Google Scholar] [CrossRef]
  12. Fox, J.; Kramer, S.J.; Graff, J.R.; Behrenfeld, M.J.; Boss, E.; Tilstone, G.; Halsey, K.H. An absorption-based approach to improved estimates of phytoplankton biomass and net primary production. Limnol. Oceanogr. Lett. 2022, 7, 419–426. [Google Scholar] [CrossRef]
  13. Ciotti, A.M.; Lewis, M.R.; Cullen, J.J. Assessment of the relationships between dominant cell size in natural phytoplankton communities and the spectral shape of the absorption coefficient. Limnol. Oceanogr. 2002, 47, 404–417. [Google Scholar] [CrossRef]
  14. Pogosyan, S.I.; Zaitseva, A.F. Review of existing optical methods for determining in situ pigment phytoplankton composition. Water Chem. Ecol. 2015, 11, 35–43. (In Russian) [Google Scholar]
  15. Churilova, T.; Suslin, V.; Krivenko, O.; Efimova, T.; Moiseeva, N.; Mukhanov, V.; Smirnova, L. Light absorption by phytoplankton in the upper mixed layer of the Black Sea: Seasonality and parametrization. Front. Mar. Sci. 2017, 4, 90. [Google Scholar] [CrossRef]
  16. Ahn, Y.H.; Shanmugam, P. Detecting the red tide algal blooms from satellite ocean color observations in optically complex Northeast-Asia Coastal waters. Remote Sens. Environ. 2006, 103, 419–437. [Google Scholar] [CrossRef]
  17. Kopelevich, O.; Burenkov, V.; Sheberstov, S.; Vazyulya, S.; Kravchishina, M.; Pautova, L.; Silkin, V.; Artemiev, V.; Grigoriev, A. Satellite monitoring of coccolithophore blooms in the Black Sea from ocean color data. Remote Sens. Environ. 2014, 146, 113–123. [Google Scholar] [CrossRef]
  18. Richetta, P.J. Theory of Absorption and Scattering within Integrating Spheres. JOSA 1965, 55, 21–26. [Google Scholar] [CrossRef]
  19. Fry, E.S.; Kattawar, G.W.; Pope, R.M. Integrating cavity absorption meter. Appl. Opt. 1992, 31, 2055–2065. [Google Scholar] [CrossRef] [PubMed]
  20. Jávorfi, T.; Erostyák, J.; Gál, J.; Buzády, A.; Menczel, L.; Garab, G.; Naqvi, K.R. Quantitative spectrophotometry using integrating cavities. J. Photochem. Photobiol. B Biol. 2006, 82, 127–131. [Google Scholar] [CrossRef]
  21. Pogosyan, S.I.; Durgaryan, A.M.; Konyukhov, I.V.; Chivkunova, O.B.; Merzlyak, M.N. Absorption spectroscopy of microalgae, cyanobacteria, and dissolved organic matter: Measurements in an integrating sphere cavity. Oceanology 2009, 49, 866–871. [Google Scholar] [CrossRef]
  22. Available online: https://aviantechnologies.com/product/fluorilon-99wtm (accessed on 22 January 2022).
  23. Kirk, J.T.O. Modeling the performance of an integrating-cavity absorption meter: Theory and calculations for a spherical cavity. Appl. Opt. 1995, 34, 4397–4408. [Google Scholar] [CrossRef]
  24. Prokhorov, A.V.; Sapritsky, V.I.; Mekhontsev, S.N. Modeling of integrating spheres for photometric and radiometric applications. Opt. Radiat. Meas. III SPIE 1996, 2815, 118–125. [Google Scholar] [CrossRef]
  25. Rehman, A.; Ahmad, I.; Qureshi, S.A. Biomedical applications of integrating sphere: A review. Photodiagnosis Photodyn. Ther. 2020, 31, 101712. [Google Scholar] [CrossRef]
  26. Hu, D.; Sun, T.; Yao, L.; Yang, Z.; Wang, A.; Ying, Y. Monte Carlo: A flexible and accurate technique for modeling light transport in food and agricultural products. Trends Food Sci. Technol. 2020, 102, 280–290. [Google Scholar] [CrossRef]
  27. Glukhovets, D.I.; Kopelevich, O.V.; Sahling, I.V.; Artemiev, V.A.; Pautova, L.A.; Lange, E.K.; Kravchishina, M.D. Biooptical characteristics of the surface layer of the Baltic, Norwegian, and Barents seas in summer 2014–2016 from shipboard and satellite data. Oceanology 2017, 57, 410–418. [Google Scholar] [CrossRef]
  28. Glukhovets, D.; Kopelevich, O.; Yushmanova, A.; Vazyulya, S.; Sheberstov, S.; Karalli, P.; Sahling, I. Evaluation of the CDOM Absorption Coefficient in the Arctic Seas Based on Sentinel-3 OLCI Data. Remote Sens. 2020, 12, 3210. [Google Scholar] [CrossRef]
  29. Glukhovets, D.I.; Salyuk, P.A.; Artemiev, V.A.; Shtraikhert, E.A.; Zakharkov, S.P. Variability of bio-optical characteristics of surface water layer during transatlantic transect in 2019–2020. Oceanology 2021, 61, 872–880. [Google Scholar] [CrossRef]
  30. Glukhovets, D.; Sheberstov, S.; Vazyulya, S.; Yushmanova, A.; Salyuk, P.; Sahling, I.; Aglova, E. Influence of the Accuracy of Chlorophyll-Retrieval Algorithms on the Estimation of Solar Radiation Absorbed in the Barents Sea. Remote Sens. 2022, 14, 4995. [Google Scholar] [CrossRef]
  31. Yushmanova, A.V.; Glukhovets, D.I.; Khlebopashev, P.V.; Polukhin, A.A.; Seliverstova, A.M.; Zuev, O.A. Results of hydroptical and hydrochemical investigations of the surface layer of water obtained at the transition from the Baltic to the White Sea in June 2021. In Proceedings of the 28th International Symposium on Atmospheric and Ocean Optics: Atmospheric Physics SPIE, Tomsk, Russia, 4–8 July 2022; Volume 12341, pp. 964–968. [Google Scholar] [CrossRef]
  32. Yushmanova, A.V.; Vazyulya, S.V. Validation of satellite algorithms for calculating the absorption coefficient of colored dissolved organic matter in the Barents Sea. Sovremennye problemy distantsionnogo zondirovaniya Zemli iz kosmosa. 2022, 19, 147–158. [Google Scholar] [CrossRef]
  33. Sheberstov, S.V.; Glukhovets, D.I.; Kopelevich, O.V.; Zaitseva, A.F.; Pogosyan, S.I. Accounting of parameters of an integrating sphere in measuring the seawater absorption coefficient by ICAM method. Curr. Probl. Opt. Nat. Waters 2017, 198–204. (In Russian) [Google Scholar]
  34. Petzold, T.J. Volume Scattering Functions for Selected Ocean Waters; Scripps Institution of Oceanography La Jolla Ca Visibility Lab: UC San Diego, CA, USA, 1972; Available online: https://apps.dtic.mil/dtic/tr/fulltext/u2/753474.pdf (accessed on 15 April 2020).
  35. Kopelevich, O.V. Low-parametric model of seawater optical properties. In Ocean Optics; Monin, A.S., Ed.; I: Physical Ocean Optics: Moscow, Russia, 1983; pp. 150–248. (In Russian) [Google Scholar]
  36. Henyey, L.G.; Greenstein, J.L. Diffuse radiation in the galaxy. Astrophys. J. 1941, 93, 70–83. [Google Scholar] [CrossRef]
  37. Born, M.; Wolf, E. Principles of Optics, 2nd ed.; Pergamon Press: Oxford, UK; London, UK, 1965; Volume 49, p. 485. [Google Scholar]
  38. Levin, I.M.; Kopelevich, O.V. Correlations between the inherent hydrooptical characteristics in the spectral range close to 550 nm. Oceanology 2007, 47, 344–349. [Google Scholar] [CrossRef]
  39. Ishimaru, A. Wave Propagation and Scattering in Randomly Inhomogeneous Media; I:World: Dayton, OH, USA, 1981. [Google Scholar]
  40. Morozov, E.G.; Spiridonov, V.A.; Molodtsova, T.N.; Frey, D.I.; Demidova, T.A.; Flint, M.V. Investigations of the ecosystem in the Atlantic sector of Antarctica (cruise 79 of the R/V Akademik Mstislav Keldysh). Oceanology 2020, 60, 721–723. [Google Scholar] [CrossRef]
  41. Gladyshev, S.V.; Simonova, O.A. Expeditions on ships of IO RAS 2022: Main tasks, participants, preliminary results. J. Oceanol. Res. 2022, 50, 151–202. [Google Scholar] [CrossRef]
  42. Pope, R.M.; Fry, E.S. Absorption spectrum (380–700 nm) of pure water. II. Integrating cavity measurements. Appl. Opt. 1997, 36, 8710–8723. [Google Scholar] [CrossRef]
  43. Burenkov, V.I.; Goldin, Y.A.; Kravchishina, M.D. The distribution of the suspended matter concentration in the Kara Sea in September 2007 based on ship and satellite data. Oceanology 2010, 50, 798. [Google Scholar] [CrossRef]
  44. Kravchishina, M.D.; Lein, A.Y.; Sukhanova, I.N.; Artem’Ev, V.A.; Novigatsky, A.N. Genesis and spatial distribution of suspended particulate matter concentrations in the Kara Sea during maximum reduction of the Arctic ice sheet. Oceanology 2015, 55, 623–643. [Google Scholar] [CrossRef]
  45. Vazyulya, S.V.; Kopelevich, O.V.; Sheberstov, S.V.; Artemiev, V.A. Satellite estimation of the coefficients of CDOM absorption and diffuse attenuation in the White and Kara seas. Curr. Probl. Remote Sens. Earth Space 2014, 11, 31–41. (In Russian) [Google Scholar]
  46. Churilova, T.; Moiseeva, N.; Skorokhod, E.; Efimova, T.; Buchelnikov, A.; Artemiev, V.; Salyuk, P. Parameterization of Light Absorption of Phytoplankton, Non-algal Particles and Coloured Dissolved Organic Matter in the Atlantic Region of the Southern Ocean (Austral Summer of 2020). Remote Sens. 2023, 15, 634. [Google Scholar] [CrossRef]
  47. Salyuk, P.A.; Glukhovets, D.I.; Moiseeva, N.A.; Artemiev, V.A.; Mayor, A.Y.; Khrapko, A.N. Phycoerythrin influence on the optical characteristics of seawater in the Atlantic sector of the Southern Ocean. In Proceedings of the 26th International Symposium on Atmospheric and Ocean Optics, Atmospheric Physics SPIE, Moscow, Russian, 6–10 July 2020; Volume 11560, pp. 1125–1130. [Google Scholar] [CrossRef]
  48. Six, C.; Thomas, J.C.; Garczarek, L.; Ostrowski, M.; Dufresne, A.; Blot, N.; Partensky, F. Diversity and evolution of phycobilisomes in marine Synechococcusspp.: A comparative genomics study. Genome Biol. 2007, 8, R259. [Google Scholar] [CrossRef] [PubMed]
  49. Vazyulya, S.; Deryagin, D.; Glukhovets, D.; Silkin, V.; Pautova, L. Regional Algorithm for Estimating High Coccolithophore Concentration in the Northeastern Part of the Black Sea. Remote Sens. 2023, 15, 2219. [Google Scholar] [CrossRef]
  50. Kopelevich, O.V.; Sheberstov, S.V.; Burenkov, V.I.; Vazyulya, S.V.; Pautova, L.A.; Silkin, V.A. New data about coccolithophore blooms in the Black Sea from satellite data; Current Problems in Optics of Natural Waters: Saint Petersburg, Russia, 2013; pp. 19–23. [Google Scholar]
  51. Yushmanova, A.; Kopelevich, O.; Vazyulya, S.; Sahling, I. Inter-annual variability of the seawater light absorption in surface layer of the northeastern Black Sea in connection with hydrometeorological factors. J. Mar. Sci. Eng. 2019, 7, 326. [Google Scholar] [CrossRef]
  52. Zatsepin, A.G.; Zavialov, P.O.; Kremenetskiy, V.V.; Poyarkov, S.G.; Soloviev, D.M. The upper desalinated layer in the Kara Sea. Oceanology 2010, 50, 657–667. [Google Scholar] [CrossRef]
  53. Zavialov, P.O.; Izhitskiy, A.S.; Osadchiev, A.A.; Pelevin, V.V.; Grabovskiy, A.B. The structure of thermohaline and bio-optical fields in the surface layer of the Kara Sea in September 2011. Oceanology 2015, 55, 461–471. [Google Scholar] [CrossRef]
  54. Osadchiev, A.A.; Frey, D.I.; Shchuka, S.A.; Tilinina, N.D.; Morozov, E.G.; Zavialov, P.O. Structure of the freshened surface layer in the Kara Sea during ice-free periods. J. Geophys. Res. Oceans 2021, 126, e2020JC016486. [Google Scholar] [CrossRef]
  55. Glukhovets, D.I.; Goldin, Y.A. Surface desalinated layer distribution in the Kara Sea determined by shipboard and satellite data. Oceanologia 2020, 62, 364–373. [Google Scholar] [CrossRef]
  56. Coble, P.G. Marine optical biogeochemistry: The chemistry of ocean color. Chem. Rev. 2007, 107, 402–418. [Google Scholar] [CrossRef] [PubMed]
  57. Szeto, M.; Werdell, P.J.; Moore, T.S.; Campbell, J.W. Are the world’s oceans optically different? J. Geophys. Res. Ocean. 2011, 116, C7. [Google Scholar] [CrossRef]
  58. Stramski, D.; Boss, E.; Bogucki, D.; Voss, K.J. The role of seawater constituents in light backscattering in the ocean. Prog. Oceanogr. 2004, 61, 27–56. [Google Scholar] [CrossRef]
  59. Bricaud, A.; Morel, A.; Babin, M.; Allali, K.; Claustre, H. Variations of light absorption by suspended particles with chlorophyll a concentration in oceanic (case 1) waters: Analysis and implications for bio-optical models. J. Geophys. Res. Ocean 1998, 103, 31033–31044. [Google Scholar] [CrossRef]
  60. Sullivan, J.M.; Twardowski, M.S.; Donaghay, P.L.; Freeman, S.A. Use of optical scattering to discriminate particle types in coastal waters. Appl. Opt. 2005, 44, 1667–1680. [Google Scholar] [CrossRef] [PubMed]
  61. Tian, P.; Chen, H.; Wang, P.; Liu, X.; Chen, X.; Zhou, G.; Zhang, S.; Lu, J.; Qiu, P.; Cui, X.; et al. Absorption and scattering effects of Maalox, chlorophyll, and sea salt on a micro-LED-based underwater wireless optical communication. Chin. Opt. Lett. 2019, 17, 100010. [Google Scholar] [CrossRef]
  62. Yaroslavsky, A.N.; Yaroslavsky, I.V.; Goldbach, T.; Schwarzmaier, H.J. Influence of the scattering phase function approximation on the optical properties of blood determined from the integrating sphere measurements. J. Biomed. Opt. 1999, 4, 47–53. [Google Scholar] [CrossRef]
  63. Hanssen, L.M. Effects of non-Lambertian surfaces on integrating sphere measurements. Appl. Opt. 1996, 35, 3597–3606. [Google Scholar] [CrossRef]
  64. Leathers, R.A.; Downes, T.V.; Davis, C.O. Analysis of a point-source integrating-cavity absorption meter. Appl. Opt. 2000, 39, 6118–6127. [Google Scholar] [CrossRef]
  65. Lerebourg, C.J.; Pilgrim, D.A.; Ludbrook, G.D.; Neal, R. Development of a point source integrating cavity absorption meter. J. Opt. A Pure Appl. Opt. 2002, 4, S56. [Google Scholar] [CrossRef]
  66. Röttgers, R.; Schönfeld, W.; Kipp, P.R.; Doerffer, R. Practical test of a point-source integrating cavity absorption meter: The performance of different collector assemblies. Appl. Opt. 2005, 44, 5549–5560. [Google Scholar] [CrossRef] [PubMed]
  67. Röttgers, R.; Doxaran, D.; Dupouy, C. Quantitative filter technique measurements of spectral light absorption by aquatic particles using a portable integrating cavity absorption meter (QFT-ICAM). Opt. Express 2016, 24, A1–A20. [Google Scholar] [CrossRef]
  68. Wollschläger, J.; Röttgers, R.; Petersen, W.; Zielinski, O. Stick or dye: Evaluating a solid standard calibration approach for point-source integrating cavity absorption meters (PSICAM). Front. Mar. Sci. 2019, 5, 534. [Google Scholar] [CrossRef]
  69. Kopelevich, O.V.; Sahling, I.V.; Vazyulya, S.V.; Glukhovets, D.I.; Sheberstov, S.V.; Burenkov, V.I.; Karalli, P.G.; Yushmanova, A.V. Bio-Optical Characteristics of the Seas, Surrounding the Western Part of Russia, from Data of the Satellite Ocean Color Scanners of 1998–2017; VASh FORMAT, OOO: Moscow, Russia, 2018; Available online: https://optics.ocean.ru/ (accessed on 22 November 2018). (In Russian)
  70. Zaitseva, A.F.; Konyukhov, I.V.; Kazimirko, Y.V.; Pogosyan, S.I. Optical characteristics and distribution of chromophoric dissolved organic matter in Onega Bay (White Sea) during the summer season (findings from an expedition from June 22 to 26, 2015). Oceanology 2018, 58, 233–239. [Google Scholar] [CrossRef]
  71. Demidov, A.B.; Sheberstov, S.V.; Gagarin, V.I.; Khlebopashev, P.V. Seasonal variation of the satellite-derived phytoplankton primary production in the Kara Sea. Oceanology 2017, 57, 91–104. [Google Scholar] [CrossRef]
  72. Bukanova, T.; Kopelevich, O.; Vazyulya, S.; Bubnova, E.; Sahling, I. Suspended matter distribution in the south-eastern Baltic Sea from satellite and in situ data. Int. J. Remote Sens. 2018, 39, 9317–9338. [Google Scholar] [CrossRef]
  73. Lisitzyn, A.P.; Kravchishina, M.D.; Kopelevich, O.V.; Burenkov, V.I.; Shevchenko, V.P.; Vazyulya, S.V.; Klyuvitkin, N.N.; Novigatskii, A.N.; Politova, N.V.; Sheberstov, S.V.; et al. Spatial and temporal variability in suspended particulate matter concentration within the active layer of the White Sea. In Doklady Earth Sciences; Springer Nat. BV: Berlin/Heidelberg, Germany, 2013; Volume 453, p. 1228. [Google Scholar] [CrossRef]
  74. Konyukhov, I.V.; Kotikova, A.F.; Belevich, T.A.; Ilyash, L.V.; Kravchishina, M.D.; Pogosyan, S.I. Functional Activity of Phytoplankton and Optical Properties of Suspended Particulate Matter in Onega Bay of the White Sea. Oceanology 2021, 61, 233–243. [Google Scholar] [CrossRef]
Figure 1. Scheme of the ICAM portable spectrophotometer and its picture in the laboratory of the R/V «Akademik Mstislav Keldysh».
Photonics 10 00593 g001
Figure 2. Dependence of the intensity of the output signal on the values of the absorption coefficient at different values of the scattering coefficient of the water sample for the case of a mirror sphere with different parameters of Henyey–Greenstein phase functions (a) g = 0.6 , (b) g = 0.9.
Photonics 10 00593 g002
Figure 3. Dependence of the output signal intensity on the scattering coefficient for various phase functions for the case of a mirror sphere for the absorption coefficient a = 0.02.
Photonics 10 00593 g003
Figure 4. Intensities of the output radiation flux from the integrating sphere depending on the values of the absorption coefficient for various scattering phase functions of seawater.
Photonics 10 00593 g004
Figure 5. Dependence of the intensity of the outgoing flux on the values of the absorption coefficient for the fluorilon layer and the Lambertian surface (A = 0.992).
Photonics 10 00593 g005
Figure 6. Dependence of the output signal on the values of the absorption coefficient in the presence (or absence) of an air layer in the case of a fluorilon sphere (solid lines) and a Lambertian surface with the corresponding albedo (dashed lines).
Photonics 10 00593 g006
Figure 7. Dependence of albedo A on the transport scattering coefficient σ t r with (or without) taking into account the air layer; the solid lines show the power dependence (4).
Photonics 10 00593 g007
Figure 8. Location maps of stations (red points) where seawater absorption measurements were made: the Atlantic sector of the Southern Ocean, the Black, and the Kara seas.
Photonics 10 00593 g008
Figure 9. Examples of absorption spectra of suspended particles (a) and CDOM (b) in the Atlantic sector of the Southern Ocean, the Black, and the Kara seas.
Photonics 10 00593 g009
Table 1. Standard error Re, % depending on the values of the light scattering coefficient of seawater.
b, m−10.10.20.30.40.50.7151015203040
Re, %10.815.61716.416.117.3166.41.50.70.40.80.7
Table 2. Coefficients of the correlation equation and regression parameters. R2—Pearson’s correlation coefficient, RMSE—standard deviation.
k1k2R2RMSE
air layer56.90.930.993.27 × 10−4
no air layer41.80.990.993.18 × 10−4
Table 3. The transport scattering coefficient σ t r of the diffusion approximation in fluorilon and the appropriate albedo A in the case of the Lambertian approximation: c, m−1 is the attenuation coefficient, g is the mean cosine of the scattering phase function, and ε is the discrepancy associated with the inapplicability of the Lambertian approximation; the index ‘air’ means the presence of air layer.
σ t r ,   m −1c, m−1 g Aε, %Aairεair, %
4501125600.9001.30.8204.9
4503000850.9001.90.8205.0
10002500600.9552.10.9101.8
22505625600.9791.20.9581.4
225015,000850.9791.80.9581.8
400010,000600.9881.50.9761.6
500012,500600.9911.80.9801.8
600015,000600.9921.00.9841.0
600040,000850.9921.20.9841.3
800020,000600.9941.50.9881.4
10,00025,000600.9951.30.9901.4
13,00032,500600.9962.00.9922.2
16,00040,000600.9971.20.9941.0
Disclaimer/Publisher’s Note: The statements, opinions and data contained in all publications are solely those of the individual author(s) and contributor(s) and not of MDPI and/or the editor(s). MDPI and/or the editor(s) disclaim responsibility for any injury to people or property resulting from any ideas, methods, instructions or products referred to in the content.

