Article

Crystalline Phase, Cross-Section, and Temporal Characteristics of Erbium-Ion in Lu3Ga5O12 Crystal

1
School of Mechanical Engineering, Tianjin Sino-German University of Applied Sciences, 2 Yanshan Rd, Haihe Education Park, Tianjin 300350, China
2
School of Precision Instruments and Opto-Electronics Engineering, and with Key Lab of Optoelectronic Information Technology (Ministry of Education), and Key Lab of Micro-Opto-Electro-Mechanical Systems (MOEMS) Technology (Ministry of Education), Tianjin University, Tianjin 300072, China
3
Fujian Institute of Research on the Structure of Matter, Chinese Academy of Sciences, Fuzhou 350002, China
*
Authors to whom correspondence should be addressed.
Photonics 2023, 10(5), 586; https://doi.org/10.3390/photonics10050586
Submission received: 29 March 2023 / Revised: 13 May 2023 / Accepted: 15 May 2023 / Published: 17 May 2023
(This article belongs to the Special Issue State-of-the-Art Lanthanide Luminescent Materials)

Abstract

:
An erbium-doped Lu3Ga5O12(LuGG) single crystal was grown by the Czochralski method. The crystalline phase in the grown crystal was analyzed by powder X-ray diffraction. The erbium-ion emission spectra of the crystal were acquired. The erbium-ion emission cross-section (ECS) spectrum was computed from the acquired emission spectrum. The erbium-ion absorption cross-section (ACS) spectrum was computed using the McCumber relationship. The results are discussed in contrast to those computed from the acquired absorption spectrum, and the comparison shows that both methods give consistent results. The temporal characteristics of the emissions were also studied based on 0.98 μm pulse pumping. The study shows that the infrared emissions at 1.0, 1.5, and 2.8 μm show mono-exponentially temporal behavior. Instead, the decays of two visible emissions at 0.56 and 0.67 μm show considerable non-exponential features; each trace can be fitted double-exponentially. The non-exponential behavior is associated with those erbium ions that are present in the form of clusters, which enables non-radiative upconversion depopulation and hence additional contribution to the decay through cross relaxation between the erbium ions in clusters. The study also shows that about half of the erbium ions are present in the cluster state in the studied crystal.

1. Introduction

Garnet is isotropic, belongs to a cubic system with a space group of Ia-3d (Oh10), and has been widely studied because of its attractive merits, such as higher stability in structure, mechanics, and chemistry; better thermal conductivity; lower lattice vibrational frequency; larger solidity; a broader range of transparency; easier growth of a high-quality crystal with a larger size; and a larger admittance of lanthanide ions in its lattice. A lanthanide-doped garnet enables the merging of all of these merits and photo-luminescence characteristics of lanthanide ions and is promising for uses in display, laser, and thermal sensing on the basis of fluorescence intensity ratio (FIR).
Garnet has the common molecular formula α3β2γ3O12 with (α = Lu, Gd, Y), (β = Ga, Al, Sc, Fe), and (γ = Ga, Al, Fe). It can be classified into three kinds of garnets on the basis of different γ atoms, i.e., iron-based garnet such as YIG (Y3Fe5O12), Al-based garnet such as YAG (Y3Al5O12), and gallium-based garnet, e.g., Gd3Ga5O12 and Lu3Ga5O12 (LuGG). Lanthanide-doped LuGG has all the advantages of a lanthanide-doped garnet. In recent years, studies have been performed on several lanthanide-/transition metal-doped LuGG single crystals or polycrystalline powders. The dopants concern the ions erbium [1,2,3,4,5], ytterbium [5,6,7,8,9,10], chromium [11], samarium [12], holmium [13], neodymium [14], and bismuth [15].
For the erbium-doped LuGG, preliminary spectroscopic studies have been performed on its single-crystal [1,2] and polycrystalline powder states [3,4,5], and the results show that the material is promising for implementation of an infrared laser or thermal sensor on the basis of FIR of 0.98-μm-excited 0.53 and 0.56 μm fluorescence. Both the longer lifetime (~500 μs) of the 4I11/2 (~1.0 μm) level of erbium-ion in the LuGG crystal as given below (it is only 220 μs for Er3+-doped LiNbO3 crystal [16]) and the lower lattice vibrational frequency (766 cm−1) [2] favor the 0.98-μm-excited emissions [for inorganic materials, maximum phonon frequency usually ranges from ~200 cm−1 (e.g., fluorides) to ~1500 cm−1 (such as borates). In particular, lasing at 2.8 µm has been demonstrated previously [1].
Entire spectroscopic data are necessary for the design and optimization of a laser or thermal sensor based on such a potential active material. Following an earlier Judd-Ofelt study and luminescence features [1,2], the present work aims at cross-section spectrum properties of erbium-doped LuGG in single-crystal state, which are basic spectral data and were not yet reported previously. First, near-infrared (NIR), mid-infrared (mid-IR), and visible (Vis) emission spectra of erbium-doped LuGG crystals have been acquired. Second, erbium-ion emission cross-section (ECS) spectra are computed on the basis of the acquired emission spectra. Third, the absorption cross-section (ACS) spectra are derived from two approaches. One is to use the McCumber relationship, and another is to employ the acquired absorption spectrum. A comparison is made between the results given by the two approaches. Finally, temporal features of the luminescence of the erbium ion in the studied crystal have been studied under 0.98 μm pulse excitation.

2. Experiment

The erbium-doped LuGG single crystal employed in this work was pulled by the Czochralski method. Initial materials include lutetium oxide (99.99%), gallium oxide (99.99%), and erbium oxide (99.99%). During growth, the pulling rate is similar to 1.0–1.2 mm per hour, and the rotation speed is 8–12 rounds per minute. The concentrations of erbium, lutetium, and gallium ions in the solid were given by carrying out the ICP-AES analysis, which has a relative error of 10%. The analysis gave a lutetium concentration of (10.3 ± 1.1) × 1021 ions/cm3, an erbium concentration of (2.6 ± 0.3) × 1021 ions/cm3 [~20 at% = CEr/(CEr + CLu)], and a gallium concentration of (21.5 ± 2.2) × 1021 ions/cm3.
By making use of a spectrometer (U-4100), optical absorption of erbium ions in a 1.12 ± 0.01 mm thick LuGG single-crystal plate was investigated in the wavelength range of 300–1700 nm in the case of a 1.0 nm scanning step and a 300 nm/min speed.
Vis and NIR fluorescence spectra of the erbium-doped LuGG crystal were acquired using an Edinburgh FLS980 spectrometer. Either an external continuous-wave 0.98 μm laser diode or an xenon lamp (450 W) was adopted as the pumping source. The spectra of the transitions at 0.53, 0.56, 0.67, and 1.5 μm were acquired using an external 0.98 μm laser diode as the pumping source, and that of the transition at 1.0 μm was acquired using 0.52 μm output from the xenon lamp as the pumping source. The spectrum of the transition at mid-IR (~2.8 µm) was acquired by an Edinburgh FSP920-C spectrometer, and the excitation source adopted was a 0.98 μm output from a tunable OPO nanosecond pulse laser. Figure 1 depicts erbium-ion energy levels, together with the main processes under the 0.98 μm wavelength pumping, including the NIR transition at 1.5, the mid-IR transition at 2.8 μm, and the Vis transitions at 0.53, 0.56, and 0.67 μm, mainly due to cooperative upconversion (CU) and excited state absorption (ESA).
The temporal decaying characteristics of the erbium-ion fluorescence in the LuGG single crystal under study were investigated using the Edinburgh FLS980 spectrometer for the Vis and NIR transitions and the Edinburgh FSP920-C spectrometer for the mid-IR transition. The Vis and mid-IR fluorescence was excited using the above-mentioned nanosecond pulse laser. The NIR fluorescence at 1.0 and 1.5 μm was excited by microsecond pulses emitted from a flash lamp.

3. Results and Discussion

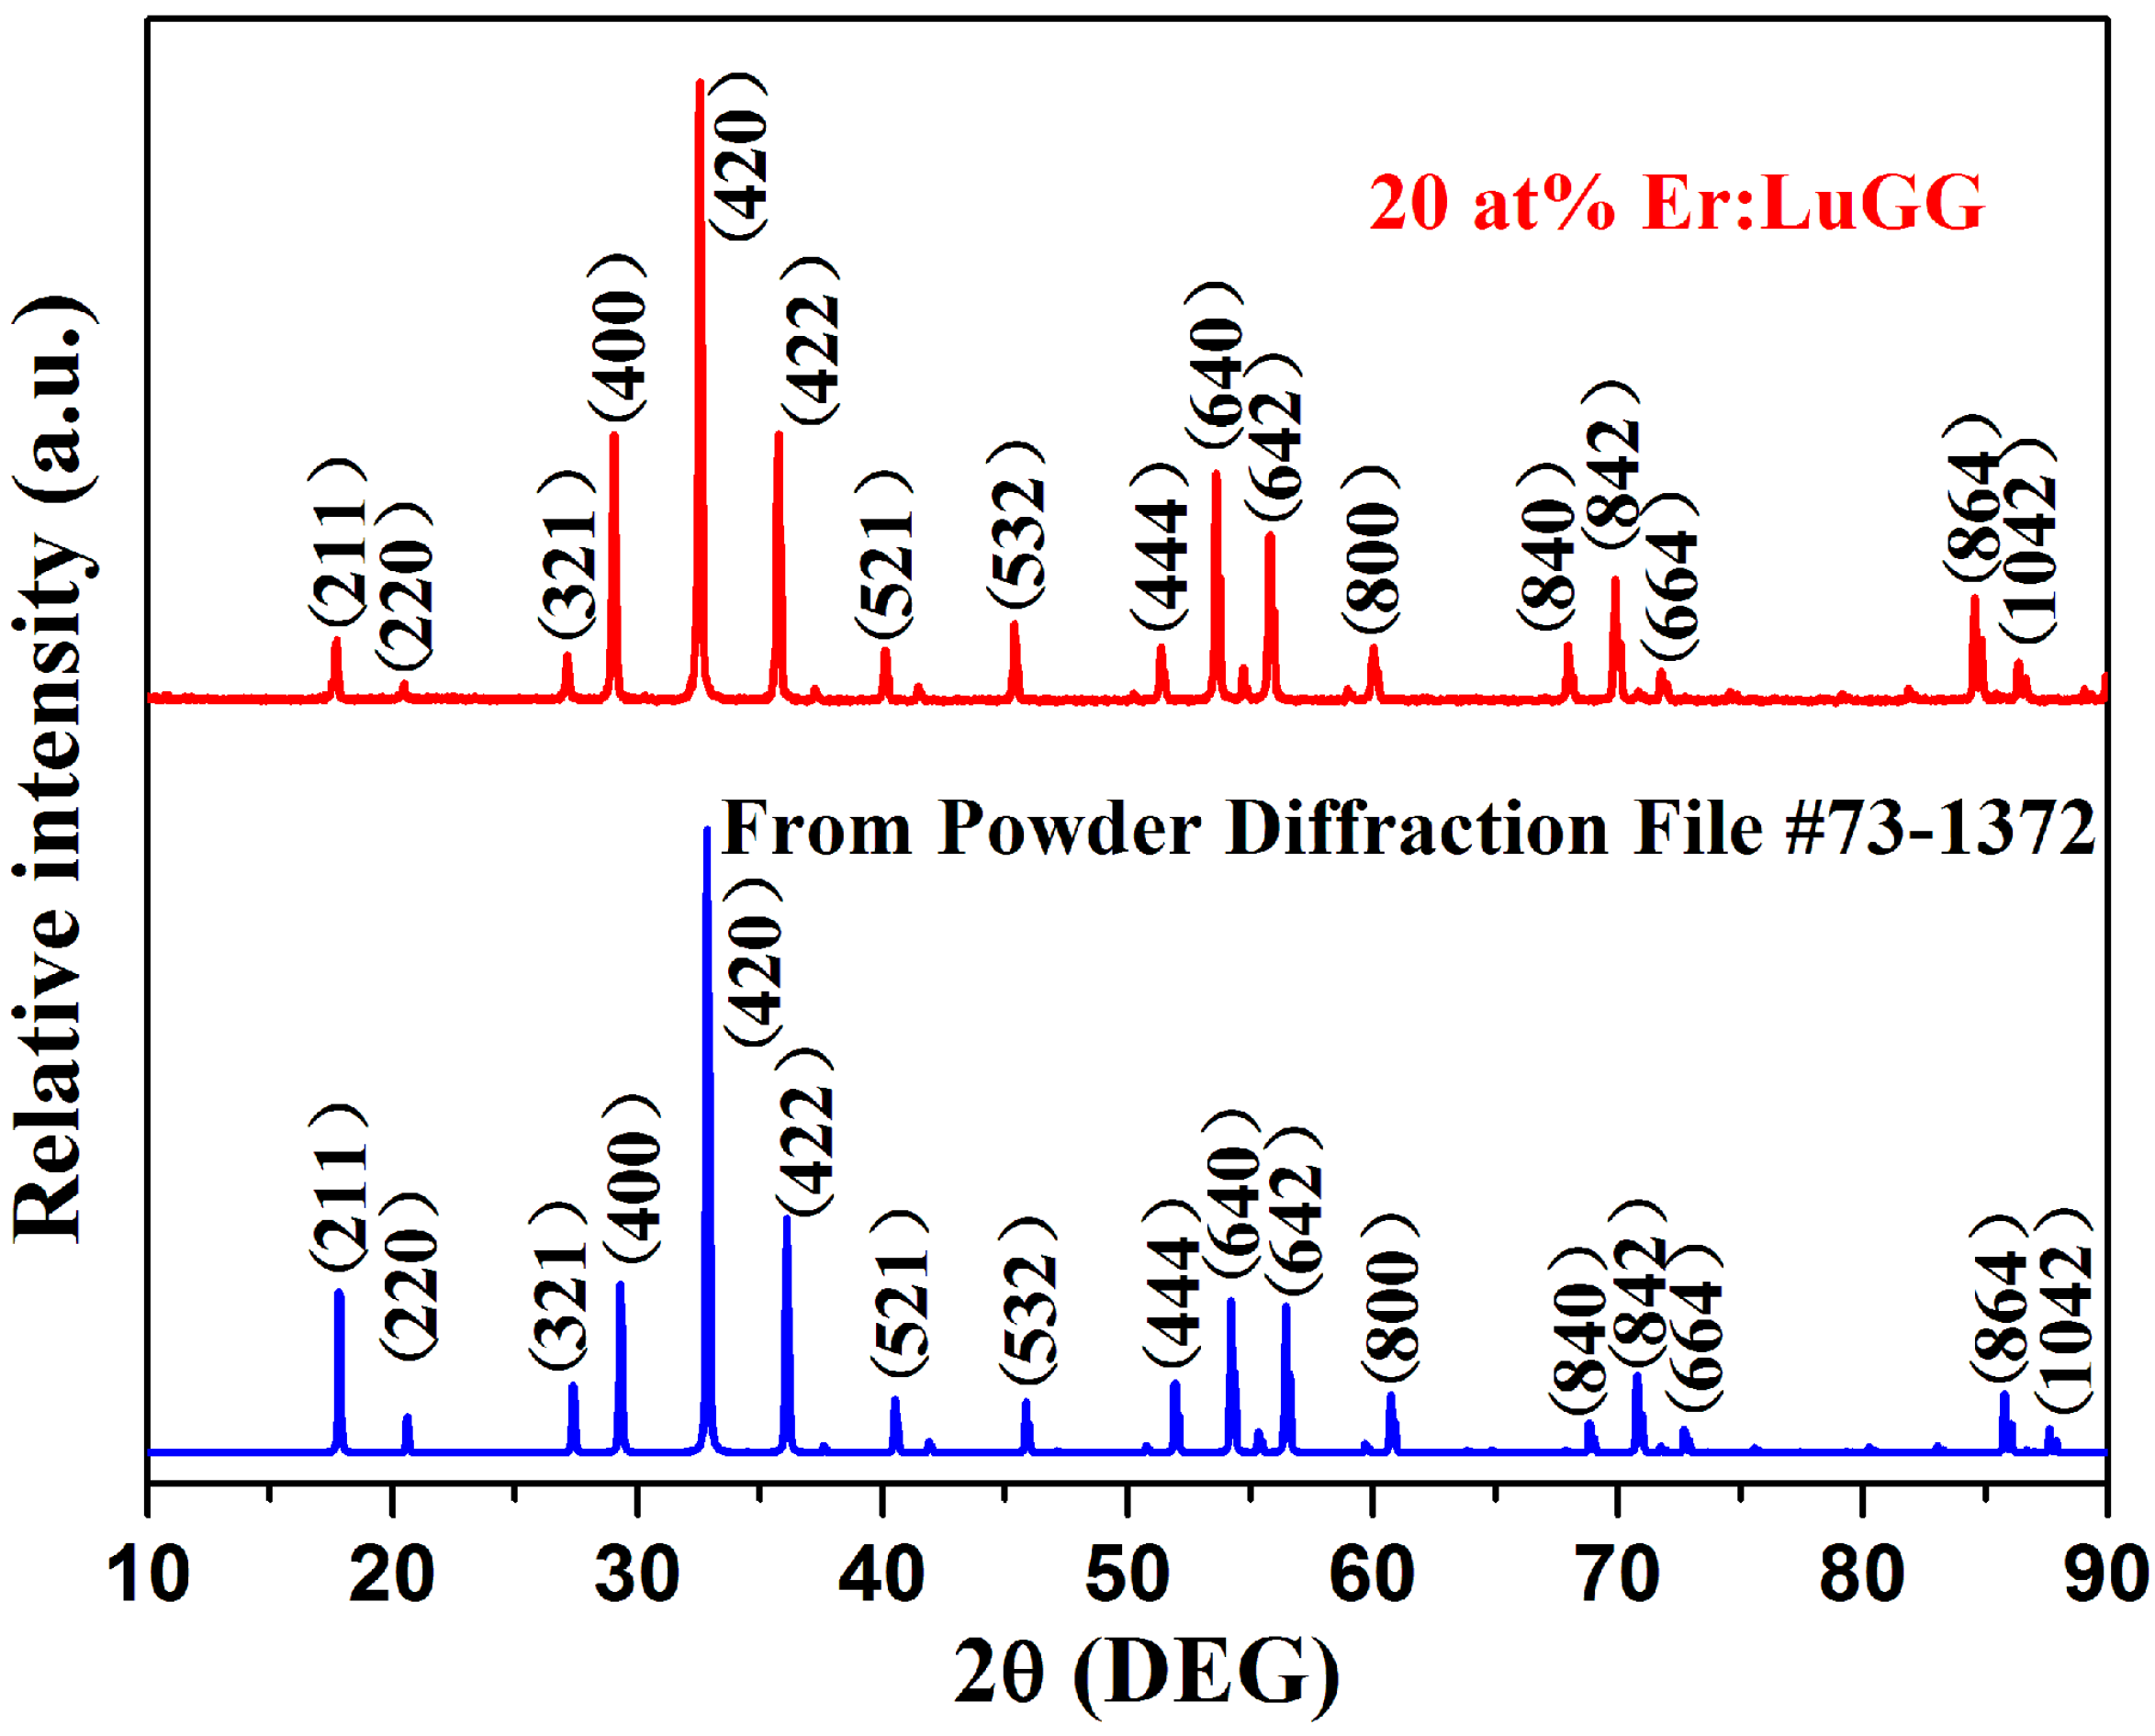
3.1. X-ray Diffraction and Crystalline Phase

The crystalline phase of the grown crystal was analyzed by powder X-ray diffraction (Rigaku D/MAX 2500). Figure 2 shows the measured pattern of the grown crystal (see the upper one). For reference purposes, the pattern of undoped LuGG crystal is also given in the lower part, and the pattern is drawn on the basis of powder diffraction file (PDF) #73-1372. All discernible reflexes are indexed. We can see that the two patterns are almost identical except for an alteration in relative intensity. It is therefore concluded that the crystal grown by us is dominated by the LuGG crystalline phase.
We note that, although the erbium-doped LuGG crystal has an erbium concentration as high as 20 at%, its X-ray diffraction pattern does not reveal a noticeable difference from that of the undoped crystal. This is due to the larger admittance of lanthanide ions in the lattice of a garnet, as mentioned in the introduction. The argument is verified by the fact that the Er3+ ion in the Lu3Ga5O12 single crystal has a segregation coefficient of ~1.0. This is because Er3+ and Lu3+ ions have close ionic radii: 0.881 Å for Er3+ and 0.848 Å for Lu3+, which cause less mismatch in the lattice. A segregation coefficient of ~1.0 means that the Er3+ concentration in the grown crystal has good uniformity, and hence the Lu3Ga5O12 has excellent admitting capability of Er3+ and is a good host material for Er3+ dopants.

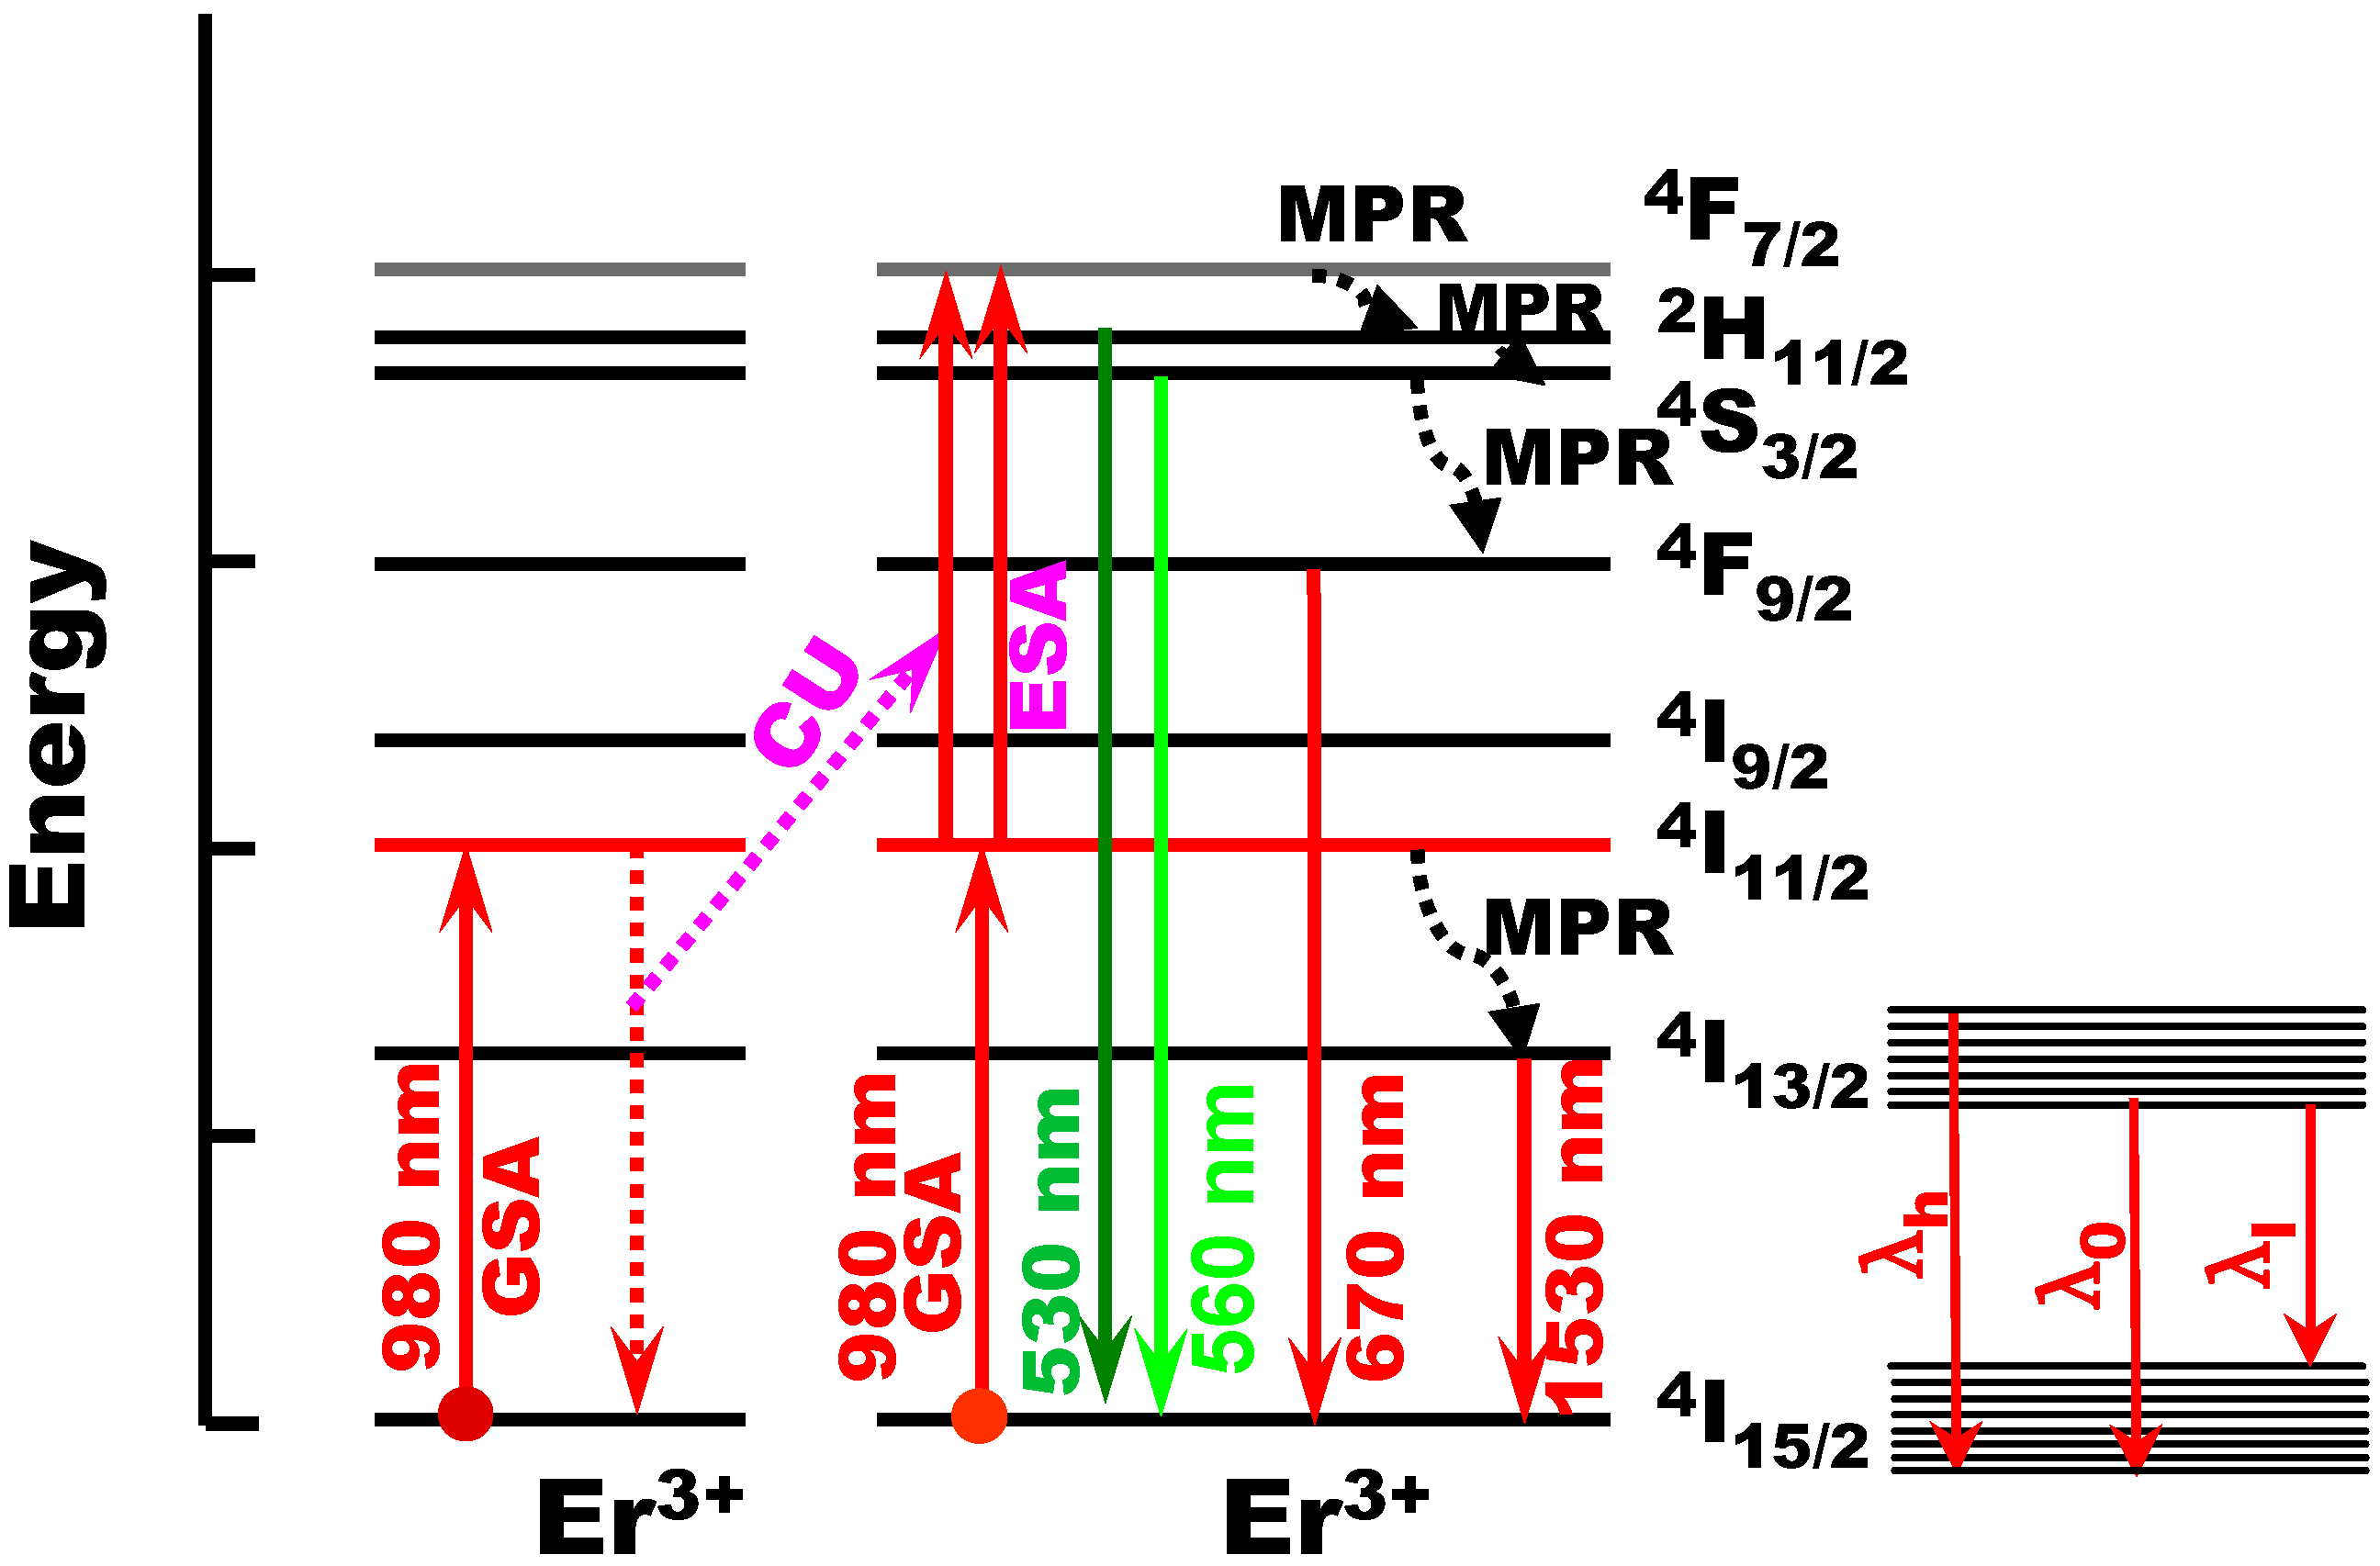
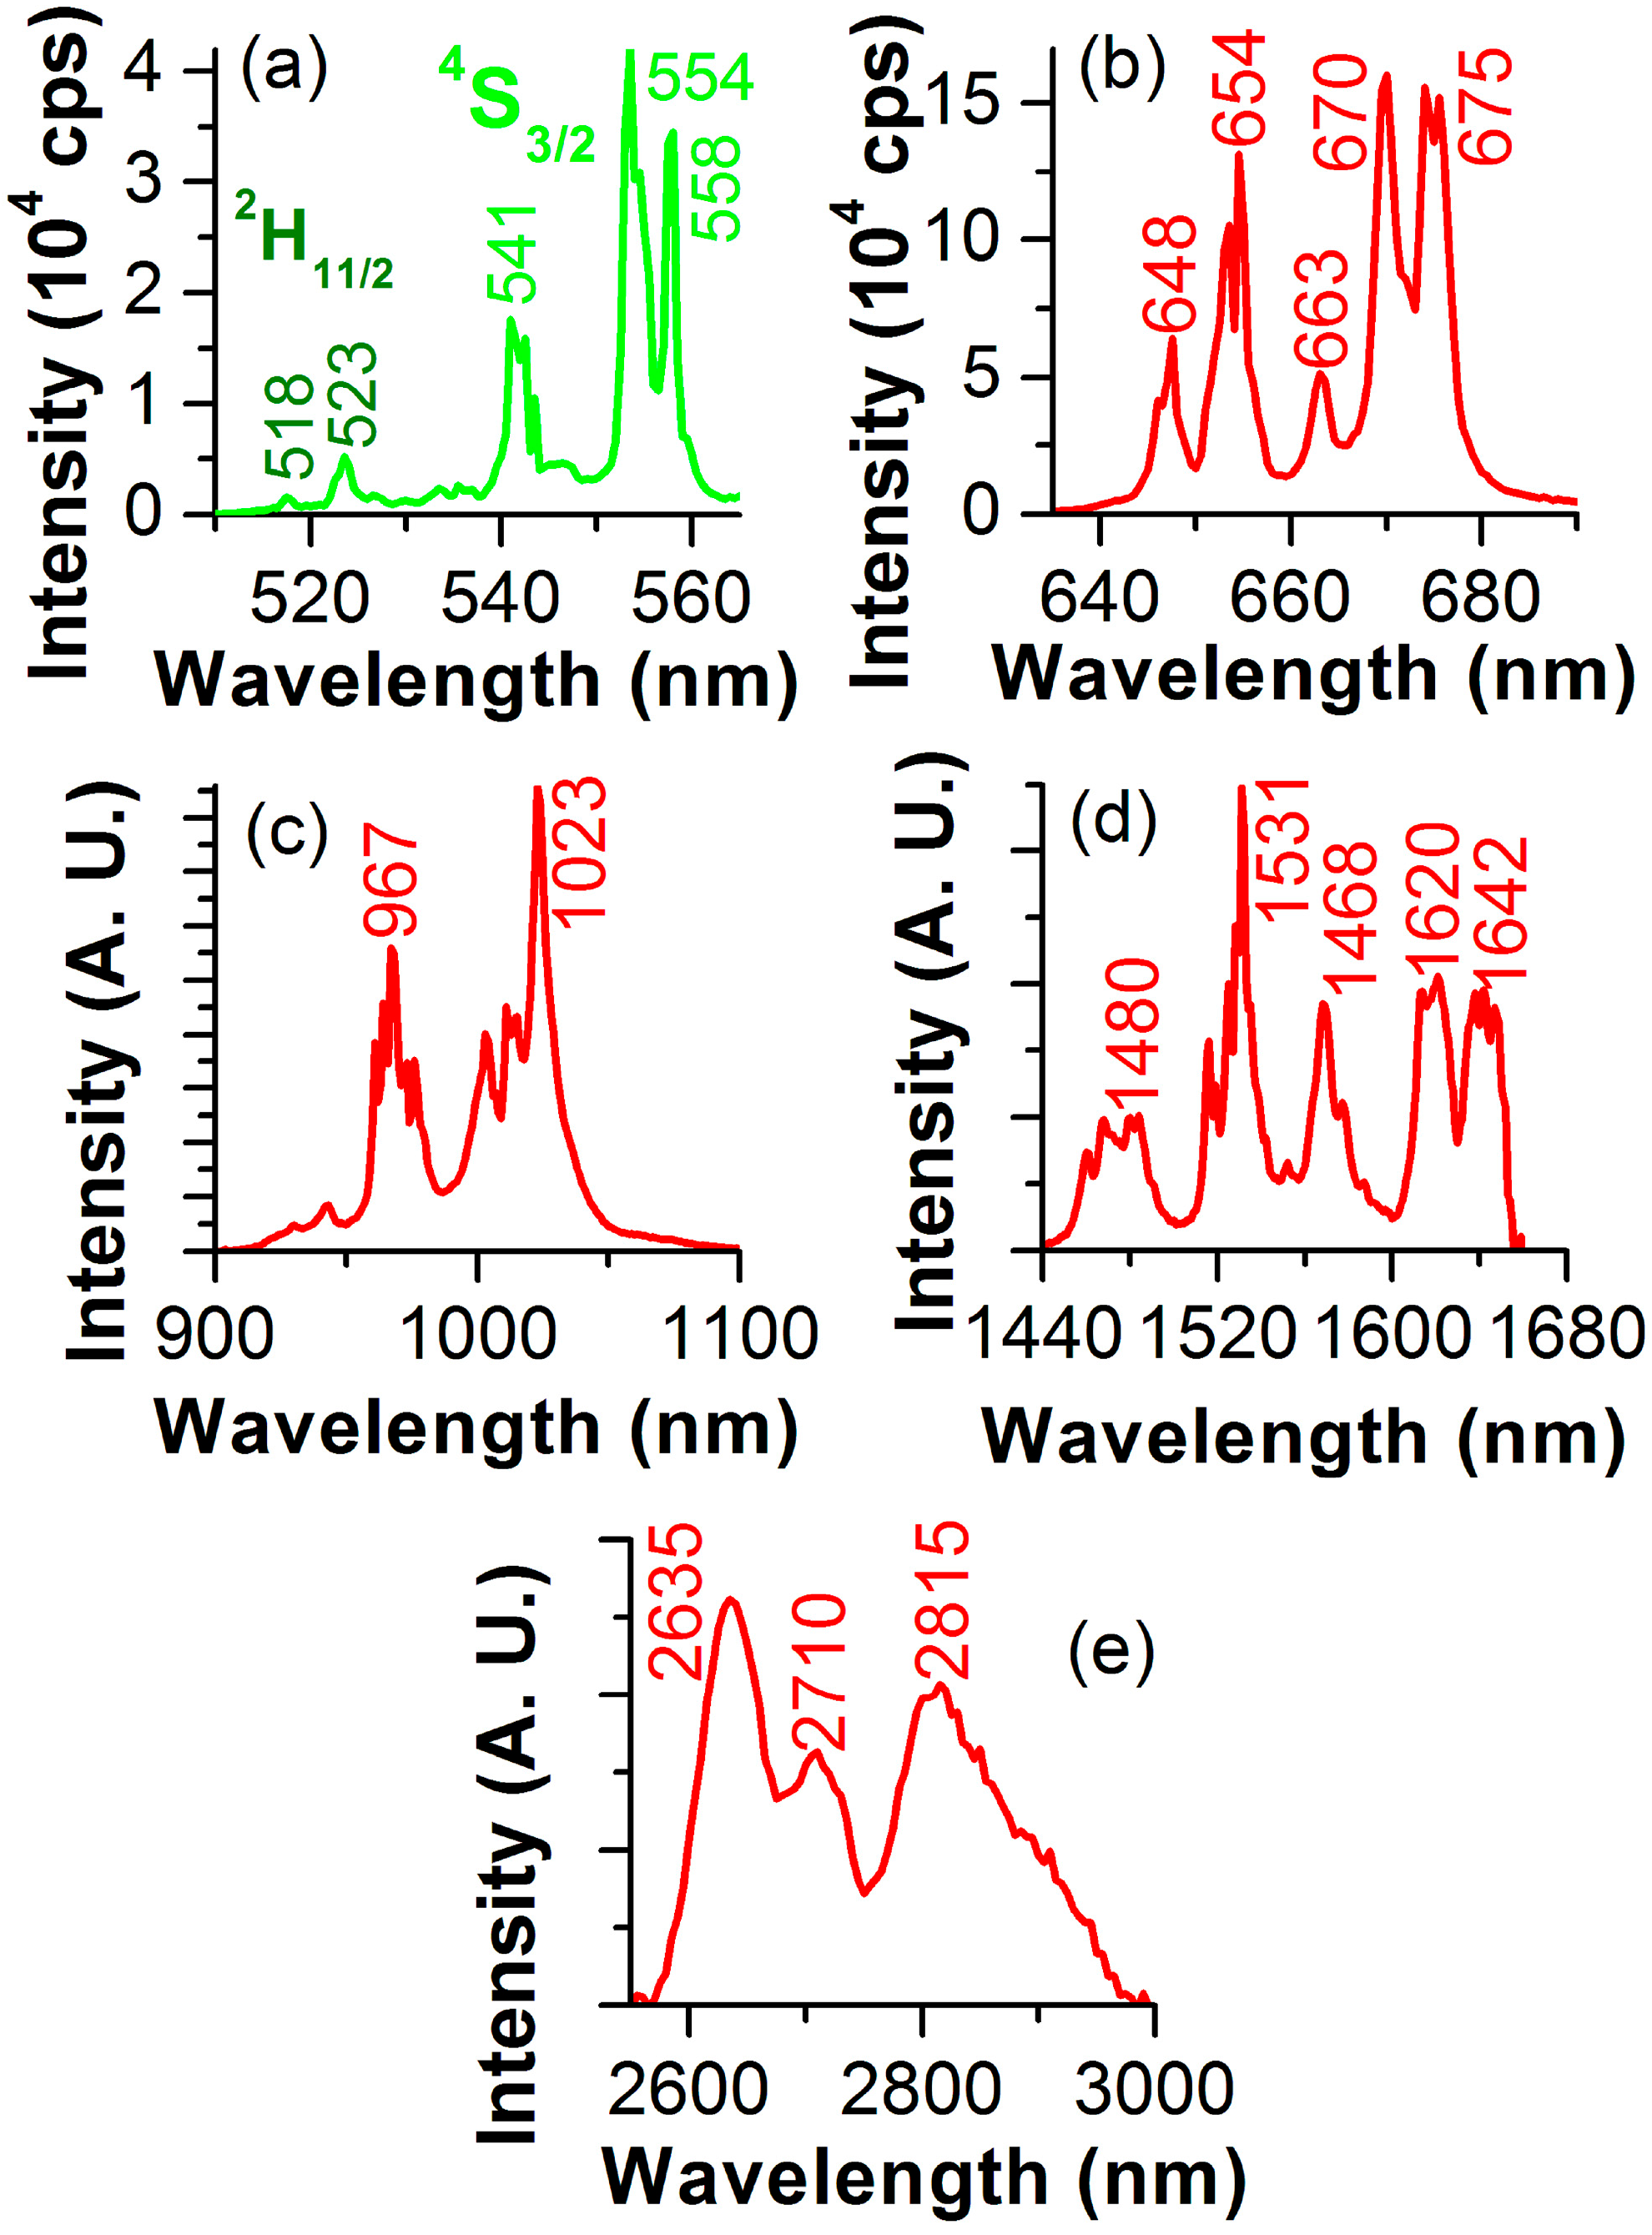
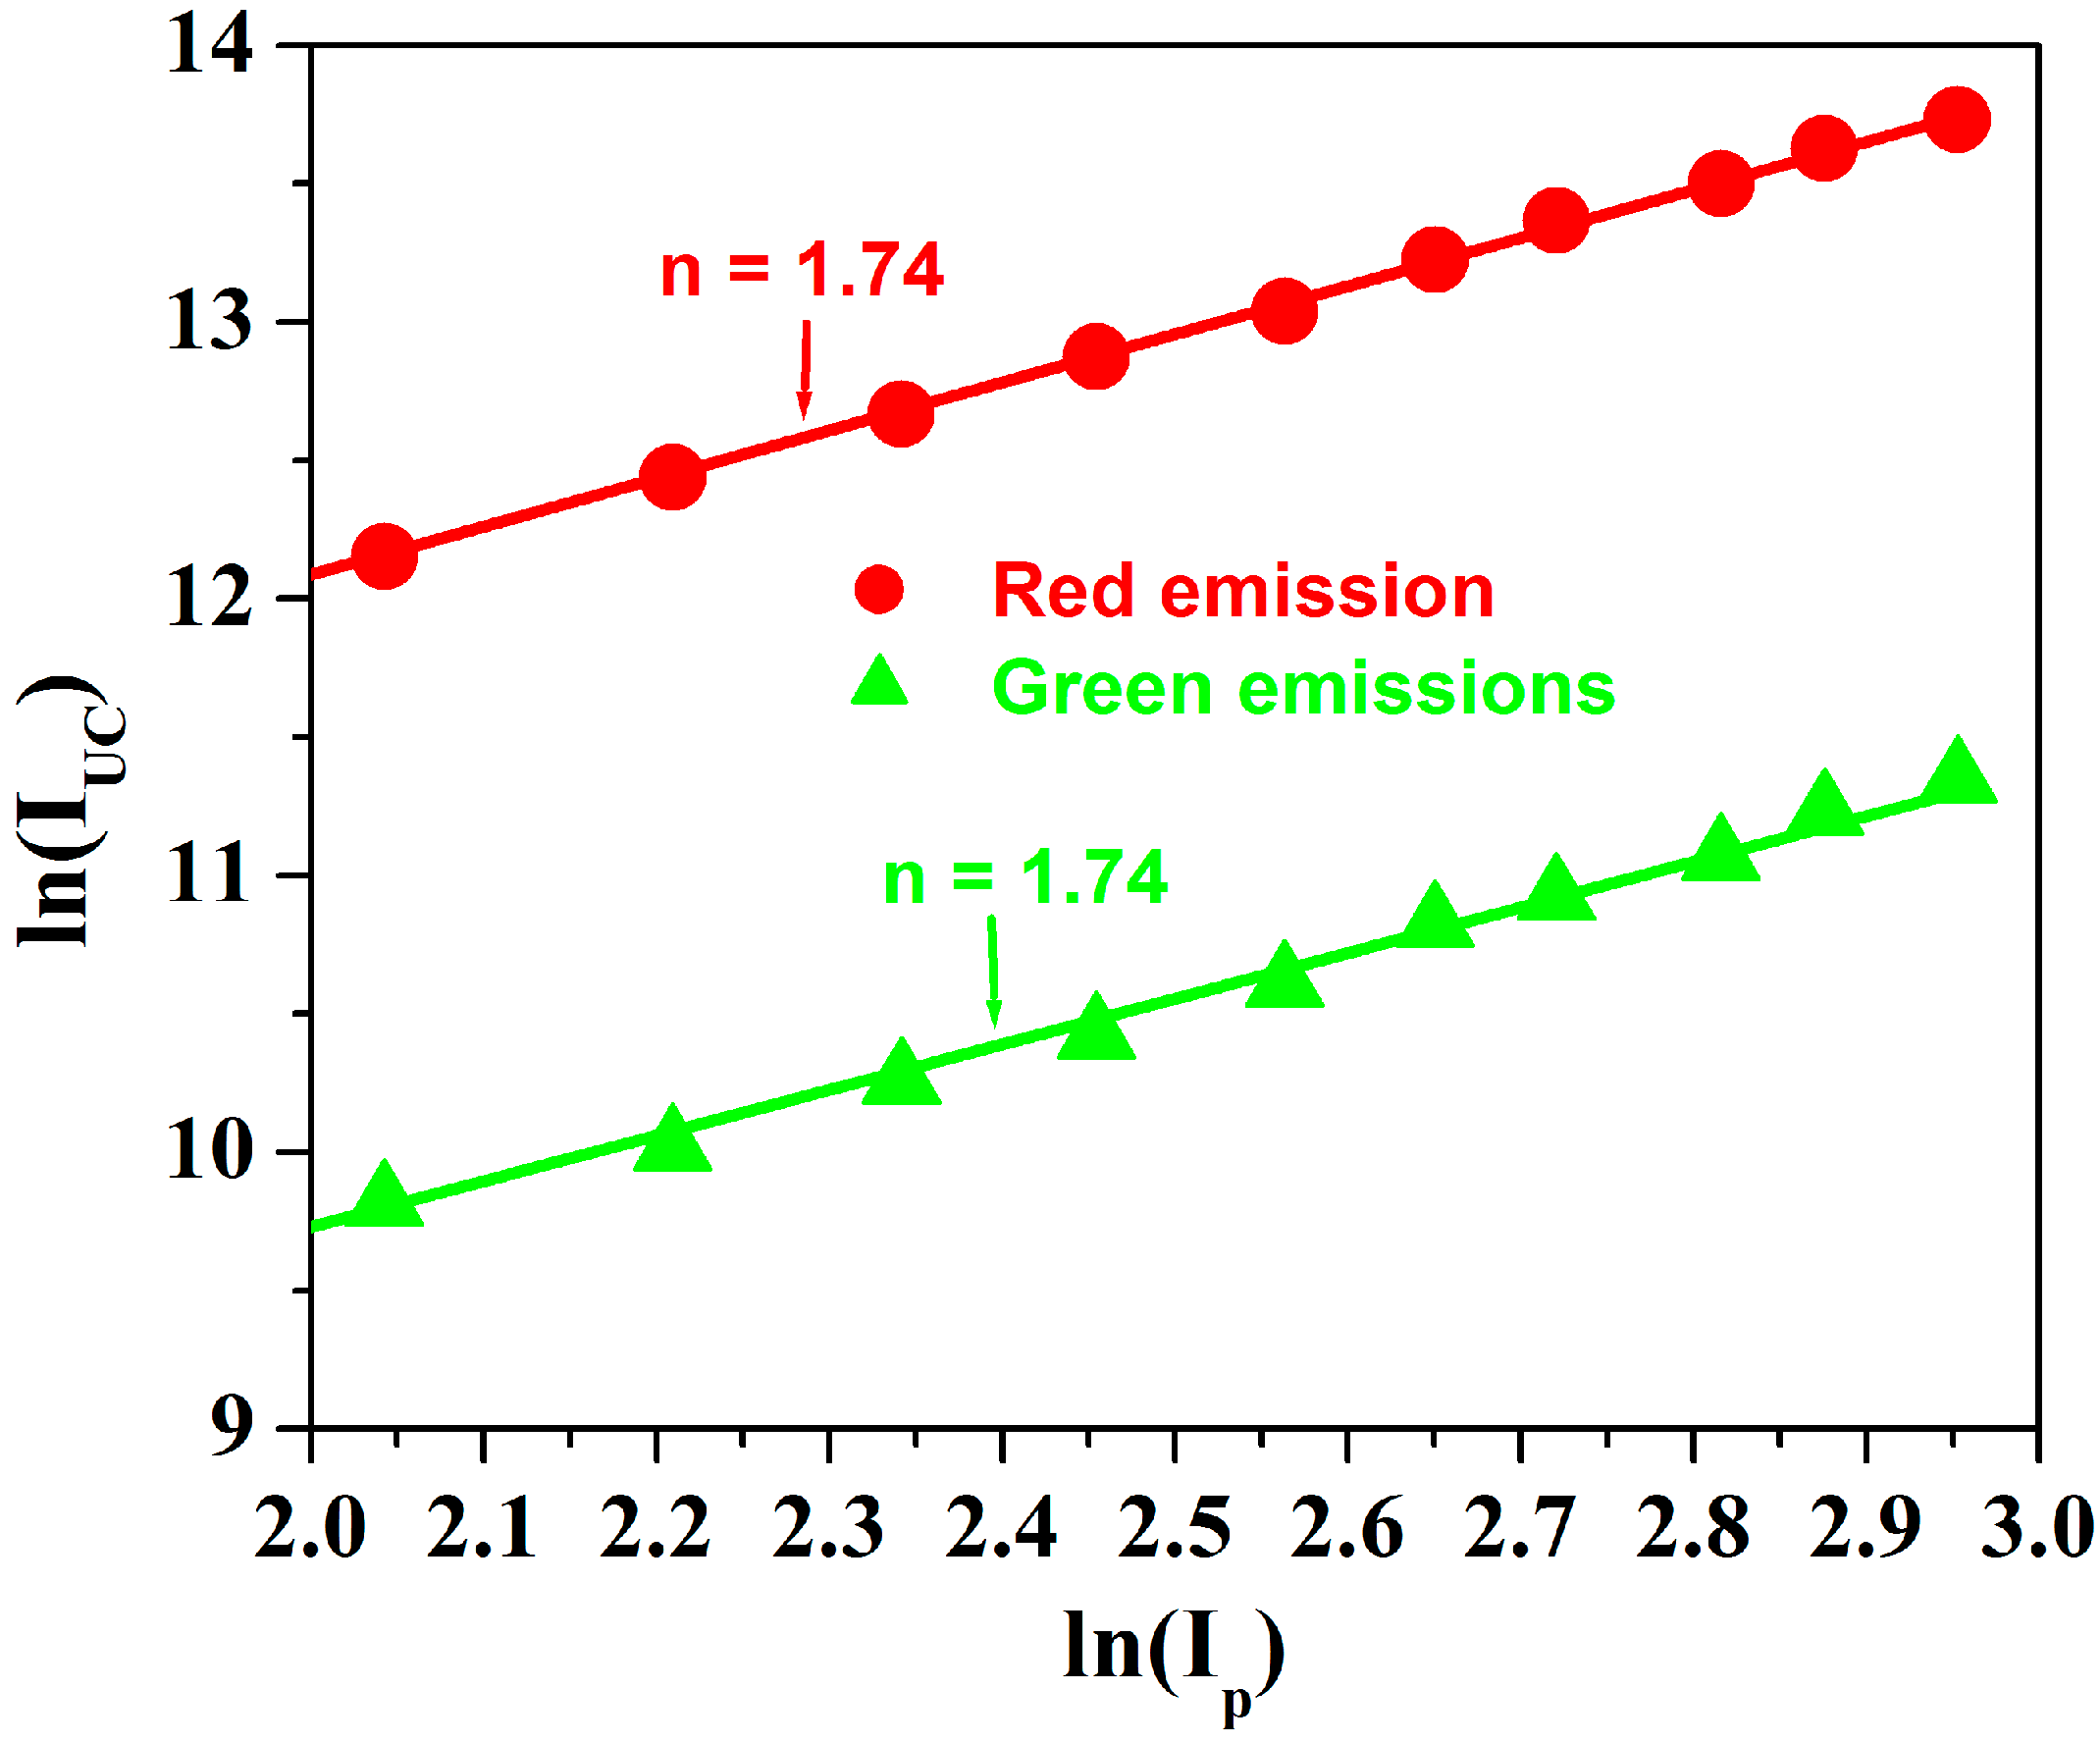
3.2. Er3+ Emission Characteristics and 980 nm Upconversion Mechanism

Figure 3a–d shows the measured emission spectra of the electronic transitions 2H11/2 ↔ (530 nm), 4S3/24I15/2 (560 nm), 4F9/24I15/2 (670 nm), 4I11/24I15/2 (1020 nm), and 4I13/24I15/2 (1530 nm) of erbium ions in the LuGG crystal. Figure 3e shows the spectrum of the mid-infrared emission at 2.8 µm, which involves a transition between two intermediate states, 4I11/2 and 4I13/2. The main emission peaks are indicated for each transition. The spectra of visible emissions at 530, 560, and 670 nm were recorded under the 980 nm wavelength excitation. These spectra originate from upconversion emissions. For the two green emissions, the spectral region of <535 nm concerns the transition 2H11/24I15/2 and that of >535 nm involves the 4S3/24I15/2 transition. The most remarkable feature of the three visible upconversion emissions is that the red emission has a maximum intensity nearly four times larger than the green emission at 560 nm, and the 560 nm emission has a maximum intensity approximately one order of magnitude larger than another green emission at 530 nm, as shown in Figure 3a,b, which were recorded under the completely same experimental condition. For the two near-infrared emissions, typical Er3+ emission spectra were recorded at the 1.0 and 1.5 µm regions. The potential lasing wavelengths there include 1023, 1531, 1568, 1620, and 1642 nm. At the 2.8 µm spectral region, three peaking emissions at 2635, 2710, and 2815 nm could be resolved, as shown in Figure 3e. Among them, lasing at the latter two wavelengths has been demonstrated [1].
To understand the upconversion mechanism, the upconversion emission intensity (IUC) was measured as a function of the density of pumping power (IP). The upconversion emission intensity IUC and the pump power IP obey the following power relationship: IUC ∝ (Ip)n, where n is the power index that determines the number of photons required to realize a specific radiative transition. The integrated intensity of each emission band on the logarithmic scale, ln(IUC), is calculated and plotted against the 980 nm excitation beam intensity on the logarithmic scale, ln(Ip). The results are shown in Figure 4. The green balls concern the two green emissions 2H11/2 ↔ (530 nm) and 4S3/24I15/2 (560 nm), and the red balls involve the red emission 4F9/24I15/2 (670 nm). A linear fit was performed on each plot, and the slope obtained from the linear fit yields the value of the power index n. The resultant n values are indicated in Figure 4. Good fitting is obtained for each case. The fits give the same n value of 1.77 for both the green and red emissions. The n value suggests that the two-photon process is the dominant mechanism for the 980 nm upconversion emissions of the erbium-doped LuGG crystal studied here. The two-photon process responsible for the upconversion emissions concerns the CU and ESA, as indicated in Figure 1. As demonstrated below, the energy transfer CU process would be more likely for the excitation of the 2H11/2 and 4S3/2 states in the highly erbium-doped LuGG crystal studied here.

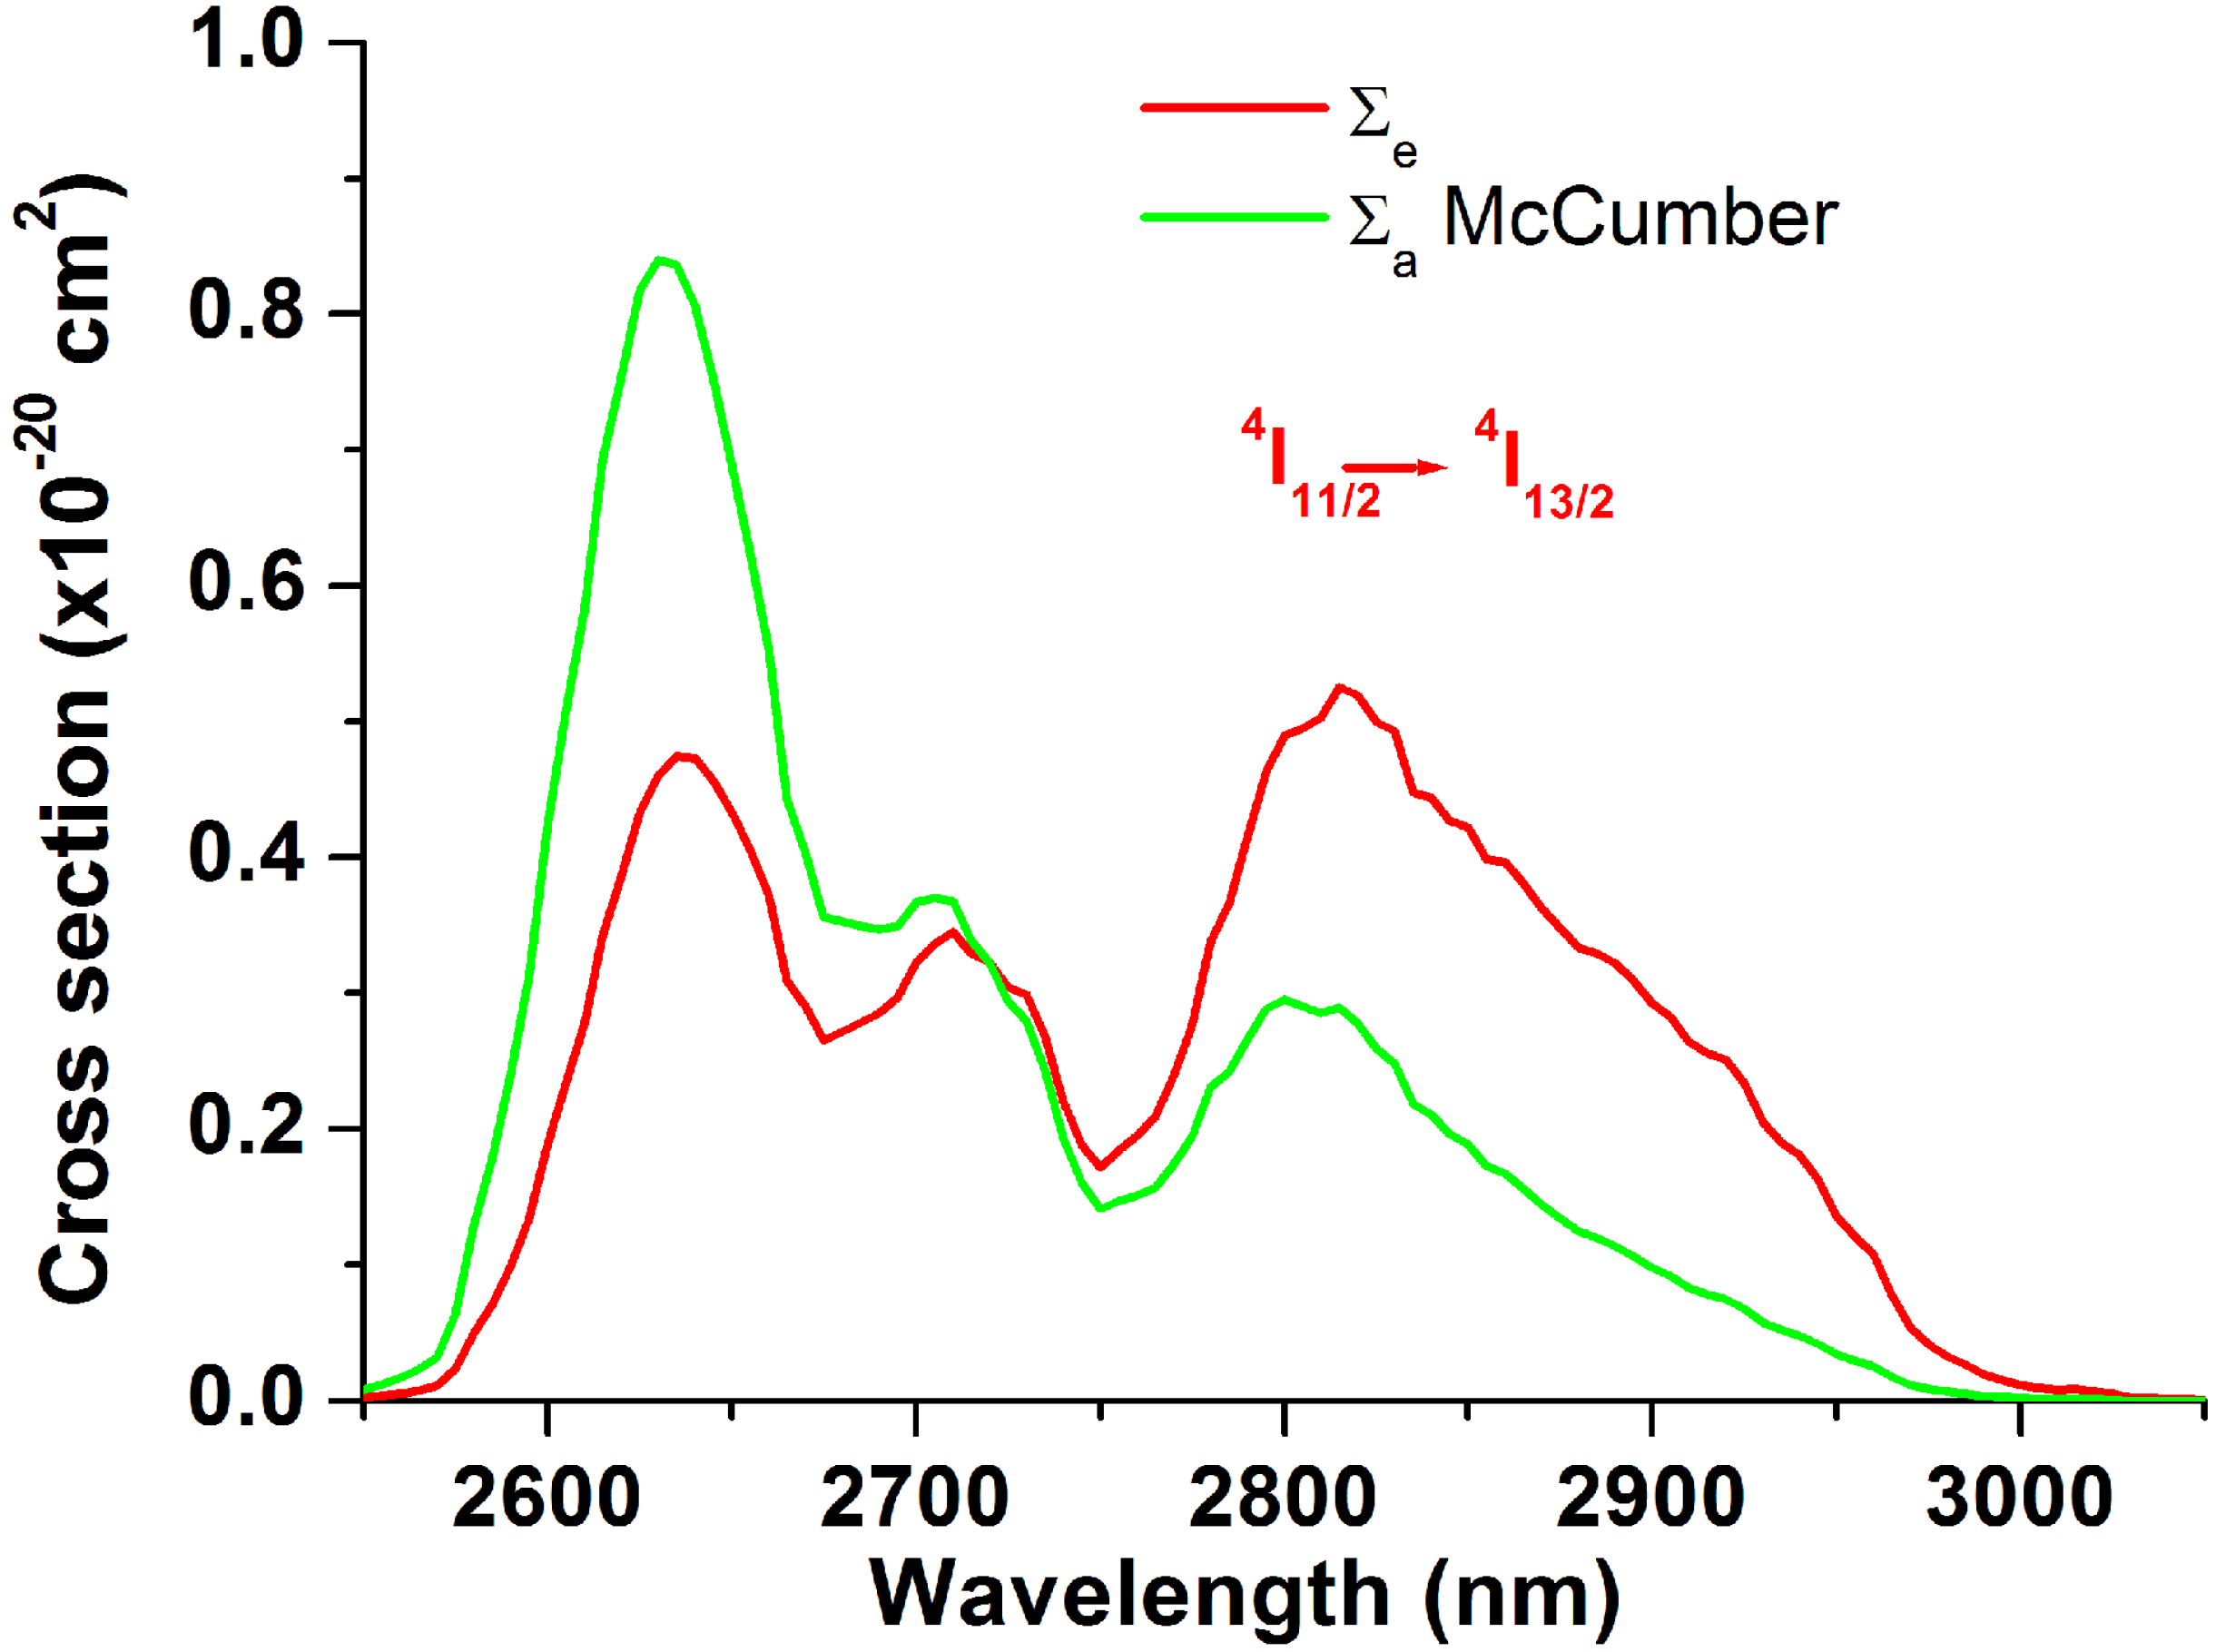
3.3. ECS and ACS Spectra of Erbium-Ion in LuGG Crystal

From the acquired emission intensity at wavelength λ, named ξ(λ), erbium-ion ECS, named Σe(λ), can be evaluated using the following equation [17,18,19,20,21,22]:
e λ = P rad λ 5 ξ λ 8 π c band RI 2 λ ξ λ λ d λ
where λ and c are wavelength and light velocity in vacuum, respectively; RI(λ) is the λ-related index of refraction of matrix material; and Prad is the radiative rate of the transition concerned. The integral in Equation (1) is calculated over the entire emission band. For the two transitions 2H11/24I15/2 and 4S3/24I15/2, which are thermalized and hypersensitive, Prad denotes an effective radiative rate [23].
Based on the calculated Σe(λ), we can compute the corresponding ACS, named Σa(λ), with the aid of the McCumber expression [21,22]:
a λ = e λ exp E E E k B T
where kB is the Boltzmann constant, E = hc/λ, and EE is the excitation energy of a given transition [23]. For 2H11/24I15/2 and 4S3/24I15/2, EE denotes an effective excitation energy [23].
The ACS Σa(λ) can also be obtained directly from the measured absorption spectrum on the basis of Beer-Lambert law.
a λ = k λ / C A
where k(λ) is the absorption coefficient and CA is the concentration of active ions (erbium ions).
It can be seen from Equation (2) that the EE is a crucial parameter that needs to be evaluated first. To achieve it, some relevant energy level parameters should be computed. Particularly for the green transition processes 4S3/24I15/2 and 2H11/24I15/2, five parameters are needed that include the Stark splittings δGk (k = G, L, and U) of the ground state 4I15/2 (G), lower state 4S3/2 (L), and upper level 2H11/2 (U) manifolds, and the interval either between the 4I15/2 and 4S3/2 states, named δGLG, or between 2H11/2 and 4S3/2 states, named δGUL. For other red, NIR, and mid-IR transition processes, the parameters required include the energy splittings of two relevant manifolds and their intervals. A five-percentage rule in combination with discrimination of peaking fluorescence related to the extreme transition has been used to compute these input parameters [23,24,25]. It is assumed in the computation that each manifold involved has identical Stark splittings. Next, we exemplify the 4I13/24I15/2 (1.5 μm) transition to detail the computation procedure. It is evident that the well-known fluorescence peak at λ0 = 1.531 μm is assigned to the transition process from the lowest Stark level of 4I13/2 (U) to that of the ground state of 4I15/2 (L) [23,24,25]. The gap between the two states is then estimated as δGUL = 6531.7 ± 2.1 cm−1. Next, the emission bandwidth of the transition is estimated on the basis of the five-percentage rule [23,24,25]. The rule is fulfilled for λl = 1.655 μm in the low-energy region and λh = 1.454 μm in the high-energy region (in the right part of Figure 1, we have marked the wavelengths (λ0, λh, and λl). On the basis of the values of λ0, λh, and λl, we have the Stark splittings δGL = 69.4 ± 0.6 cm−1 and δGU = 57.7 ± 0.7 cm−1. Finally, one can compute the excitation energy EE or λE = hc/EE = 1534.8 ± 0.7 nm. Similarly, one can compute the energy parameters and EE or λE of other transition processes, including the effective Prad and EE or λE of the two green processes 4I15/24S3/2 and 4I15/22H11/2. Table 1 summarizes the computed values of the parameters.
Based on the emission spectra shown in Figure 3a–d, we have computed using Equations (1) and (2) the ECS (red) and ACS (green) spectra of the transition processes 4I15/24S3/2 (0.56 μm), 4I15/22H11/2 (0.53 μm), 4I15/24F9/2 (0.67 μm), 4I15/24I11/2 (1.0 μm), and 4I15/24I13/2 (1.5 μm) of erbium-ion in the LuGG crystal. The calculated results are shown in Figure 5. Due to the linearity between the ECS Σe(λ) and the emission intensity ξ(λ) as shown in Equation (1), each ECS spectrum in Figure 5 has little difference from the corresponding emission spectrum shown in Figure 3. The ECS error originates predominantly from the uncertainty of Prad. Juud-Ofelt analysis yielded a relative uncertainty of 18.1%, 13.7%, and 13.4% for the radiative transitions 4F9/24I15/2 (0.67 μm), 4I11/24I15/2 (1.0 μm), and 4I13/24I15/2 (1.5 μm), respectively, and an effective error percentage of 14.4% for the two processes 2H11/24I15/2 and 4S3/24I15/2 [2]. The incertitudes of ACS Σa(λ) can be computed from the known incertitude of Σe(λ) and EE on the basis of Equation (2). The uncertainty percentage is given by
Δ a a = Δ e e + E E k B T Δ E E E E = Δ e e + E E k B T Δ λ E λ E
It is about 26.0%, 19.9%, and 14.8% for the 4I15/24F9/2 (0.67 μm), 4I15/24I11/2 (1.0 μm), and 4I15/24I13/2 (1.5 μm), respectively, and 21.2% for the 4I15/24S3/2 (0.56 μm) and 4I15/22H11/2 (0.53 μm).
Figure 5 also shows the ACS spectrum obtained from the measured absorption spectrum (blue plots) for each transition. Its uncertainty percentage is similar to 16%, contributed by the experimental error of erbium-ion concentration, ~15%, and that of sample thickness, ~1%, in the absorption measurement. Table 2 collects the values of some ECS and ACS peaks of typical transition processes. One can see that the ACS data computed from the McCumber relation can be thought of as the same as those computed from the measured absorption spectrum within the uncertainty. The consistency gives a hint that both methods are correct, and the ACS result obtained from either of them is sound.
In respect to the mid-IR transition at ~2.8 μm, 4I11/24I13/2, the process concerns two intermediate manifolds. One cannot get its absorption features as readily as those of a conventional ground-state absorption transition. Its ACS must be computed from the measured fluorescence spectrum on the basis of the McCumber relation. Figure 6 illustrates the computed ECS and ACS spectra of the transition. In particular, the ECS/ACS has a value of 0.47/0.84 × 10−20 cm2 at 2.635 μm and 0.53/0.29 × 10−20 cm2 at 2.815 μm. These ECS/ACS values, as input parameters, can be used to design an efficient mid-infrared laser operated at either 2.635 or 2.815 μm on the basis of population inversion: Σe(λ)NU−Σa(λ)NL, where NU and NL represent the populations of the upper state (4I11/2) and lower state (4I13/2), respectively. As the gain coefficient is proportional to the population inversion, an efficient laser is more easily achieved for the emission at 2.815 μm because its ECS value, 0.53 × 10⁻²⁰ cm2, is nearly two times the corresponding ACS value, 0.29 × 10⁻²⁰ cm2.

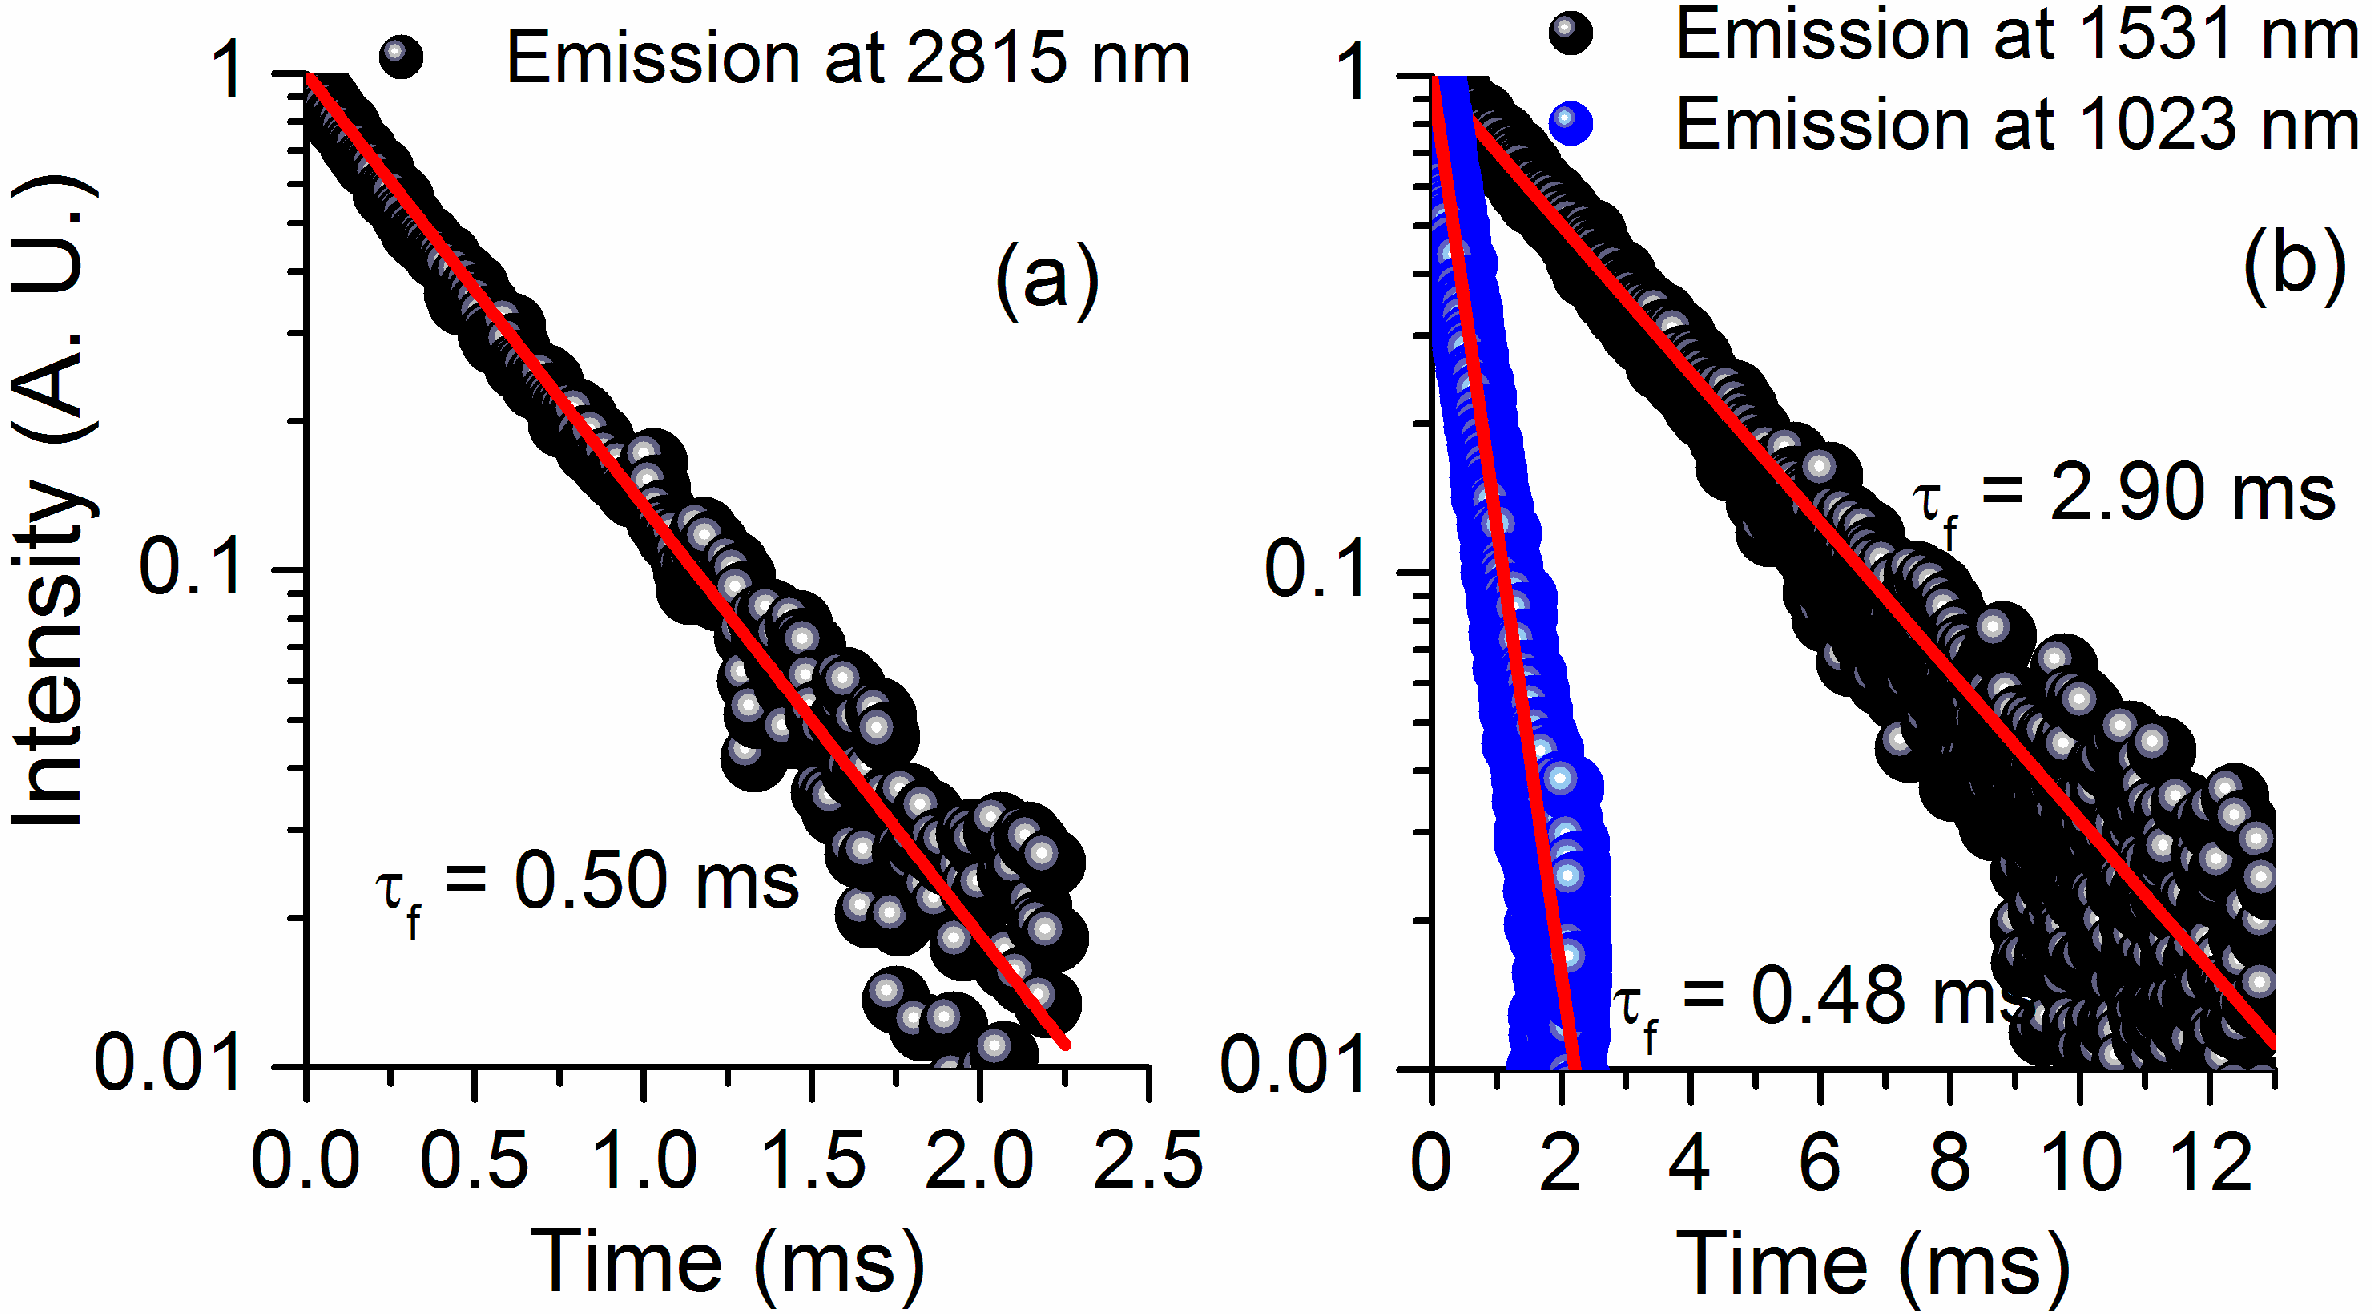
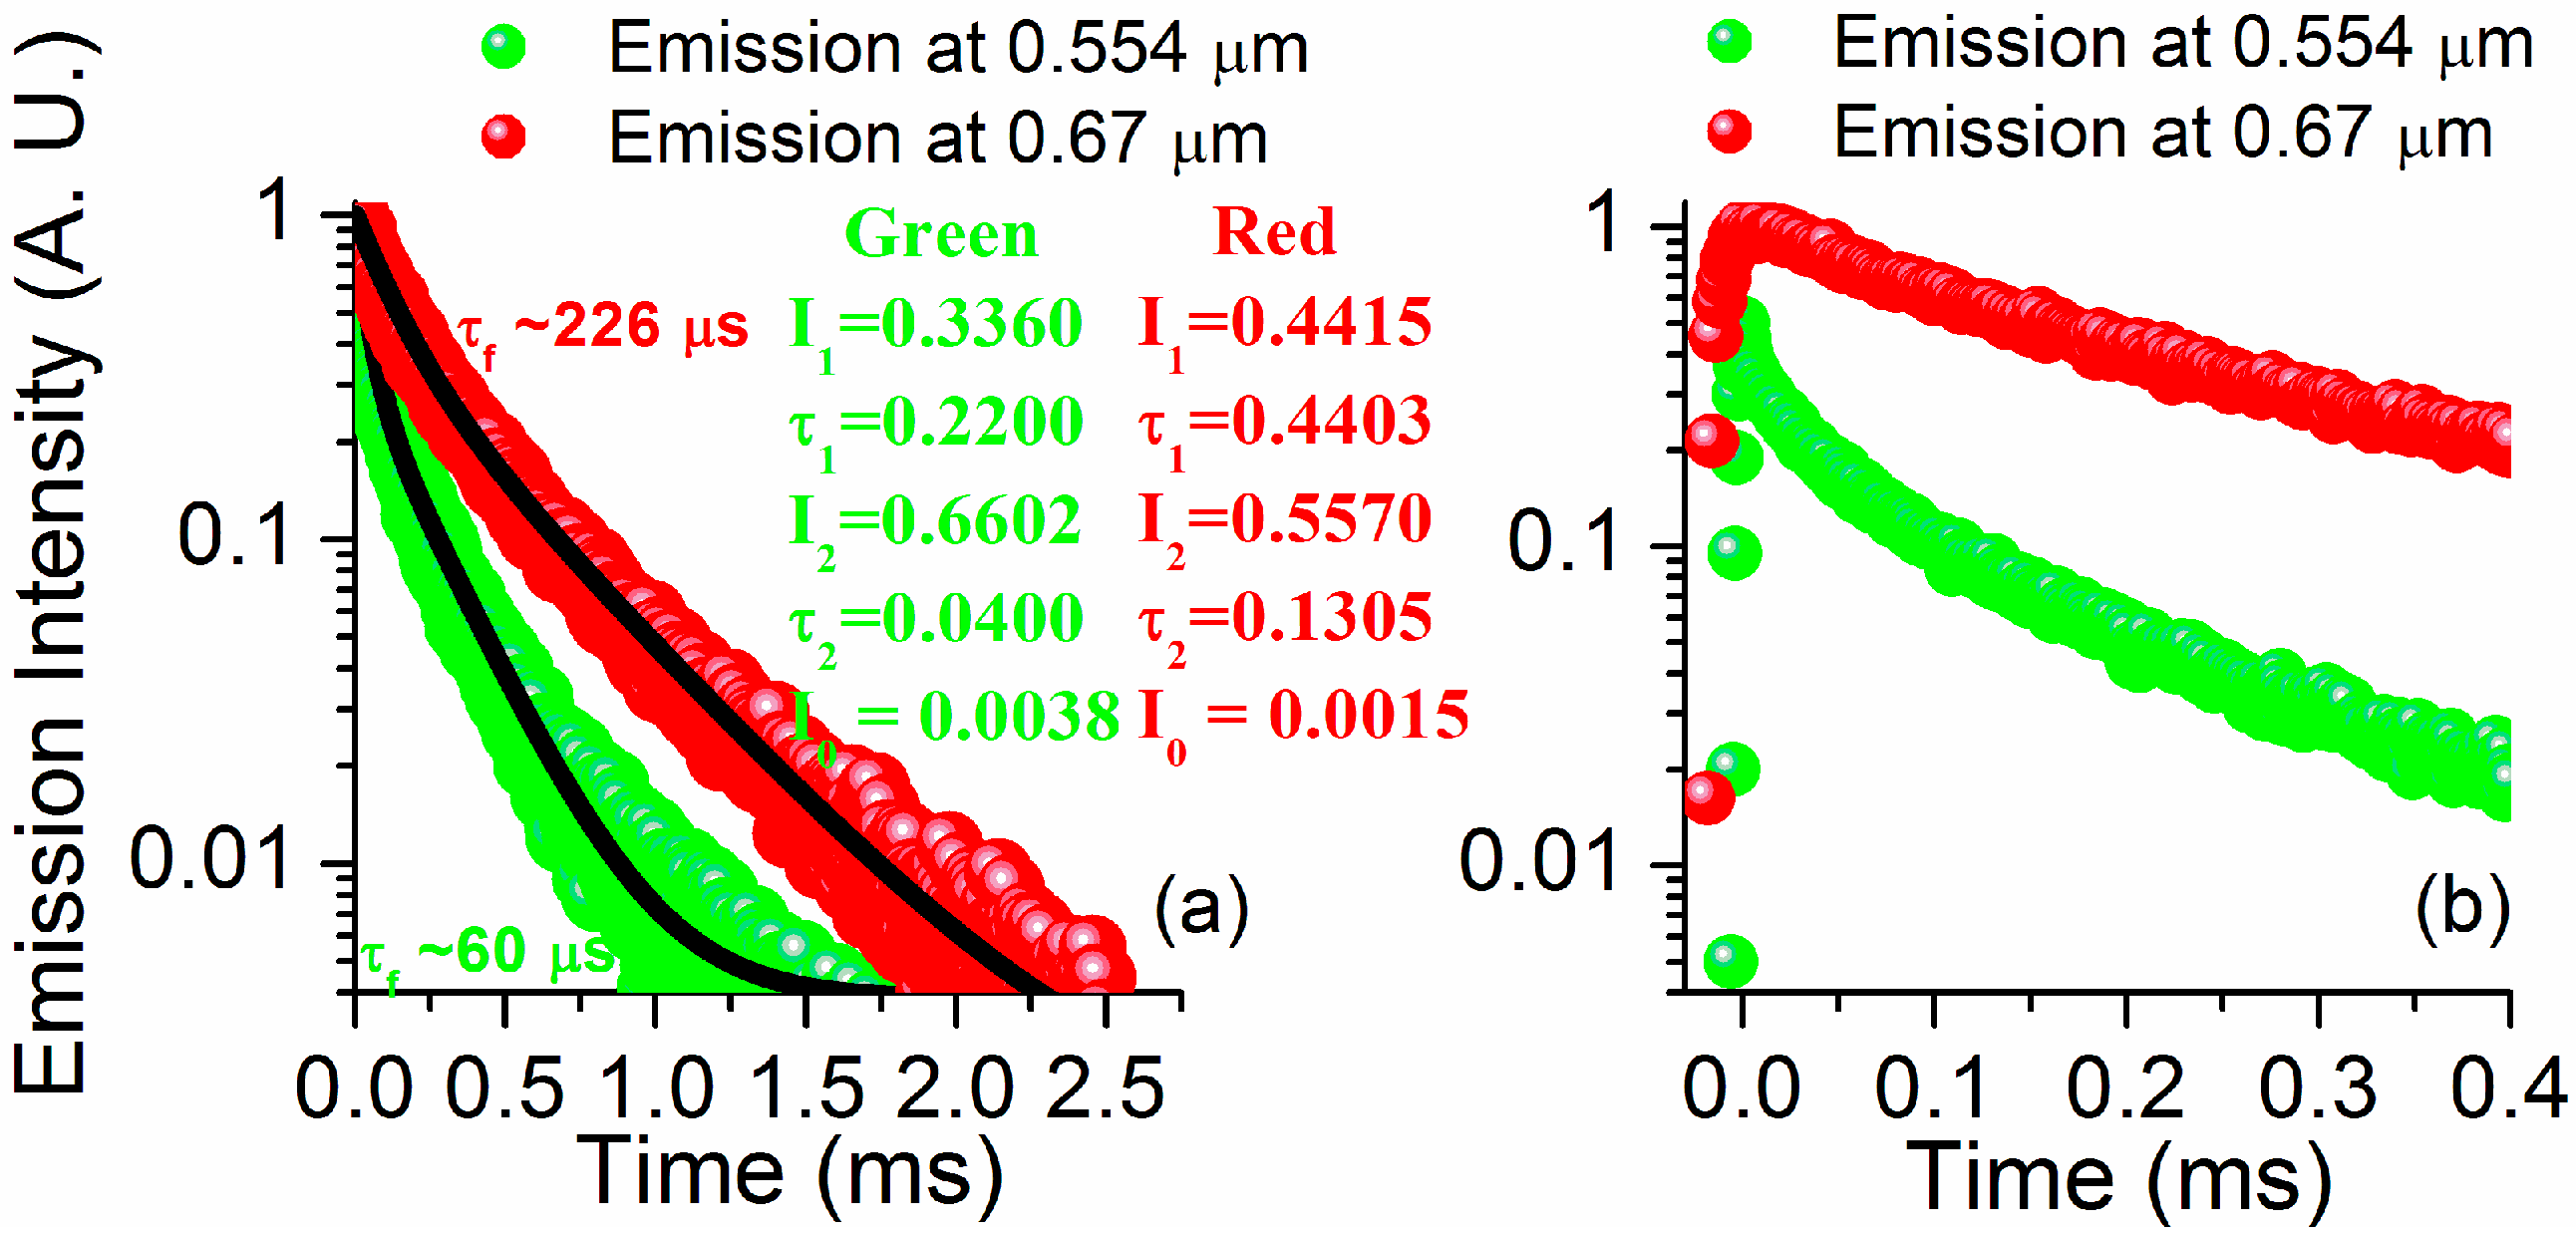
3.4. Temporal Characteristics

Aiming at the fluorescence peaks at 0.554, 0.67, 1.023, 1.531, and 2.815 μm, we have measured their temporal traces, obtained their lifetimes, and studied their temporal decaying characteristics. Figure 7 shows the measured transient decay curves of the three infrared emissions at (a) 2815 nm (black balls) and (b) 1531 nm (black balls) and 1023 nm (blue balls) of erbium ions (20 at%) in the LuGG garnet crystal on a semi-logarithmic scale. As usual, each temporal trace of these mid-IR or NIR emissions follows an exponential function. The solid red lines represent the fitting results of an exponential trial function. The fit gives a time constant τf = 500 ± 50, 2900 ± 200, and 480 ± 50 μs for the emissions at 2815, 1531, and 1023 nm, respectively.
For the two 980-nm-excited Vis emissions at 0.554 and 0.67 μm, however, their temporal traces do not obey an exponential profile but show considerable non-exponential behavior. Figure 8a shows the temporal decays of green (green symbols) and red (red symbols) fluorescence at 0.554 μm (4S3/2   4I15/2) and 0.67 μm (4F9/2   4I15/2) of erbium-ion in the LuGG crystal, respectively. It can be seen that both decay plots show considerable non-exponential characteristics. Rough estimations give a time constant (@1/e intensity) of 60 ± 3 µs for the 0.554 μm fluorescence and 226 ± 10 µs for the 0.67 μm fluorescence.
A similar non-exponential temporal characteristic was also observed for erbium-doped lithium niobate crystal [26]. The temporal decay is contributed by two different types of energetic lattice points occupied by erbium ions. One type of lattice point is occupied by the erbium ions in the isolated state and another by those erbium ions in the cluster state [27,28]. Those erbium ions that are present in the crystal in the form of cluster states result in a non-exponentially decaying characteristic. The presence of clustered erbium ions enables non-radiative upconversion depopulation through cross-relaxation of inter-ionic short-distance resonant energy transfer between the erbium ions in the cluster state. The non-radiative depopulation gives rise to an additional contribution to decay and hence a non-exponential temporal characteristic. However, non-radiative cross-relaxation hardly takes place for the erbium ions in an isolated state. The relevant mathematical model is described as follows: At time t, the measured temporal fluorescence intensity, named I(t), can be expressed as a double-exponential trial function, given by:
I t = I 1 exp t τ 1 + I 2 exp t τ 2 + I 0
The measured temporal intensity I(t) is mainly due to two types of differently energetic lattice points. The first term, with an amplitude I1 and a lifetime parameter τ1, represents the contribution of erbium-ions in the isolated state; the second term, with an amplitude I2 and a lifetime parameter τ2, denotes the contribution of erbium-ions in the cluster state; and the third term, I0, reflects the background noise. Assume that I(t = 0) = I1 + I2 + I0 = 1.
The two temporal traces in Figure 8a were fitted using Equation (5). The best fits are shown by black curves, and the relevant fitting parameters are presented. We note that the values of τ1 and τ2 are 220 ± 5 and 40 ± 2 μs for the green fluorescence at 0.554 μm and 440 ± 8 and 130 ± 3 μs for the red fluorescence at 0.67 μm. The ground I0 is below 0.4% and ignorable. The values of I1 and I2 are (34 ± 5)% and (66 ± 10)%, respectively, for the green fluorescence at 0.554 μm and (44.0 ± 7)% and (56.0 ± 8)%, respectively, for the red fluorescence at 0.67 μm. It can be seen that the I1 (I2) value of the 0.554 μm fluorescence may be thought to be identical to that of the 0.67 μm fluorescence within the incertitude.
The amplitude parameters I1 and I2 reflect the initial (t = 0) amplitude fractions with regard to the isolated erbium ions and the ones in the cluster state, respectively. Both are associated with respective concentrations, named Ci for the isolated erbium ions and Cc for those ones in the cluster state, because the fluorescence intensity is usually proportional to the active ion concentration (before the concentration quenching effect happens). As I(t = 0) = I1 + I2 + I0 = 1 and Ci + Cc = CEr = 20 at%, the value of I1 (I2) reflects the concentration fraction of the erbium ions in the isolated (clustered) state in the crystal. The I1 and I2 values given above show that the erbium-ion presence in the studied crystal is about 40% in the isolated state and about 60% in the cluster state. As demonstrated above, either I1 or I2 has the same values for both emissions at 0.554 and 0.67 μm. The same I1 or I2 values of the two emissions give consistent results for concentration fractions of erbium ions in the isolated and clustered states in the LuGG crystal studied. This is expected. A quite high concentration of erbium-ion dopants in the crystal, ~20 at% (~3.0 × 10²¹ ions/cm3), is the main reason why the concentration fraction of erbium-ions in the cluster state is high. The higher the erbium-ion concentration is, the smaller the distance to the adjacent erbium-ion is, and hence the larger the concentration fraction of erbium-ion in the cluster state is. In general, higher concentrations of erbium ions in the cluster state give rise to an increase in non-radiative depopulation through short-distance cross-relaxation between erbium ions in the cluster state and result in the weakening of CU and ESA processes. However, the validity of such a statement for the crystal studied here needs to be verified by additional experimental results for the following two reasons: First, depending on erbium concentration and hence inter-ion distance, there would be a competition between energy transfer and non-radiative processes. Second, the cluster structures are complicated in most cases. One cannot draw an affirmative conclusion on the basis of just an individual result. Moreover, in some crystals, the clustered ions are more likely to have formed at a lower doping level [29,30]. To make the issues clear, a concentration-dependent characterization is essential in future research.
In addition, in Figure 8b, we show the situation of the two transient plots in the initial excitation-decay stage (t ≈ 0). We can see that the two transient plots exhibit an extended rise time before decay happens. It means that the energy transfer CU would be more likely for the excitation of the 2H11/2 and 4S3/2 states in the studied crystal.
Finally, it is worthwhile to point out that the erbium-doped LuGG crystal may also find its application in photovoltaics based on spectral conversion [31,32], besides the ones in the fields of display, laser, and thermal sensing mentioned in the introduction part. Future work aims to demonstrate the application.

4. Conclusions

An erbium-doped LuGG crystal has been grown, and the ECS, ACS, and temporal features of the erbium ion in the crystal have been demonstrated. The ECS spectrum is computed from the acquired emission spectrum, and the ACS spectrum is computed from the ECS spectrum based on McCumber expression as well as directly from the acquired absorption spectrum. Two approaches give consistent results for ACS spectra. The consistency implies that both approaches are correct and the results obtained from them are sound.
Investigation of the temporal dynamic characteristics of Vis, NIR, and mid-IR fluorescence reveals that both the NIR and mid-IR emissions at 1.023, 1.531, and 2.815 μm obey a single exponential profile. Instead, both green and red emissions follow a well-defined double-exponential function, with one component correlating with the erbium ions in the isolated state and another component relating to those erbium ions in the cluster state. The double-exponential temporal behavior is correlated with those erbium-ions present in the form of cluster states in the crystal, which cause non-radiative depopulation and thereby extra contributions to temporal decay via cross-relaxation of resonance between adjacent erbium-ions in the cluster state. The cross-relaxation has a small occurrence possibility for those erbium ions in the isolated state instead. A rough estimation reveals that about half of the erbium ions are present in the cluster state in the studied crystal as a result of the high doping concentration. Energy transfer CU would be more likely for the excitation of the 2H11/2 and 4S3/2 states in the studied crystal.

Author Contributions

P.Z.: Investigation, Writing—original draft preparation, Funding acquisition; D.-L.Z.: Conceptualization; Writing—review and editing; Supervision; Project administration; Y.W.: Validation; Resources; Writing—review and editing. All authors have read and agreed to the published version of the manuscript.

Funding

This research was funded by the National Natural Science Foundation of China under Project no. 61875148 and by the Key Program of Tianjin Sino-German University of Applied Sciences, China, under Project no. zdkt2019-002.

Institutional Review Board Statement

Not applicable.

Informed Consent Statement

Not applicable.

Data Availability Statement

Not applicable.

Acknowledgments

This work was supported by the National Natural Science Foundation of China under Project no. 61875148 and by the Key Program of Tianjin Sino-German University of Applied Sciences, China, under Project no. zdkt2019-002.

Conflicts of Interest

The authors declare no conflict of interest.

References

  1. You, Z.; Li, J.; Wang, Y.; Chen, H.; Zhu, Z.; Tu, C.Y. Spectroscopic and laser properties of Er:LuGG crystal at ~2.8 µm. Appl. Phys. Exp. 2019, 12, 052019. [Google Scholar] [CrossRef]
  2. Liu, M.-H.; Shao, Y.-X.; Piao, R.-Q.; Zhang, D.-L.; Wang, Y. Sellmeier dispersion and spectroscopic properties of Er3+-doped lutetium gallium garnet single crystal. Results Phys. 2021, 30, 104876. [Google Scholar] [CrossRef]
  3. Venkatramu, V.; Giarola, M.; Mariotto, G.; Enzo, S.; Polizzi, S.; Jayasankar, C.K.; Piccinelli, F.; Bettinelli, M.; Speghini, A. Nanocrystalline lanthanide-doped Lu3Ga5O12 garnets: Interesting materials for light-emitting devices. Nanotechnology 2010, 21, 175703. [Google Scholar] [CrossRef] [PubMed]
  4. Venkatramu, V.; Falcomer, D.; Speghini, A.; Bettinelli, M.; Jayasankar, C. Synthesis and luminescence properties of Er3+-doped Lu3Ga5O12 nanocrystals. J. Lumin. 2010, 128, 811–813. [Google Scholar] [CrossRef]
  5. Rathaiah, M.; Haritha, P.; Linganna, K.; Monteseguro, V.; Martín, I.R.; Lozano-Gorrín, A.D.; Babu, P.; Jayasankar, C.K.; Lavín, V.; Venkatramu, V. Infrared-to-Visible Light Conversion in Er3+-Yb3+:Lu3Ga5O12Nanogarnets. Chem. Phys. Chem. 2015, 16, 3928–3936. [Google Scholar] [CrossRef] [PubMed]
  6. Wu, K.; Hao, L.; Zhang, H.; Yu, H.; Wang, Y.; Wang, J.; Tian, X.; Zhou, Z.; Liu, J.; Boughton, R.I. Lu3Ga5O12 crystal: Exploration of new laser host material for the ytterbium ion. J. Opt. Soc. Am. B 2012, 29, 2320–2328. [Google Scholar] [CrossRef]
  7. Han, W.J.; Ma, Y.J.; Dou, X.D.; Wang, L.S.; Xu, H.H.; Liu, J.H. Passive Q-switching laser properties of Yb:Re3Ga5O12 (Re = Y, Lu, Gd) garnets with GaAs semiconductor saturable absorber. Opt. Commun. 2018, 423, 1–5. [Google Scholar] [CrossRef]
  8. Serres, J.M.; Loiko, P.; Mateos, X.; Yu, H.H.; Zhang, H.J.; Liu, J.H.; Yumashev, K.; Griebner, U.; Petrov, V.; Aguilo, M.; et al. Q-switching of Yb:YGG, Yb:LuGG and Yb:CNGG lasers by a graphene saturable absorber. Opt. Quant. Electron. 2016, 48, 197. [Google Scholar] [CrossRef]
  9. Han, W.; Wu, K.; Tian, X.; Xia, L.; Zhang, H.; Liu, J. Laser performance of ytterbium-doped gallium garnets: Yb:Re3Ga5O12 (Re = Y, Gd, Lu). Opt. Mater. Express 2013, 3, 920–927. [Google Scholar] [CrossRef]
  10. Liu, J.; Tian, X.; Zhou, Z.; Wu, K.; Han, W.; Zhang, H. Efficient laser operation of Yb:Lu3Ga5O12 garnet crystal. Opt. Lett. 2012, 37, 2388–2390. [Google Scholar] [CrossRef]
  11. He, J.; Mei, Y.; Zheng, W.-C.; Liu, H.-G. Thermal shifts and electron-phonon coupling parameters for Cr3+-doped Lu3Al5O12 and Lu3Ga5O12 garnet crystals. Optik 2018, 171, 304–307. [Google Scholar] [CrossRef]
  12. Haritha, P.; Viswanath, C.D.; Linganna, K.; Babu, P.; Jayasankar, C.; Lavín, V.; Venkatramu, V. Nanocrystalline Sm3+-doped Lu3Ga5O12 garnets: An intense orange-reddish luminescent material for white light emitting devices. J. Lumin. 2016, 179, 533–538. [Google Scholar] [CrossRef]
  13. Sun, G.; Zhang, Q.; Yang, H.; Luo, J.; Sun, D.; Gu, C.; Yin, S. Crystal growth and characterization of Ho-doped Lu3Ga5O12 for 2 μm laser. Mater. Chem. Phys. 2013, 138, 162–166. [Google Scholar] [CrossRef]
  14. Wu, K.; Yao, B.; Zhang, H.; Yu, H.; Wang, Z.; Wang, J.; Jiang, M. Growth and properties of Nd:Lu3Ga5O12 laser crystal by floating-zone method. J. Cryst. Growth 2010, 312, 3631–3636. [Google Scholar] [CrossRef]
  15. Novoselov, A.; Yoshikawa, A.; Nikl, M.; Pejchal, J.; Fukuda, T. Study on crystal growth and scintillating properties of Bi-doped Lu3Ga5O12. J. Cryst. Growth 2006, 292, 236–238. [Google Scholar] [CrossRef]
  16. Lifante, G.; Núñez, L.; Cussó, F. Polarization effects on the line-strength calculations of Er3+-doped LiNbO3. Appl. Phys. B Laser Opt. 1996, 62, 485–491. [Google Scholar] [CrossRef]
  17. Miniscalco, W.J.; Quimby, R.S. General procedure for the analysis of Er3+ cross sections. Opt. Lett. 1991, 16, 258–260. [Google Scholar] [CrossRef]
  18. Martin, R.M.; Quimby, R.S. Experimental evidence of the validity of the McCumber theory relating emission and absorption for rare-earth glasses. J. Opt. Soc. Am. B 2006, 23, 1770–1775. [Google Scholar] [CrossRef]
  19. Moulton, P.F. Spectroscopic and laser characteristics of Ti:Al2O3. J. Opt. Soc. Am. B 1986, 3, 125–133. [Google Scholar] [CrossRef]
  20. Eggleston, J.; DeShazer, L.; Kangas, K. Characteristics and kinetics of laser-pumped Ti:sapphire oscillators. IEEE J. Quantum Electron. 1988, 24, 1009–1015. [Google Scholar] [CrossRef]
  21. Pernas, P.L.; Cantelar, E. Emission and Absorption Cross-Section Calculation of Rare Earth Doped Materials for Applications to Integrated Optic Devices. Phys. Scr. 2005, 2005, 93. [Google Scholar] [CrossRef]
  22. McCumber, D.E. Theory of Phonon-Terminated Optical Masers. Phys. Rev. 1964, 134, A299–A306. [Google Scholar] [CrossRef]
  23. Lazaro, J.; Valles, J.; Rebolledo, M. In situ measurement of absorption and emission cross sections in Er/sup 3+/-doped waveguides for transitions involving thermalized states. IEEE J. Quantum Electron. 1999, 35, 827–831. [Google Scholar] [CrossRef]
  24. Rebolledo, M.A.; Vallés, J.A.; Setién, S. In situ measurement of polarization-resolved emission and absorption cross-sections of Er-doped Ti:LiNbO3 waveguides. J. Opt. Soc. Am. B 2002, 19, 1516–1520. [Google Scholar] [CrossRef]
  25. Lazaro, J.A.; Valles, J.A.; Rebolledo, M.A. Determination of emission and absorption cross-sections of Er3+ in Ti:LiNbO3 waveguides from transversal fluorescence spectra. Pure Appl. Opt. 1998, 7, 1363–1371. [Google Scholar] [CrossRef]
  26. Ju, J.J.; Lee, M.-H.; Cha, M.; Seo, H.J. Energy transfer in clustered sites of Er3+ ions in LiNbO3 crystals. J. Opt. Soc. Am. B 2003, 20, 1990–1995. [Google Scholar] [CrossRef]
  27. Gill, D.M.; McCaughan, L.; Wright, J.C. Spectroscopic site determinations in erbium-doped lithium niobate. Phys. Rev. B 1996, 53, 2334–2344. [Google Scholar] [CrossRef]
  28. Dierolf, V.; Koerdt, M. Combined excitation-emission spectroscopy of Er3+ ions in stoichiometric LiNbO3: The site selectivity of direct and up conversion excitation processes. Phys. Rev. B 2000, 61, 8043–8052. [Google Scholar] [CrossRef]
  29. Catlow, C.R.A.; Chadwick, A.V.; Greaves, G.N.; Moroney, L.M. Direct observations of the dopant environment in fluorites using EXAFS. Nature 1984, 312, 601–604. [Google Scholar] [CrossRef]
  30. Petit, V.; Camy, P.; Doualan, J.L.; Portier, X.; Moncorgé, R. Spectroscopy of Yb3+:CaF2: From isolated centers to clusters. Phys. Rev. B 2008, 78, 085131. [Google Scholar] [CrossRef]
  31. Arnaoutakis, G.E.; Favilla, E.; Tonelli, M.; Richards, B.S. Single crystal monolithic upconverter solar cell device tandems with integrated optics. J. Opt. Soc. Am. B 2022, 39, 239–247. [Google Scholar] [CrossRef]
  32. Boccolini, A.; Favilla, E.; Tonelli, M.; Richards, B.S.; Thomson, R.R. Highly efficient upconversion in Er3+ doped BaY2F8 single crystals: Dependence of quantum yield on excitation wavelength and thickness. Opt. Express 2015, 23, A903–A915. [Google Scholar] [CrossRef]
Figure 1. Left part: erbium-ion energy levels and main processes under the 0.98 μm wavelength pumping. CU: cooperative upconversion, ESA: excited state absorption; GSA: ground state absorption; MPR: multi-phonon relaxation. Right part: extreme processes between Stark splittings of 4I13/2 and 4I15/2. λ0: peaking wavelength of transition from the lowest sublevel of the 4I13/2 state to that of the 4I15/2 state; λhl): wavelength that satisfies the five-percentage rule in the high (low) energy region.
Photonics 10 00586 g001
Figure 2. XRD patterns of the studied crystal (upper) and pure LuGG taken from powder diffraction file 73-1372 (down). All discernible reflexes are indexed.
Photonics 10 00586 g002
Figure 3. Vis (a,b), NIR (c,d), and mid-IR (e) emission spectra of an erbium (20 at%)-doped LuGG crystal. Peaking emission wavelengths are indicated for each transition.
Photonics 10 00586 g003
Figure 4. Integrated upconversion fluorescence intensity IUC as a function of 980 nm pump intensity Ip on a logarithmic scale for erbium(20 at%)-doped LuGG crystal. Red balls: red emission 4F9/24I15/2 (670 nm); green balls: green emissions: 2H11/2 ↔ (530 nm) + 4S3/24I15/2 (560 nm).
Photonics 10 00586 g004
Figure 5. Vis and NIR ECS (red curve) and deduced ACS (green curve) spectra of (A) 2H11/24I15/2 and 4S3/24I15/2, (B) 4F9/24I15/2, (C) 4I11/24I15/2, and (D) 4I13/24I15/2 of erbium(20 at%)-doped LuGG. The ACS spectrum (blue curve) computed from the measured absorption spectrum is also presented.
Photonics 10 00586 g005
Figure 6. Mid-IR ECS (red) and ACS (green) spectra of 4I11/24I13/2 of erbium(20 at%)-doped LuGG crystal.
Photonics 10 00586 g006
Figure 7. Transient decaying curves of NIR or mid-IR emissions at (a) 1023 (blue balls), 1531 (black balls), and (b) 2815 nm (black balls) of erbium ions (20 at%) in LuGG garnet crystal. The red solid lines represent the fitting results of a mono-exponential trial function.
Photonics 10 00586 g007
Figure 8. (a) Temporal plots of 0.98-μm-excited fluorescence of the 0.554 μm (green balls) and 0.67 μm (red balls) processes of erbium(20 at%)-doped LuGG. Black plots represent the best fits utilizing the trial function suggested by expression (5). The parameter values used for the fit are presented. (b) Two transient plots in the initial excitation-decay stage (t ≈ 0).
Photonics 10 00586 g008
Table 1. Values of parameters for computation of the ECS and ACS spectra of erbium-doped LuGG.
Band atParameterValueBand atParameterValue
0.53 μm (2H11/2)
+
0.56 μm
(4S3/2)
G: 4I15/2
L: 4S3/2
U:2H11/2
PHG (s−1)2785.9 ± 563.70.65 μm
L: 4I15/2
U: 4F9/2
Prad (s−1)1760.4 ± 318.8
PSG (s−1)3340.9 ± 471.4λh0l (nm)643.5/663/683
λh0l (nm)517.5/523.5/537δGUL cm−1)15,083.0 ± 4.5
λh0l (nm)541/546.5/559.5δGU (cm−1)114.2 ± 5.9
δGUL (cm−1)803.9 ± 35.0δGL (cm−1)63.1 ± 3.2
δGLG (cm−1)18,298.3 ± 6.7λE (nm)653.0 ± 0.7
δGG (cm−1)64.6 ± 5.80.98 μm
L: 4I15/2
U: 4I11/2
Prad (s−1)341.5 ± 47.2
δGU (cm−1)44.3 ± 5.3λh0l (nm)961/976/1023
δGL (cm−1)186.0 ± 33.8δGUL (cm−1)10,245.9 ± 5.2
Prad (s−1)3311.2 ± 476.8δGU (cm−1)31.9 ± 2.1
λE (nm)532.2 ± 0.4δGL (cm−1)67.2 ± 1.4
λE (nm)980.6 ± 0.8
1.53 μm
L: 4I15/2
U: 4I13/2
Prad (s−1)354.3 ± 47.52.8 μm
L: 4I13/2
U: 4I11/2
Prad (s−1)59.4 ± 8.0
λh0l (nm)1454/1531/1655λh0l (nm)2576/2700/2969
δGUL (cm−1)6531.7 ± 2.1δGUL (cm−1)3714.2 ± 1.5
δGU (cm−1)57.7 ± 0.7δGU (cm−1)31.9 ± 2.1
δGL (cm−1)69.4 ± 0.6δGL (cm−1)57.7 ± 0.7
λE (nm)1534.8 ± 0.7λE (nm)2719.7 ± 5.0
Table 2. Peaking values of ECS (Σe) and ACS Σa (×10−20 cm2) of typical transitions of erbium-ion in LuGG. The ACS values obtained from the measured absorption spectrum are also presented.
Erbium-Ion TransitionsΣe
(×10−20 cm2)
Σa@λ nm
(×10−20 cm2)
McCumberAbsorption Spectrum
4I15/24I13/20.27@1468 nm1.36@1468 nm1.79@1468 nm
1.20@1531 nm1.42@1531 nm1.09@1531 nm
4I11/24I13/20.47@2635 nm0.84@2635 nm-
0.53@2815 nm0.29@2815 nm-
4I15/24I11/20.19@967 nm0.61@967 nm0.65@967 nm
0.39@1023 nm0.08@1023 nm0.07@1023 nm
4I15/24F9/20.30@648 nm0.56@648 nm0.45@648 nm
0.65@655 nm0.55@655 nm0.53@655 nm
0.90@670 nm0.14@670 nm0.16@670 nm
0.90@674 nm0.09@674 nm0.13@674 nm
4I15/24S3/20.53@541 nm0.13@541 nm0.15@541 nm
1.43@554 nm0.05@554 nm0.07@554 nm
1.22@558 nm0.03@558 nm0.04@558 nm
4I15/22H11/20.04@518 nm0.50@518 nm0.50@518 nm
0.13@524 nm0.60@524 nm0.52@524 nm
Disclaimer/Publisher’s Note: The statements, opinions and data contained in all publications are solely those of the individual author(s) and contributor(s) and not of MDPI and/or the editor(s). MDPI and/or the editor(s) disclaim responsibility for any injury to people or property resulting from any ideas, methods, instructions or products referred to in the content.

