Article

Frequency-Selective Surface Based on Negative-Group-Delay Bismuth–Mica Medium

by
Anton D. Zaitsev
1,*,
Petr S. Demchenko
1,2,
Natallya S. Kablukova
1,3,
Anna V. Vozianova
1,4 and
Mikhail K. Khodzitsky
2
1
ITMO University, 197101 St. Petersburg, Russia
2
Tydex LLC, 194292 St. Petersburg, Russia
3
Saint Petersburg State University of Industrial Technologies and Design, 191186 St. Petersburg, Russia
4
Saint Petersburg State University, 199034 St. Petersburg, Russia
*
Author to whom correspondence should be addressed.
Photonics 2023, 10(5), 501; https://doi.org/10.3390/photonics10050501
Submission received: 15 December 2022 / Revised: 5 April 2023 / Accepted: 24 April 2023 / Published: 26 April 2023
(This article belongs to the Section Optoelectronics and Optical Materials)

Abstract

:
Negative group delay may be observed in dispersive media with anomalous dispersion in a certain frequency range. The fact that an outgoing wave packet precedes an incoming one does not violate the causality principle but is only a consequence of a waveform reshaping. This effect is observed in media such as photonic crystals, hyperbolic and epsilon-near-zero metamaterials, undersized waveguides, subwavelength apertures, side-by-side prisms, and resonant circuits at various frequencies. The current work is devoted to the design of a simple negative-group-delay medium with tunable properties in the THz frequency range. This medium consists of a bismuth-based frequency-selective surface on a dielectric substrate and may be tuned both statically and dynamically. While a geometry variation defines a main form of an effective permittivity dispersion and group delay/group velocity spectra, an external voltage allows one to adjust them with high precision. For the configuration proposed in this work, all frequency regions with noticeable change in group delay/group velocity lie within atmospheric transparency windows, which are to be used in 6G communications. This medium may be applied to THz photonics for a tunable phase-shift compensation, dispersion management in systems of THz signal modulation, and for encoding in next-generation wireless communication systems.

1. Introduction

Negative group delay (NGD) is observed for well-shaped waves (pulses) traveling through a medium with anomalous dispersion in a certain frequency range, i.e., group velocity may become superluminal [1,2,3]. In this case, an outgoing wave packet precedes an incoming one, which does not violate the causality principle but is only a consequence of a waveform reshaping associated with the fact that high-frequency components of a wave move faster than low-frequency components [4]. These frequency bands with anomalous dispersion are observed in any dispersive media and are accompanied by strong absorption as a consequence of the principle described by Kramers–Kronig relations [5]. However, attenuation may be prevented during wave propagation in an active medium [6,7]. Group velocity describes only smoothly varying electromagnetic wave packet features such as position of the peak. It should be noted that the superluminal group velocity of a wave packet transmitting through a lossy medium is not equal to superluminal energy/information propagation [8] and may become infinite or negative within anomalous dispersion regions and near such frequency bands.
Group delay ( τ g ) is related to group velocity ( v g ) as τ g = d / v g , where d is a medium length (thickness). It may be extracted as
τ g = d c R e ( n ^ ( ω ) ) + ω R e ( n ^ ( ω ) ) ω ,
where c is the speed of light in vacuum, n ^ ( ω ) is a refractive index dispersion of a medium under study, ω = 2 π f is an angular frequency, and f is an ordinary radiation frequency [9]. The concept of group delay is applicable to both spatially extended and spatially negligible media, such as optical fibers and thin filters, respectively. Superluminal group velocity has been observed in anomalous dispersion regions of positive-index media, as well as in photonic crystals, hyperbolic and epsilon-near-zero (ENZ) metamaterials, undersized waveguides, subwavelength apertures, side-by-side prisms, and resonant circuits [10,11,12,13,14,15,16,17].
There are many works devoted to the study of this phenomenon from kHz to GHz and at optical frequencies [18,19,20,21]. Due to the development of THz next-generation communications, it is of great interest to study superluminal propagation in the THz region located in the frequency range of 0.1–10 THz, i.e., between the microwave and mid-infrared regions. Terahertz radiation has a non-ionizing nature and selectively interacts with many dielectric media being absorbed by conductive materials [22]. It has attracted the attention of many researchers and industries due to a recent development of fast-acting and cost-effective sources and receivers of such a radiation and due to its applicability in imaging (medicine, pharmaceutics, security systems, and contactless diagnostics), next-generation communications (6G systems), and spectral analysis [23,24,25,26,27,28]. For research and development in the THz domain, both radiophysical and optical approaches are used. At the moment, important work is underway to create devices and materials to control THz radiation parameters, e.g., for 6G communication systems [29,30]. An application of NGD media in the THz domain allows for tunable phase-shift compensation, as well as dispersion management in systems of THz signal modulation and encoding. To date, several media have been proposed to reach NGD at THz frequencies: periodic bandgap structures (photonic crystals), waveguides close to cutoff frequency, and metamaterials [31,32,33,34]. In the field of metamaterials and metasurfaces, a theoretical work [35] proposed a graphene-based structure that provides a tunable group delay (up to 37 ps) in the THz frequency range; however, these results are have not been experimentally validated, especially considering difficulties with the fabrication of fully graphene structures. Another work [36] proposed a relatively complex frequency-selective surface based on aligned nematic liquid crystal cells, for which an effective permittivity dispersion was analyzed.
In this work, we demonstrate statically/dynamically tunable amplitude transmission and phase-shift spectra, effective permittivity dispersion, and group delay and group velocity spectra both numerically and experimentally on the basis of a simple medium consisting of only two layers: a dielectric substrate and a conductive thin film. We show that all the frequency regions with noticeable change in group delay/group velocity lie within the atmospheric transparency windows, which are to be used in 6G communications. We investigate cases of both continuous and structured media with optical properties tuned both statically and dynamically in the frequency range of 0.2–1.0 THz. A solid mica substrate is used as a dielectric layer, and a thin-film bismuth is used as a conductive layer since its permittivity depends on the thickness, substrate material, temperature, etc. Despite the fact that this medium provides negative group delay in the case of continuous bismuth film (low transmittance), additional features may be introduced by making apertures in a bismuth film with a period and size comparable to the radiation wavelength. Such a structuring allows one to reduce losses and to reach a dual-band or a multiband NGD or to make a medium work in ENZ mode. Finally, we investigate a possibility to adjust an effective permittivity dispersion and group delay/group velocity spectra using an external voltage source. As a result, the structure combines a simple manufacturing process with the possibility of dynamic tuning using printed electrodes and operation in frequency bands that are well-matched with atmospheric transparency windows within the THz frequency range.

2. Methods

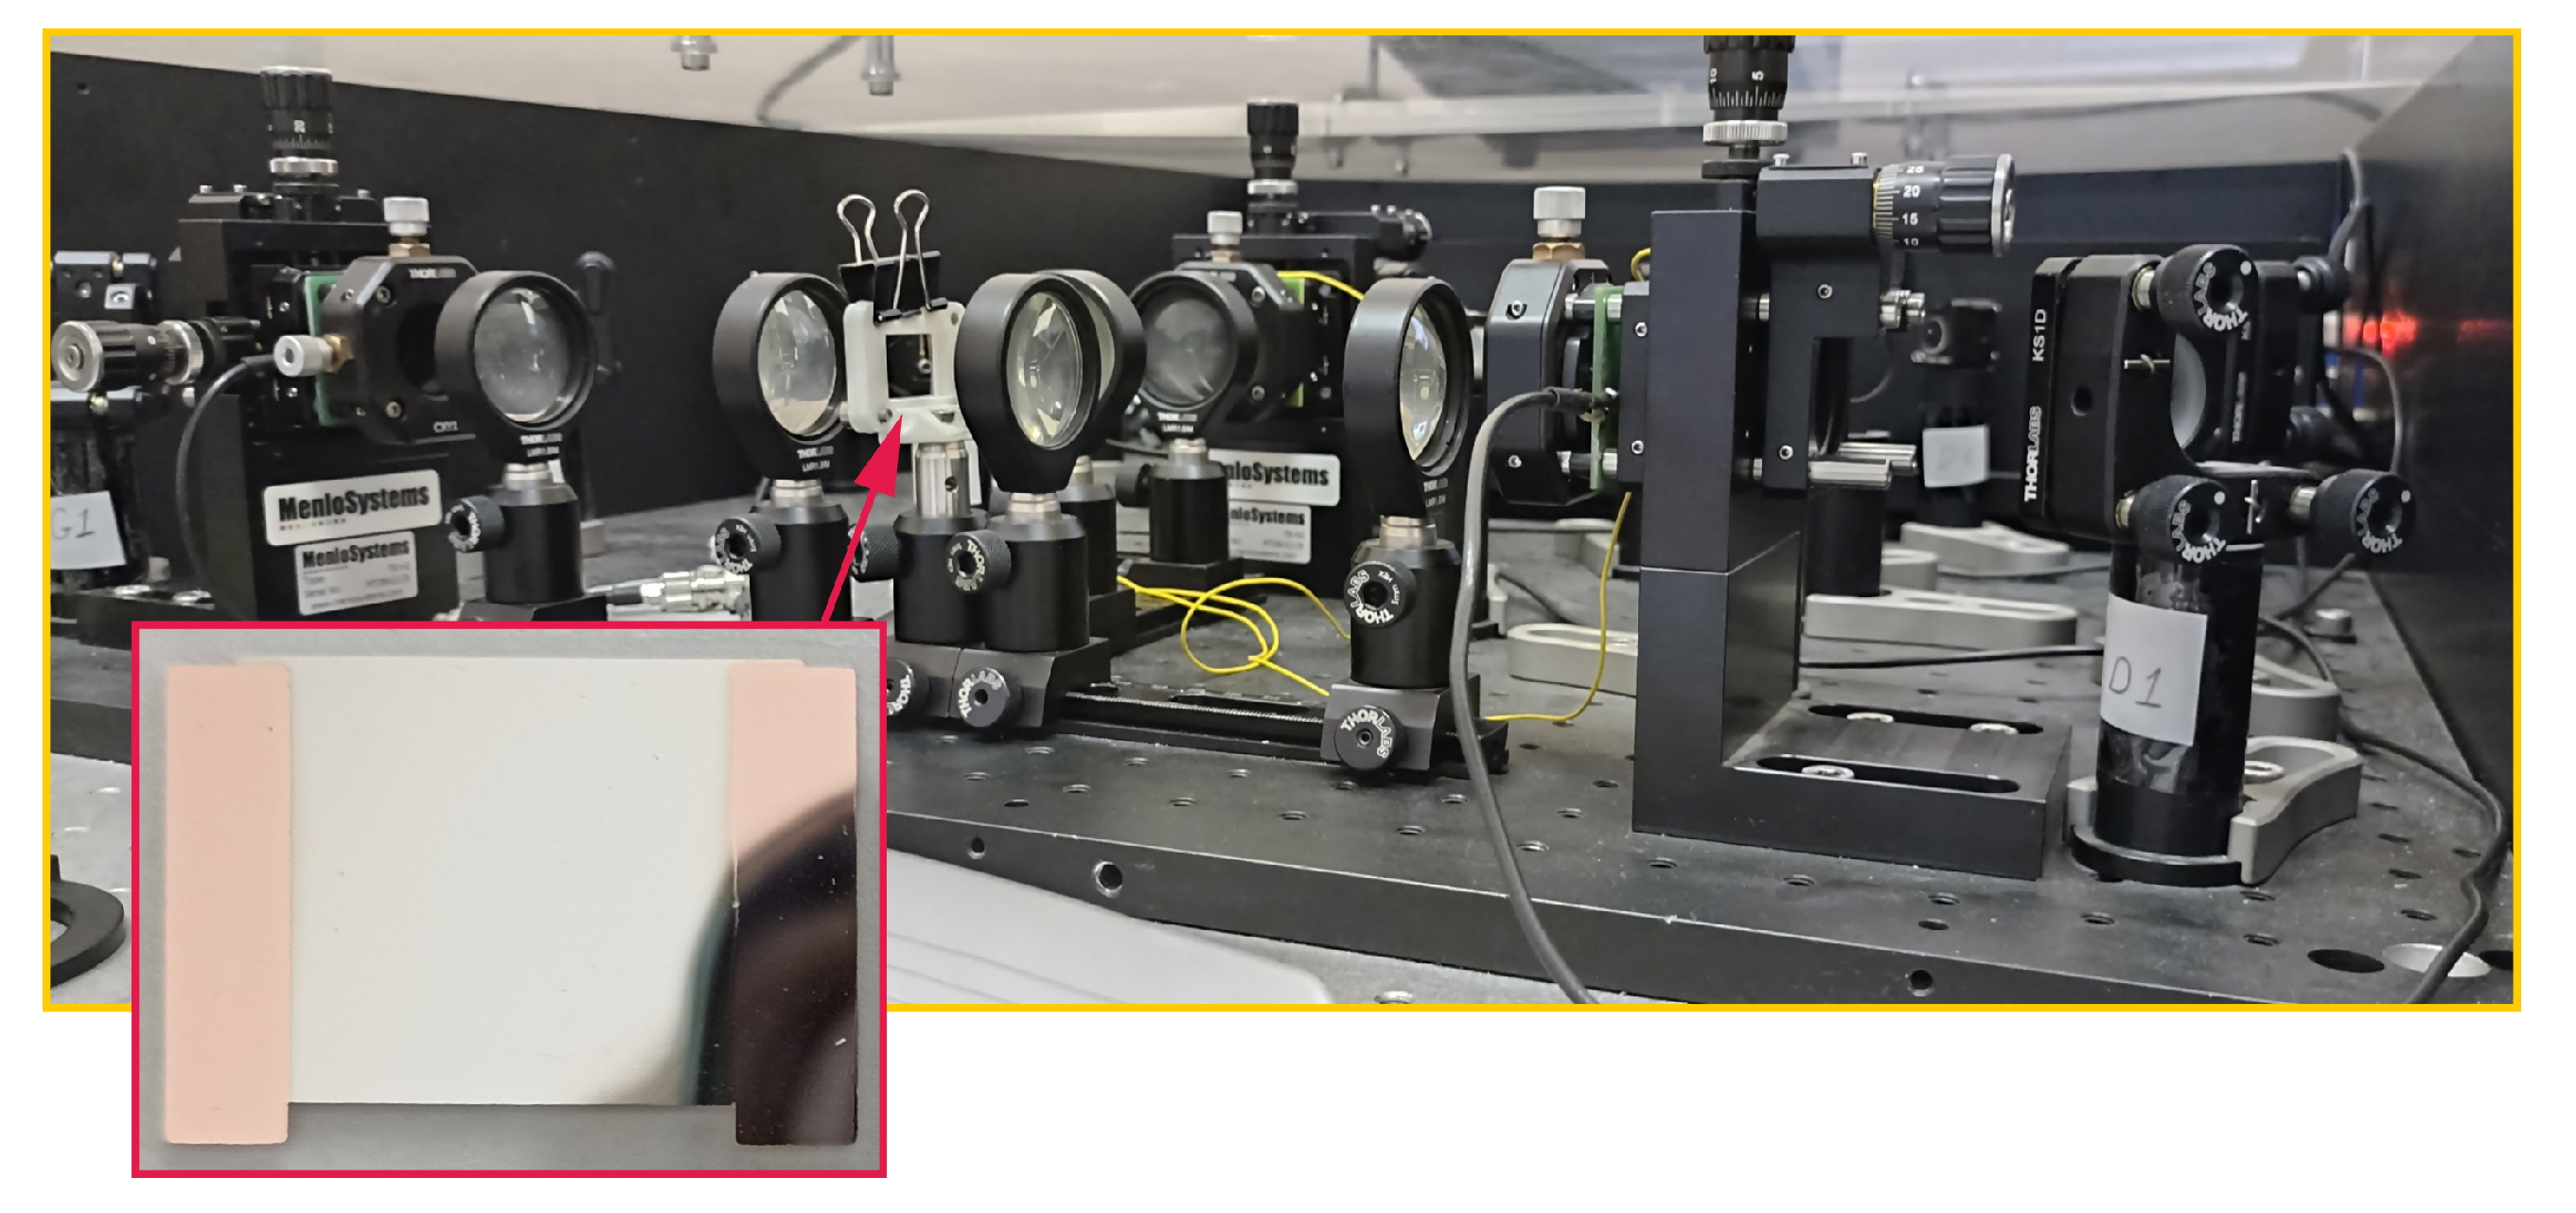
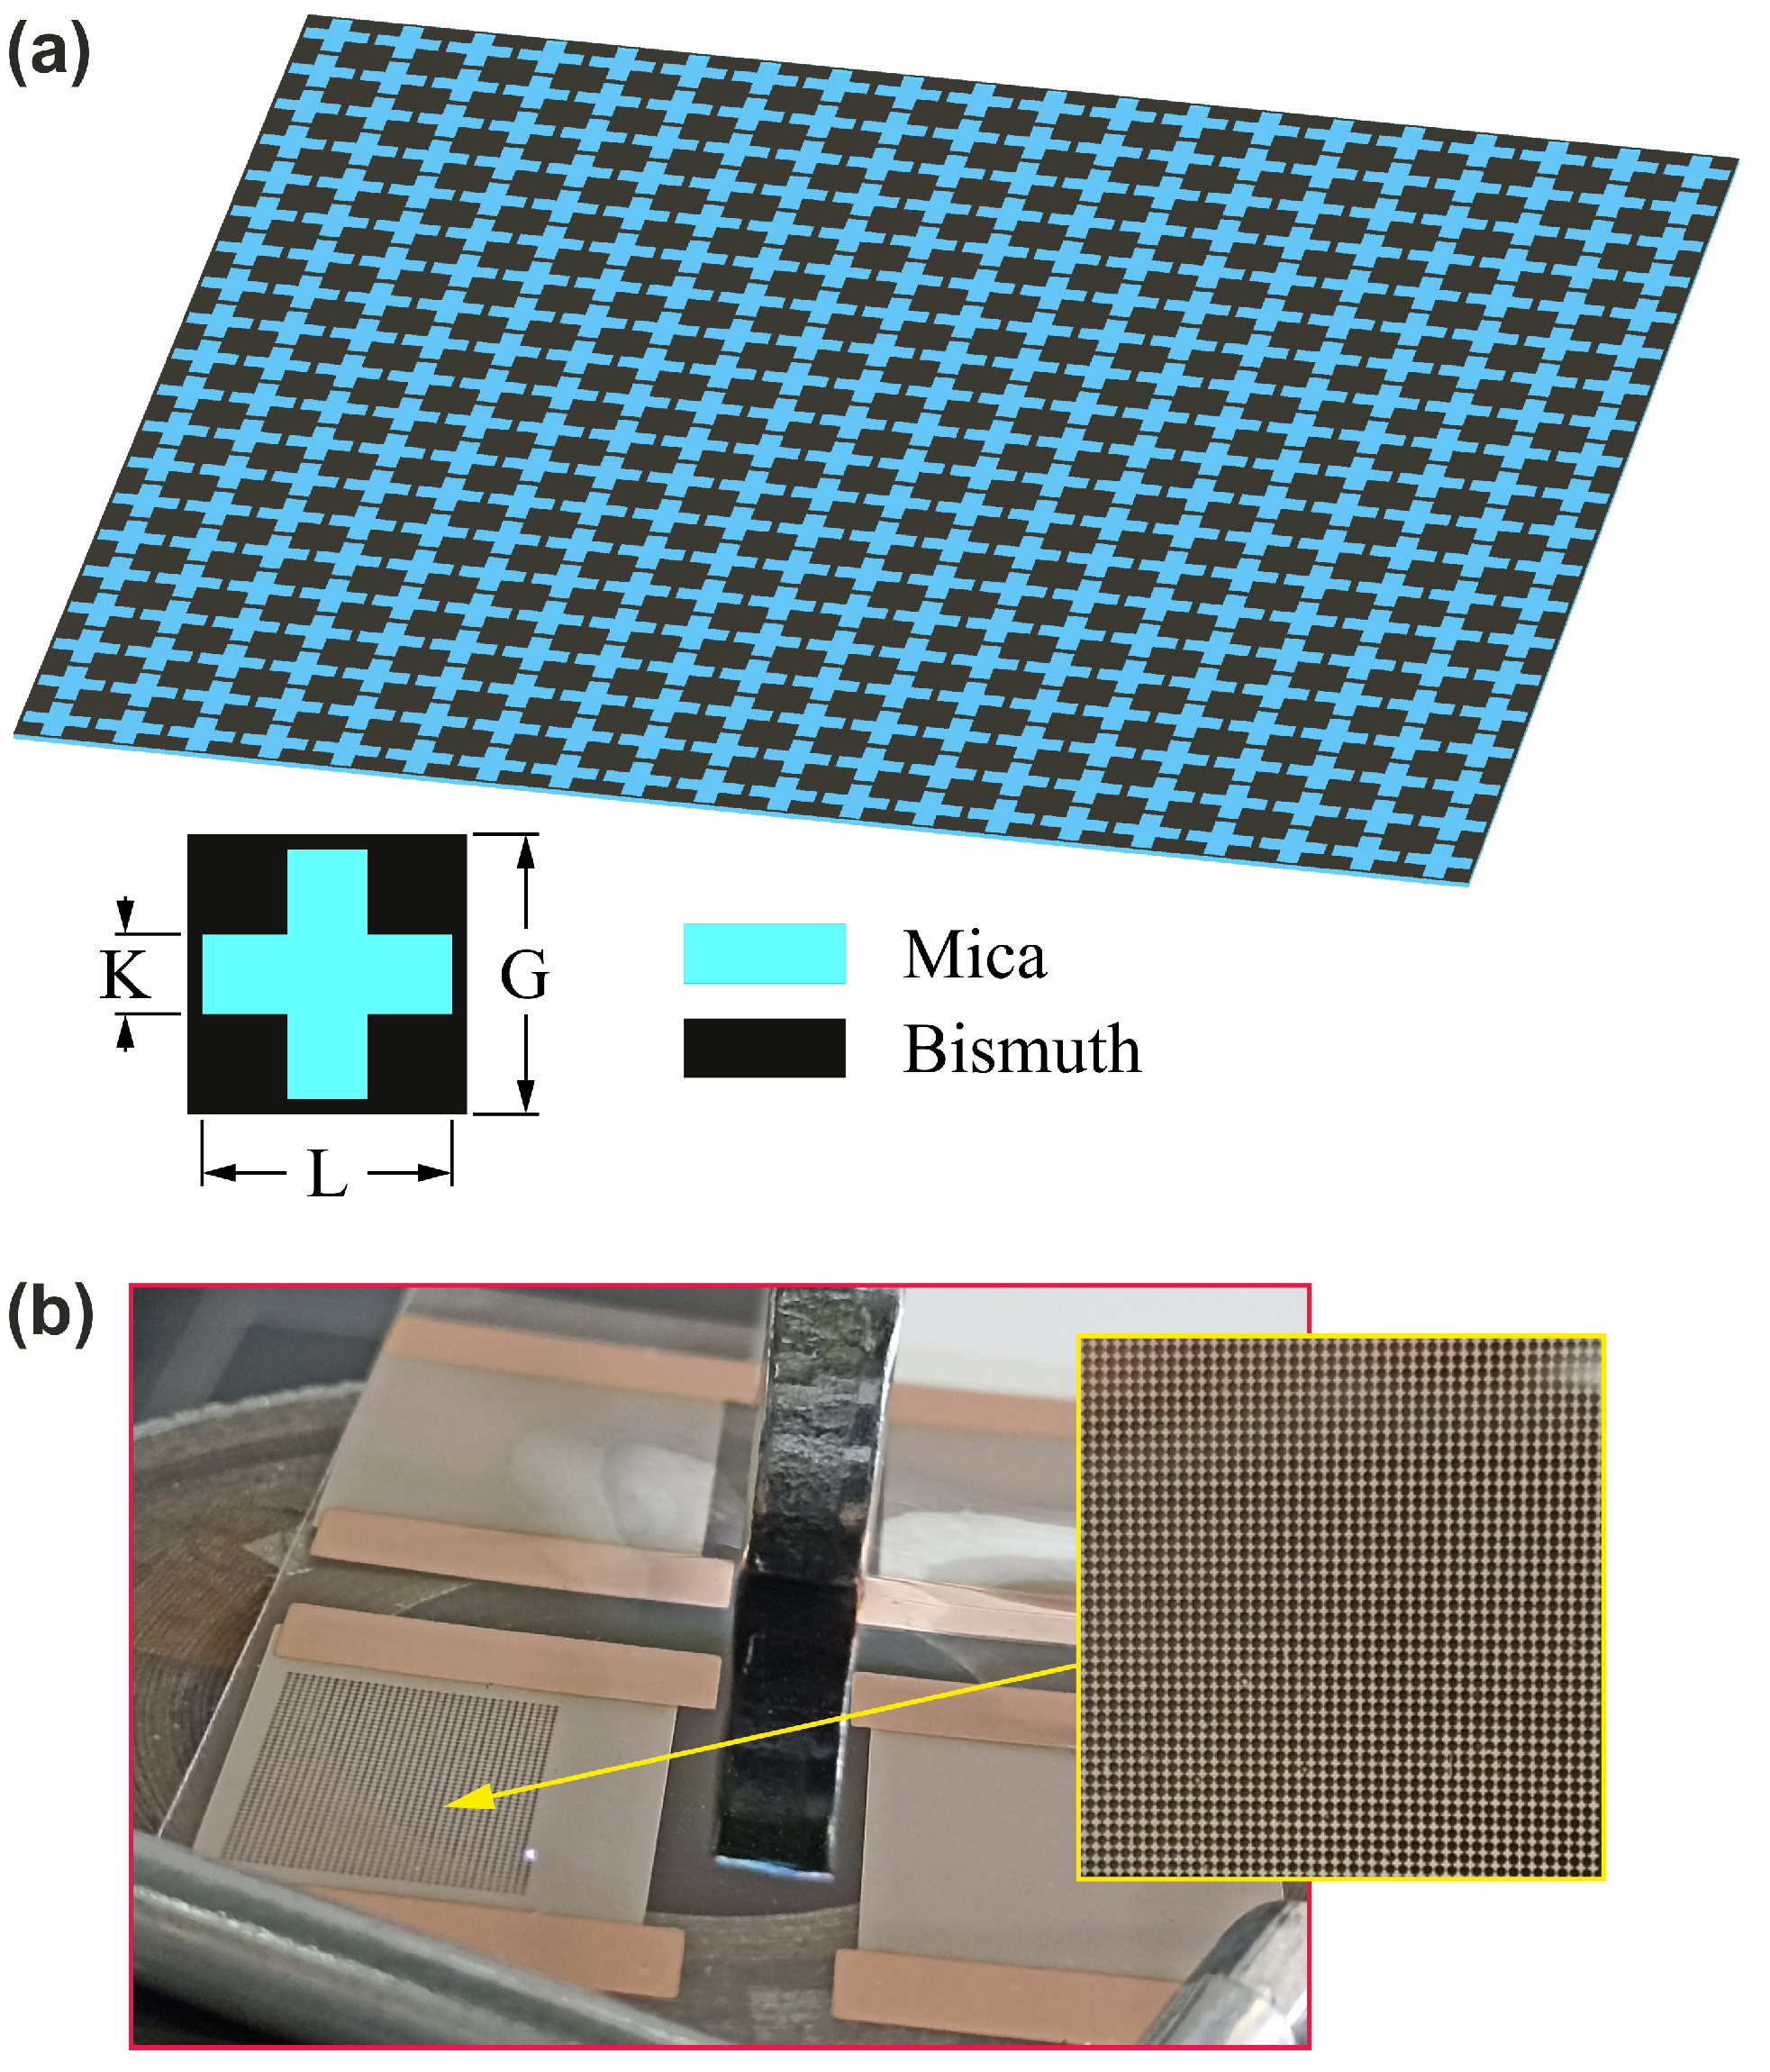
2.1. Sample Preparation

The thickness of the bismuth film was chosen toachieve high conductivity and to provide transmission at the same time [37,38]. A thin, almost transparent mica substrate was chosen for THz waves due to its stable geometry and its ability to grow a high-quality bismuth film with a large average crystallit size. Bi film with a thickness of 120 nm on 21 μm mica substrate was synthesized by thermal evaporation (spraying) in a vacuum of 10 5 Torr. A certain portion of a metered substance converted into a gaseous state was deposited on a substrate located above and heated up to 120 °C. Subsequent annealing was performed for 30 min at 250 °C. The thickness of the bismuth film was controlled using a Linnik MII-4 interferometer with an error of 5 nm. The synthesis conditions mentioned above are optimal and therefore allow one to obtain a high-quality thin-film bismuth [39] with a conductivity comparable to that of bulk Bi. It should be mentioned that a classical size effect arises in bismuth films with a thickness of less than about 200 nm, leading to a smooth decrease in their conductivity with decreasing thickness (a quantum size effect occurs under temperatures on the order of liquid nitrogen) [40]. A photo of the continuous-film sample is presented in Figure 1 (inset).

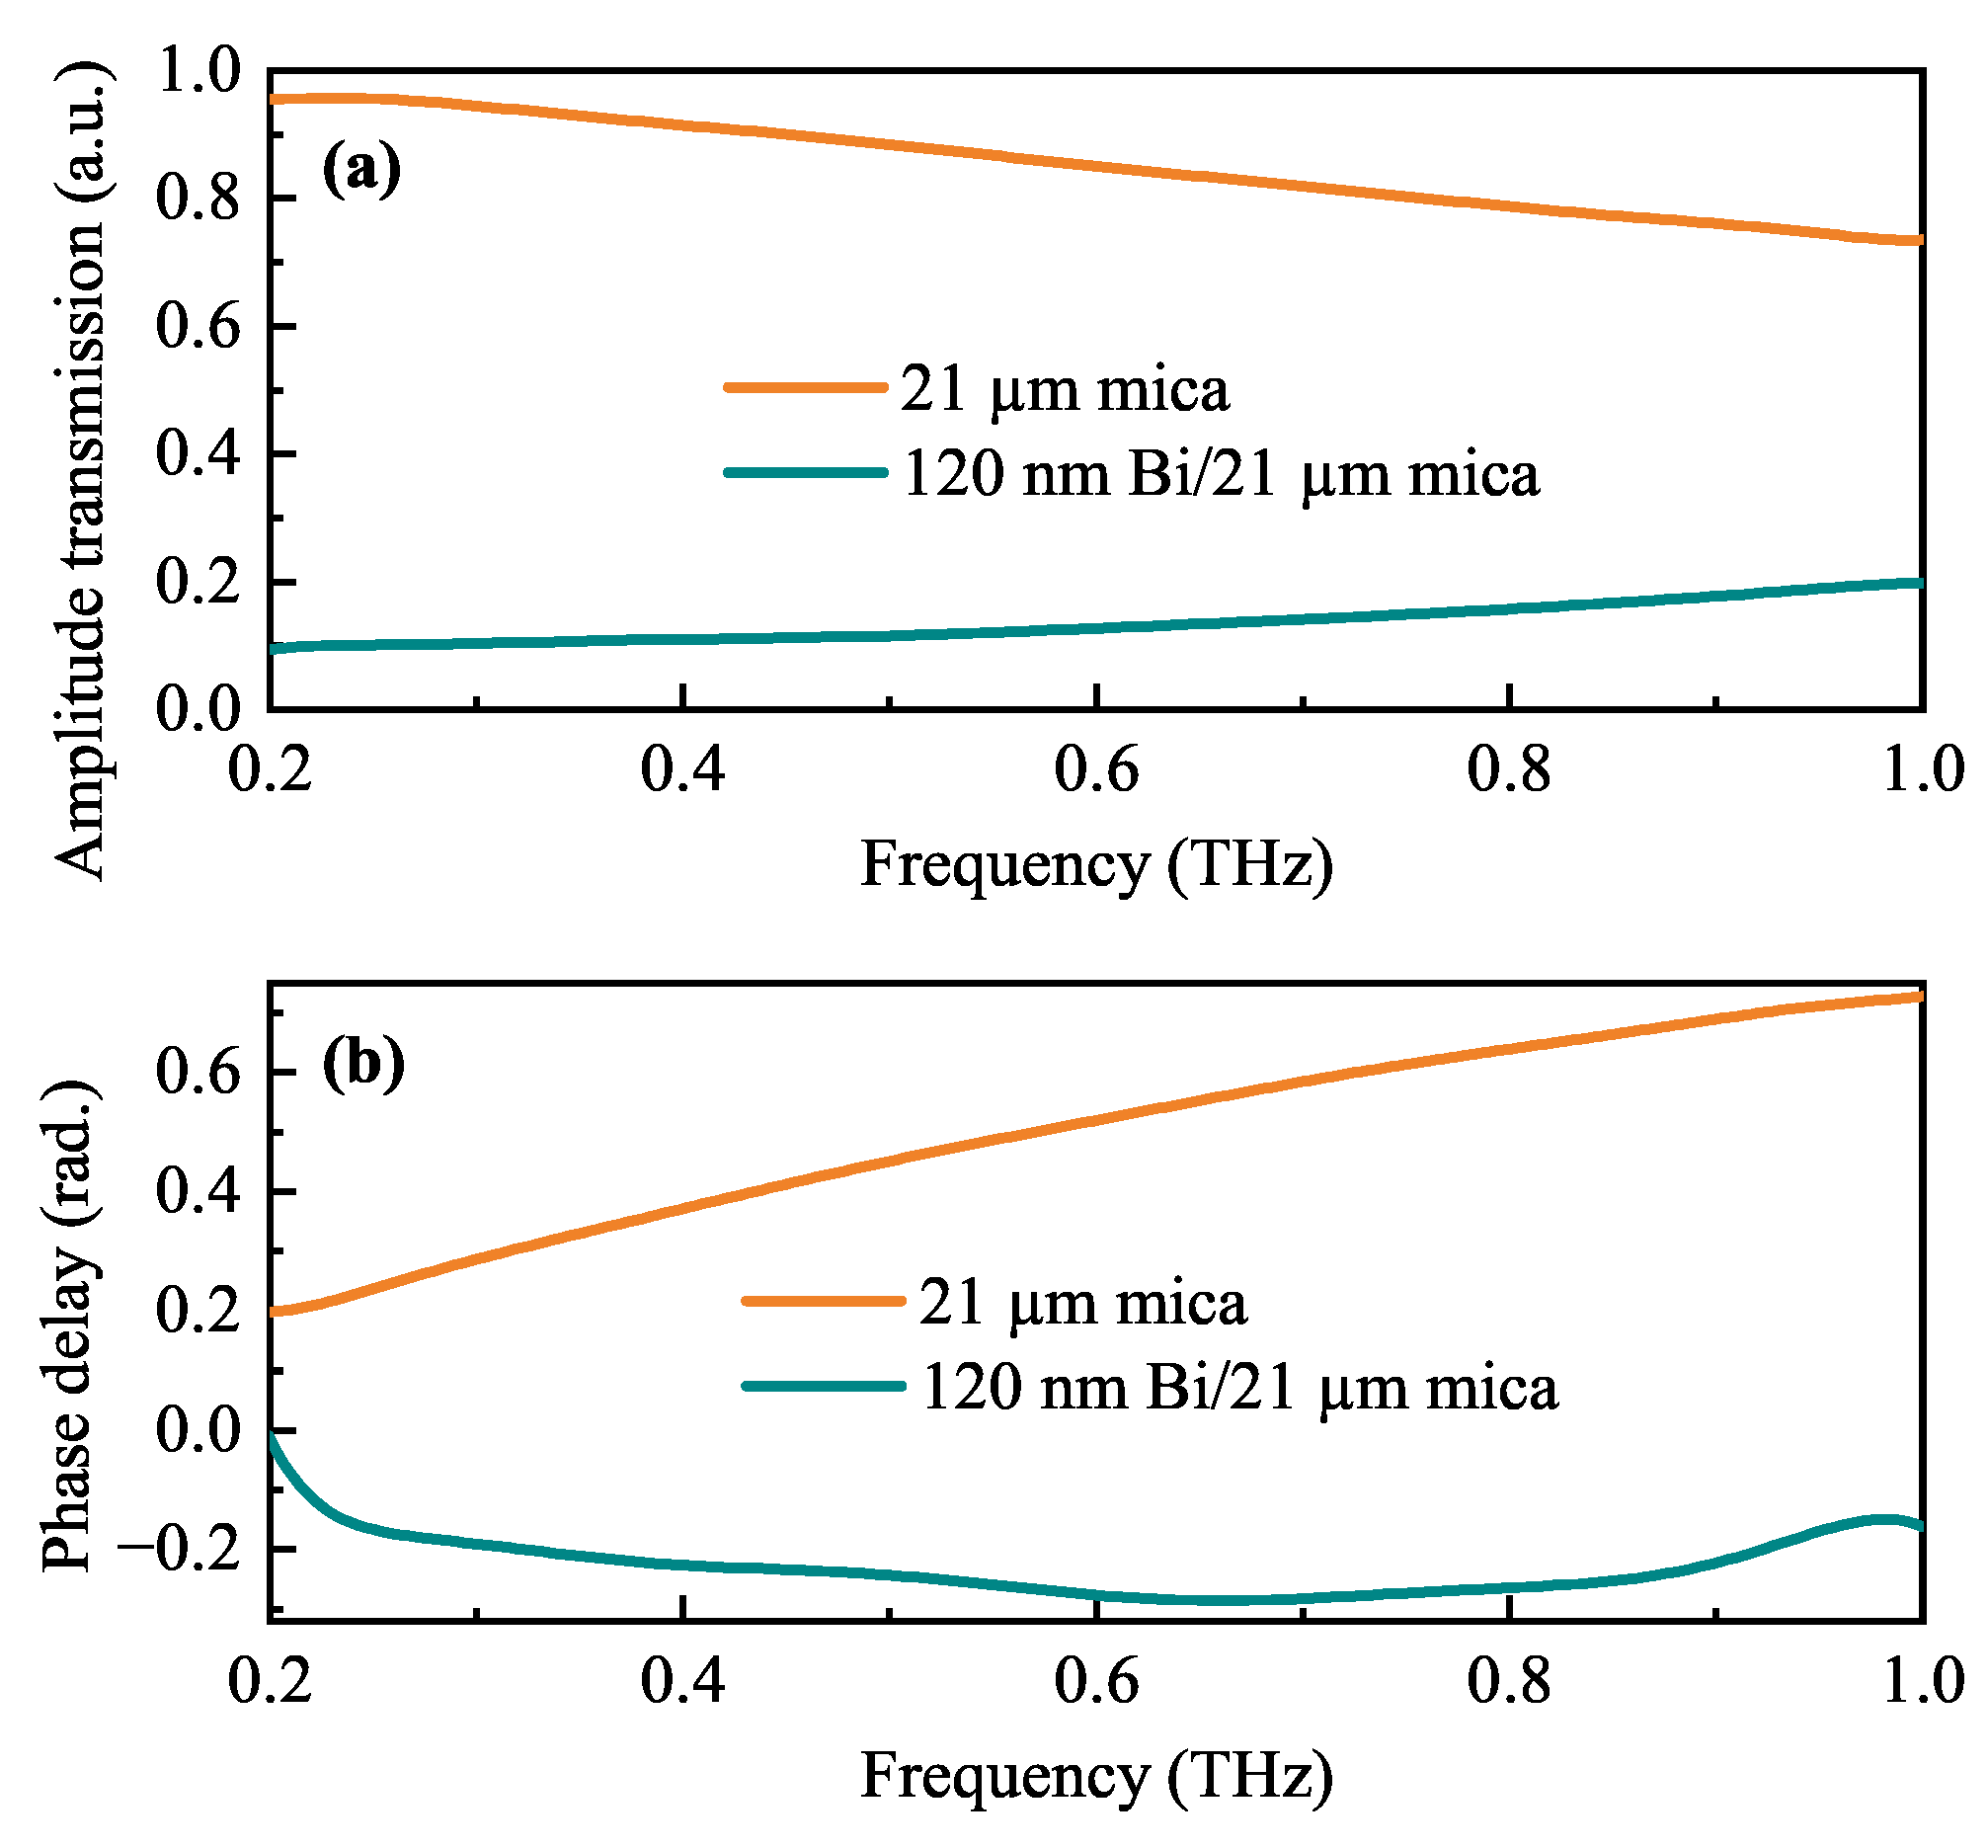
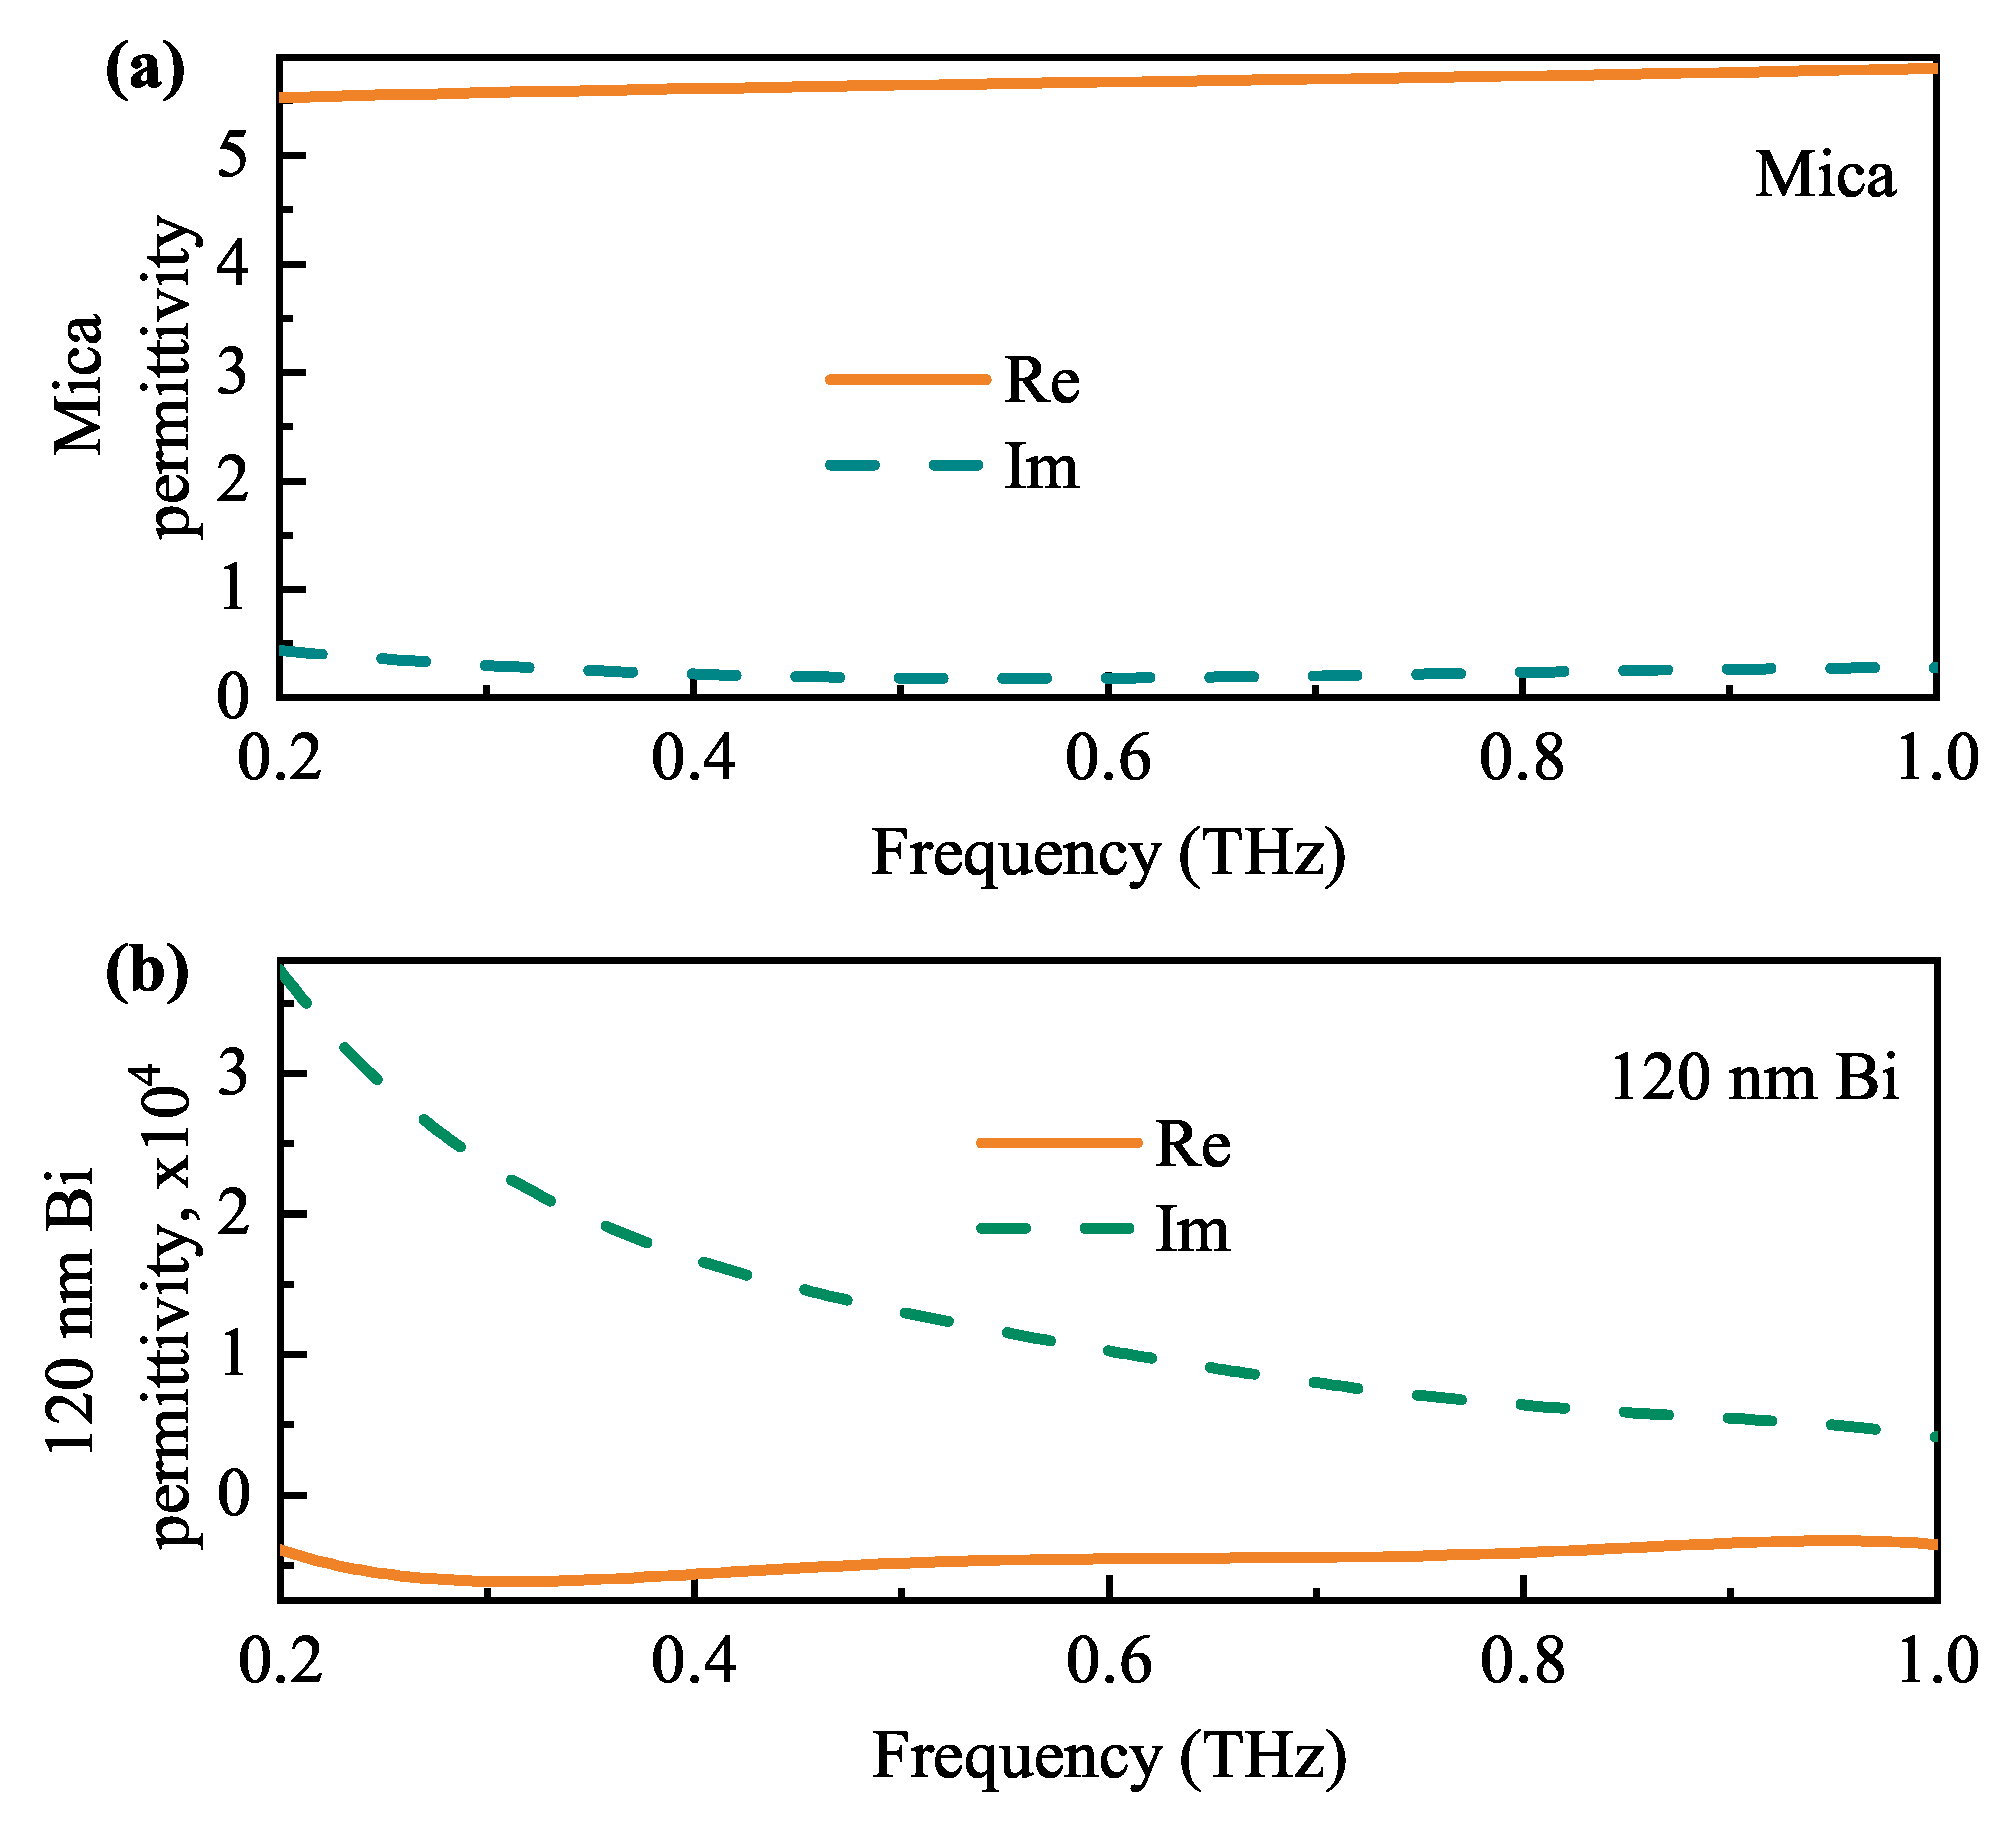
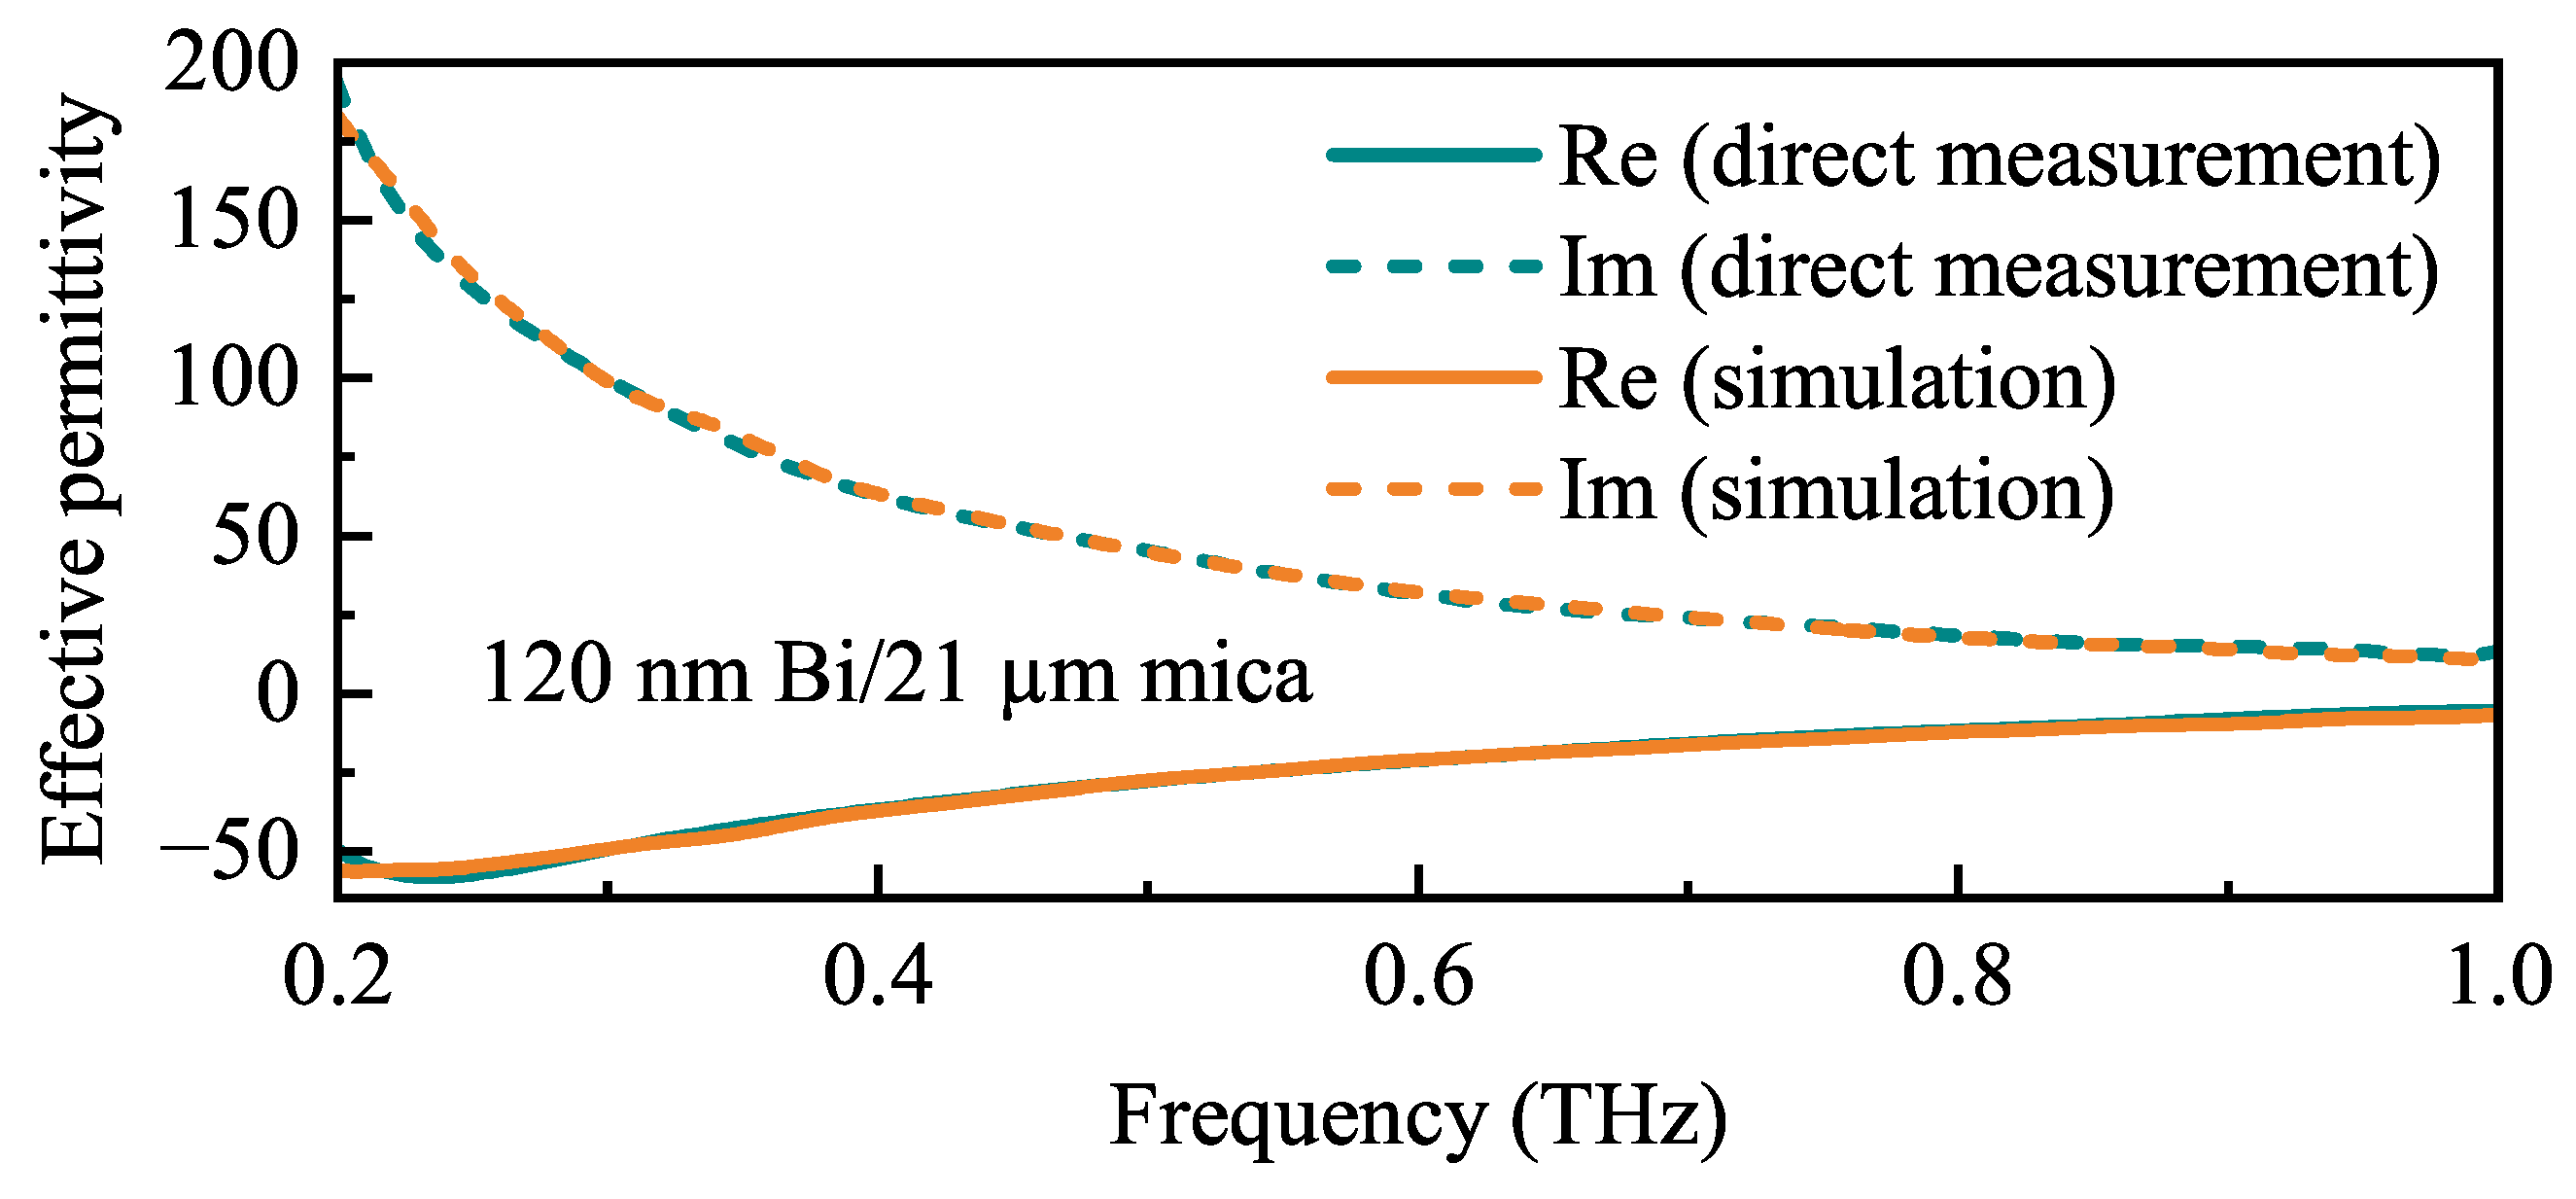
2.2. Measurements, Numerical Simulation, and Material Parameter Extraction

The conventional method of THz time-domain spectroscopy was applied to investigate the optical properties of the sample in the 0.2–1.0 THz frequency range using experimental equipment from Tydex, LLC [41] (see Figure 1). Using a setup (TERA K8, Menlo Systems, Germany) operating in a transmission mode (dynamic range of 65 dB), waveforms of THz pulses that passed through the air, the mica substrate, and the bismuth–mica structure were measured. The instrumental measurement error is estimated to be no more than 5%, including errors in substrate and thin film thickness measurements. To ensure high-frequency resolution of 3.62 GHz, the length of waveforms was set to 276 ps. No filtering was applied in order to save all spectral features of the medium under study. Then, waveforms were converted into complex amplitude spectra, providing information about both amplitude and the phase spectra of the THz wave. Rationing the spectrum of complex amplitudes to a reference spectrum (THz signal passed through the air) yields the transmission spectrum of the structure and the corresponding phase delay. These data are used to calculate dispersions of a complex refractive index ( n ^ ( f ) ) and a complex permittivity ( ε ^ ( f ) = n ^ 2 ( f ) ), whether it is a dielectric substrate (homogeneous medium) or a substrate-film effective medium (heterogeneous) [42,43]:
n ( f ) = c ϕ m e d i u m ( f ) ϕ a i r ( f ) 2 π f d + n a i r ,
T ( f ) = 4 n ( f ) n a i r [ n ( f ) + n a i r ] 2 ,
n ( f ) = c ln T ( f ) / E ^ m e d i u m ( f ) / E ^ a i r ( f ) 2 π f d ,
n ^ ( f ) = n ( f ) i n ( f ) ,
where E ^ m e d i u m ( f ) and E ^ a i r ( f ) are complex amplitudes ( E ^ = E ^ e i ϕ ) of a wave passed through a medium and the air, respectively correspondingly; ϕ m e d i u m ( f ) and ϕ a i r ( f ) are corresponding phases; n a i r = 1 is the air refractive index; T ( f ) is a power transmission coefficient; and i represents the imaginary unit. However, this equation may result in an error for an absorbing medium, since it does not take into account the mutual influence of real and imaginary parts of n ^ ( f ) on each other. To obtain an exact value of n ^ ( f ) , the iterative method that takes into account a complex power transmission coefficient is applied [43,44]. Briefly, an initial value of a complex refractive index (extracted by Equation (2)) is used to calculate a complex transfer function
H ^ m o d e l ( f ) = 4 n ^ ( f ) n a i r n ^ ( f ) + n a i r 2 · e x p i n ^ ( f ) n a i r 2 π f d c · F P ^ ( f ) ,
where the first term is a complex power transmission coefficient, and the last term is responsible for multiple reflections inside the sample (Fabry–Pérot effect):
F P ^ ( f ) = 1 n ^ ( f ) n a i r n ^ ( f ) + n a i r 2 e x p 2 i n ^ ( f ) 2 π f d c 1 .
This transfer function is compared with that measured in an experiment or obtained as a result of simulation ( H ^ m e a s u r e d ( f ) = E ^ m e d i u m ( f ) / E ^ a i r ( f ) ), and a corresponding correction is applied to values of real and imaginary partsof a complex refractive index:
E R m ( f ) = H ^ m e a s u r e d ( f ) H ^ m o d e l ( f ) ,
E R p ( f ) = H ^ m e a s u r e d ( f ) H ^ m o d e l ( f ) ,
R e [ n ^ n e w ( f ) ] = R e [ n ^ o l d ( f ) ] s · E R p ( f ) ,
I m [ n ^ n e w ( f ) ] = I m [ n ^ o l d ( f ) ] s · E R m ( f ) ,
where E R m ( f ) and E R p ( f ) are magnitude and phase errors, respectively; H ^ m e a s u r e d ( f ) and H ^ m o d e l ( f ) are measured and modeled magnitude dispersions, respectively; H ^ m e a s u r e d ( f ) and H ^ m o d e l ( f ) are corresponding phase angle dispersions; n ^ n e w ( f )   n ^ o l d ( f ) are complex refractive index values on current and previous iterations, respectively; and s is a correction factor typically set to 0.01 to ensure algorithm convergence. The procedure is repeated until the difference between measured and calculated (or simulated) transfer functions is less than a specified error. This function can be used to extract a complex permittivity dispersion of both a substrate and a substrate-film effective medium. Only after this stage is the roughness of the resulting dispersion smoothed using high-order polynomials.
Since a thin bismuth film is placed on a substrate and its permittivity dispersion cannot be measured directly, Tinkham’s method for thin films is applied to extract a Bi film in-plane complex conductivity dispersion [45]:
σ ^ B i ( f ) = [ ( n ^ m i c a ( f ) + 1 ) E ^ m i c a ( f ) / E ^ B i + m i c a ( f ) n ^ m i c a ( f ) 1 ] / Z 0 ,
where E ^ m i c a ( f ) and E ^ B i + m i c a ( f ) are complex amplitudes of a THz wave transmitted through the mica substrate and the bismuth–mica structure, respectively, and Z 0 is the free space impedance. This conductivity dispersion is then converted into an in-plane permittivity dispersion [46,47]:
ε ^ B i ( f ) = 1 + i σ ^ B i ( f ) / ( 2 π f d B i ε 0 ) ,
where d B i is the thickness of the bismuth film, and ε 0 is the absolute dielectric constant of the vacuum.
Complex permittivity dispersions of a mica and a bismuth film are used in numerical simulation of a heterogeneous layered structure as described further. The result of this simulation, namely a scattering matrix containing scattering parameters, also provides information on the amplitude and phase components of a THz pulse transmitted through the structure in a frequency range of interest. While amplitude information is obtained directly, a corresponding free-space phase shift is subtracted from a phase component to obtain the phase delay of the medium under study. This simulation is carried out using the frequency domain solver of CST Microwave Studio [48]. The periodic boundary conditions are applied in two directions in the xy plane (sample plane), and linearly polarized THz radiation propagates in the z direction. Results of numerical simulation are converted into a complex effective permittivity dispersion by the same method described above.

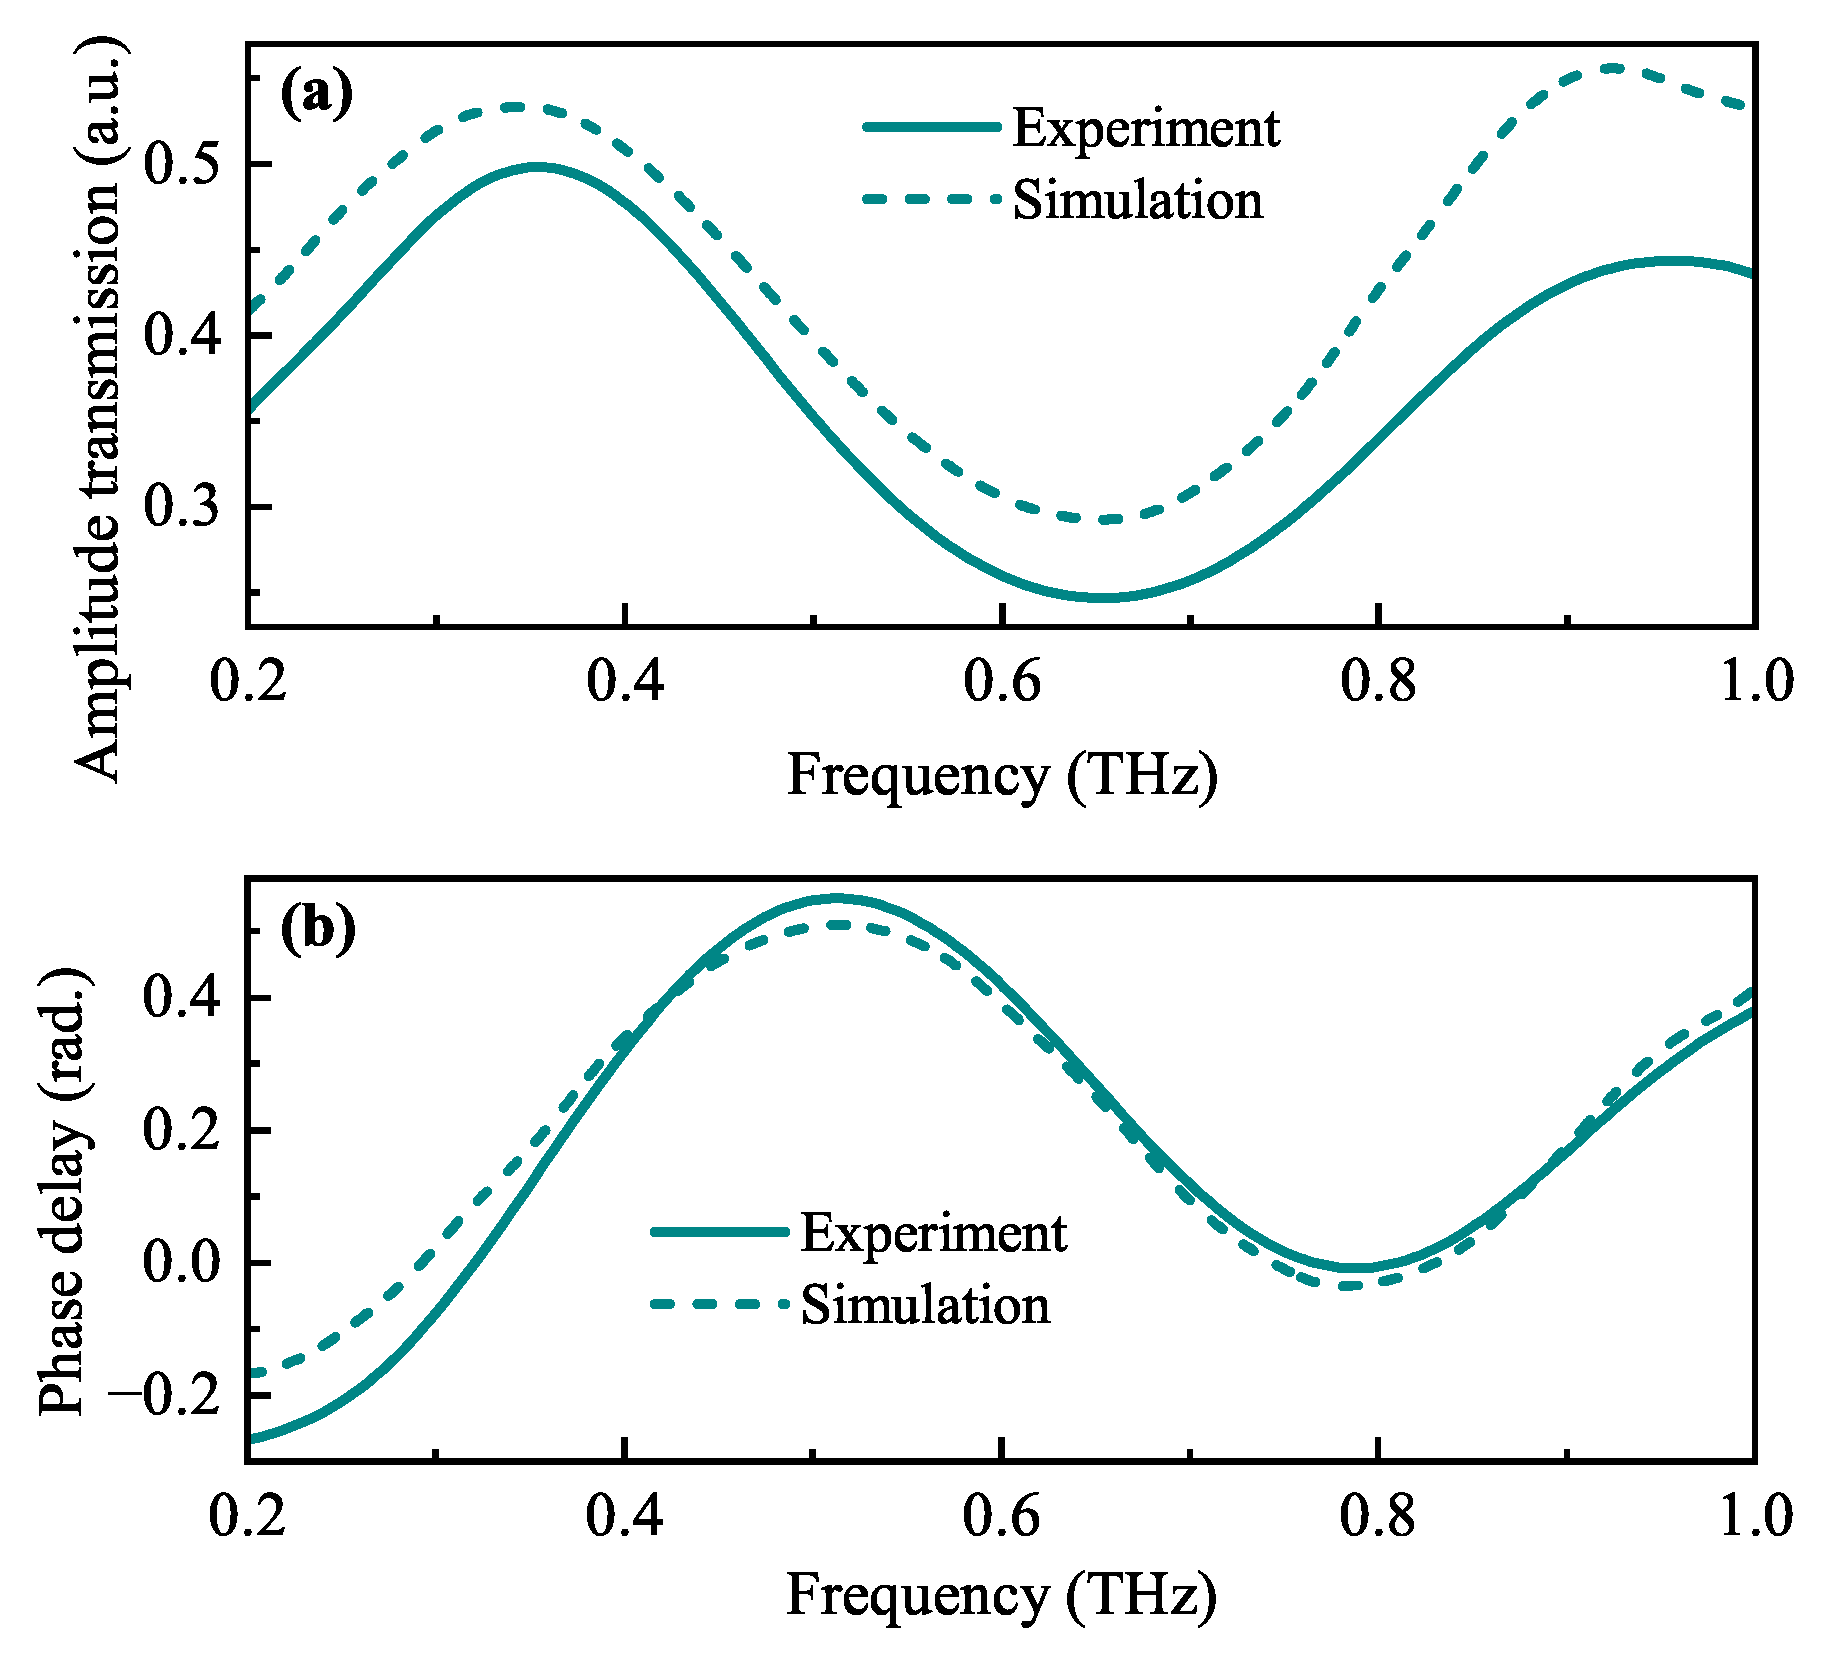
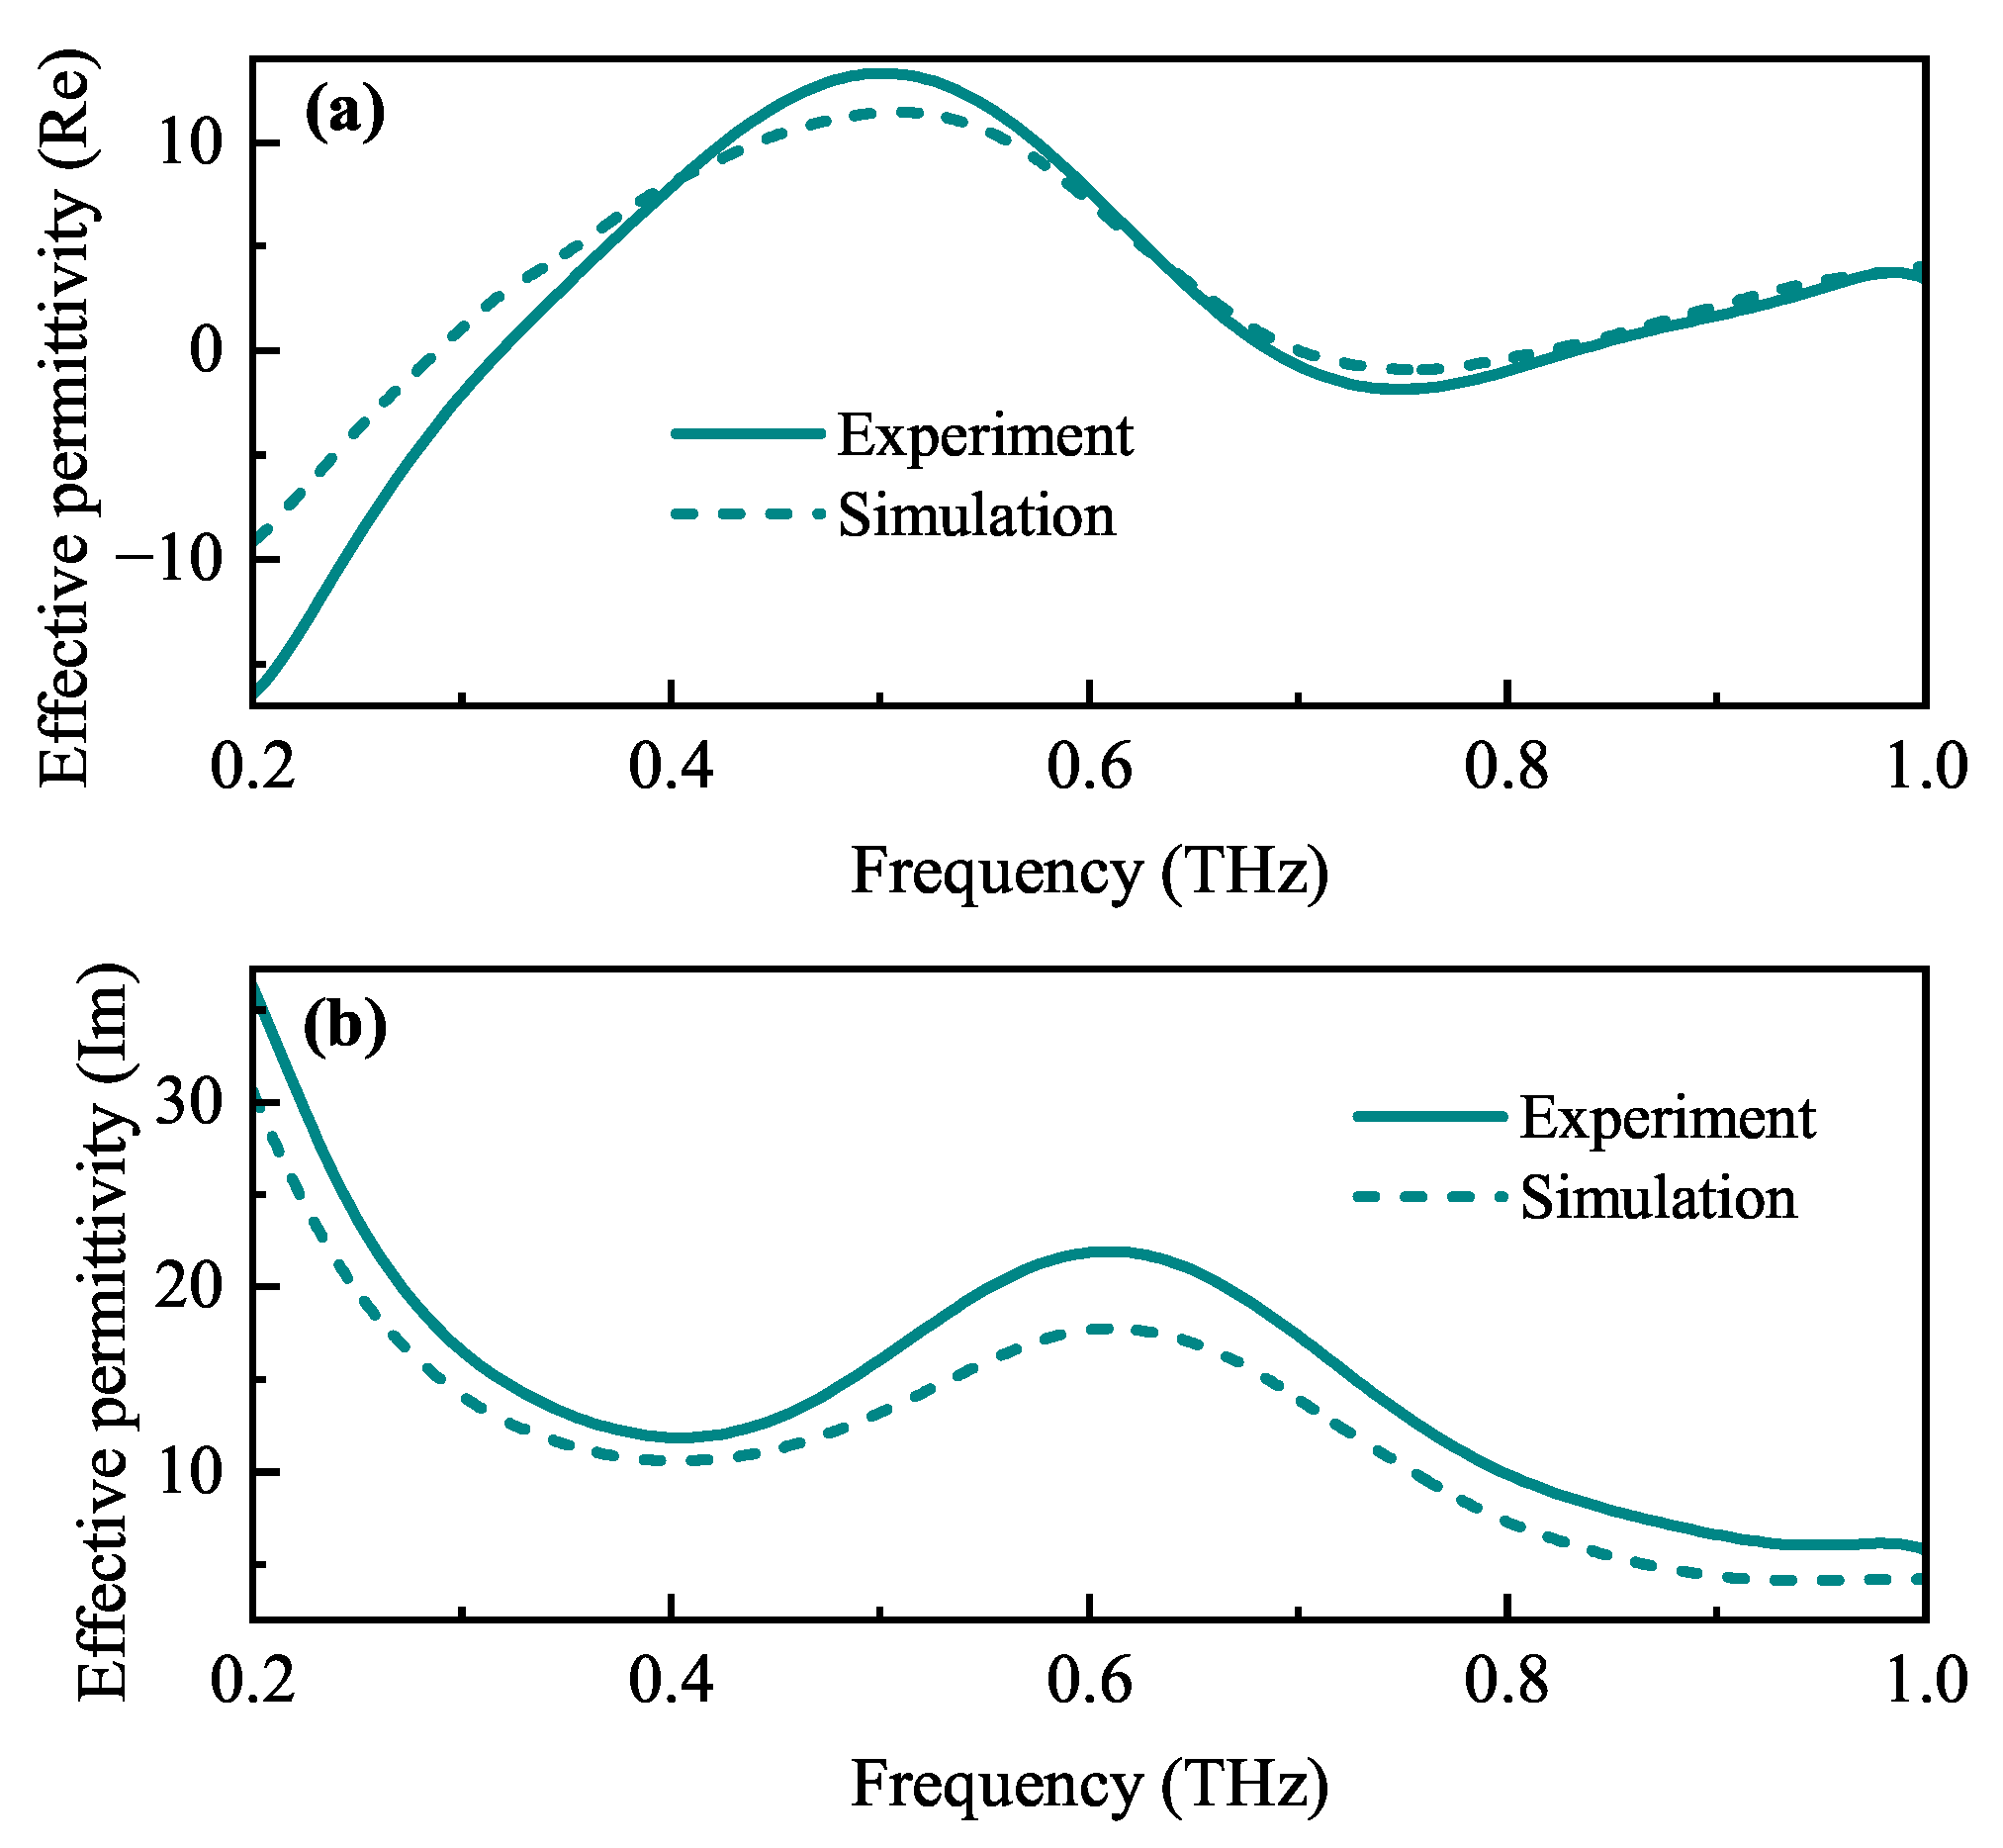
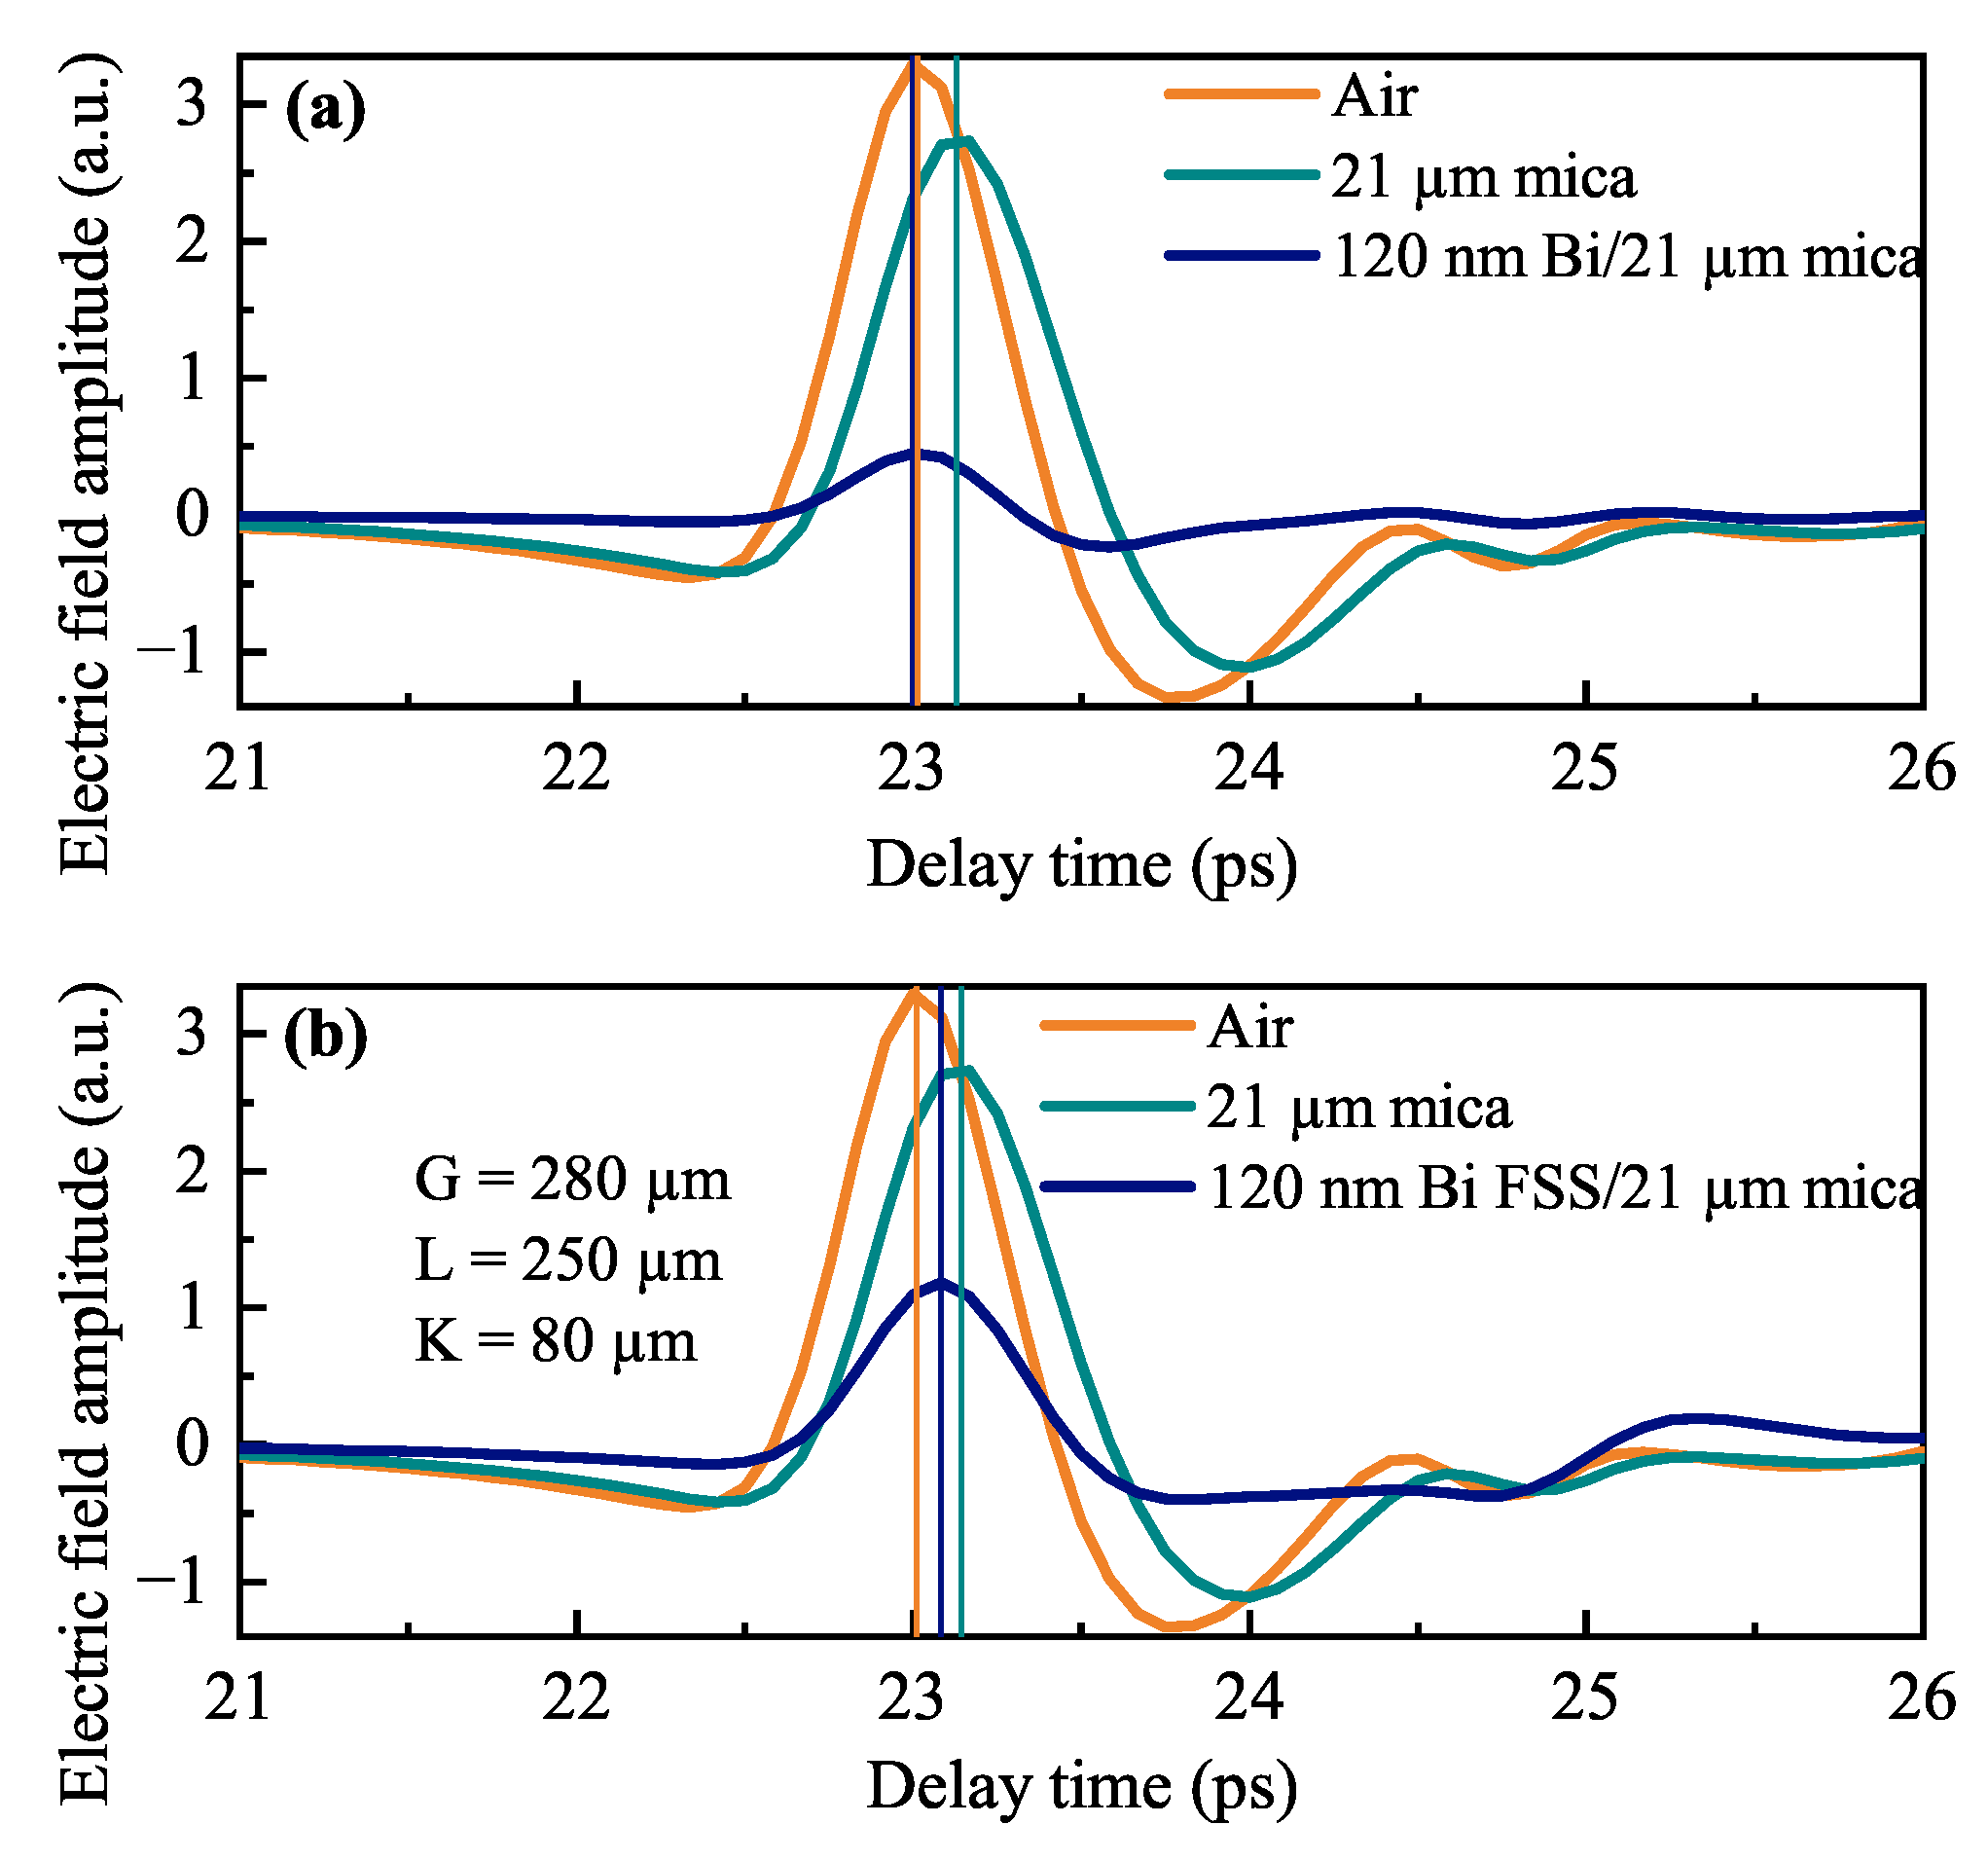
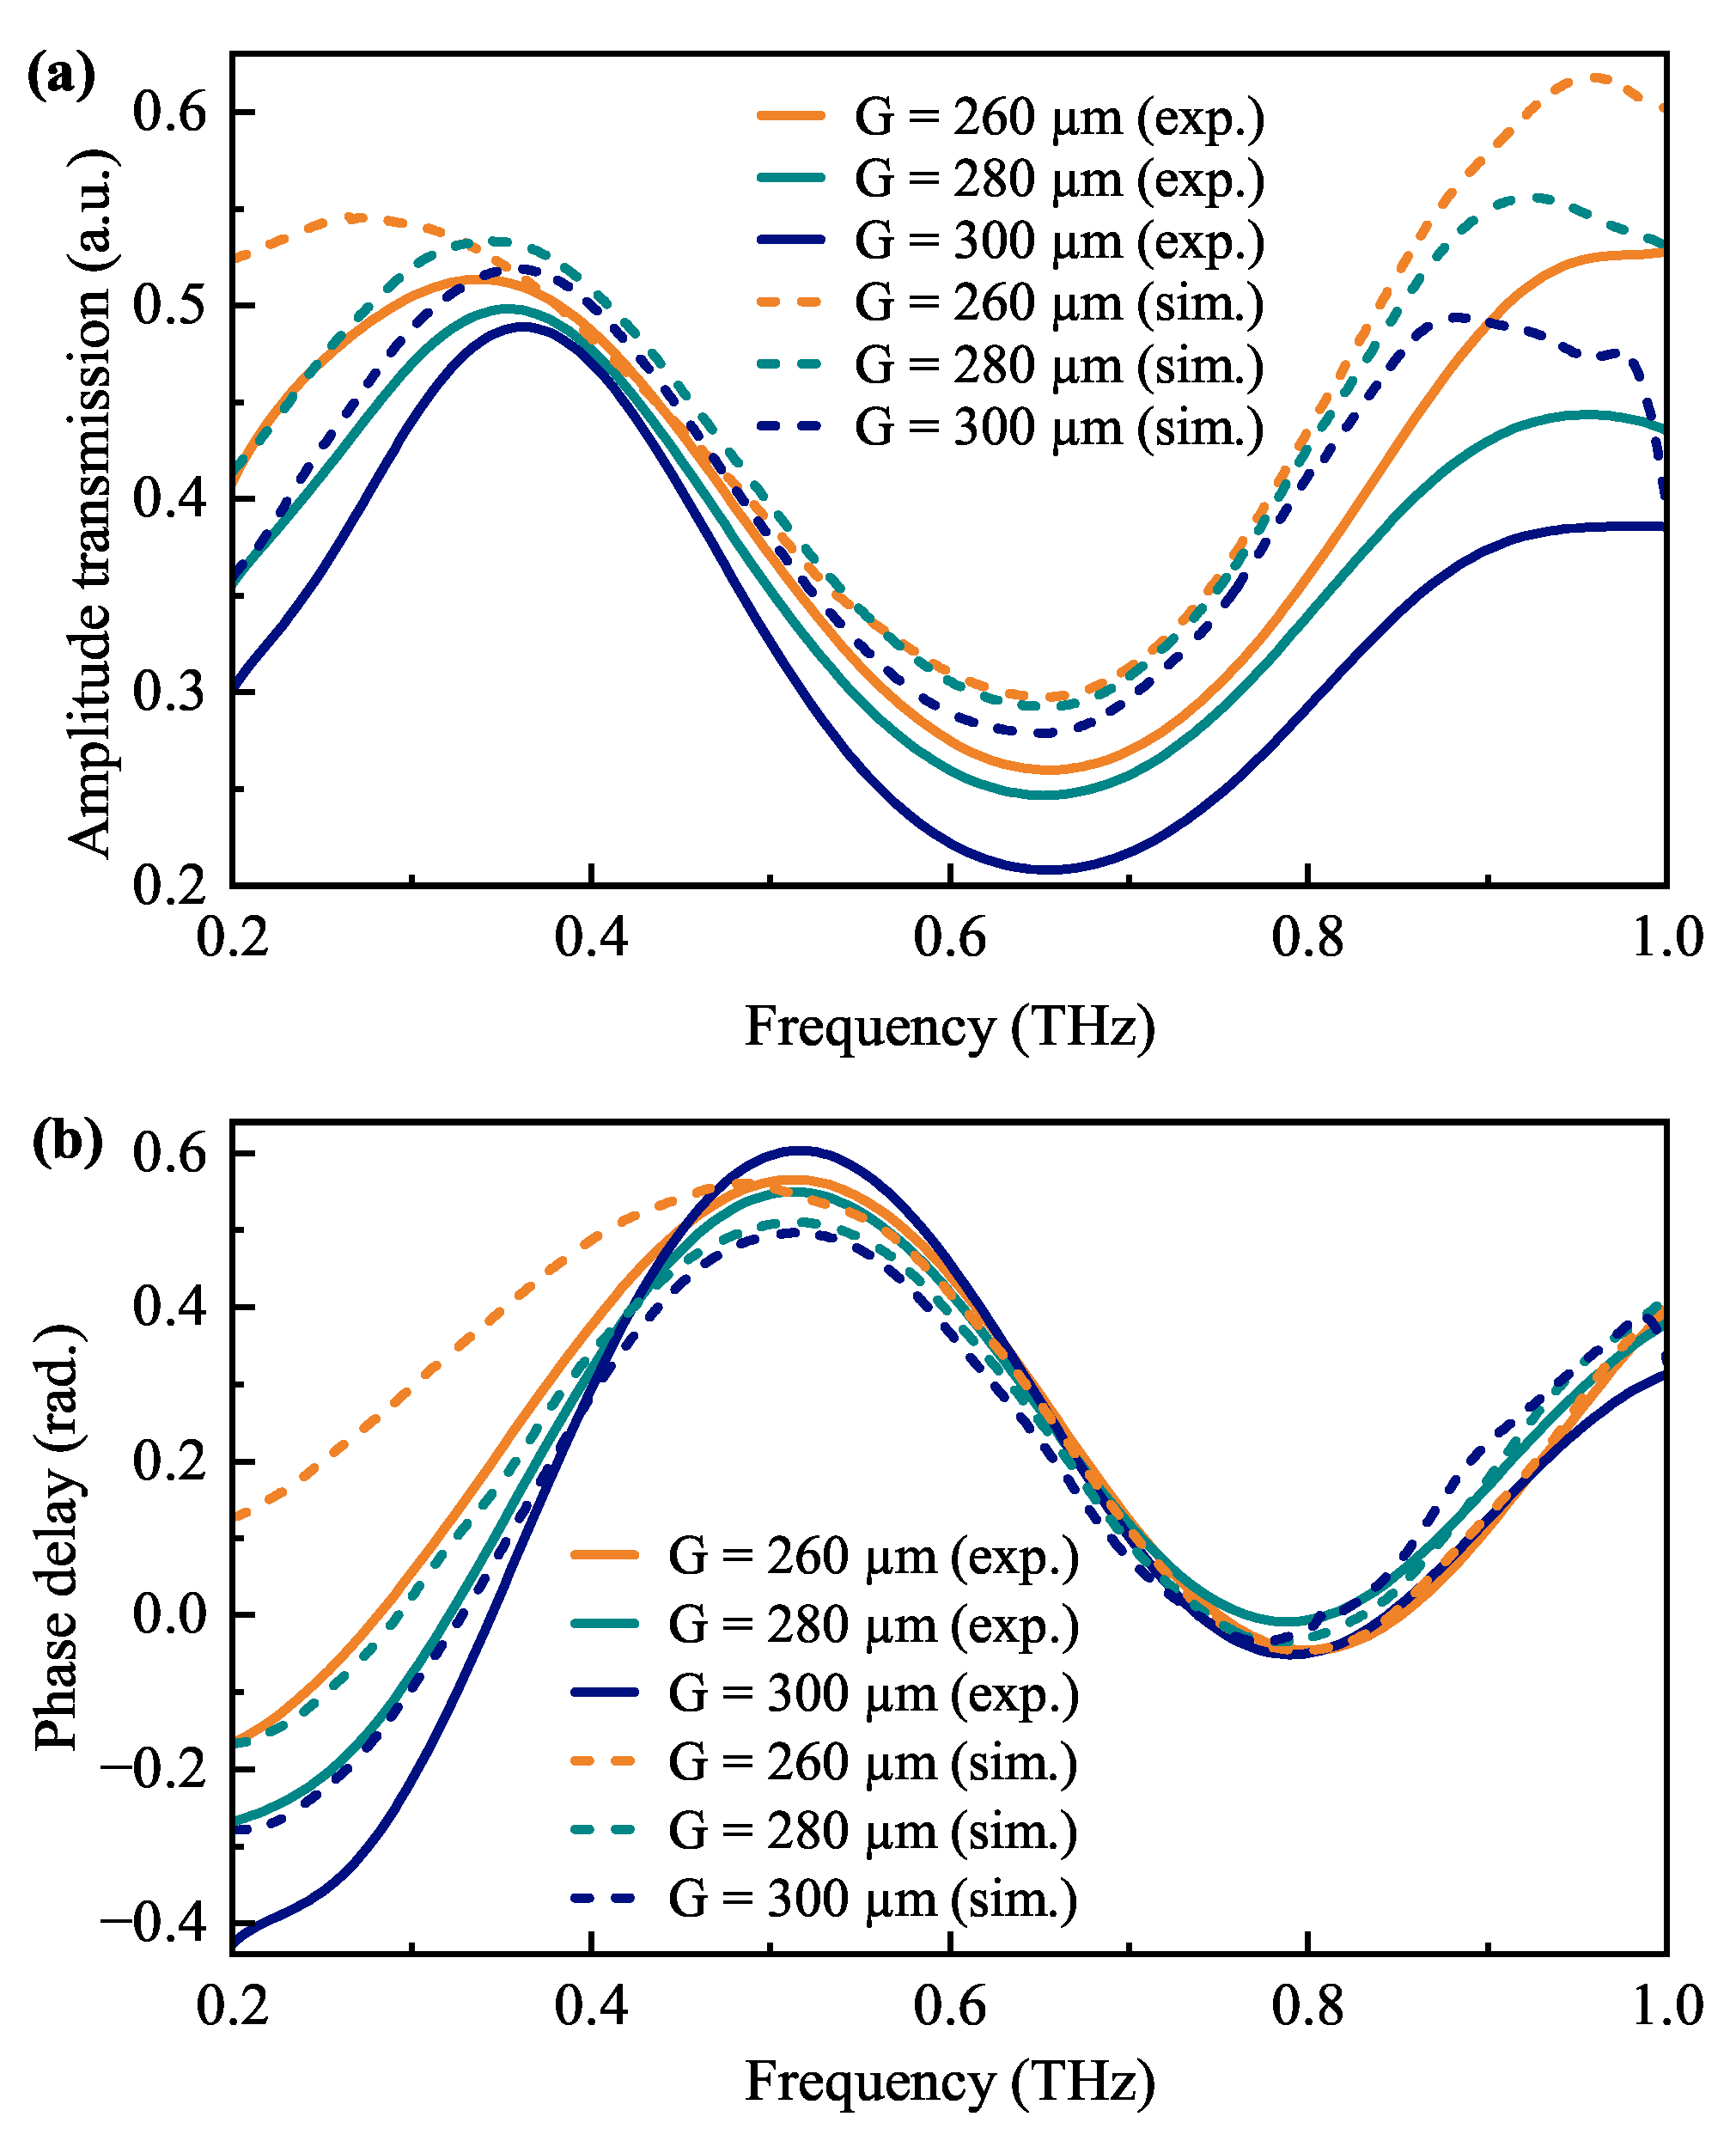
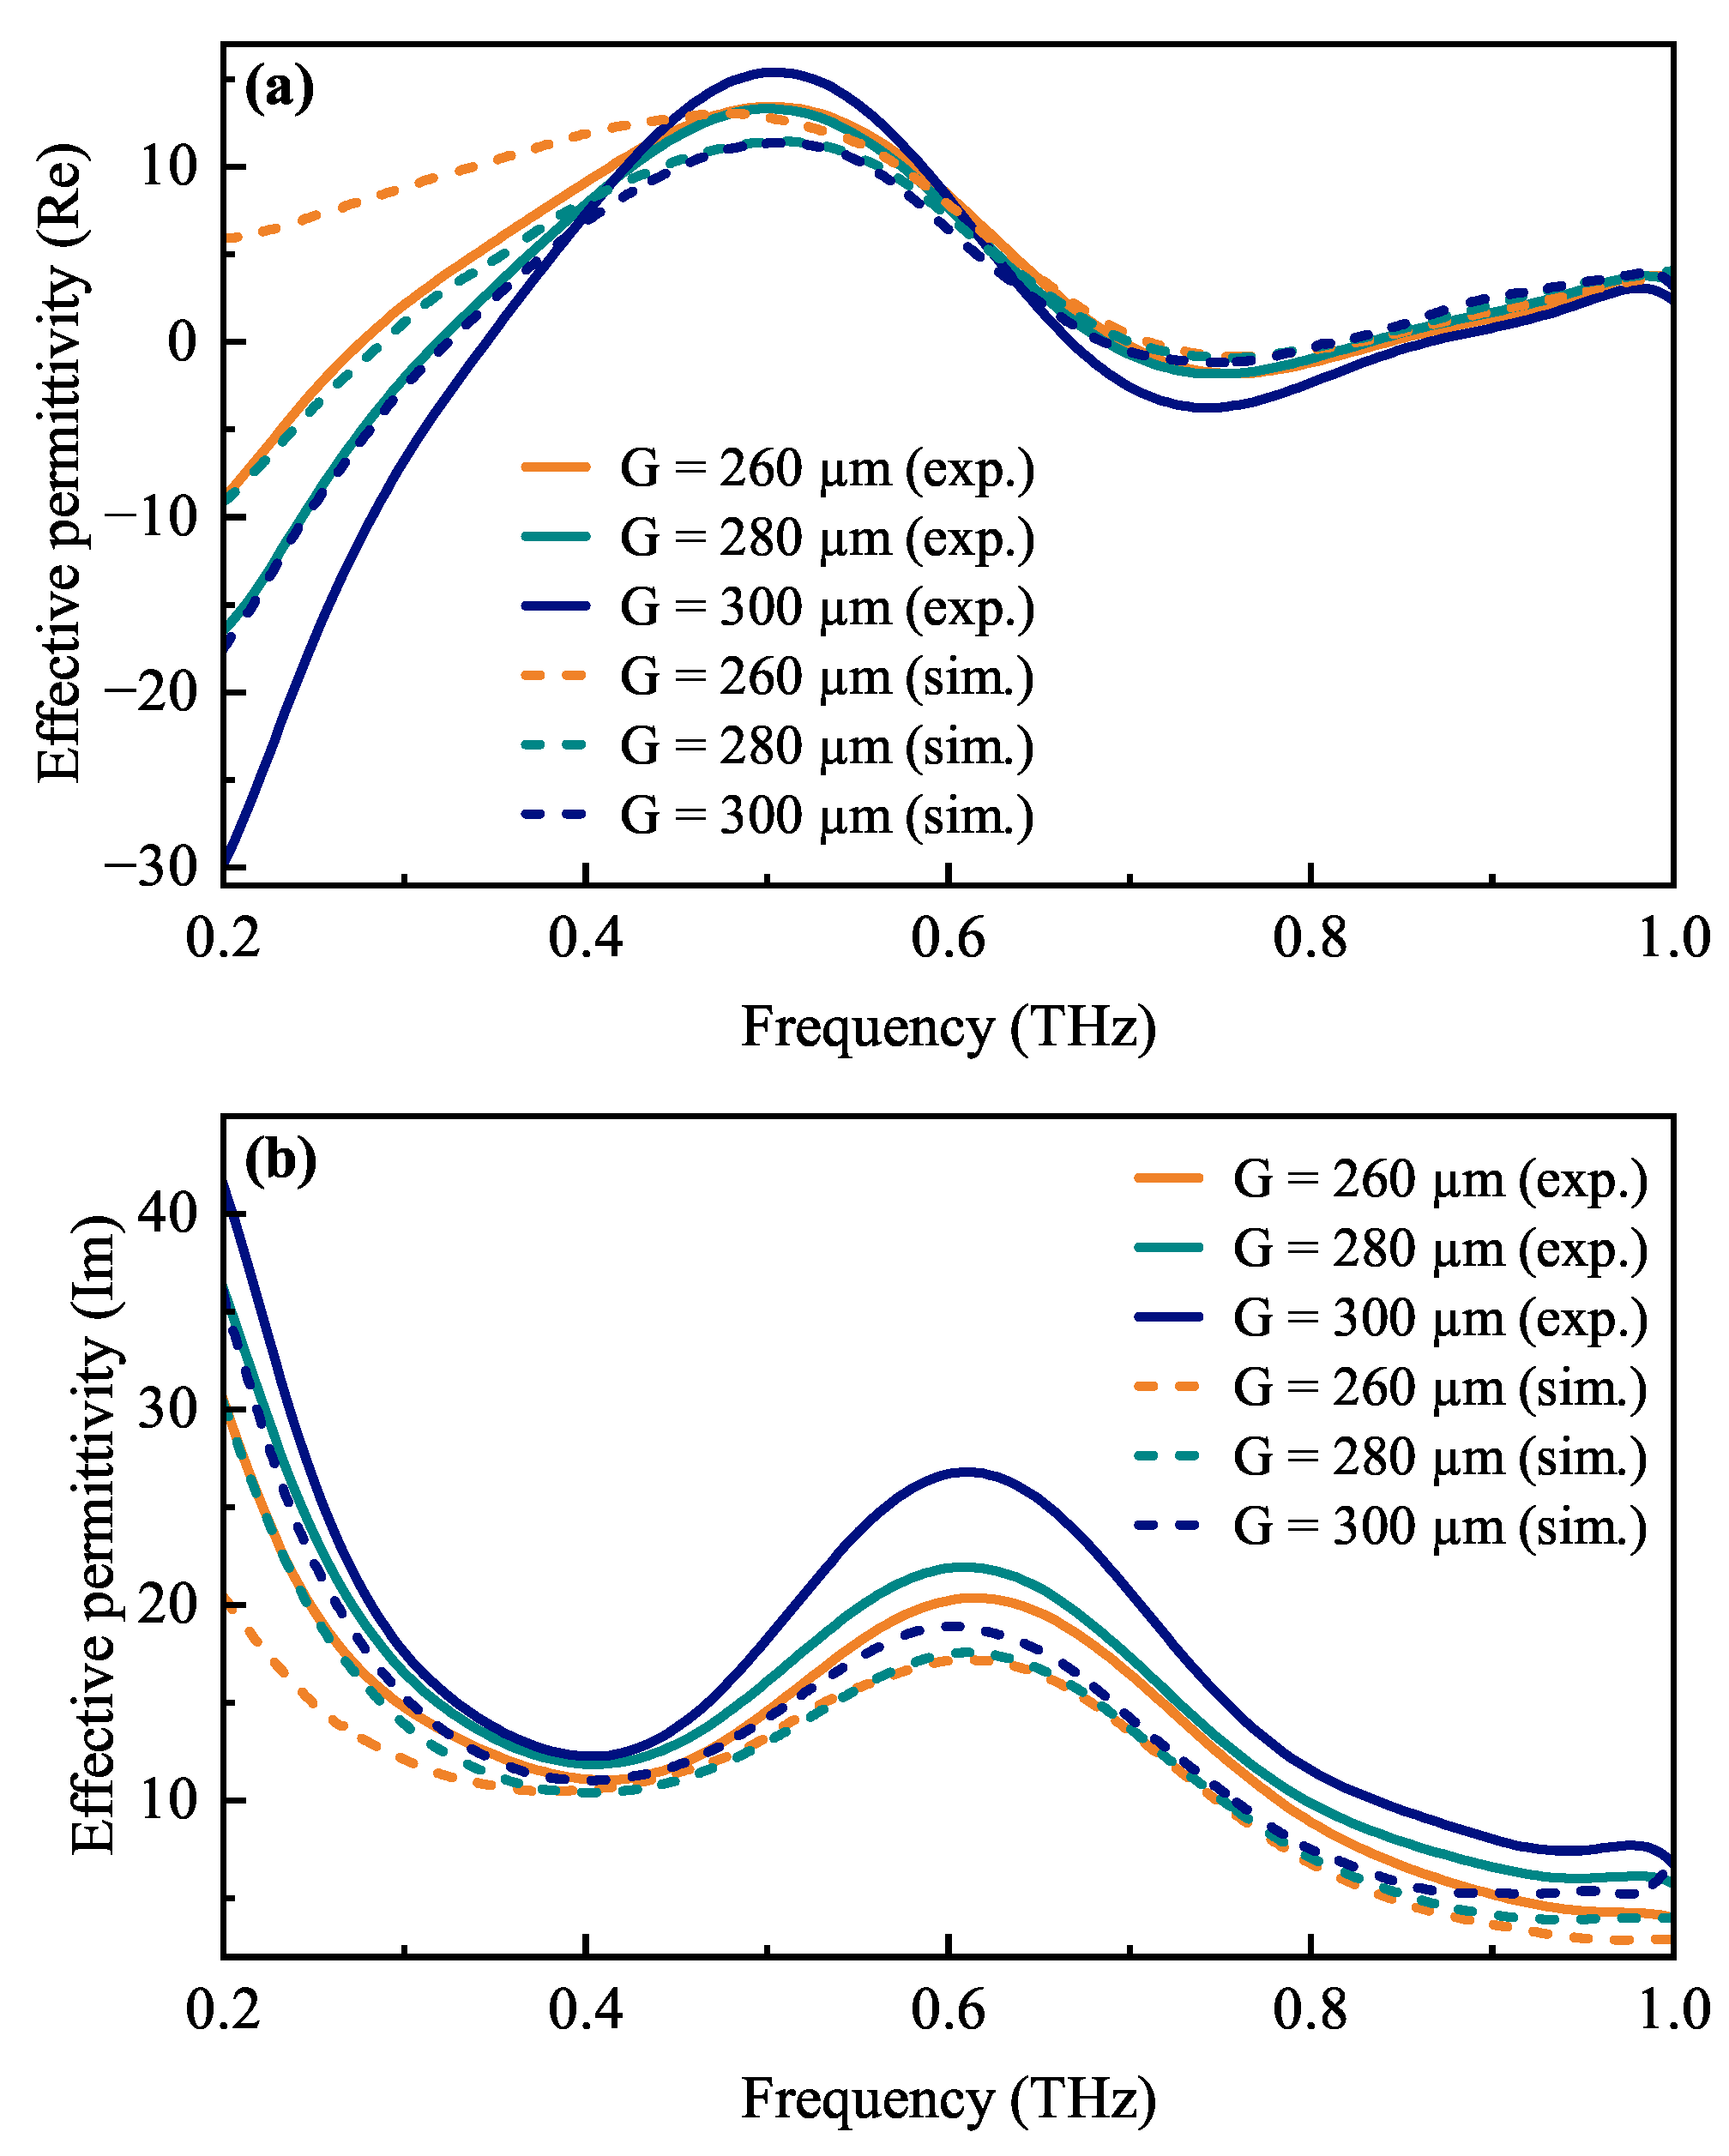
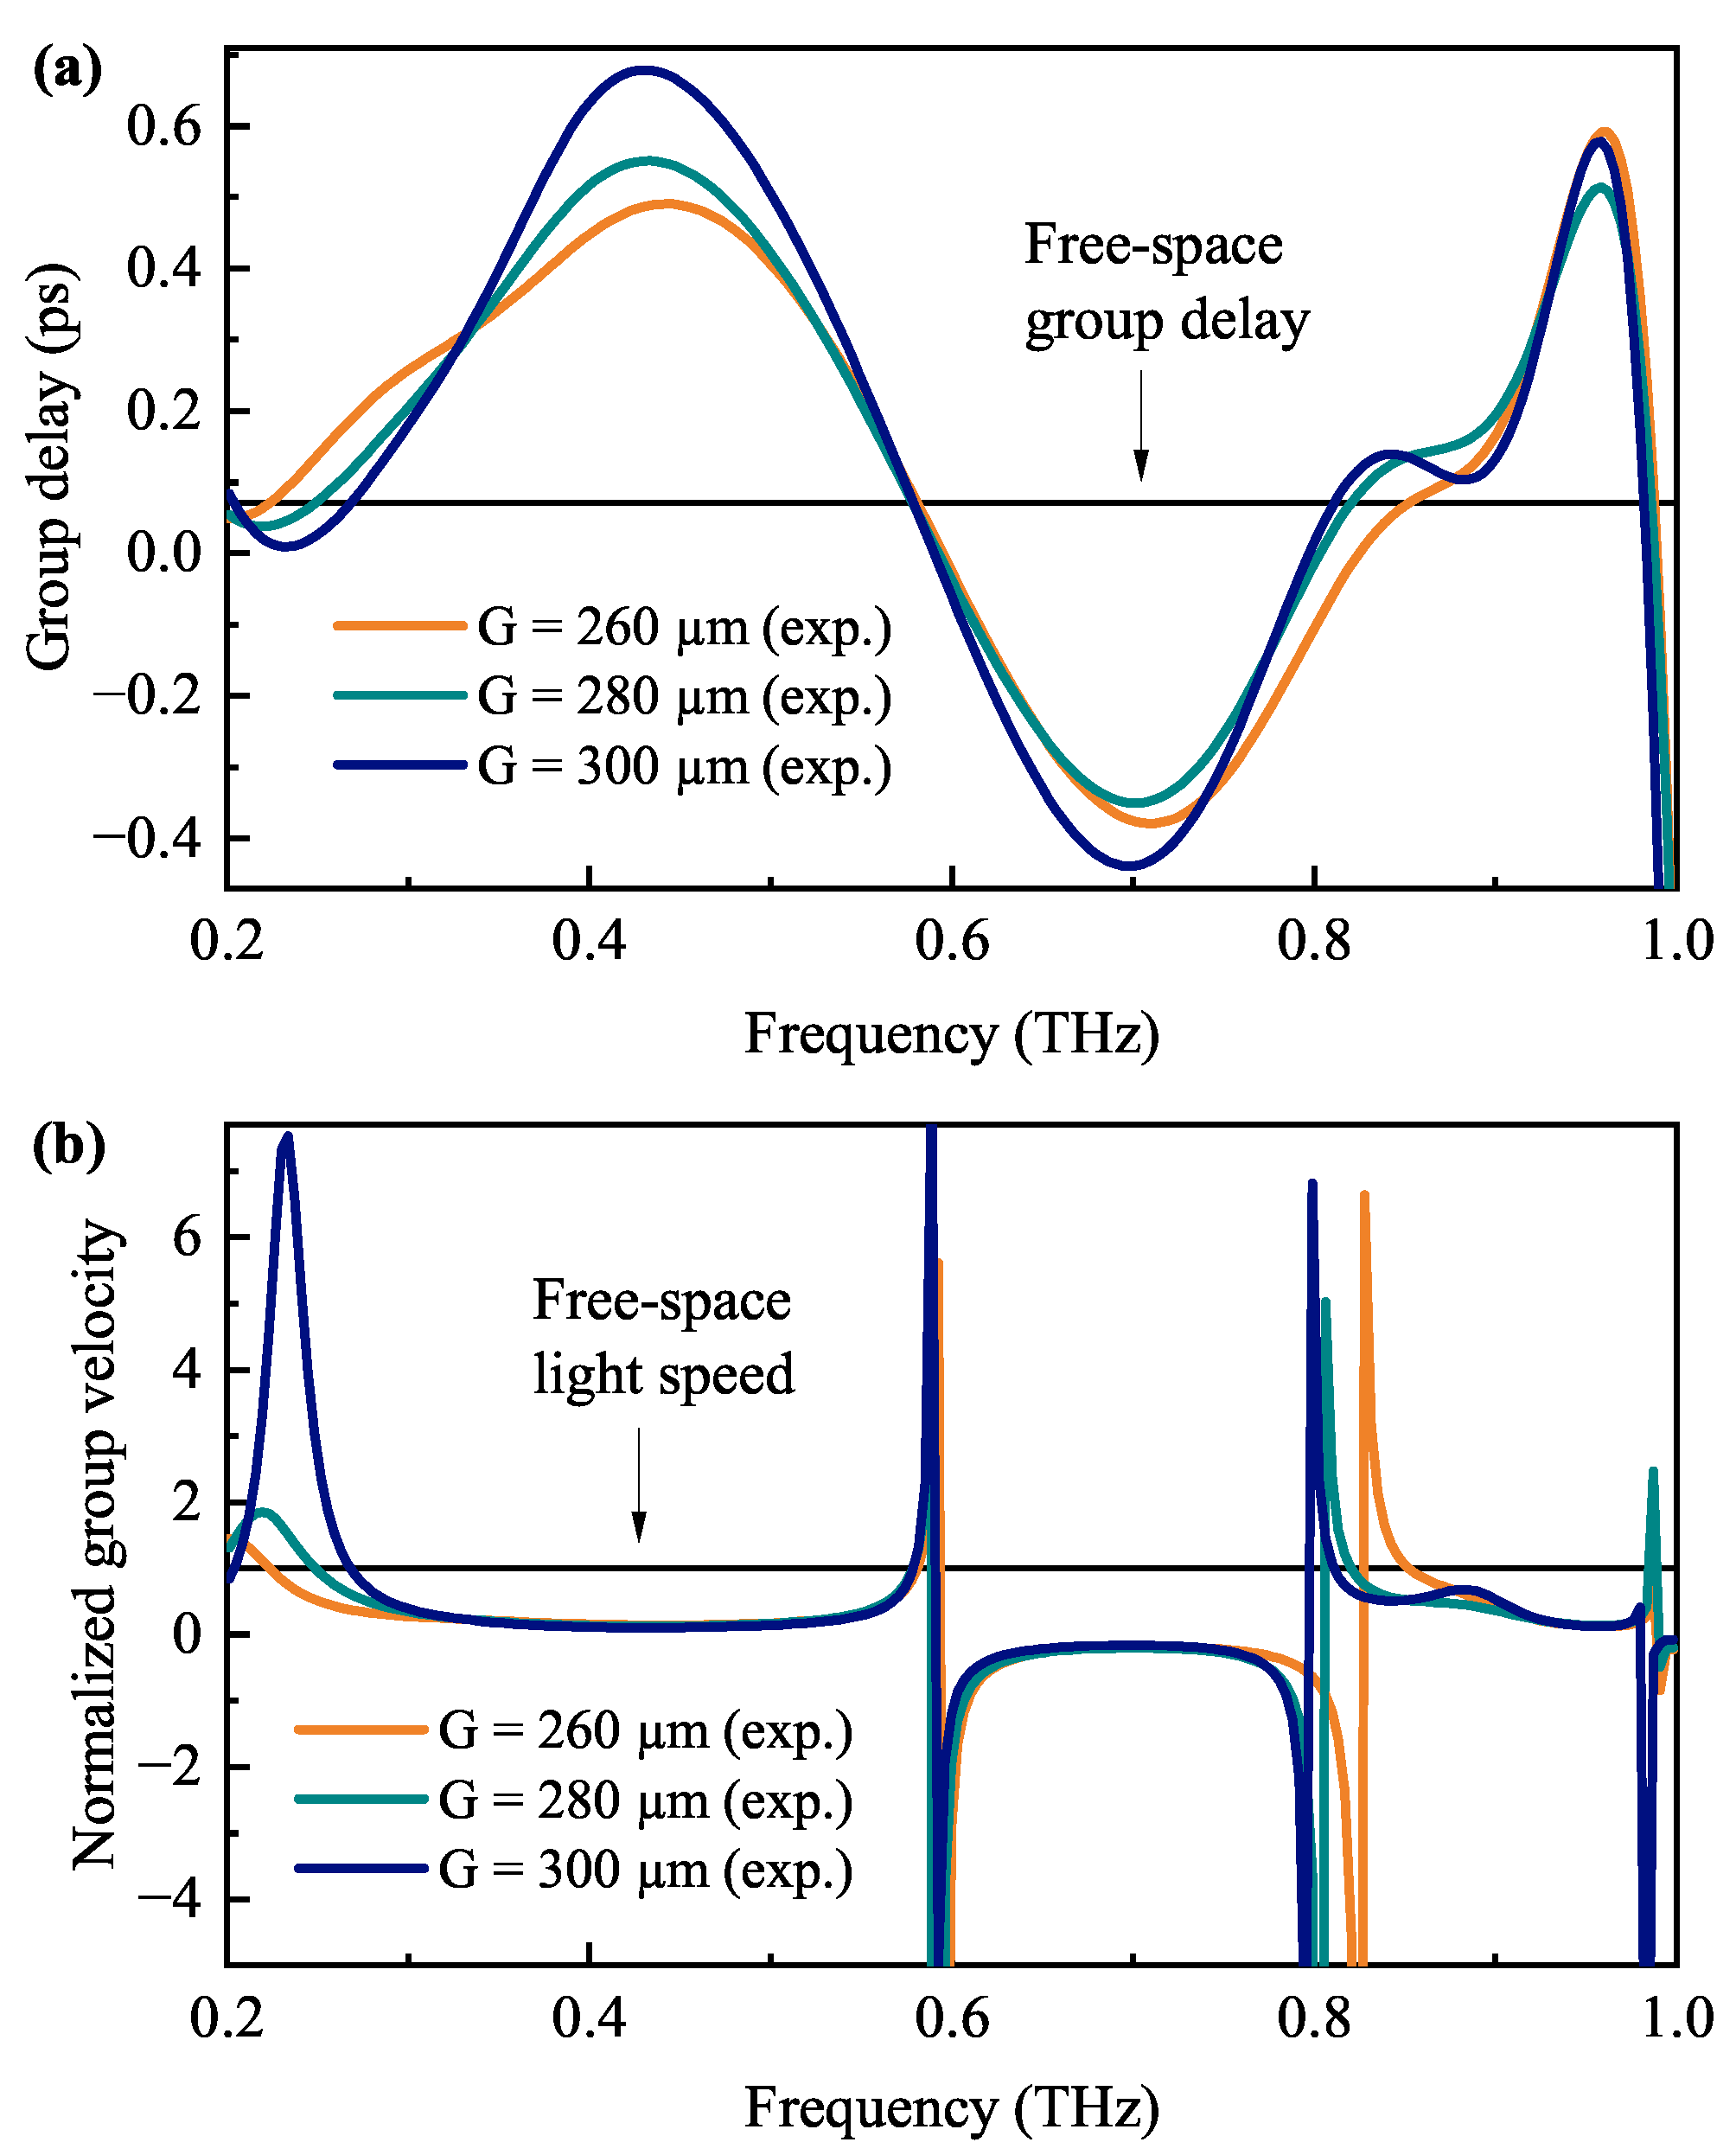
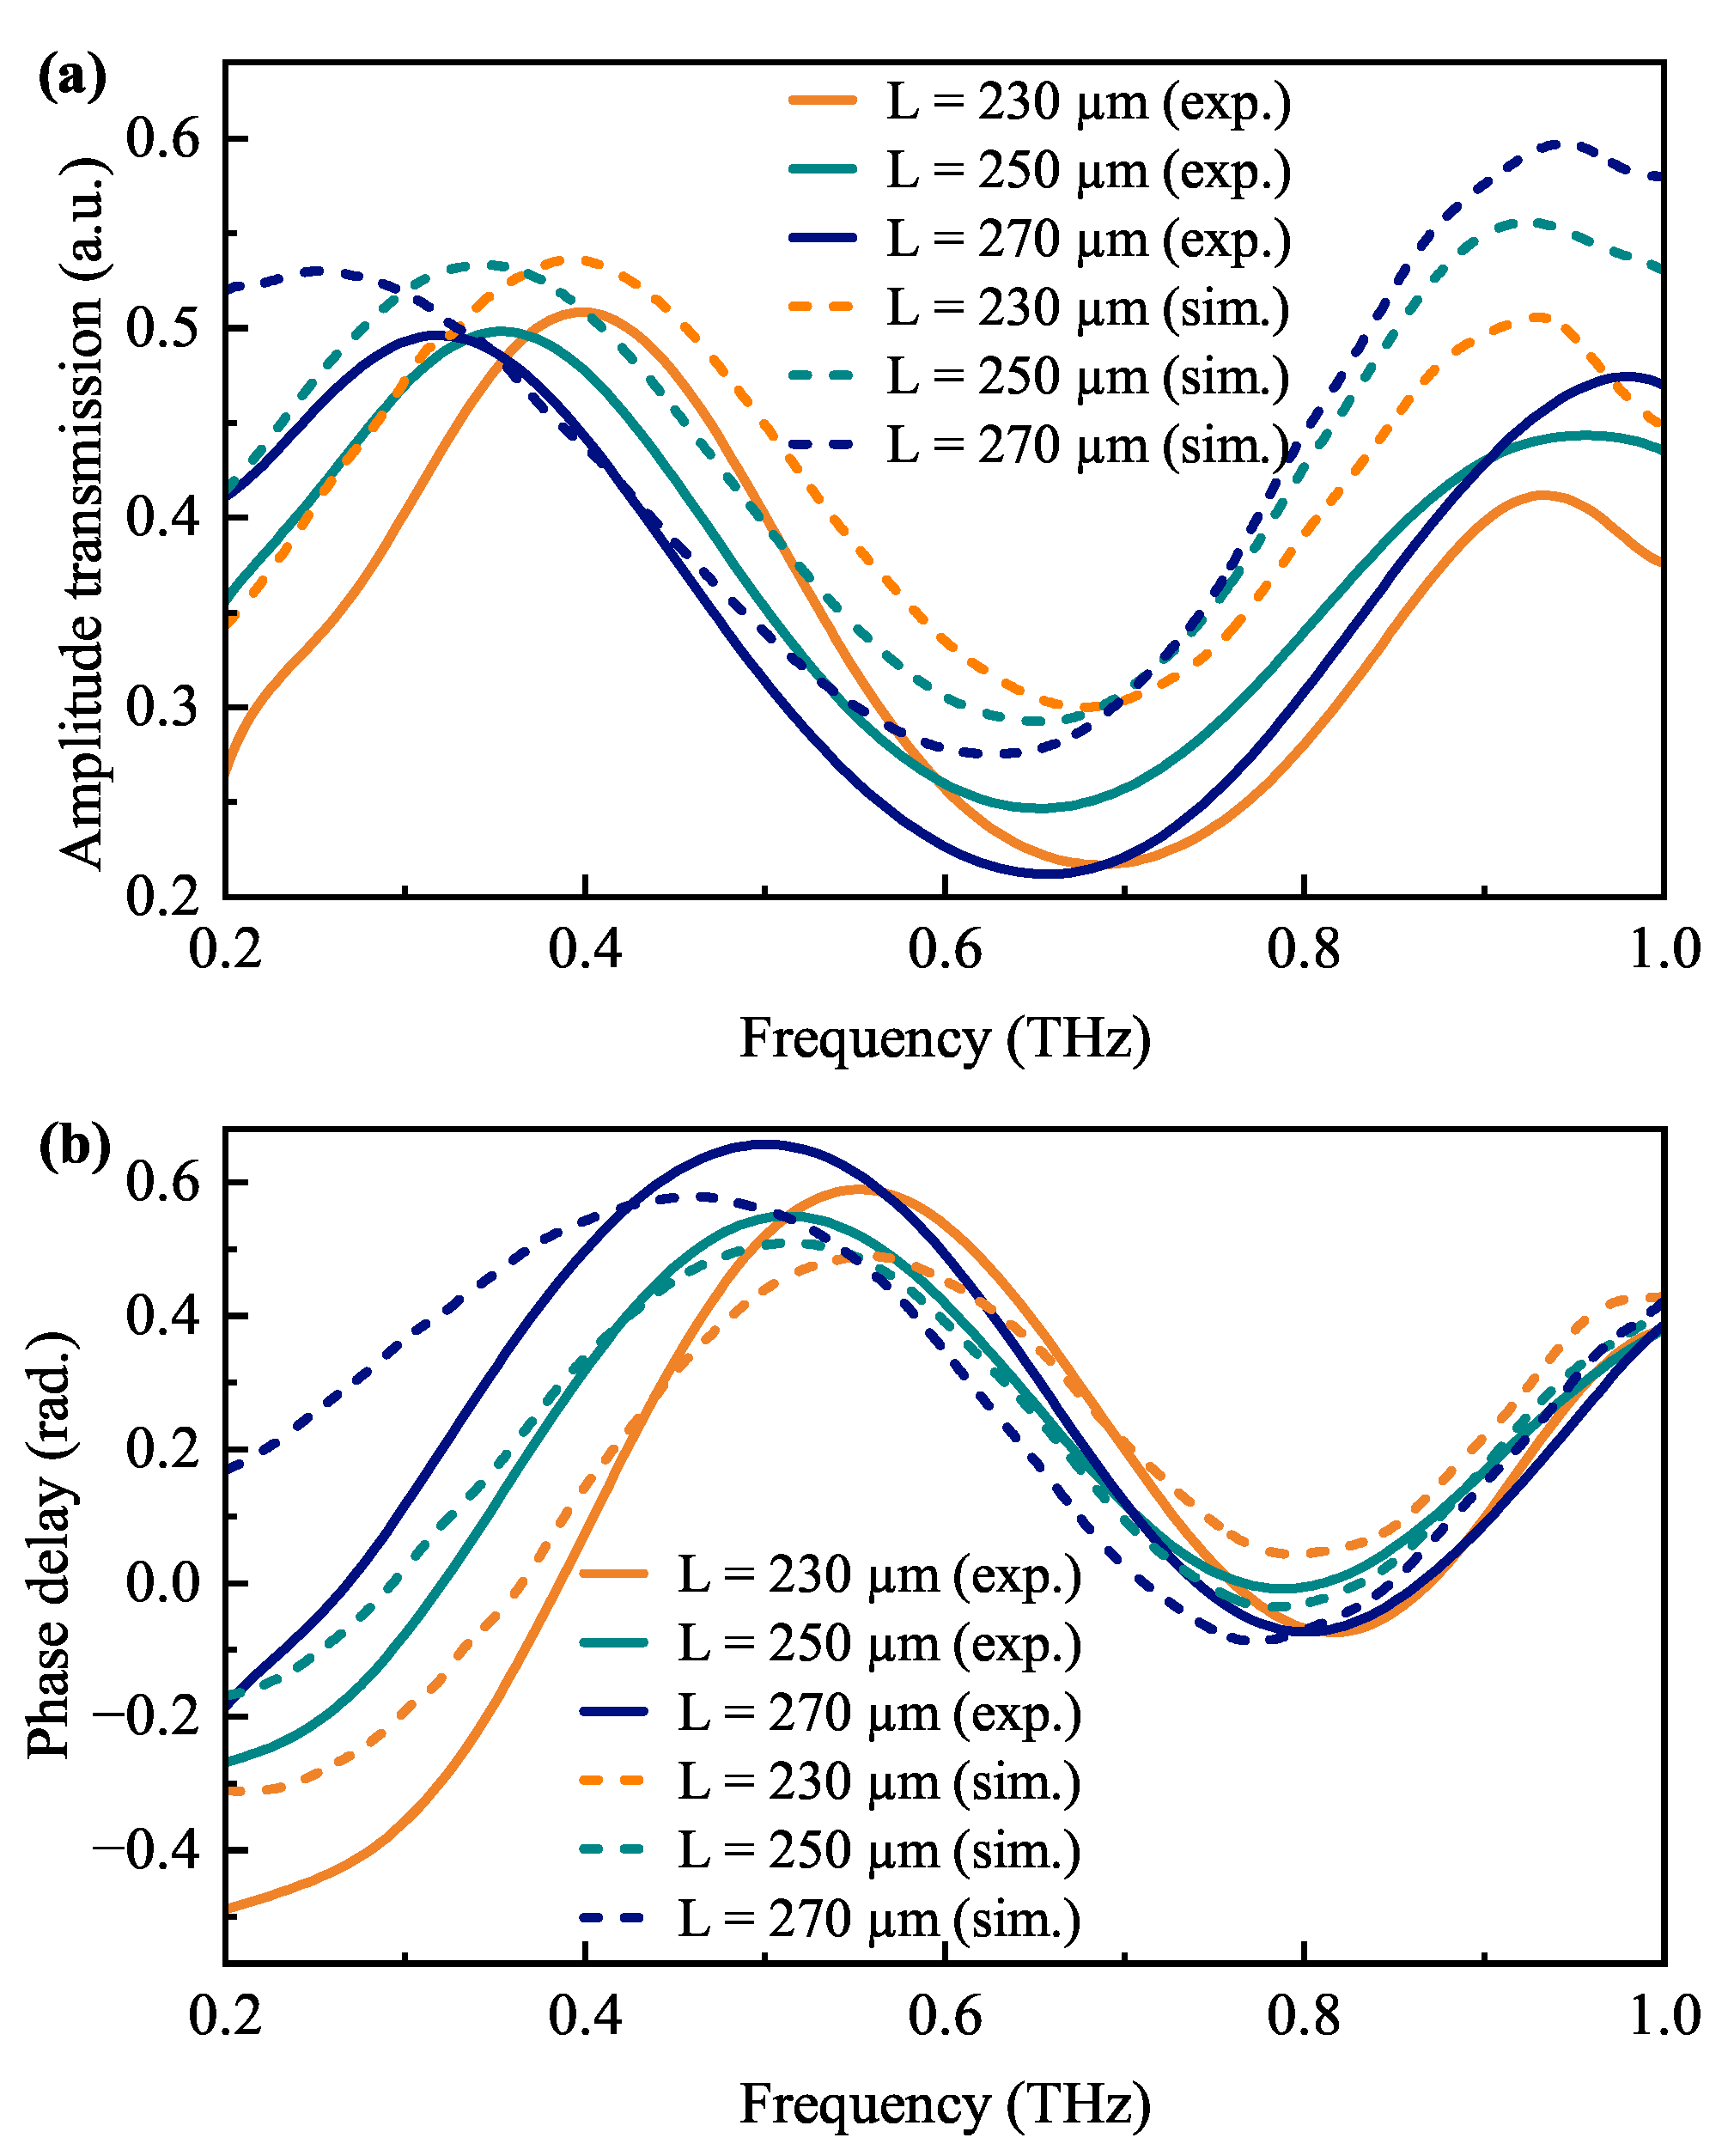
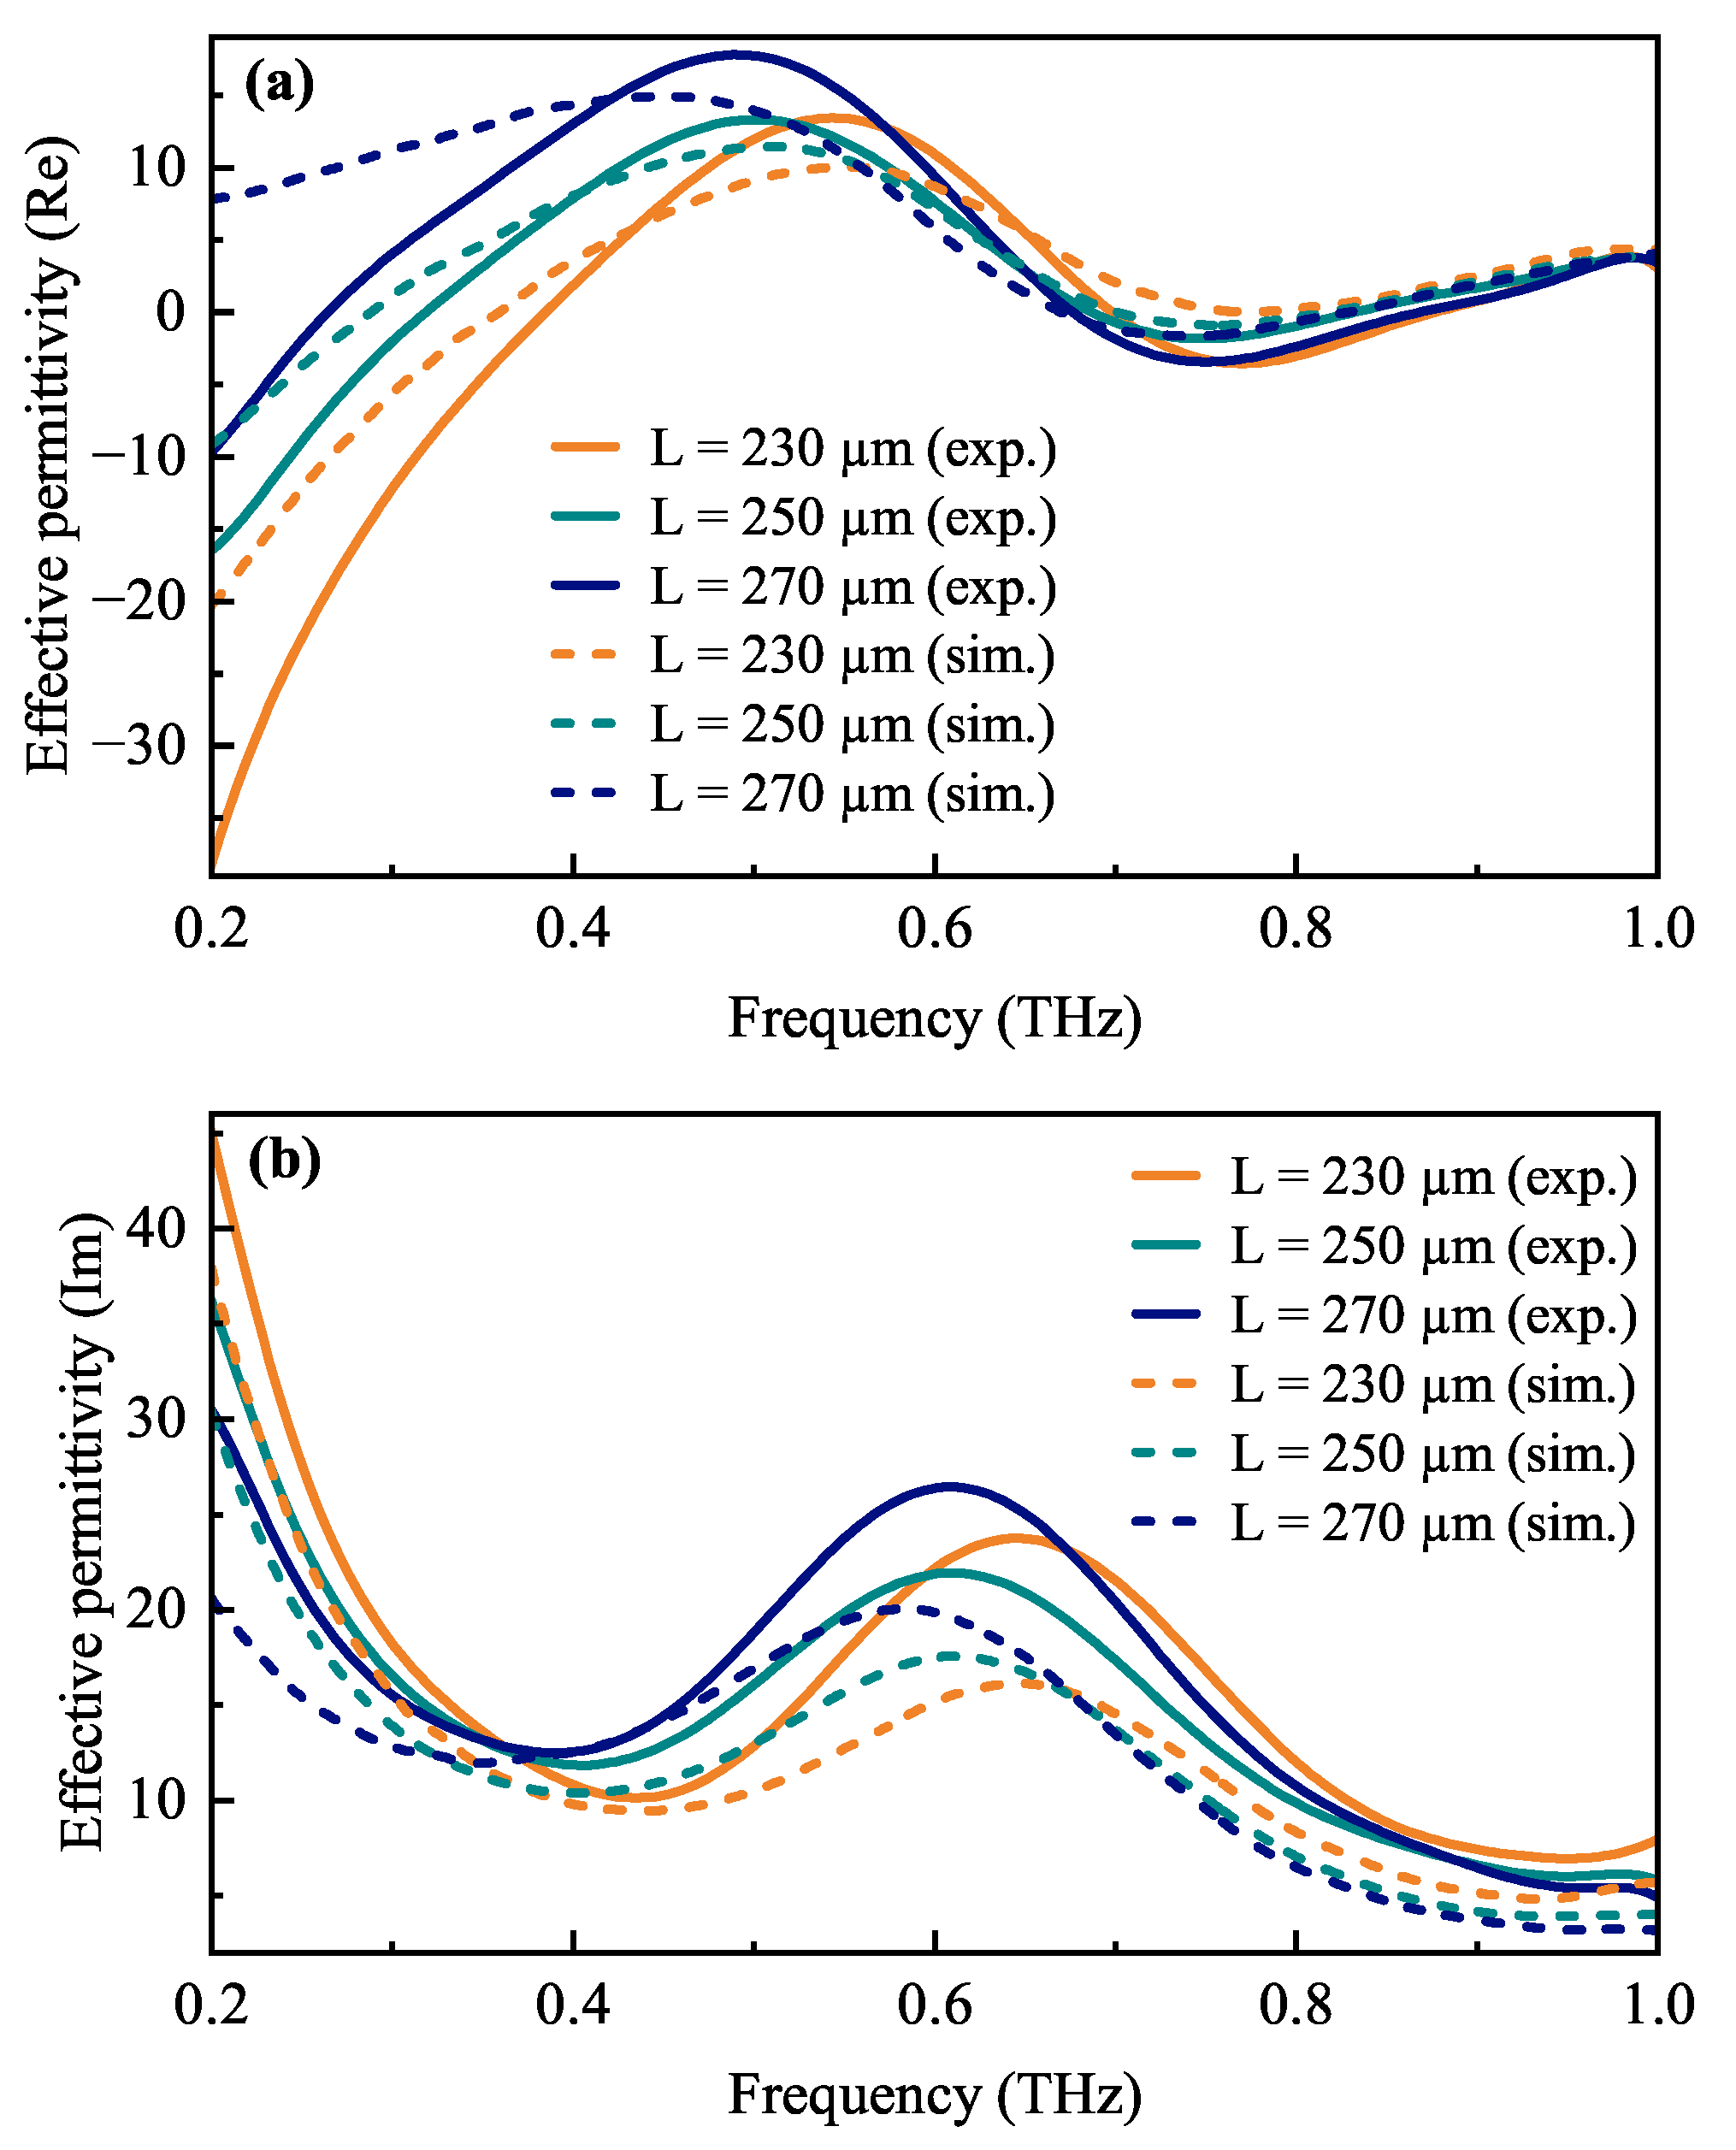
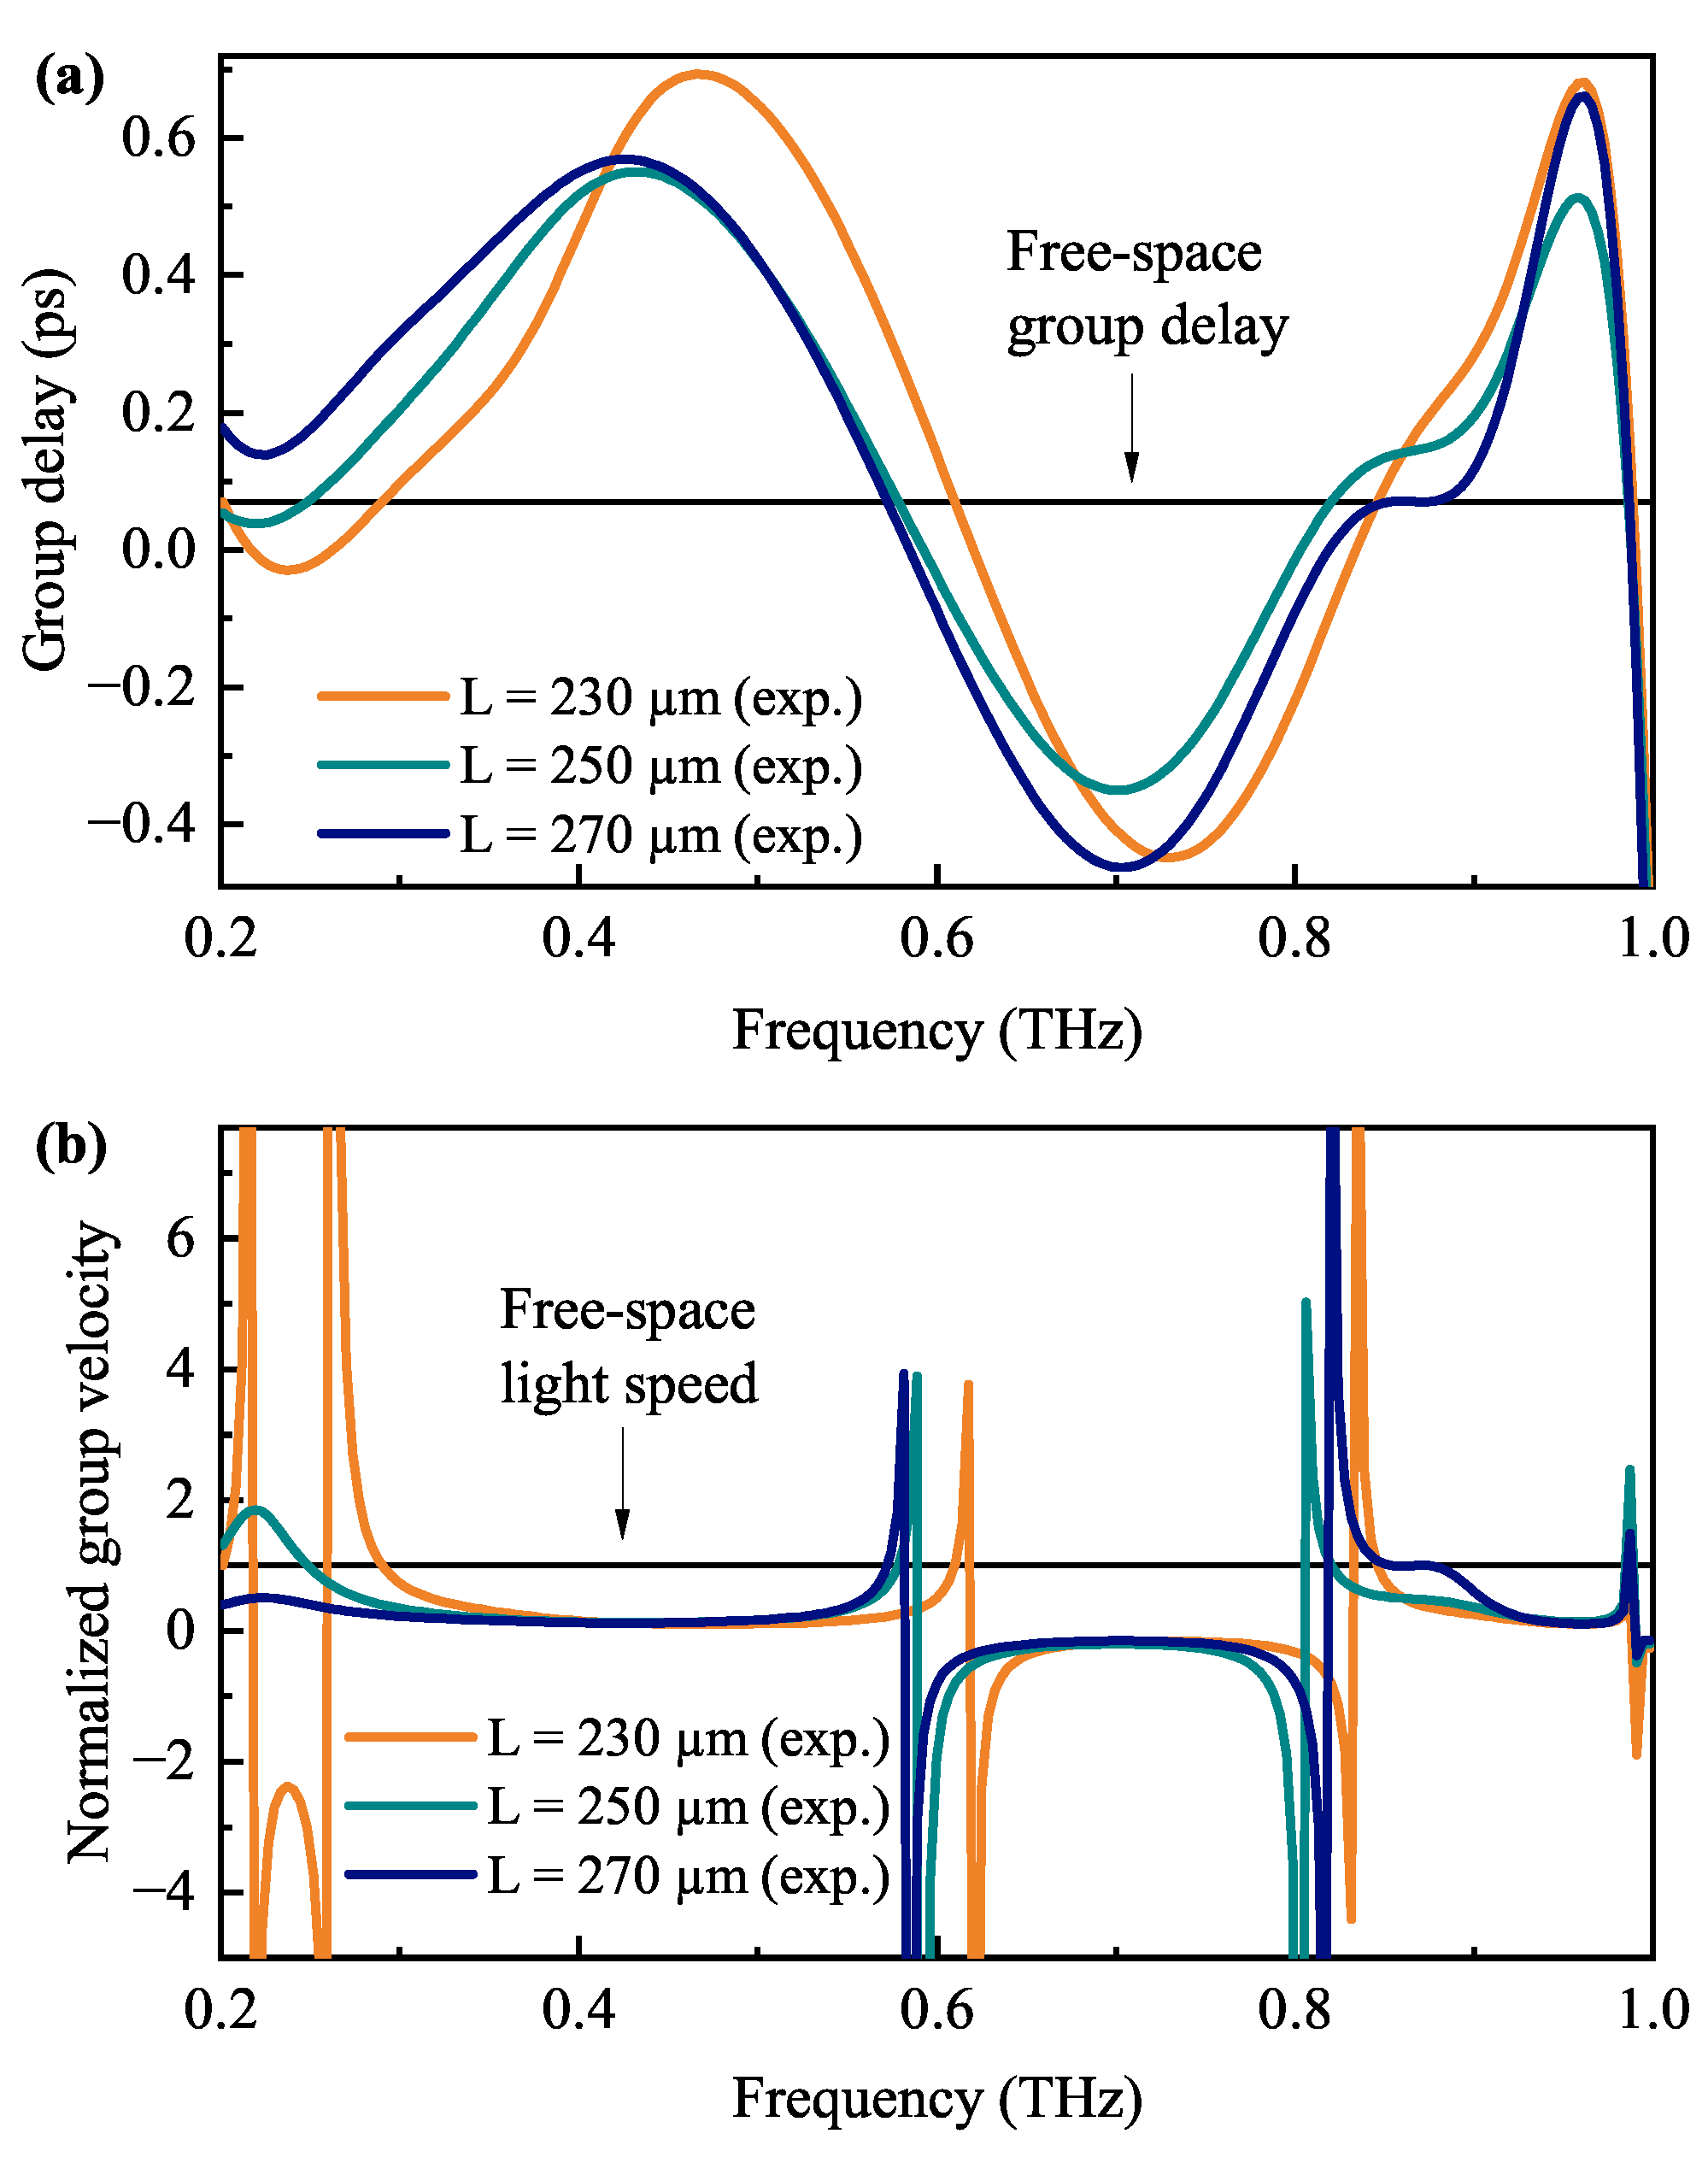
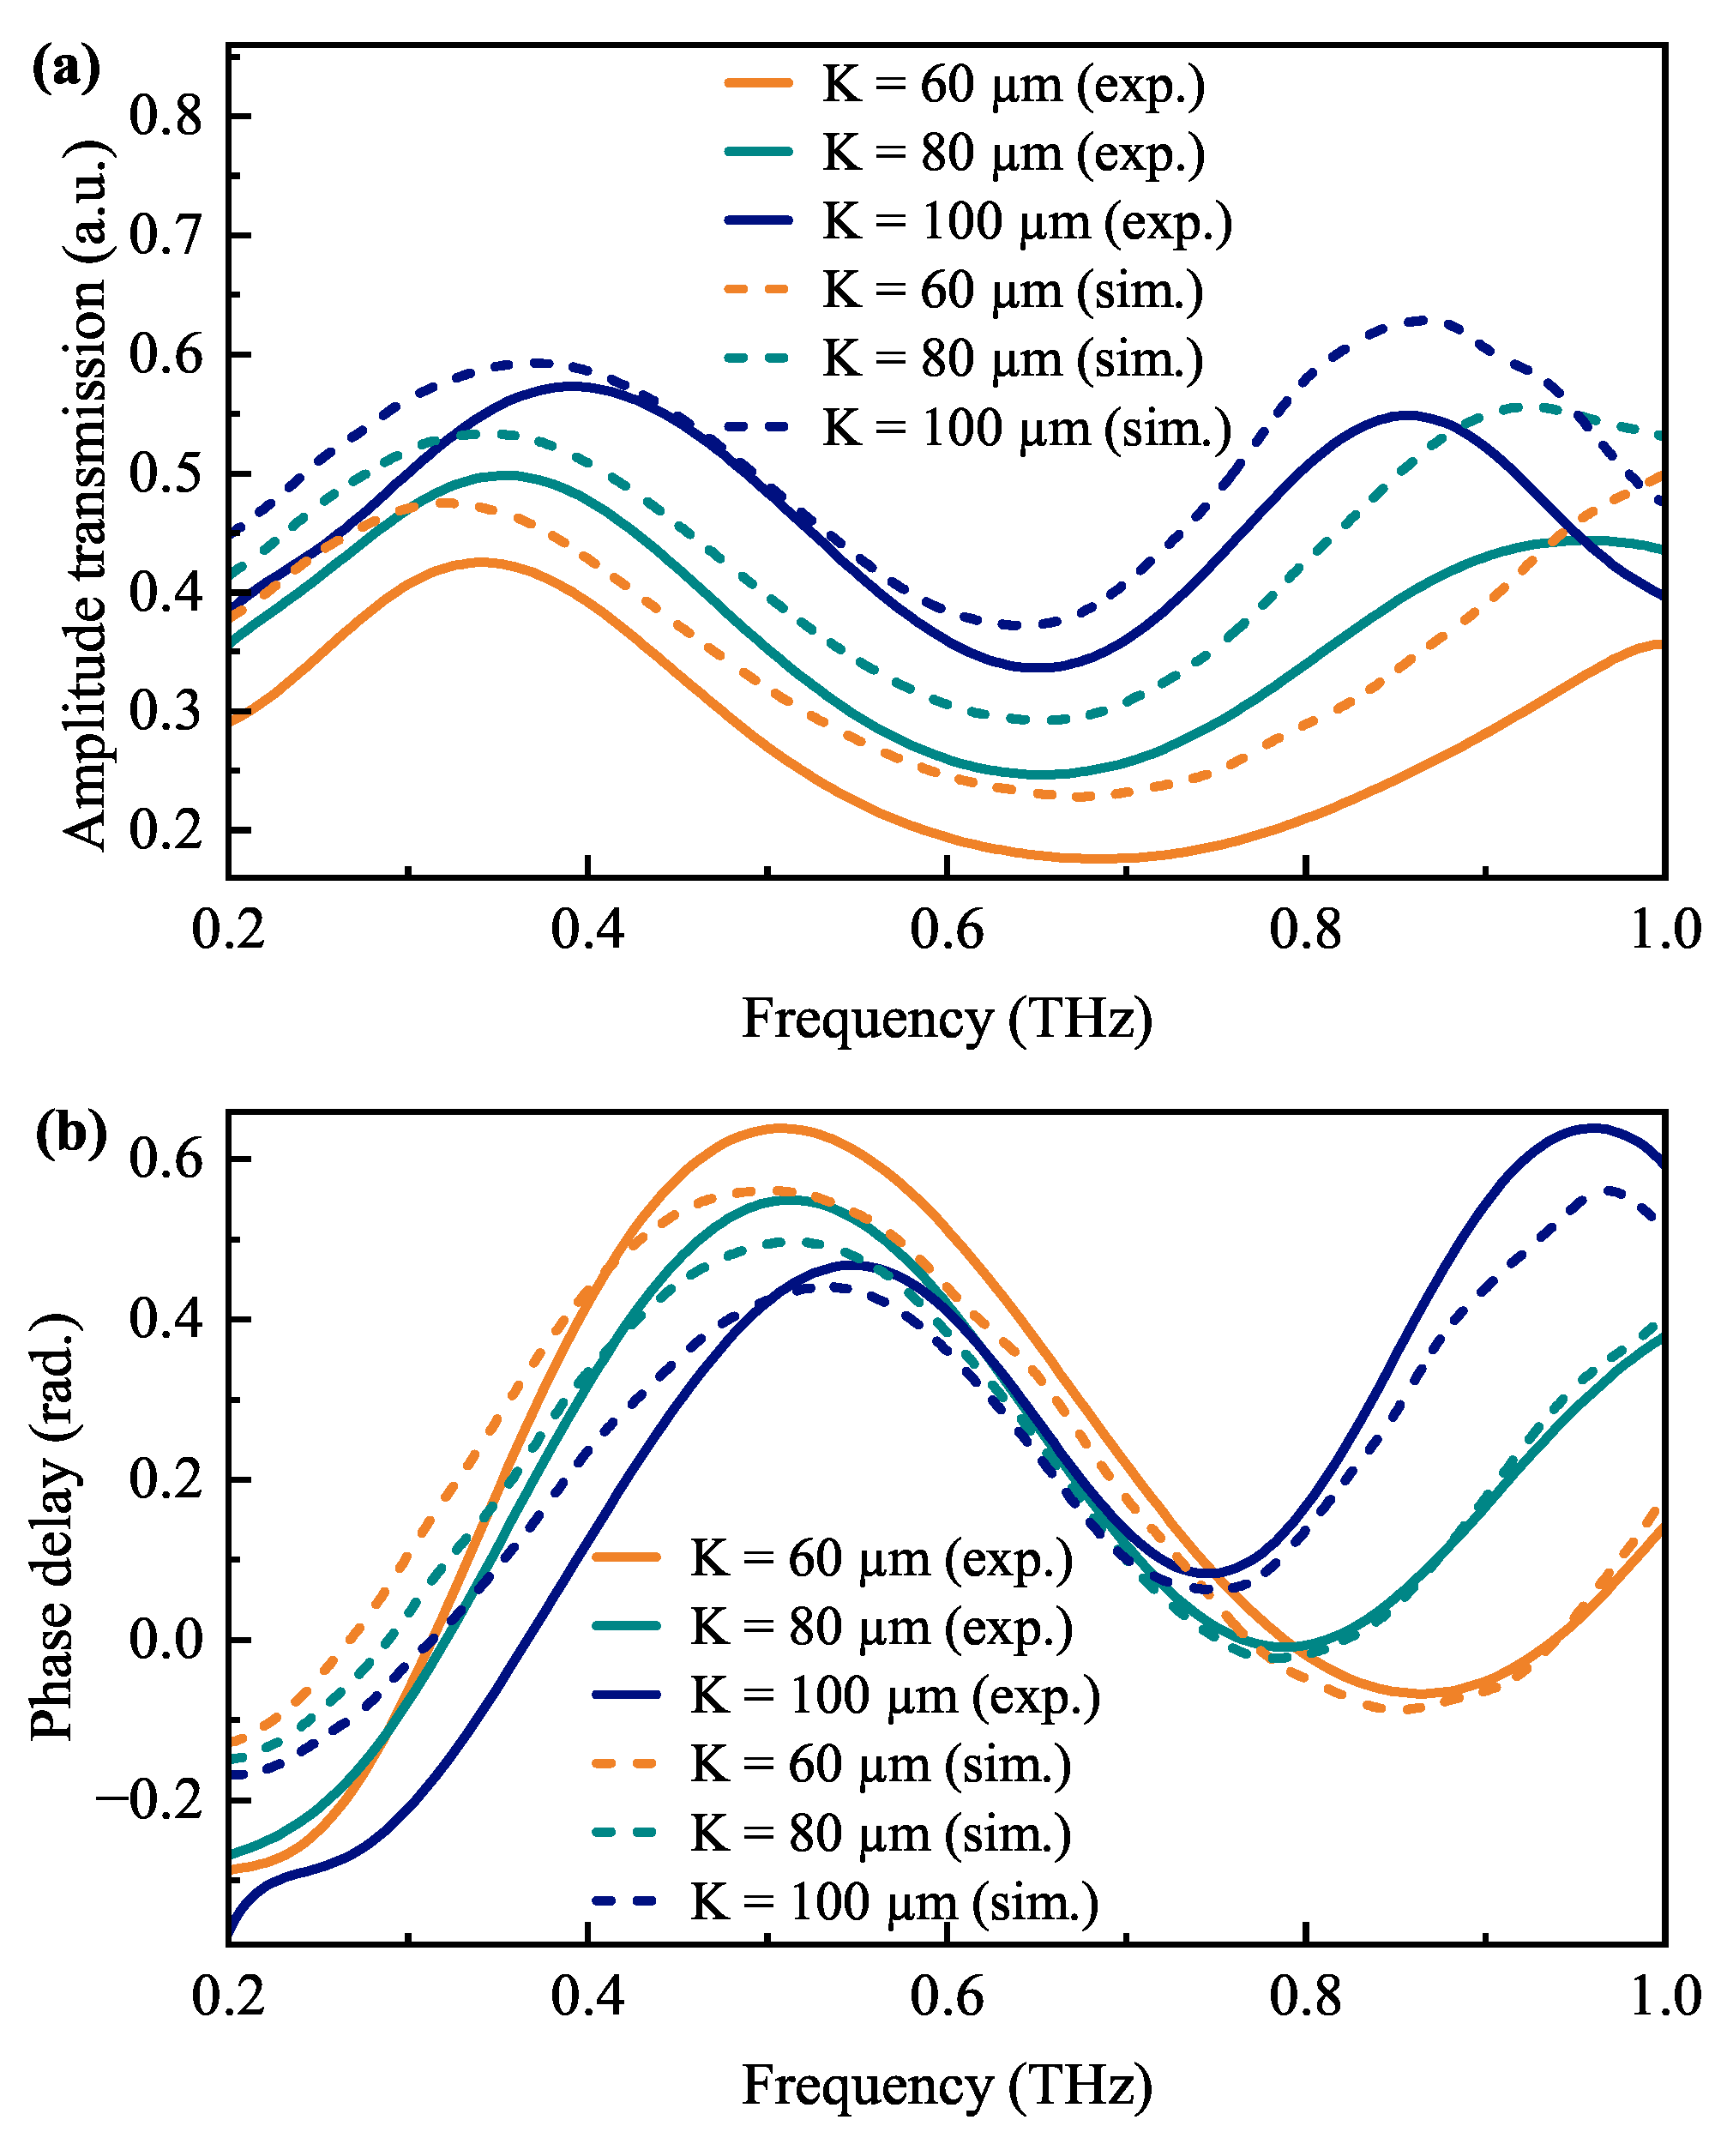
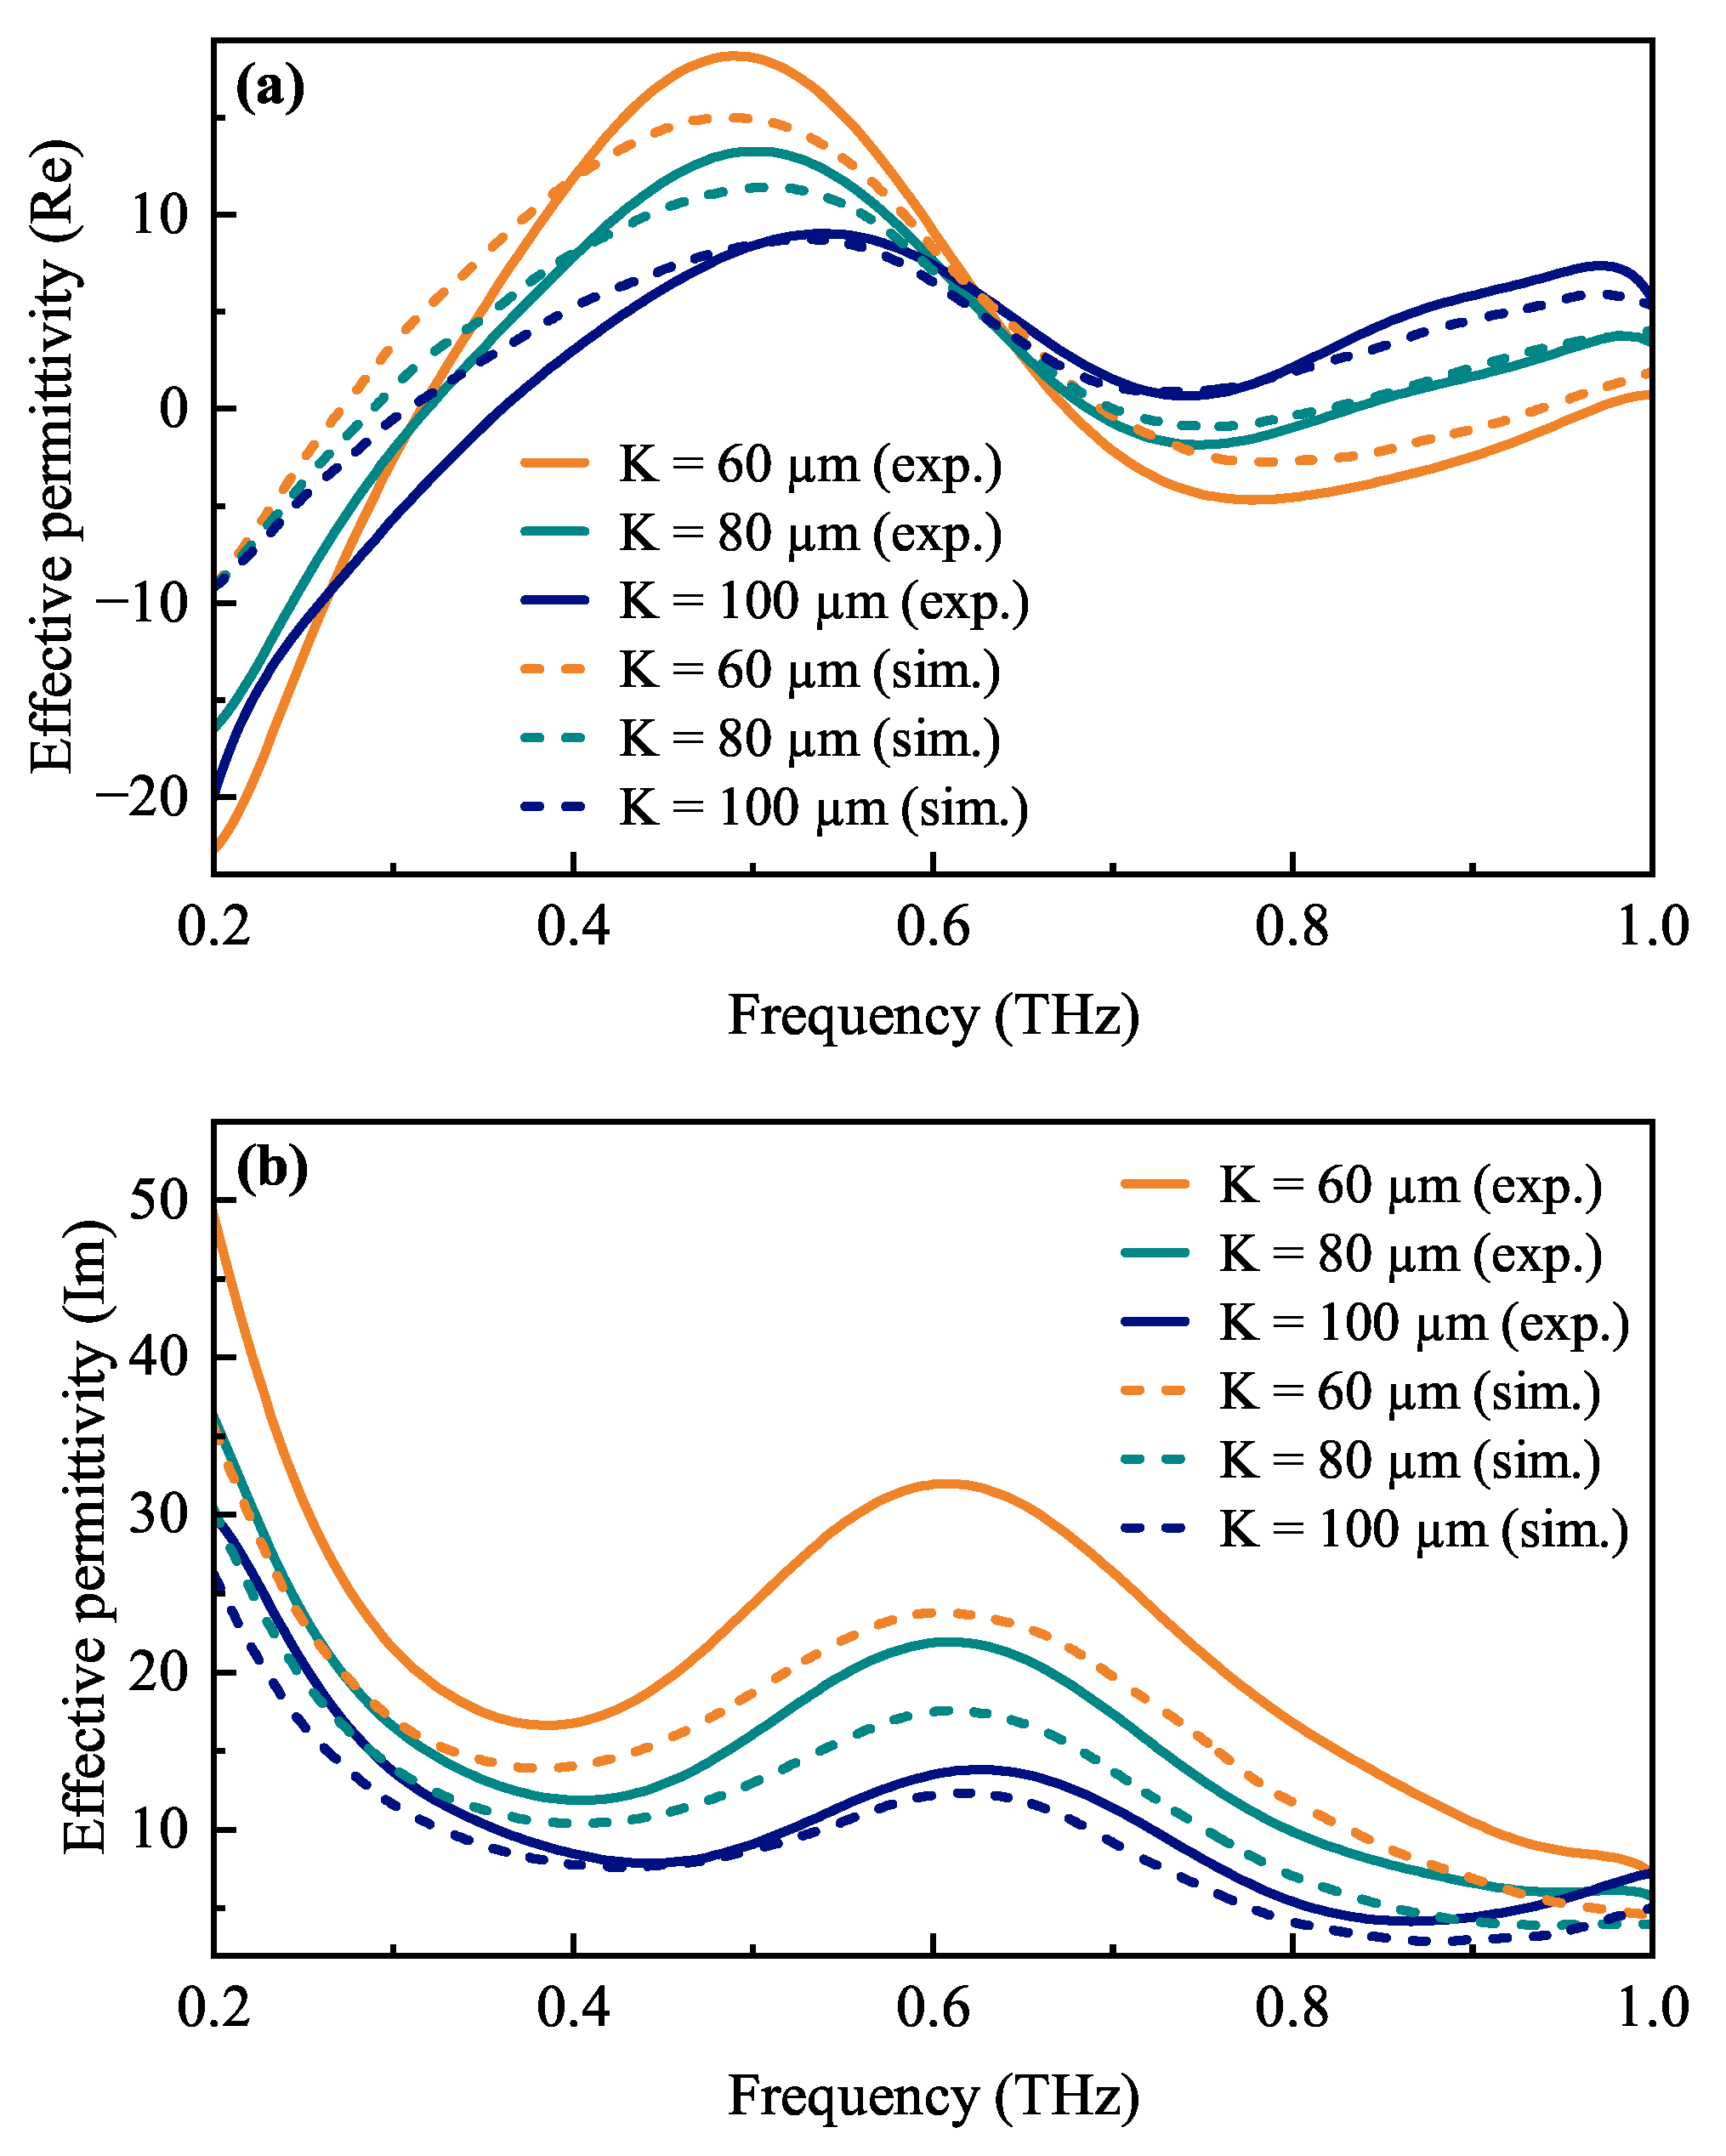
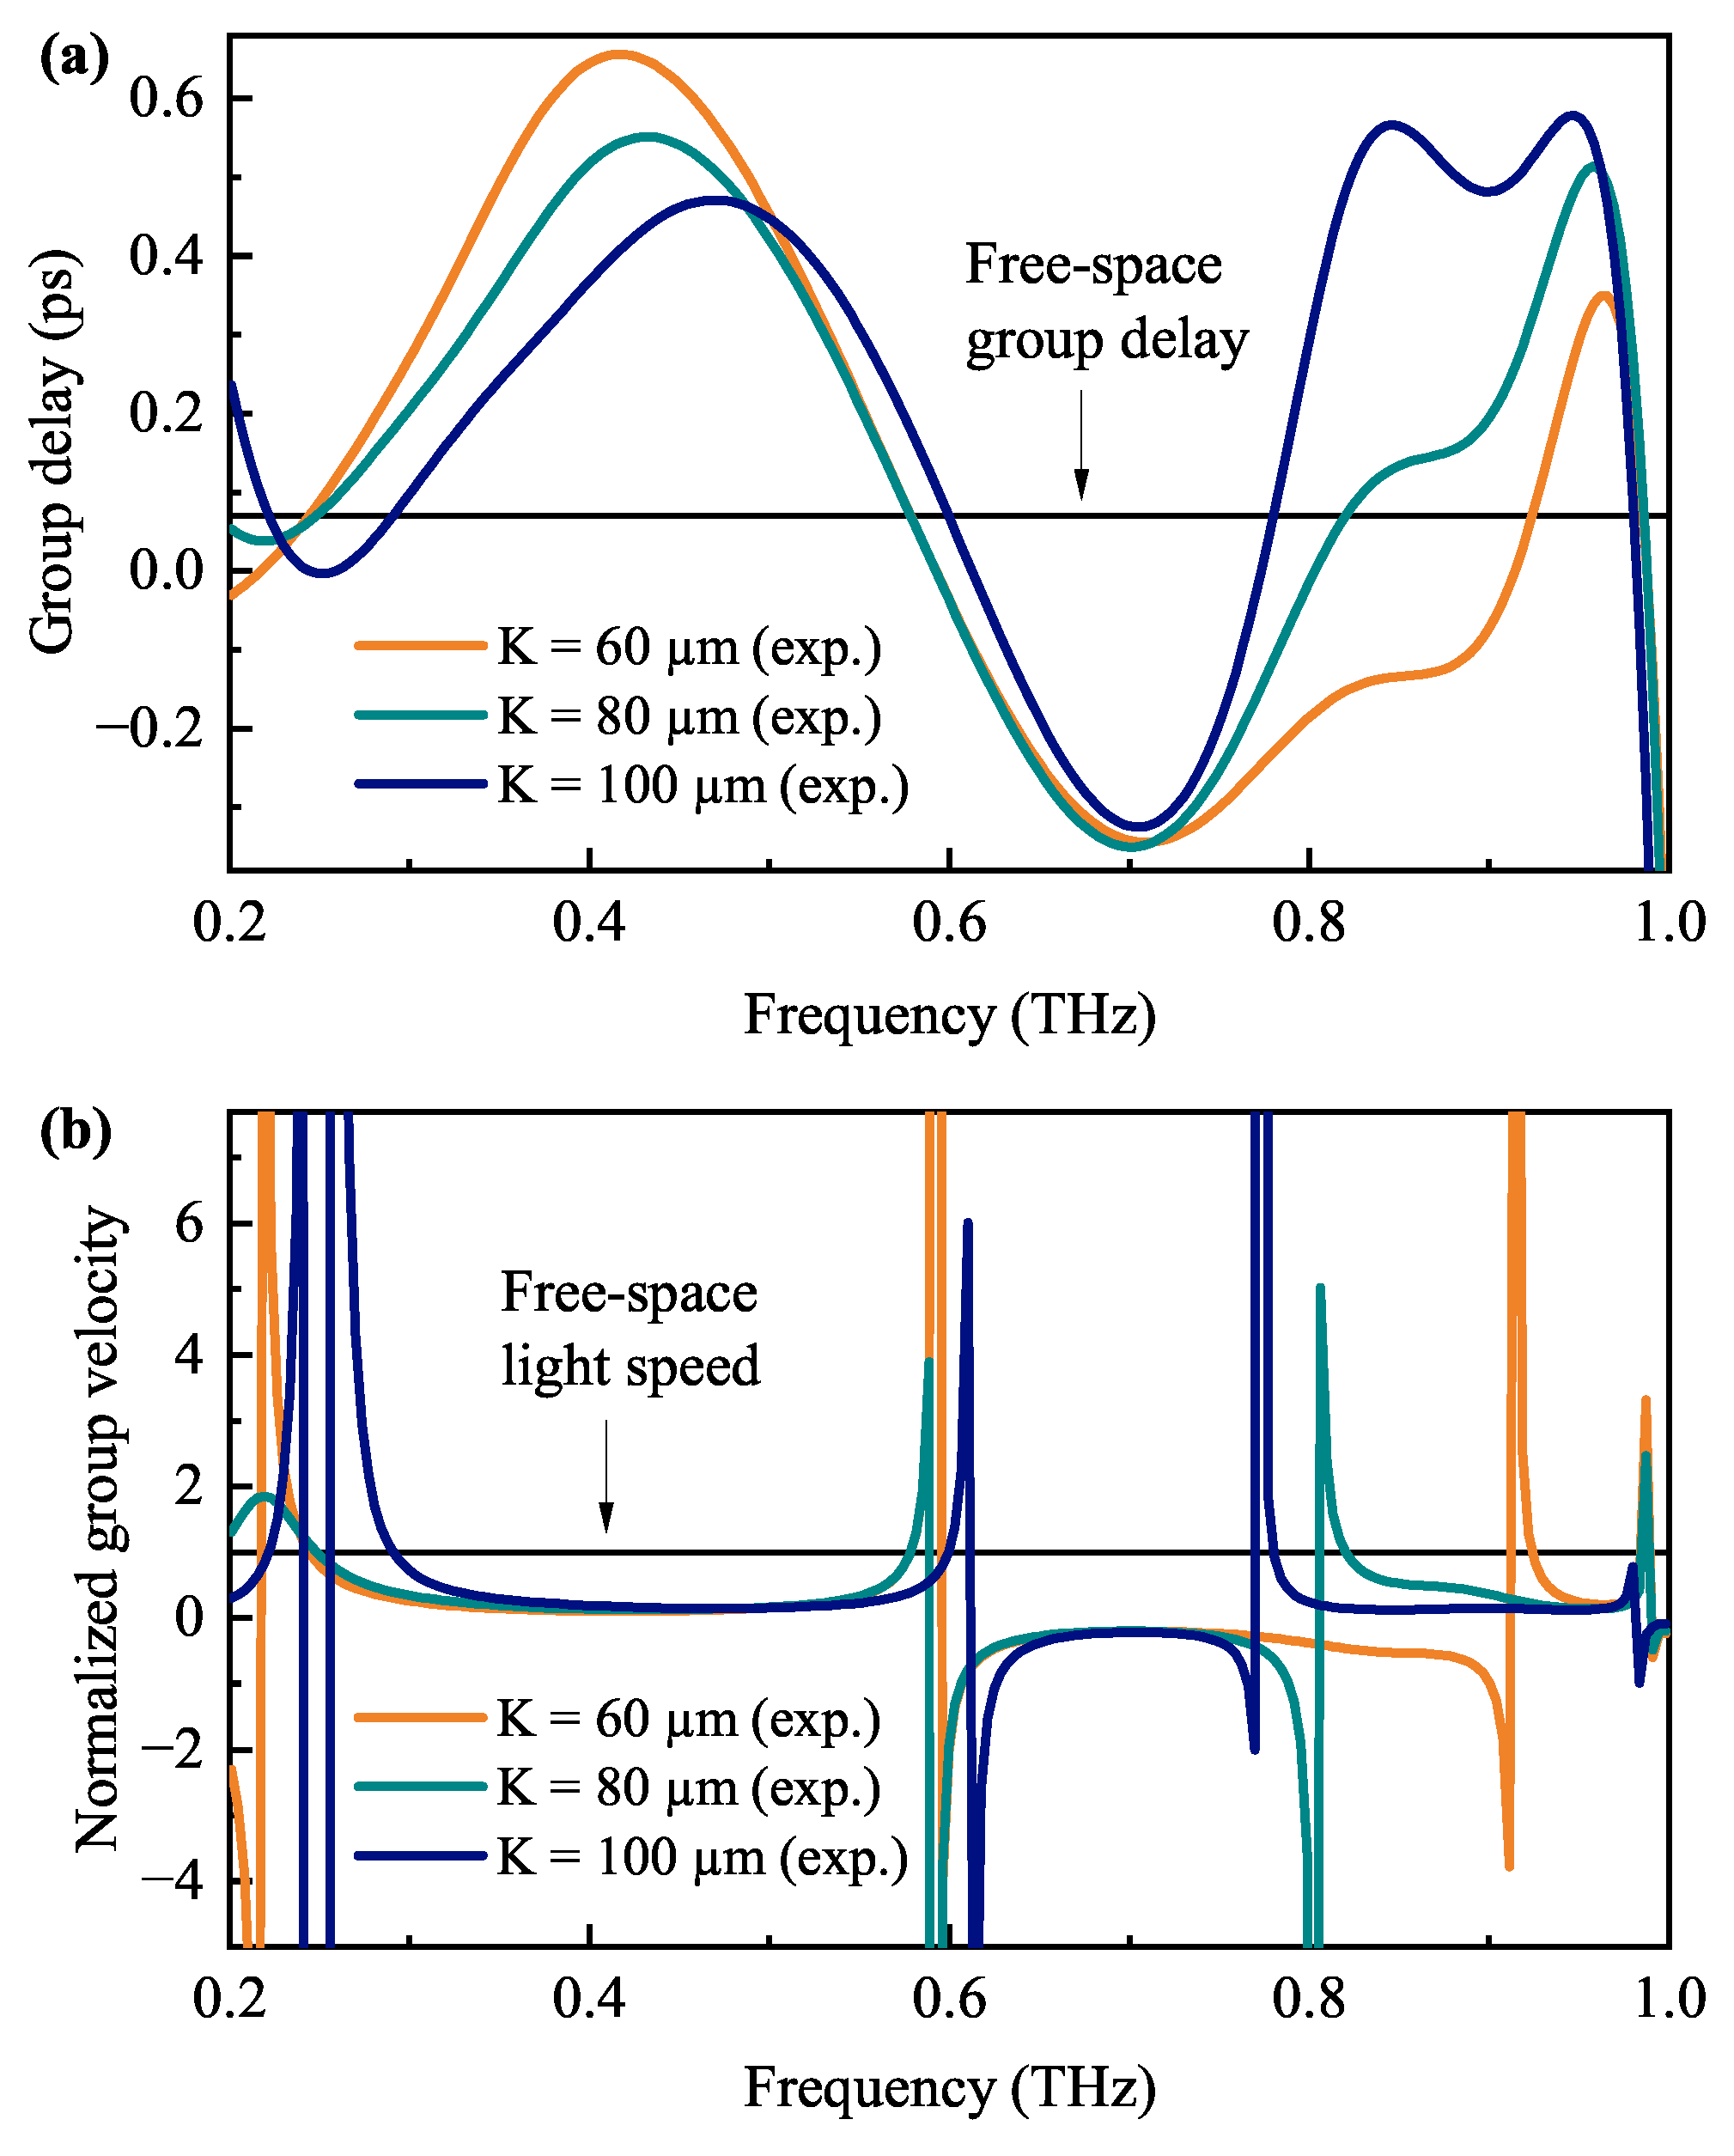
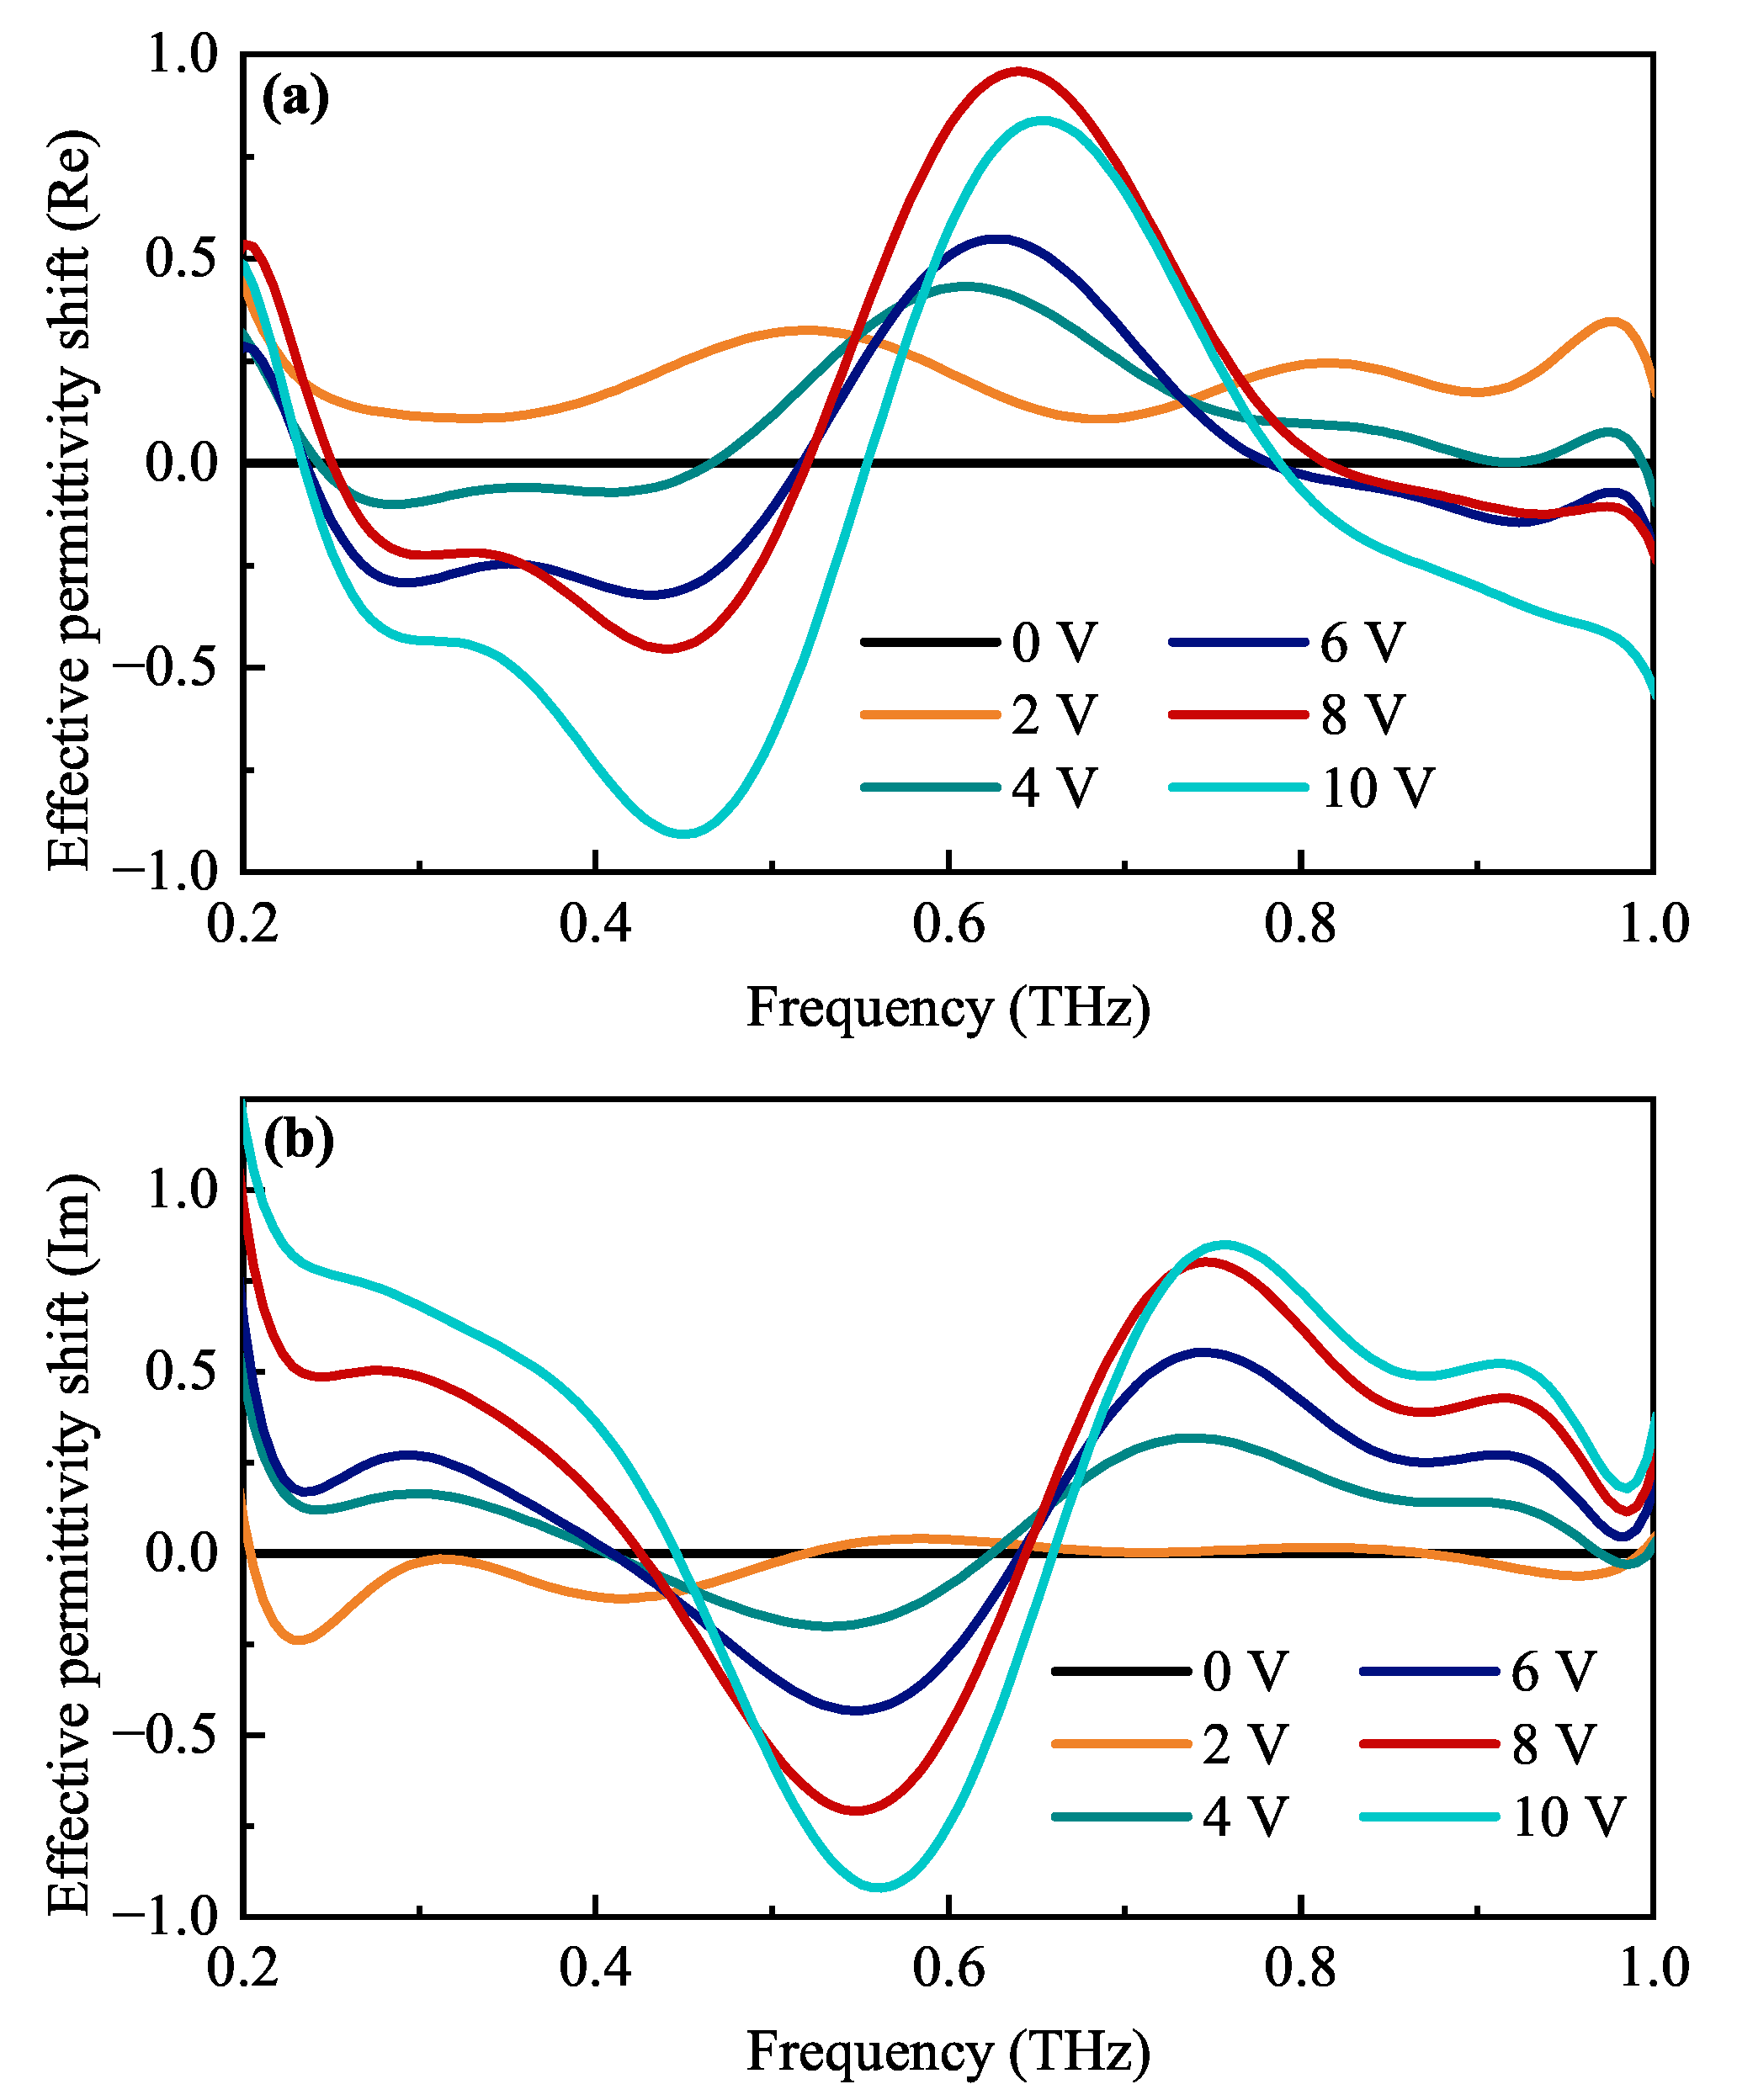
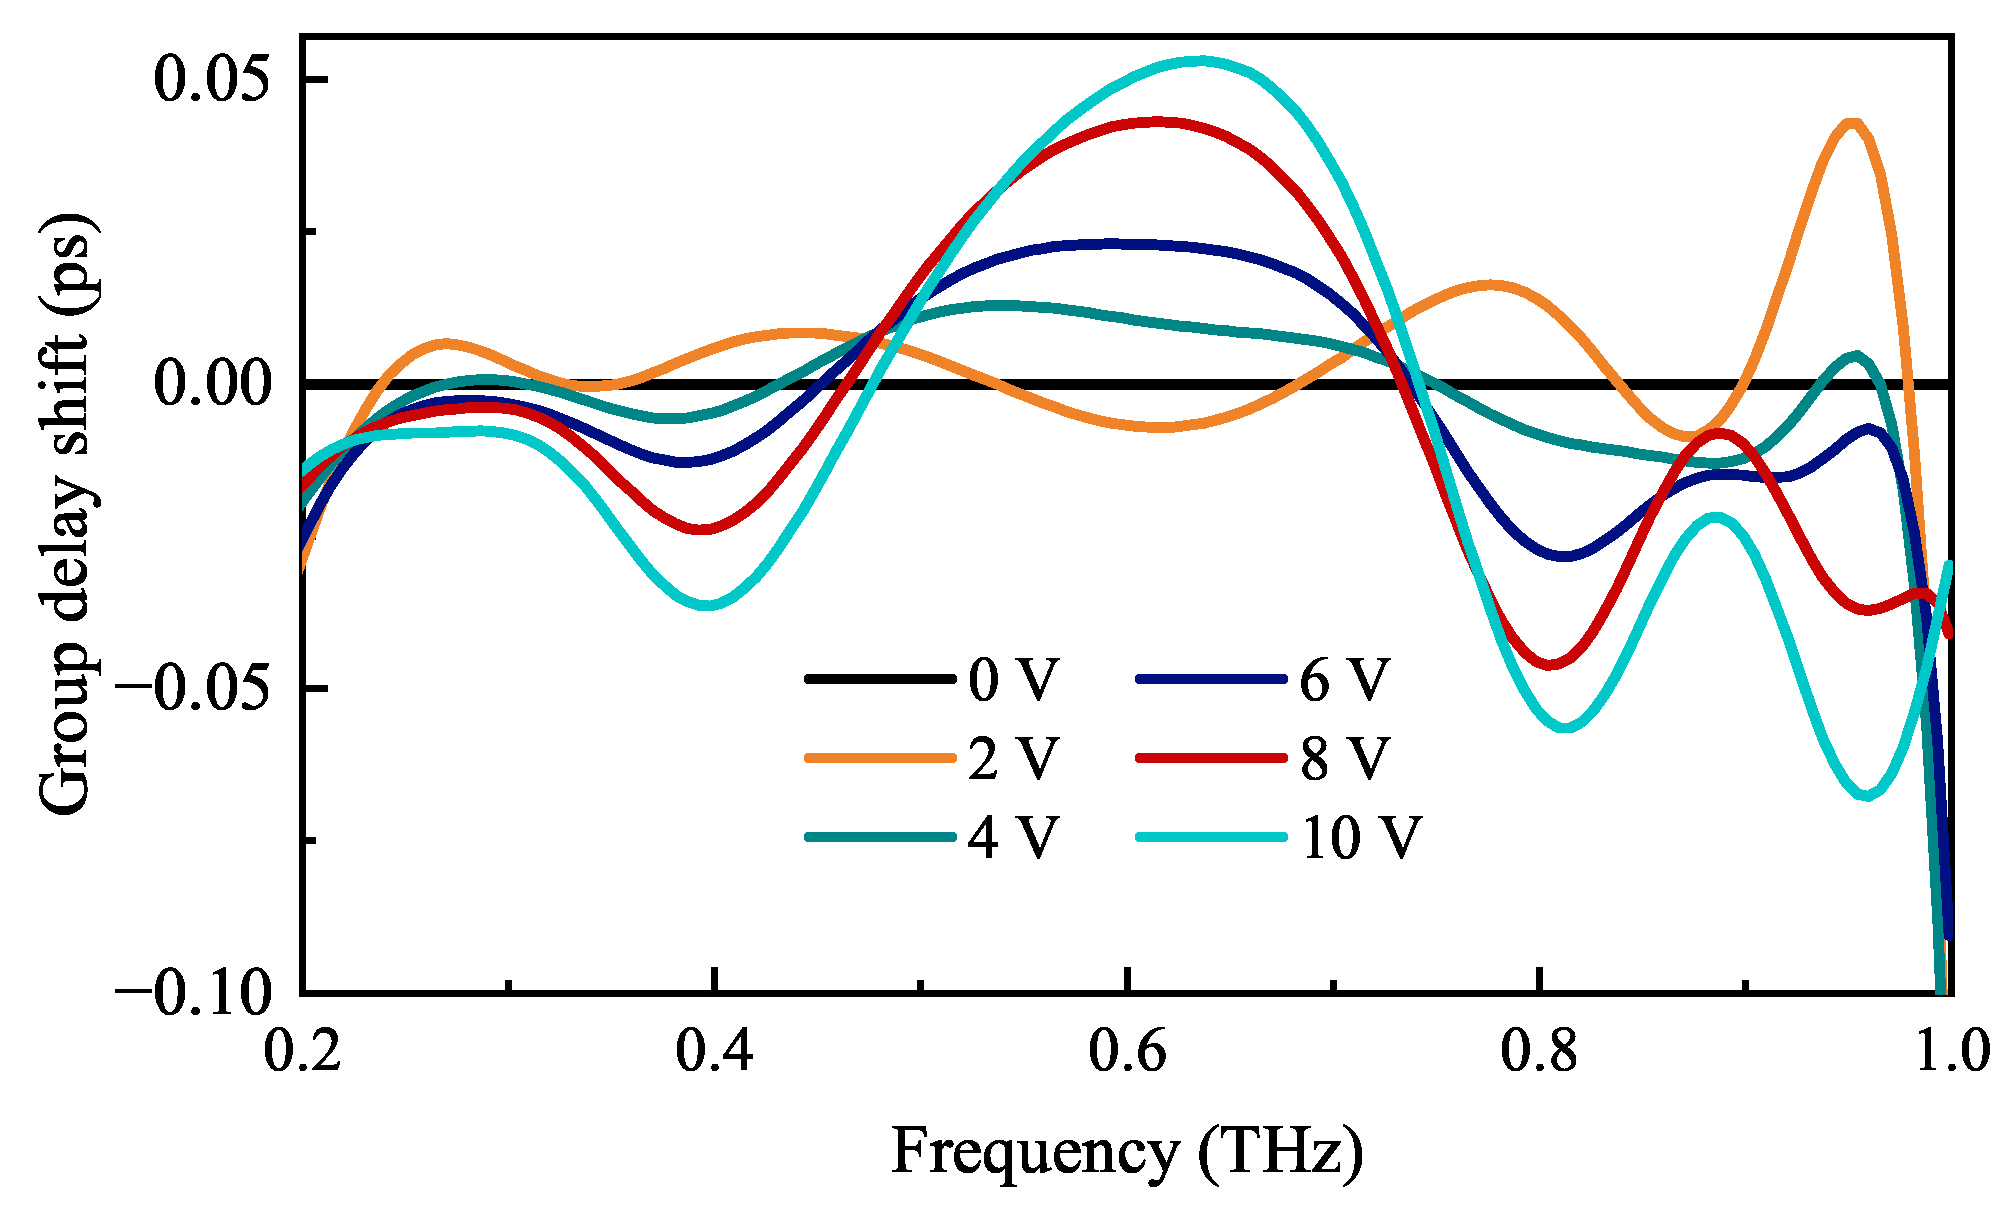
3. Results and Discussion

Optical properties of the mica substrate (with a thickness of 21 μm) and the Bi film (with an area of 15 × 15 mm and a thickness of 120 nm) on this substrate were measured using THz TDS in the 0.2–1.0 THz frequency range. Amplitude and phase spectra (Figure 2) were used to extract complex permittivity dispersions of 120 nm Bi film and mica (Figure 3). Figure 2 shows that that Bi-on-mica medium transmits a very small part of radiation in comparison with mica substrate in the entire frequency range under study. The phase delay is positive for mica (normal dispersion) and negative for Bi-on-mica medium (broadband anomalous dispersion) in the frequency range of 0.2–1.0 THz.
Complex permittivity dispersions of 120 nm Bi film and mica were used to calculate an effective permittivity dispersion ( ε ^ e f f ( f ) ) of the heterogeneous bismuth–mica structure by numerical simulation in CST Microwave Studio and using the transfer matrix method, obtaining the same results as those reported in [47]. In the case of normal (to the sample plane) incidence of THz radiation, the dispersion relation for this layered structure yields a similar solution for both TE and TM modes:
k 0 = 2 π f c ,
k ^ z , B i = k 0 ε ^ B i ,
k ^ z , m i c a = k 0 ε ^ m i c a ,
η ^ B i = 2 π f ε 0 ε ^ B i / k ^ z , B i ,
η ^ m i c a = 2 π f ε 0 ε ^ m i c a / k ^ z , m i c a ,
k ^ z = c o s ( k ^ z , B i d B i ) c o s ( k ^ z , m i c a d m i c a ) d B i + d m i c a 1 2 ( d B i + d m i c a ) η ^ B i η ^ m i c a + η ^ m i c a η ^ B i · · s i n ( k ^ z , B i d B i ) s i n ( k ^ z , m i c a d m i c a ) ,
ε ^ e f f = k ^ z 2 / k 0 2 ,
where d m i c a is the thickness of the mica substrate, ε ^ m i c a is its permittivity calculated according to Equations (2)–(6), k 0 is a free-space wave number, and k ^ z is a Bloch wave number with real and imaginary parts responsible for propagating and evanescent waves, respectively.
The effective permittivity dispersion ( ε ^ e f f ( f ) ) was also calculated on the basis of complex amplitude spectra measured for the effective bismuth–mica medium using THz TDS. The results are depicted in Figure 4. There is almost exact coincidence between simulated and experimental dispersions.
In order to impart a frequency-dependent response, periodical cross-like apertures were made in the bismuth film in accordance with one of the standard configurations of frequency-selective surfaces with a polarization-independent electromagnetic response [49]. The scheme of this FSS is depicted in Figure 5a. At fixed film and substrate thicknesses, its electromagnetic response is defined by three geometrical parameters, namely unit cell side length (G) and the length (L) and width (K) of a cross-like slot.
Numerical simulation of the bismuth-based FSS was performed at G = 280 μm, L = 250 μ m, and K = 80 μ m to obtain at least two resonances within the frequency range under study. Effective amplitude transmission (Figure 6a) and phase delay (Figure 6b) spectra were extracted to calculate the FSS effective permittivity (Figure 7a,b). The experimental samples (see Figure 5b) were structured using the laser engraving technique with a spot diameter of 30 µm, which was taken into account in both numerical and experimental studies. The experimental curves are presented in these figures, along with simulated curves.
There are two frequency bands with negative phase shift and two bands with positive phase shift associated with corresponding values of an effective permittivity and positive/negative group delay. At G = 280 μ m, L = 250 μ m, and K = 80 μ m, there are three frequency points (at 0.32, 0.68, and 0.83 THz) corresponding to zero effective permittivity.
Excepting the case of continuous Bi film on a mica substrate presented in Figure 4, the experimental and modeling results slightly differ from each other. Laser radiation possibly affects bismuth film permittivity on borders of cross-like slots. The effect may be associated with solid-state regrowth during laser annealing, as discussed in detail in [50]. In addition, the permittivity tensor of anisotropic Bi film [51] may be changed due to the implemented geometrical discontinuity, but in numerical simulation, only the in-plane Bi film permittivity component was used, since it was measured in the experiment. The resulting difference may relate to the component of the dielectric permittivity tensor, which is perpendicular to the sample plane, which was not taken into account in the simulation.
A comparison of THz waveforms measured by THz TDS for the cases of solid Bi film and Bi-based FSS with G = 280 μ m, L = 250 μ m, and K = 80 μ m is presented in Figure 8. The group delay of a wave in mica is positive. In the case of continuous Bi film on a mica substrate, the group delay is negative in relation to both substrate and air signals, which corresponds to superluminal group velocity (the real part of the effective permittivity is negative in the whole frequency range under study, in accordance with Figure 4). In the case of Bi-based FSS on mica, the amplitude transmission is higher, but the group delay is negative in relation to the substrate signal only. In this case, the response of the medium is more complex and should be analyzed on the basis of the effective permittivity dispersion presented in Figure 7a.
Static tuning is achieved by geometric variation. The influence of G, L, and K on amplitude and phase spectra, effective permittivity dispersion, and group delay and group velocity spectra was studied further. In all the investigated cases, a value of the parameter under study was shifted towards both larger and smaller values by 20 μ m, while the other two parameters remained fixed.
With rising square unit cell size (G), the Q factor should increase, and amplitude transmission should decrease in the entire frequency range, enabling a higher difference between extreme values of the real part of the effective permittivity dispersion (stretching in both directions along the vertical axis), but also leading to an increase in its imaginary part in the entire frequency range under study. The numerical simulation and experimental results are presented in Figure 9 and Figure 10. According to the experimental results, with G rising from 260 μ m to 300 μ m, the ENZ point at 0.27 THz moves to 0.34 THz, the second point at 0.70 THz shifts to 0.67 THz, and the third point at 0.83 THz shifts to 0.86 THz.
When the group delay ( τ g ) is higher than that in free space, a wave passes through a medium with subluminal group velocity ( v g ), and its amplitude fades weakly. When τ g is less than that in free space, a wave propagates with superluminal v g exceeding c. If τ g < 0 , the group velocity ( v g ) becomes negative, i.e., negative with respect to the phase velocity. In both latter cases, the transmission coefficient falls significantly.
The spectra of group delay and group velocity are presented in Figure 11, along with horizontal lines denoting free-space group delay ( ( d B i + d m i c a ) / c ) and the speed of light (in the latter case, velocity is normalized as v g / c ). With increasing G, the frequency regions with negative group delay expand, while those with positive group delay narrow. Variation of the structural unit cell size (G) affects group delay in the entire frequency range under study. However, the main effect observed in this case with rising G is the rapidly increasing superluminal v g near 0.20–0.26 THz (the main jump is between G = 280 μ m and G = 300   μ m) and its shift near 0.8–0.84 THz.
These frequencies lie within atmospheric transparency windows proposed for use in 6G wireless communication systems [52], which are about 0.2–0.3 THz, 0.4 THz, 0.6 THz, 0.65 THz, 0.8–0.9 THz, etc. [53]. For example, current efforts in the field of 6G communications are focused but not limited on frequencies such as 0.14 THz, 0.22 THz, and 0.34 THz [52].
Variation of the cross-like aperture side length (L) should affect the frequency position of the first resonant peak: with rising L, it should shift towards the low-frequency region (both amplitude and phase spectra). Both real and imaginary parts of the effective permittivity dispersion should also stretch into the low-frequency region, which will lead to a strong change in their values near some fixed frequencies. In addition, the transmission amplitude at the second resonant peak should slightly increase, since rising slot length produces an increase in the cross-sectional area at a constant value of K. The results are presented in Figure 12 and Figure 13.
By varying value of the aperture length (L), it is possible to obtain more broadband ENZ response near 0.8 THz. With rising L, the low-frequency region with NGD tends to narrow, while the region with positive group delay expands, stretching noticeably into the low-frequency range. According to experimental results, with L rising from 230 μ m to 270 μ m, the ENZ point at 0.38 THz moves to 0.26 THz, the second point at 0.70 THz shifts to 0.68 THz, and the third point at 0.87 THz does not shift.
The frequency spectra of group delay and group velocity with a variable value of L are presented in Figure 14. With rising L, the group delay spectrum expands mainly to lower frequencies and changes its value depending on the specific frequency. For example, the group velocity is negative when L = 230 μ m, superluminal for L = 250 μ m, and subluminal for L = 270 μ m at 0.24 THz. At the same time, with L rising from L = 230 μ m to L = 270 μ m, the operation mode changes from subluminal to near-luminal at 0.87 THz, and a noticeable shift is observed near 0.6 THz. All these frequencies also lie within transparency windows of the atmosphere.
Next, the influence of the cross-like aperture side width (K) was investigated. With rising K, the second resonant peak should shift towards lower frequencies, and at the same time, amplitude transmission should increase at both resonances, since a cut area of the cross-like slot does increase. In other words, with rising K, FSS tends to work as a high-pass filter instead a band-pass filter. The results are presented in Figure 15 and Figure 16. Obviously, increasing the aperture width (K) reduces the Q factor, eliciting a relatively broadband ENZ response near 0.7–0.8 THz by switching from positive to negative group delay in the high-frequency region above 0.63 THz. According to the experimental results, with K rising from 60 μ m to 100 μ m, the ENZ point at 0.32 THz moves to 0.36 THz, and the second third points at 0.67 THz and 0.97 THz disappear, since the dispersion in this frequency range becomes positive.
The frequency spectra of group delay and group velocity with variable value of K are presented in Figure 17. With rising K, the group delay changes significantly from negative to positive near 0.8–0.9 THz and falls smoothly near 0.25–0.5 THz. For example, with increasing L, the group velocity switches from negative to superluminal and then to subluminal mode near 0.8–0.9 THz. At the same time, the noticeable shift occurs near such frequencies as 0.2–0.3 THz, and 0.6 THz. These frequencies also lie within transparency windows of the atmosphere.
The dynamical tuning was also studied. The influence of voltage applied between two opposite electrodes on the shift of the effective permittivity dispersion was investigated in the range of 0–10 V (see Figure 18). There is a possibility to adjust effective permittivity dispersion with high precision. When a voltage of 10 V is applied, the maximum range of such a change along vertical axis reaches 1. For example, it allows one to move ENZ point at 0.705 THz to 0.724 THz or to change the effective permittivity real part at 0.304 THz from 0.23 to −0.26. The similar shift of group delay is presented in Figure 19: these dependencies confirm the possibility of a group delay precise adjustment at any desired frequency in the range under study. For example, in the case of G = 280 μ m, L = 250 μ m, and K = 80 μ m, the most noticeable change in this parameter is observed near 0.4 THz, 0.6 THz, 0.8 THz, and 0.95 THz. Most of these frequencies (excluding 0.95 THz) lie within atmospheric transparency windows.

4. Conclusions

In conclusion, statically/dynamically tunable amplitude transmission and phase shift spectra, effective permittivity dispersion, and group delay and group velocity spectra were demonstrated both numerically and experimentally on the basis of FSS consisting of a thin Bi film on a mica substrate. FSS with a polarization-independent configuration is produced by laser engraving, which provides a high-quality pattern. Static tuning is achieved by geometric variation; FSS unit cell size affects its Q factor and transmission coefficient, expanding or narrowing the frequency regions with NGD; cross-like slot length variation shifts the first resonant peak and stretches the corresponding effective permittivity into a low-frequency region; and cross-like slot width influences the second peak position (affecting the operation of the structure as a band-pass or a high-pass filter) and allows one to obtain a wide-band epsilon-near-zero dispersion. Dynamic tuning provides precise adjustment when voltage applied between two opposite electrodes influences the shift of an effective permittivity dispersion and a group delay spectrum. All the frequency regions with noticeable change in group delay/group velocity lie within atmospheric transparency windows, which are to be used in 6G communications. The proposed structure combines a simple manufacturing procedure with the possibility of dynamic tuning using printed electrodes and operation in frequency bands that are well-matched with atmospheric transparency windows and may be applied for tunable phase shift compensation, temporal modulation, dispersion management in systems of THz signal modulation, and for encoding in communications.

Author Contributions

Conceptualization, M.K.K. and A.D.Z.; methodology, M.K.K. and A.D.Z.; software, A.D.Z.; formal analysis, A.V.V.; continuous film sample fabrication: N.S.K.; investigation, P.S.D. and A.D.Z.; resources, M.K.K. and N.S.K.; writing—original draft preparation, A.D.Z.; writing—review and editing, M.K.K., A.V.V. and A.D.Z.; visualization, A.D.Z.; supervision, M.K.K. All authors have read and agreed to the published version of the manuscript.

Funding

This research received no external funding.

Institutional Review Board Statement

Not applicable.

Informed Consent Statement

Not applicable.

Data Availability Statement

All the data used in this work are available from the authors.

Acknowledgments

The authors would like to thank the Semimetal Physics Laboratory of the Herzen State Pedagogical University of Russia for production of the experimental samples. Laser engraving was carried out on the equipment of Laser Center LLC (St. Petersburg, Russia). The spectroscopic measurements were performed using the resources of Tydex LLC.

Conflicts of Interest

The authors declare no conflict of interest.

References

  1. Brillouin, L. Wave Propagation and Group Velocity; Academic Press: New York, NY, USA, 1960. [Google Scholar]
  2. Siddiqui, O.F.; Erickson, S.J.; Eleftheriades, G.V.; Mojahedi, M. Time-domain measurement of negative group delay in negative-refractive-index transmission-line metamaterials. IEEE Trans. Microw. Theory Tech. 2004, 52, 1449–1454. [Google Scholar] [CrossRef]
  3. Kandic, M.; Bridges, G.E. Limits of negative group delay phenomenon in linear causal media. Prog. Electromagn. Res. 2013, 134, 227–246. [Google Scholar] [CrossRef]
  4. Martin, T.; Landauer, R. Time delay of evanescent electromagnetic waves and the analogy to particle tunneling. Phys. Rev. A 1992, 45, 2611. [Google Scholar] [CrossRef] [PubMed]
  5. Grundmann, M. Kramers–kronig relations. In The Physics of Semiconductors; Springer: Berlin/Heidelberg, Germany, 2010; pp. 775–776. [Google Scholar]
  6. Stenner, M.D.; Gauthier, D.J.; Neifeld, M.A. The speed of information in a ‘fast-light’optical medium. Nature 2003, 425, 695–698. [Google Scholar] [CrossRef] [PubMed]
  7. Bigelow, M.S.; Lepeshkin, N.N.; Boyd, R.W. Superluminal and slow light propagation in a room-temperature solid. Science 2003, 301, 200–202. [Google Scholar] [CrossRef]
  8. Brillouin, L.; Parodi, M. Wave Propagation in Periodic Structures, International Series in Pure and Applied Physics; McGraw-Hill: New York, NY, USA, 1946. [Google Scholar]
  9. Woodley, J.; Mojahedi, M. Negative group velocity and group delay in left-handed media. Phys. Rev. E 2004, 70, 046603. [Google Scholar] [CrossRef]
  10. Galisteo-López, J.; Galli, M.; Balestreri, A.; Patrini, M.; Andreani, L.; López, C. Slow to superluminal light waves in thin 3D photonic crystals. Opt. Express 2007, 15, 15342–15350. [Google Scholar] [CrossRef]
  11. Novikov, V.; Leontiev, A.; Napolskii, K.; Murzina, T. Superluminal and slow femtosecond laser pulses in hyperbolic metamaterials in epsilon-near-zero regime. Opt. Lett. 2021, 46, 2276–2279. [Google Scholar] [CrossRef]
  12. Hrabar, S.; Krois, I.; Bonic, I.; Kiricenko, A. Ultra-broadband simultaneous superluminal phase and group velocities in non-Foster epsilon-near-zero metamaterial. Appl. Phys. Lett. 2013, 102, 054108. [Google Scholar] [CrossRef]
  13. Nimtz, G.; Haibel, A. Basics of superluminal signals. Ann. Der Phys. 2002, 514, 163–171. [Google Scholar] [CrossRef]
  14. Sabín, C.; Peropadre, B.; Lamata, L.; Solano, E. Simulating superluminal physics with superconducting circuit technology. Phys. Rev. A 2017, 96, 032121. [Google Scholar] [CrossRef]
  15. Song, K.Y.; Abedin, K.S.; Hotate, K. Gain-assisted superluminal propagation in tellurite glass fiber based on stimulated Brillouin scattering. Opt. Express 2008, 16, 225–230. [Google Scholar] [CrossRef] [PubMed]
  16. Mugnai, D.; Ranfagni, A.; Ronchi, L. The question of tunneling time duration: A new experimental test at microwave scale. Phys. Lett. A 1998, 247, 281–286. [Google Scholar] [CrossRef]
  17. Mitrofanov, O.; Lee, M.; Hsu, J.; Pfeiffer, L.; West, K.; Wynn, J.; Federici, J. Terahertz pulse propagation through small apertures. Appl. Phys. Lett. 2001, 79, 907–909. [Google Scholar] [CrossRef]
  18. Haché, A.; Poirier, L. Anomalous dispersion and superluminal group velocity in a coaxial photonic crystal: Theory and experiment. Phys. Rev. E 2002, 65, 036608. [Google Scholar] [CrossRef]
  19. Niang, A.; de Lustrac, A.; Burokur, S. Superluminal wave propagation in a non-Foster negative capacitor loaded transmission line. Electron. Lett. 2017, 53, 547–549. [Google Scholar] [CrossRef]
  20. Mojahedi, M.; Schamiloglu, E.; Hegeler, F.; Malloy, K.J. Time-domain detection of superluminal group velocity for single microwave pulses. Phys. Rev. E 2000, 62, 5758. [Google Scholar] [CrossRef]
  21. Schreier, F.; Schmitz, M.; Bryngdahl, O. Superluminal propagation of optical pulses inside diffractive structures. Opt. Commun. 1999, 163, 1–4. [Google Scholar] [CrossRef]
  22. Perenzoni, M.; Paul, D.J. Physics and Applications of Terahertz Radiation; Springer: Berlin/Heidelberg, Germany, 2014; Volume 173. [Google Scholar]
  23. Lewis, R.A. A review of terahertz sources. J. Phys. D Appl. Phys. 2014, 47, 374001. [Google Scholar] [CrossRef]
  24. Lewis, R. A review of terahertz detectors. J. Phys. D Appl. Phys. 2019, 52, 433001. [Google Scholar] [CrossRef]
  25. Mittleman, D.M. Twenty years of terahertz imaging. Opt. Express 2018, 26, 9417–9431. [Google Scholar] [CrossRef] [PubMed]
  26. Nagatsuma, T.; Ducournau, G.; Renaud, C.C. Advances in terahertz communications accelerated by photonics. Nat. Photonics 2016, 10, 371–379. [Google Scholar] [CrossRef]
  27. Gong, A.; Qiu, Y.; Chen, X.; Zhao, Z.; Xia, L.; Shao, Y. Biomedical applications of terahertz technology. Appl. Spectrosc. Rev. 2020, 55, 418–438. [Google Scholar] [CrossRef]
  28. Tzydynzhapov, G.; Gusikhin, P.; Muravev, V.; Dremin, A.; Nefyodov, Y.; Kukushkin, I. New real-time sub-terahertz security body scanner. J. Infrared Millim. Terahertz Waves 2020, 41, 632–641. [Google Scholar] [CrossRef]
  29. Grebenchukov, A.N.; Zaitsev, A.D.; Novoselov, M.G.; Demchenko, P.S.; Kovalska, E.O.; Alonso, E.T.; Walsh, K.; Russo, S.; Craciun, M.F.; Baldycheva, A.V.; et al. Photoexcited terahertz conductivity in multi-layered and intercalated graphene. Opt. Commun. 2020, 459, 124982. [Google Scholar] [CrossRef]
  30. Lee, S.H.; Choe, J.H.; Kim, C.; Bae, S.; Kim, J.S.; Park, Q.H.; Seo, M. Graphene assisted terahertz metamaterials for sensitive bio-sensing. Sens. Actuators B Chem. 2020, 310, 127841. [Google Scholar] [CrossRef]
  31. Withayachumnankul, W.; Fischer, B.M.; Ferguson, B.; Davis, B.R.; Abbott, D. A systemized view of superluminal wave propagation. Proc. IEEE 2010, 98, 1775–1786. [Google Scholar] [CrossRef]
  32. Rivas, J.G.; Benet, A.F.; Niehusmann, J.; Bolivar, P.H.; Kurz, H. Time-resolved broadband analysis of slow-light propagation and superluminal transmission of electromagnetic waves in three-dimensional photonic crystals. Phys. Rev. B 2005, 71, 155110. [Google Scholar] [CrossRef]
  33. Wynne, K.; Carey, J.J.; Zawadzka, J.; Jaroszynski, D.A. Tunneling of single-cycle terahertz pulses through waveguides. Opt. Commun. 2000, 176, 429–435. [Google Scholar] [CrossRef]
  34. Zhang, Z.; Deng, F.; Wu, F.; Zhu, C. Dynamical characteristics of ultrashort terahertz pulse in metamaterials. Laser Phys. Lett. 2022, 19, 056001. [Google Scholar] [CrossRef]
  35. He, X.; Yang, X.; Lu, G.; Yang, W.; Wu, F.; Yu, Z.; Jiang, J. Implementation of selective controlling electromagnetically induced transparency in terahertz graphene metamaterial. Carbon 2017, 123, 668–675. [Google Scholar] [CrossRef]
  36. Bossard, J.A.; Liang, X.; Li, L.; Yun, S.; Werner, D.H.; Weiner, B.; Mayer, T.S.; Cristman, P.F.; Diaz, A.; Khoo, I. Tunable frequency selective surfaces and negative-zero-positive index metamaterials based on liquid crystals. IEEE Trans. Antennas Propag. 2008, 56, 1308–1320. [Google Scholar] [CrossRef]
  37. Zaitsev, A.; Demchenko, P.; Makarova, E.; Tukmakova, A.; Kablukova, N.; Asach, A.; Novotelnova, A.; Khodzitsky, M. Hyperbolic Bismuth–Dielectric Structure for Terahertz Photonics. Phys. Status Solidi (RRL)–Rapid Res. Lett. 2020, 14, 2000093. [Google Scholar] [CrossRef]
  38. Zaitsev, A.; Zykov, D.; Demchenko, P.; Novoselov, M.; Nazarov, R.; Masyukov, M.; Makarova, E.; Tukmakova, A.; Asach, A.; Novotelnova, A.; et al. Experimental investigation of optically controlled topological transition in bismuth-mica structure. Sci. Rep. 2021, 11, 1–13. [Google Scholar] [CrossRef] [PubMed]
  39. Grabov, V.; Demidov, E.; Komarov, V. Optimization of the conditions for vacuum thermal deposition of bismuth films with control of their imperfection by atomic force microscopy. Phys. Solid State 2010, 52, 1298–1302. [Google Scholar] [CrossRef]
  40. Garcia, N.; Kao, Y.; Strongin, M. Galvanomagnetic studies of bismuth films in the quantum-size-effect region. Phys. Rev. B 1972, 5, 2029. [Google Scholar] [CrossRef]
  41. Available online: http://tydex.ru (accessed on 25 April 2023).
  42. Naftaly, M.; Miles, R.E. Terahertz time-domain spectroscopy for material characterization. Proc. IEEE 2007, 95, 1658–1665. [Google Scholar] [CrossRef]
  43. Naftaly, M. Terahertz Metrology; Artech House: Norfolk, MA, USA, 2015. [Google Scholar]
  44. Taschin, A.; Bartolini, P.; Tasseva, J.; Torre, R. THz time-domain spectroscopic investigations of thin films. Measurement 2018, 118, 282–288. [Google Scholar] [CrossRef]
  45. Tinkham, M. Energy gap interpretation of experiments on infrared transmission through superconducting films. Phys. Rev. 1956, 104, 845. [Google Scholar] [CrossRef]
  46. Novotny, L.; Hecht, B. Principles of Nano-Optics; Cambridge University Press: Cambridge, UK, 2012. [Google Scholar]
  47. Qi, L.; Liu, C. Complex band structures of 1D anisotropic graphene photonic crystal. Photonics Res. 2017, 5, 543–551. [Google Scholar] [CrossRef]
  48. Available online: https://www.3ds.com/products-services/simulia/products/cst-studio-suite (accessed on 25 April 2023).
  49. Soboleva, V.Y.; Gomon, D.A.; Sedykh, E.A.; Balya, V.K.; Khodzitskii, M.K. Development of narrow bandpass filters based on cross cavities for the terahertz frequency range. J. Opt. Technol. 2017, 84, 521–524. [Google Scholar] [CrossRef]
  50. Boyd, I.W.; Wilson, J.I. Laser processing of silicon. Nature 1983, 303, 481–486. [Google Scholar] [CrossRef]
  51. Alekseyev, L.V.; Podolskiy, V.A.; Narimanov, E.E. Homogeneous hyperbolic systems for terahertz and far-infrared frequencies. Adv. Optoelectron. 2012, 2012, 1–6. [Google Scholar] [CrossRef]
  52. Koziol, M. It’s never too early to think about 6G. IEEE Spectr. 2018, 22, 1. [Google Scholar]
  53. Sizov, F. Infrared and terahertz in biomedicine. Semicond. Phys. Quantum Electron. Optoelectron. 2017, 20, 273–283. [Google Scholar] [CrossRef]
Figure 1. THz TDS setup. The sample consisting of 120 nm Bi film on 21 μ m mica substrate (inset) is placed between two central lenses. The bismuth film has an area of 15 × 15 mm. The electrodes on both sides of the sample are used for dynamic tuning.
Photonics 10 00501 g001
Figure 2. Amplitude transmission (a) and phase delay (b) spectra of a THz wave transmitted through the mica and the bismuth–mica structure (rationed as | E ^ m i c a ( f ) | / | E ^ a i r ( f ) | , | E ^ B i + m i c a ( f ) | / | E ^ a i r ( f ) | and ϕ m i c a ( f ) ϕ a i r ( f ) , ϕ B i + m i c a ( f ) ϕ a i r ( f ) , respectively).
Photonics 10 00501 g002
Figure 3. Complex permittivity dispersions of the mica substrate (a) and 120 nm Bi film (b).
Photonics 10 00501 g003
Figure 4. Complex effective permittivity dispersion ( ε ^ e f f ( f ) ) of the bismuth–mica structure extracted from THz TDS (direct measurement) and numerical simulation or calculation based on the transfer matrix method (simulation).
Photonics 10 00501 g004
Figure 5. (a) Schematic view of the FSS. The configuration is defined by the square unit cell size (G) and by the length (L) and width (K) of a slot in the bismuth film. (b) Photo of the laser engraving process.
Photonics 10 00501 g005
Figure 6. Amplitude transmission (a) and phase delay (b) spectra of a THz wave passed through the bismuth-based FSS at G = 280 μ m, L = 250 μ m, and K = 80 μ m.
Photonics 10 00501 g006
Figure 7. Real (a) and imaginary (b) parts of the complex effective permittivity dispersion of the bismuth-based FSS at G = 280 μ m, L = 250 μ m, and K = 80 μ m.
Photonics 10 00501 g007
Figure 8. THz waveforms for radiation transmitted through the air, the mica substrate, and the substrate-film medium in the cases of solid Bi film (a) and Bi-based FSS (b). Vertical lines indicate peak positions of wave packets.
Photonics 10 00501 g008
Figure 9. Amplitude transmission (a) and phase delay (b) spectra of a THz wave passed through the bismuth-based FSS at different values of the square unit cell size (G).
Photonics 10 00501 g009
Figure 10. Real (a) and imaginary (b) parts of the complex effective permittivity dispersion of the bismuth-based FSS at different values of the square unit cell size (G).
Photonics 10 00501 g010
Figure 11. Frequency-dependent group delay (a) and group velocity (b) normalized to c at different values of the square unit cell size (G).
Photonics 10 00501 g011
Figure 12. Amplitude transmission (a) and phase delay (b) spectra of a THz wave passed through the bismuth-based FSS at different values of the cross-like slot side length (L).
Photonics 10 00501 g012
Figure 13. Real (a) and imaginary (b) parts of the complex effective permittivity dispersion of the bismuth-based FSS at different values of the cross-like slot side length (L).
Photonics 10 00501 g013
Figure 14. Frequency-dependent group delay (a) and group velocity (b) normalized to c at different values of the cross-like slot side length (L).
Photonics 10 00501 g014
Figure 15. Amplitude transmission (a) and phase delay (b) spectra of a THz wave passed through the bismuth-based FSS at different values of the cross-like slot side width (K).
Photonics 10 00501 g015
Figure 16. Real (a) and imaginary (b) parts of the complex effective permittivity dispersion of the bismuth-based FSS at different values of the cross-like slot side width (K).
Photonics 10 00501 g016
Figure 17. Frequency-dependent group delay (a) and group velocity (b) normalized to c at different values of the cross-like slot side width (K).
Photonics 10 00501 g017
Figure 18. Shift of the complex effective permittivity dispersion real (a) and imaginary (b) parts for the bismuth-based FSS with G = 280 μ m, L = 250 μ m, and K = 80 μ m under the influence of external voltage applied between two opposite electrodes (up to 10 V).
Photonics 10 00501 g018
Figure 19. Shift of the group delay spectrum for the bismuth-based FSS with G = 280 μ m, L = 250 μ m, and K = 80 μ m under the influence of external voltage.
Photonics 10 00501 g019
Disclaimer/Publisher’s Note: The statements, opinions and data contained in all publications are solely those of the individual author(s) and contributor(s) and not of MDPI and/or the editor(s). MDPI and/or the editor(s) disclaim responsibility for any injury to people or property resulting from any ideas, methods, instructions or products referred to in the content.

