1. Introduction
The science of THz pulse technology is a growing field of interest in fundamental research, security surveillance, pharmaceutical industries, the biomedical sector, telecommunications, spectroscopy and imaging applications [
1,
2,
3]. THz technology has gained wide attention in the study of various materials. In particular, its research and spectroscopic application stems from the signature response of electrons, spins, phonons and the rotational modes of molecules in the THz spectral range [
4,
5,
6]. THz pulses have been generated in various forms regarding their polarization states, vorticity, spectral bandwidth and signal amplitude, in which the characteristics of the generated pulses determine their suitability for certain specific applications [
7,
8]. These characteristics can be modified based on the emitter sources. Among the table-top sources, nonlinear crystals can generate intense THz pulse amplitude in either time-resolved (pump-probe) or time-domain spectroscopy. ZnTe crystal is commonly used owing to its favorable phase-matching condition and its transparency in the optical and THz region [
9,
10]. These crystals, which are cut in either the (100), (111) or (110) plane, generate THz pulses with varying efficiency via optical rectification (OR) upon normal incidence with femtosecond laser sources [
11,
12]. OR can be explained in terms of Difference Frequency Generation (DFG), in which the spectral components within the bandwidth of the laser pulses interact to generate low-frequency signals within the THz region. Often, two crystals are needed in a typical experimental set-up for THz source and detection. Here, the THz pulse radiated by one crystal is detected at the other crystal by either a collinear or non-collinear interaction with a weak beam. Due to the usage of a weak laser pulse in the detection arm, there are usually no other observed processes other than the linear electro-optic (EO) effect. However, in the case where the generation occurs alongside the detection in the crystal, in what we shall refer to as single crystal configuration, the EO effect may coexist with other nonlinear processes such as two-photon absorption (TPA) and free carrier absorption (FCA), which competes with the generated THz pulse [
13,
14]. In order to have a close look into these nonlinear effects, Caumes et al., in their heterodyne Kerr experimental set-up, have observed the optical Kerr effect and Kerr-like effect in certain zinc blend structures that modify the form of the detected THz pulse [
15].
The Kerr-like effects are cascaded nonlinear signals induced by the generated THz pulse. A few years later, other researchers adopted the single crystal configuration as a tool to study and evaluate these additional nonlinear effects in the ZnTe crystals. He et al. confirmed the observation of Caumes et al. in the (111) ZnTe in which the measured nonlinear refractive index, was dominated by Kerr and Kerr-like effects, whereas only the Kerr effect was more significant in the (110) ZnTe [
16]. Furthermore, the effect of the Kerr signal, which usually appears at the onset of the THz waveform because the optical group velocity is lower than the THz phase velocity, was minimized by creating a temporal shift [
17,
18]. In a bid to distinguish the presence of either effect, Xiaoshu et al. included a phase-sensitive time-resolved z-scan in their experiment. Furthermore, by moving the crystal along a defined direction, they evaluated the contribution of each effect [
19].
A single crystal configuration is a great tool not only to study the response of ZnTe but also for application purposes in integrated THz devices. Chen et al. demonstrated the possibility of this configuration being applied in tomography. They used a ZnTe to transmit a pulsed signal detected in the same crystal upon being reflected [
8,
20]. Thus, it appears there will be a need to minimize the nonlinearities in the single crystal configuration in order to boost their applications. Temporally stretched, chirped laser pulses are less powerful than their Fourier-transform-limited pulse duration. However, their higher pulse energy can be used to reach the same power, thus leading to an increase in the THz yield due to the many photons present. Previously, efficient THz yields have been reported using a pre-chirped pump pulse in air-plasma THz-based sources [
21]. Erschens et al. extended this concept to nonlinear crystal-based sources [
22,
23,
24]. In our manuscript, we will introduce the idea of adding a chirp to the pump pulse in the single crystal configuration. Usually, chirped pump laser sources are capable of generating tunable and narrow-band THz frequencies [
25,
26,
27], which have been used to selectively excite phonons in certain mediums by some research groups [
28,
29].
One of the bases that form the framework of this research is the methodology commonly adopted for detecting THz pulses. Identical crystals are both used for the generation and detection scheme. Since appreciable success has been realized with the use of EO detection in this regard, it likely would have influenced the emergence of photonic THz compact devices. The EO detection route, which can be carried out by either the sampling or single-shot technique, has consequences on the form of the retrieved THz signal. In certain THz spectroscopy measurements involving fast and transient processes, the single-shot detection scheme is unarguably necessary. In particular, Murakami et al. and Zhao-Hui et al. have illustrated the performance of the single-shot measurement in time-resolved THz spectroscopy [
30,
31]. However, this technique has the drawback of reproducing a potentially deformed signal. There has been some progress in the single-shot geometries to address this challenge [
32], with an exception in the single crystal configuration, in which there has been no result until now, to the best of our knowledge. This research investigates the feasibility of a coupled and reliable system for THz generation and detection through a study based on the single crystal configuration involving a single-shot EO detection scheme in a ZnTe crystal.
To begin with, this work is a recall of the THz pulse generation theory ensuing from the chirped pump propagation in the crystal, apace with a contributory linear effect. It is followed by highlighting the consequence of the detection scheme on the form of the retrieved THz pulse. Afterward, the functions of the optical elements in the experimental scheme are indicated, with an explanatory note on the retrieval algorithm of the THz pulse. Subsequently, by discussing the observed results based on the theoretical predictions, a conclusion is drawn to spotlight the relevance of the work.
2. Principle and Theory
The generation of the THz pulse is initiated by irradiating a ZnTe crystal with an infra-red laser beam. Consider a pre-chirped pump pulse propagating along the
z-direction of the crystal, with group velocity
, whose Fourier-transform-limited pulse duration and second-order dispersion term are denoted by T and
, respectively. As in the following, the crystal is relatively thin (600 µm), and the optical pulse is long (3.6 ps); the dispersion due to the crystal is ignored. By neglecting pump depletion and absorption within the crystal, we can write the form of the pre-chirped pump pulse centered at
and propagating along the z-direction as
where
is the wave vector and
is the amplitude of the pulse. The pre-chirped pulse induces a total polarization in the crystal in which the nonlinear polarization term
is the most relevant for optical rectification. In this case, any two frequency components
within the spectral bandwidth of the incident pulse interact to generate low-frequency pulses in the THz region by the DFG process [
33,
34].
where
is the frequency-dependent second-order susceptibility of the crystal. The evolution of the generated THz pulse at normal incidence is modeled by the nonlinear Maxwell equation, in which the conductivity of the crystal has been neglected [
35],
Assuming the absence of THz field at the beginning of the crystal and neglecting the Fabry–Pérot effect, we set the boundary condition as
= 0, so that the analytical solution to Equation (3) upon substituting Equation (1) into the second term of Equation (2) is,
where
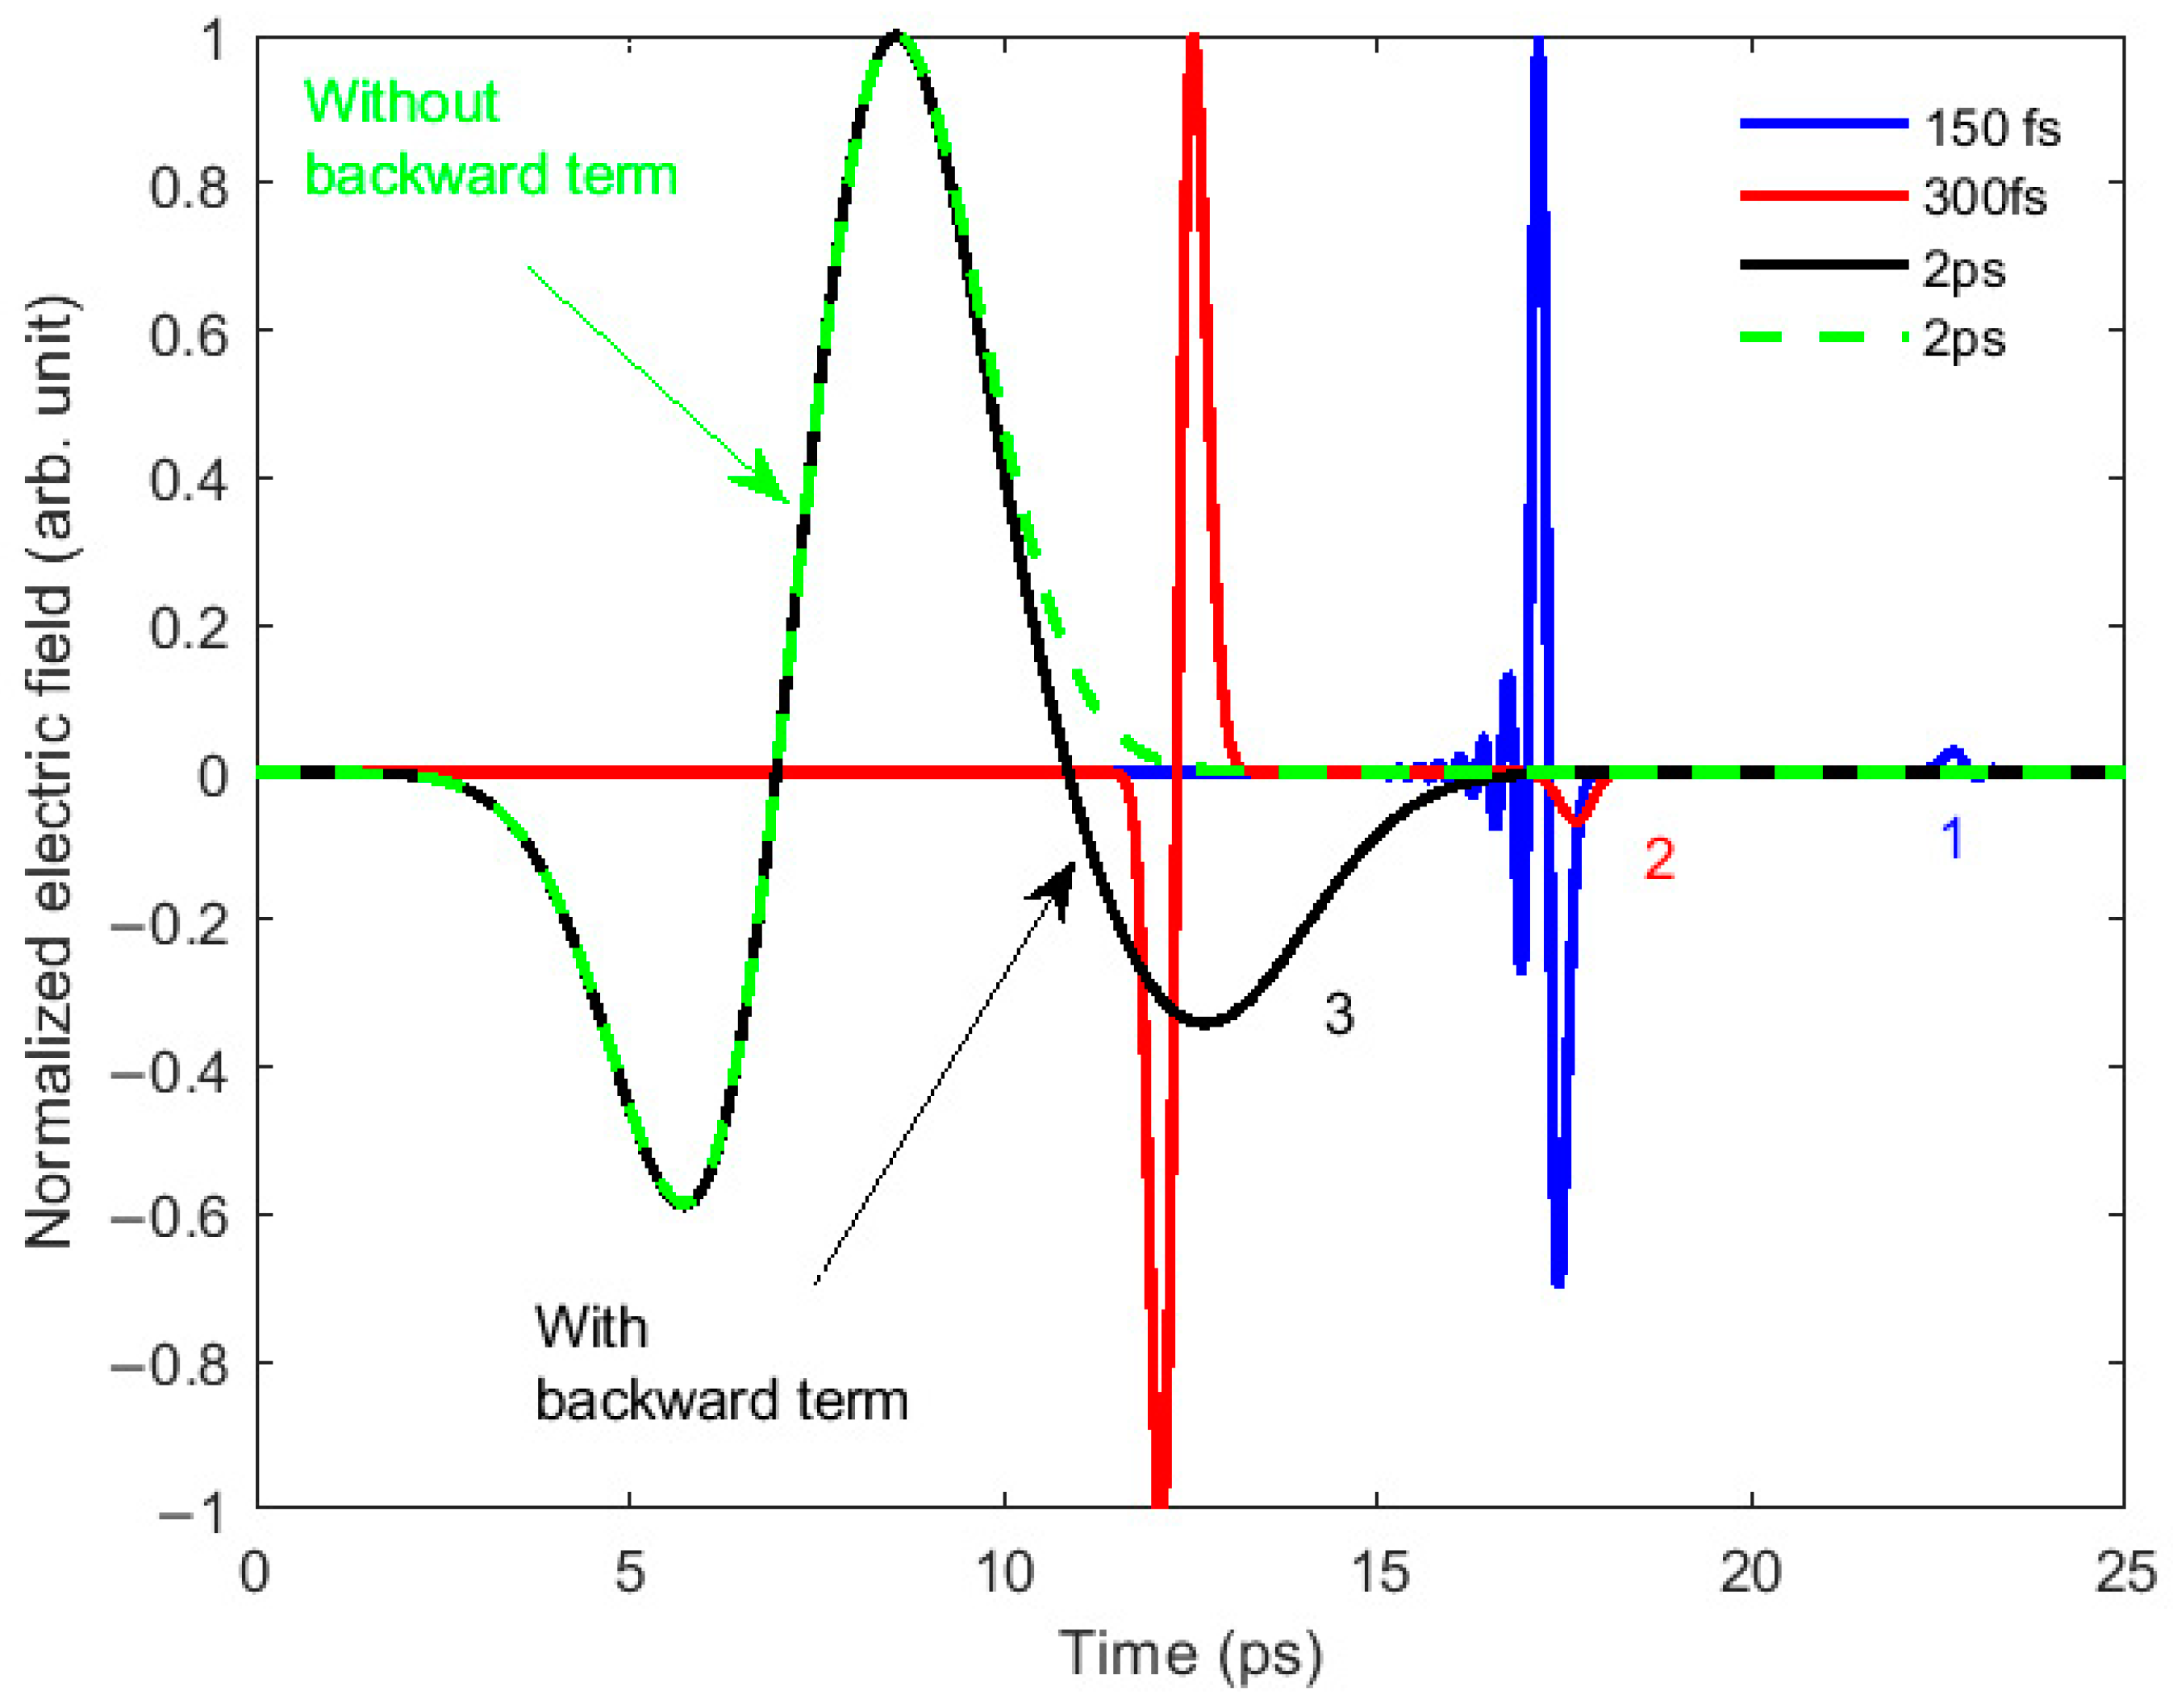
is assumed to be constant i.e., frequency independent since the THz frequency is well below the optical phonon resonance in our set-up. Three terms exist in Equation (4) corresponding to the carrier waves of the THz and pump pulses. The coefficient of the second term has a lower amplitude compared to the other terms. This second term propagating in the opposite direction to the first and last term contributes significantly to the waveform of the THz pulse if T is in the order of picosecond. The interaction between these terms adds up to the THz efficiency when chirped pump pulses irradiate the nonlinear crystal. In other words, the differences in the value of the group refractive index
(n
g = 3.2 at 800 nm) and the frequency dependent-
(n
THz~3.2 at 1 THz) experienced by the optical pulse and generated THz respectively leads to an insignificant temporal walk-off, thus making the generation process efficient. The plot in
Figure 1 illustrates the effect of backward propagating the THz pulse term in the profile of the THz field. By considering an incident 2 ps long laser pulse, the simulated THz with the backward term (black line) and without the backward term (dashed green line) shows a significant contribution, such that the effect of this term cannot be neglected as in the case of shorter incident pulses.
The round trip time of the THz pulse within the crystal is shorter than the THz pulse duration, implying that the effect of multiple reflections cannot be neglected. By considering the bouncing of the THz pulse between the opposite faces of the crystal, a transfer function for the Fabry–Pérot effect is defined as per [
35],
where
corresponds to the amplitude of the reflected THz pulse, and
represents the effective length of the crystal for THz generation. For a given THz spectrum, the spectral modulation appears with a lower spacing for a thicker crystal. As the THz pulse bounces off from the crystal–air interface with successively decreasing amplitude, it encounters the chirped probe in the last part of the crystal length. The THz pulse generated in the first part of the crystal length and modified by the Fabry–Pérot effect becomes coalesced onto the chirped probe.
Using a chirped pulse to probe the THz pulse, the different portions are overlaid onto different sections in the chirped probe. It makes achieving a single-shot measurement for a fixed position of the chirped probe’s delay stage possible. This form of encoding the THz pulse onto the chirped pulse is different from the conventional EOS in that the THz pulse is not sampled by the probe pulse. Due to the orientation of the chirped probe with respect to the principal axis of the crystal, the impact of the overlapping THz pulse can result in either a rotation in the chirped probe polarization, a temporally varying phase shift or a combination of these two phenomena [
36]. In the case relevant to the design of our set-up, the chirped probe polarization is rotated, and this change is converted by a polarizer into an amplitude modulation
as per;
where the modulation parameter due to the EO effect is given by
and
is the chirped probe electric field with a
FWHM spectral bandwidth and a duration of 5.2 ps. The recovery stage for this EO single-shot encoded THz pulse is achieved using the standard THz spectral interferometry technique. Denoting
as the spectral response of the optical spectrometer, the retrieved THz field,
is represented from the convolution between the optical spectrum and
as in [
37],
where
is the Fourier transform of Equation (6),
and
are the frequency of the signal recorded on one pixel and the resolution of the spectrometer. Given that
is effectively low, the retrieved THz pulse will not be affected by the spectrometer resolution. Our detection scheme excluded the inclusion of a read-out pulse to probe the THz-modulated chirped pulse, as in the case of other works [
38,
39]. The read-out pulse, which improves the temporal resolution of the THz pulse, is often needed where a large temporal window degrades the temporal resolution [
40]. Since we have utilized a chirped probe with a short temporal window, we expect that the temporal resolution is not adversely affected. The temporal resolution
, derived by comparing the form of the generated and detected THz signal in the case where
[
37] is,
In the next section, we used Equations (4) and (6) to simulate the THz pulse with a crystal length of 350 µm for the detection. In fact, the length used for the emission or the detection section does not significantly modify the shape of the THz pulse but mostly the amplitude.
3. Experimentation Section
The laser source for the experiment is a Ti-sapphire laser beam centered at a wavelength of
, with a repetition rate of 1 kHz and ~0.6 mJ of energy. The distance between the compressor’s gratings at the output of the chirped pulse amplifier was adjusted to generate 3.6 ps long pulses as measured by a Frequency Resolved Optical Gating (FROG) device [
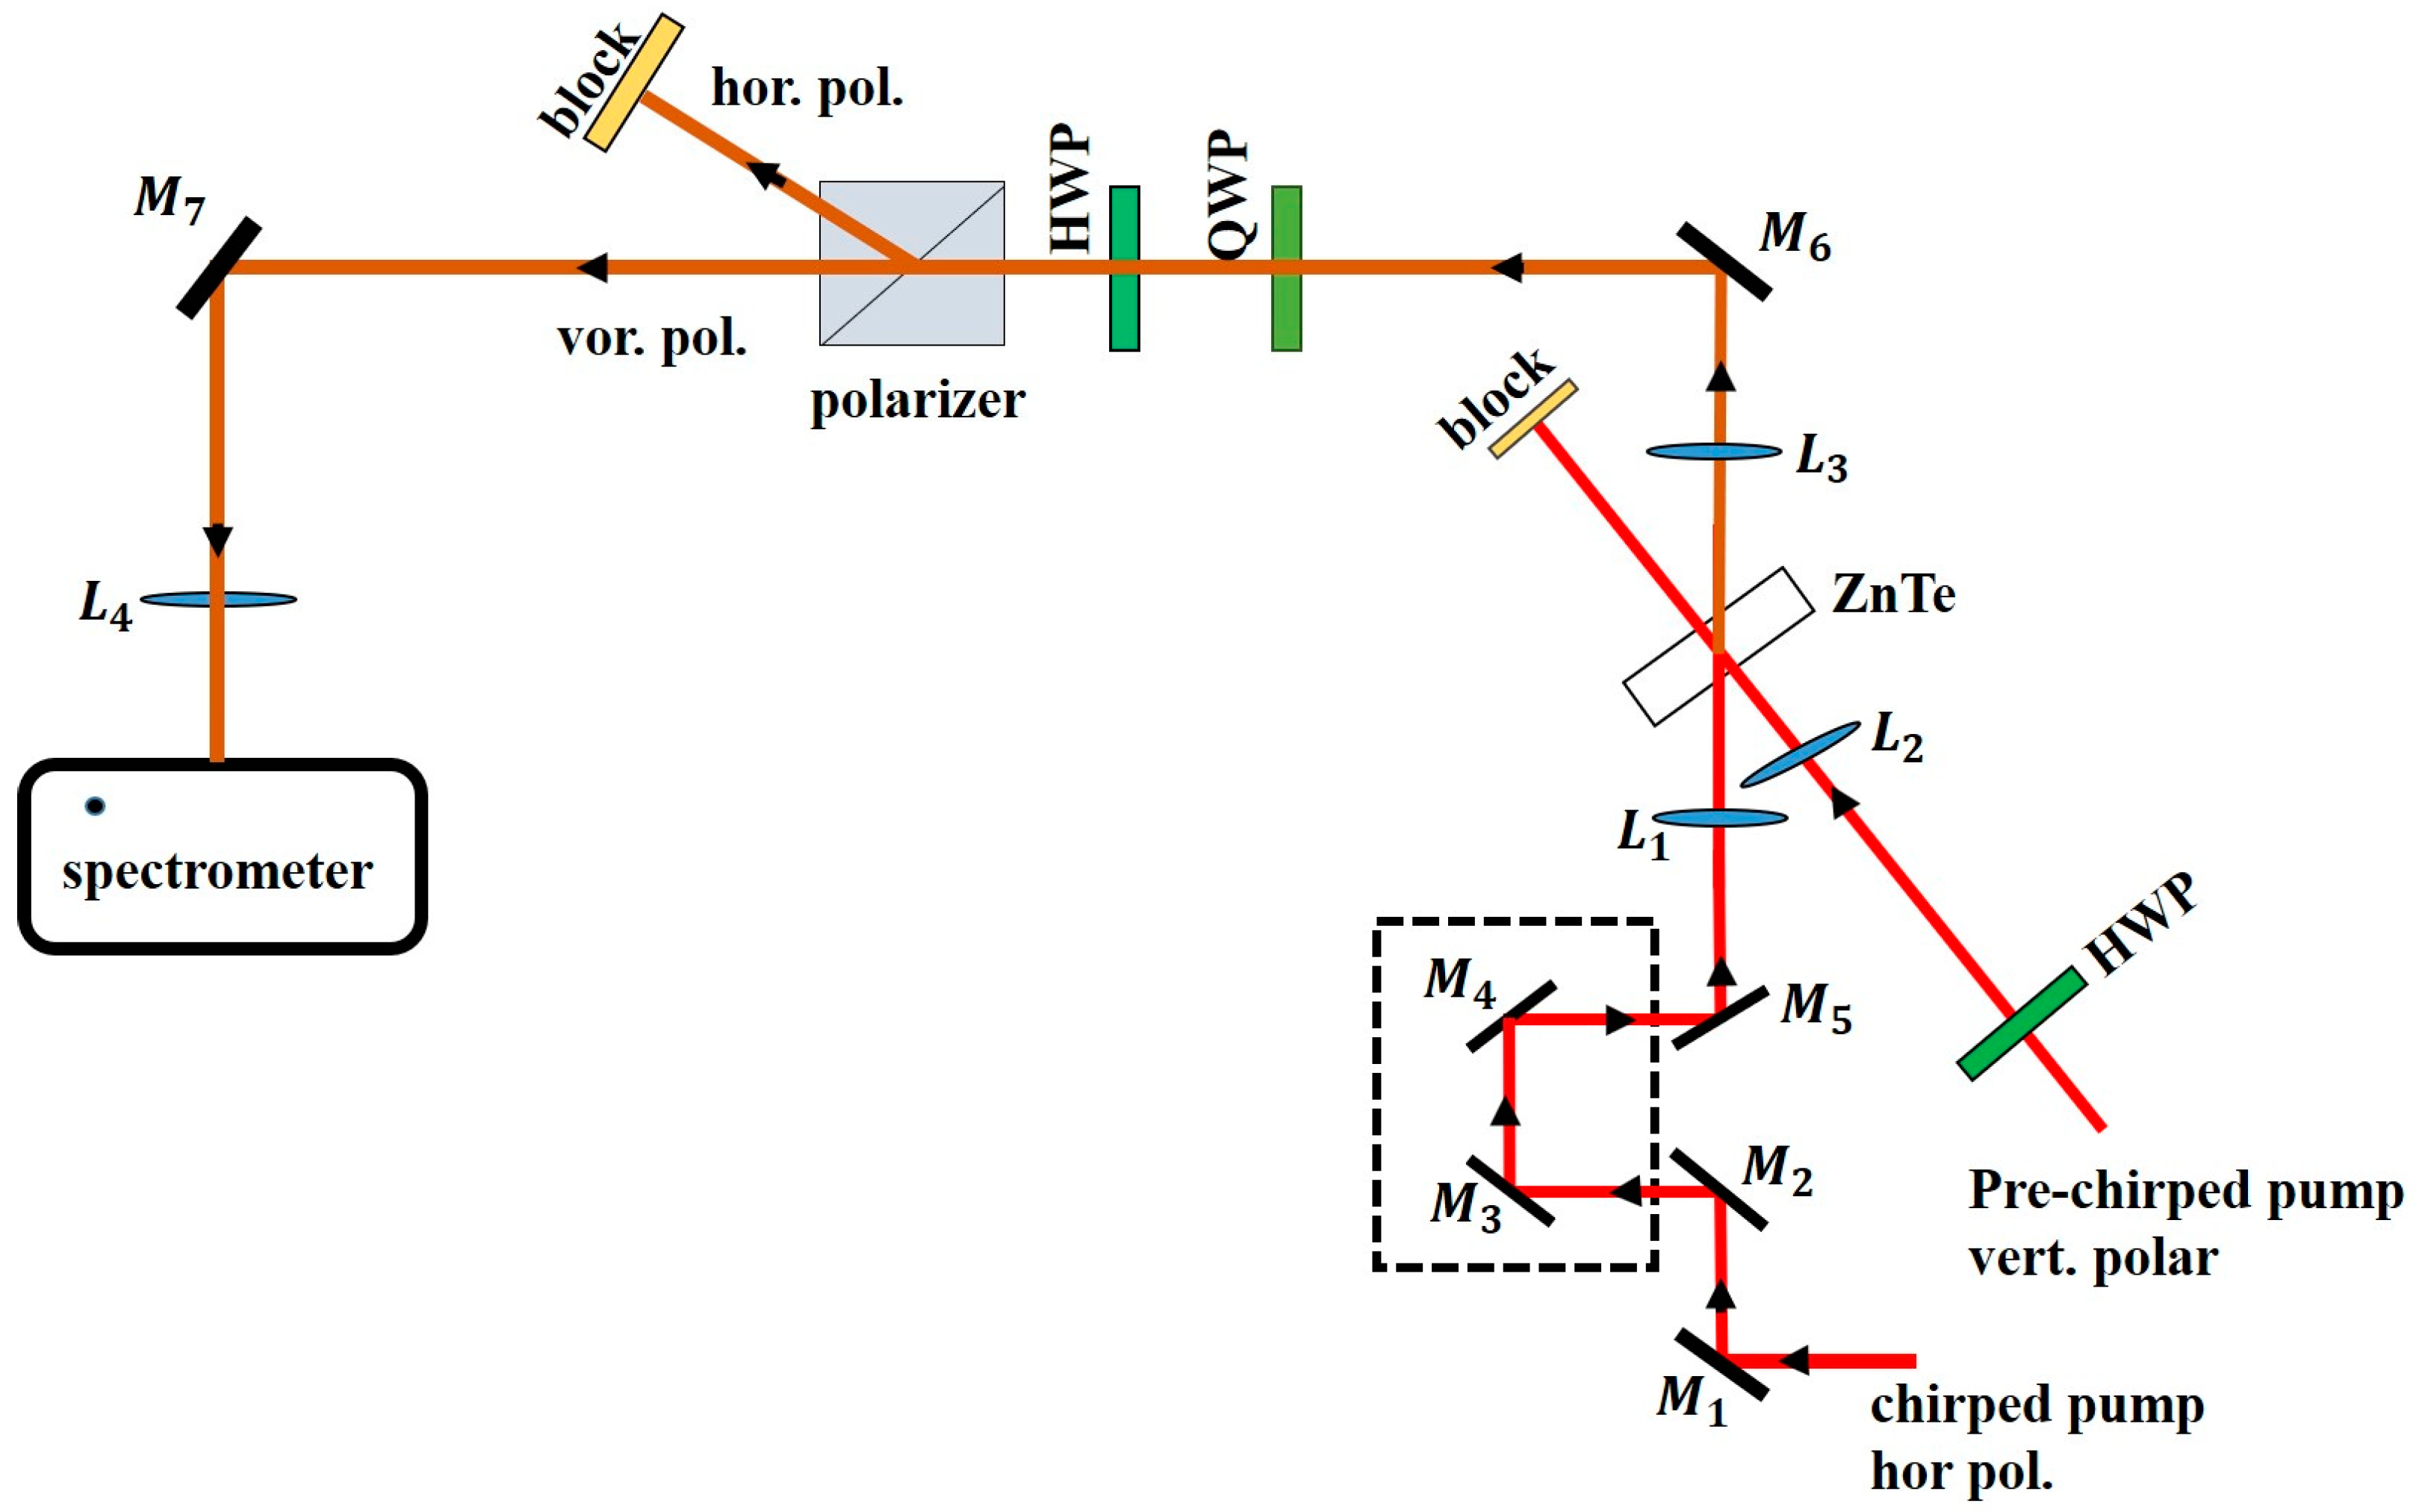
41]. A beam splitter is placed in the path of the output pulse to separate the pulse into a pump and probe beam (
Figure 2). The probe beam was additionally chirped by repeated passage through an assembly of dispersion blocks made up of SF6 material. A total of twenty-four (24) passes are realized in the 52 mm long blocks, and the probe pulse is broadened to 5.2 ps due to the material dispersion. The experimental set-up illustrated in
Figure 1 consists of the pre-chirped 3.6 ps pump beam focused on the 0.6 mm thick <110> ZnTe crystal with few tens of μJ. Due to the inherent complexity of simultaneously optimizing the crystal angle for efficient emission and detection in the single layout configuration, there is an unarguable tradeoff between these two phenomena. In this regard, an optimum angle of 26° (relative to the (001) axis) has been proposed and explored [
8]. In this experiment, the crystal angle was adjusted to maximize the detected THz signal. The 5.2 ps horizontally polarized chirped probe overlaps temporally and spatially with the vertically polarized pre-chirped pump beam on the crystal at a crossing angle of ~12°. The two beams were focused independently in the crystal. The diameter of the pump and probe beam at the crystal position was 570
and 125
respectively. It is straightforward to see that the beam size of the THz pulse given by
is larger than the probe size, where
denotes the pump size. Thus, we have assumed that the THz pulse has a constant intensity profile around the probe; as such,
is spatially independent in our simulation. The polarization of the beam is horizontal, while the pump one is rotated vertically.
In this single crystal configuration, the THz pulse is generated in the first part of the crystal by the incident pre-chirped pump beam; then, it induces a phase change on the incoming chirped probe beam. The overlap length between the THz pulse and the probe depends on the crossing angle and crossing point. This probe THz beam is collimated and subsequently circularly polarized by a quarter wave plate (QWP). The vertical and horizontal polarized components exit the polarizer with a slight deviation from each other. The HWP located between the QWP and polarizer switches between the beam paths of polarization components, such that the same optical spectrometer, sensitive to the P polarization, detects the different polarization. The choice of the optical spectrometer is such that its spectral resolution is effectively high in order to effectually resolve the frequency components of the measured signal. The recovery of the THz waveform occurs in two steps. (1) First, the probe spectrum is recorded in the absence of the pre-chirped pump pulse. (2) Then, the probe spectrum is measured with the THz (i.e., in the presence of the chirped pump pulse). (3) Finally, the ratio of the difference between these signals to the chirped pulse spectrum is calculated. This ratio is proportional to the electric field of the THz pulse since it has been established that the EO retrieved THz in Equation (7) is identical to the measured electric waveform of the THz spectrum in Equation (4). Prior to performing the THz field retrieval, the chirped probe is characterized once at the beginning of the experiment by a FROG device. This is important to determine the spectral phase of the probe, from which the frequency-time calibration is obtained. Since each temporal slice of the THz field is projected onto different frequency components in the chirped probe, the THz field can be reconstructed from the direct mapping of frequency to time. Our set-up is cost-effective and less bulky. Though it provides the avenue to independently analyze the signals of the different polarization, only the data of the s-polarization is presented in the following section.
4. Results and Discussion
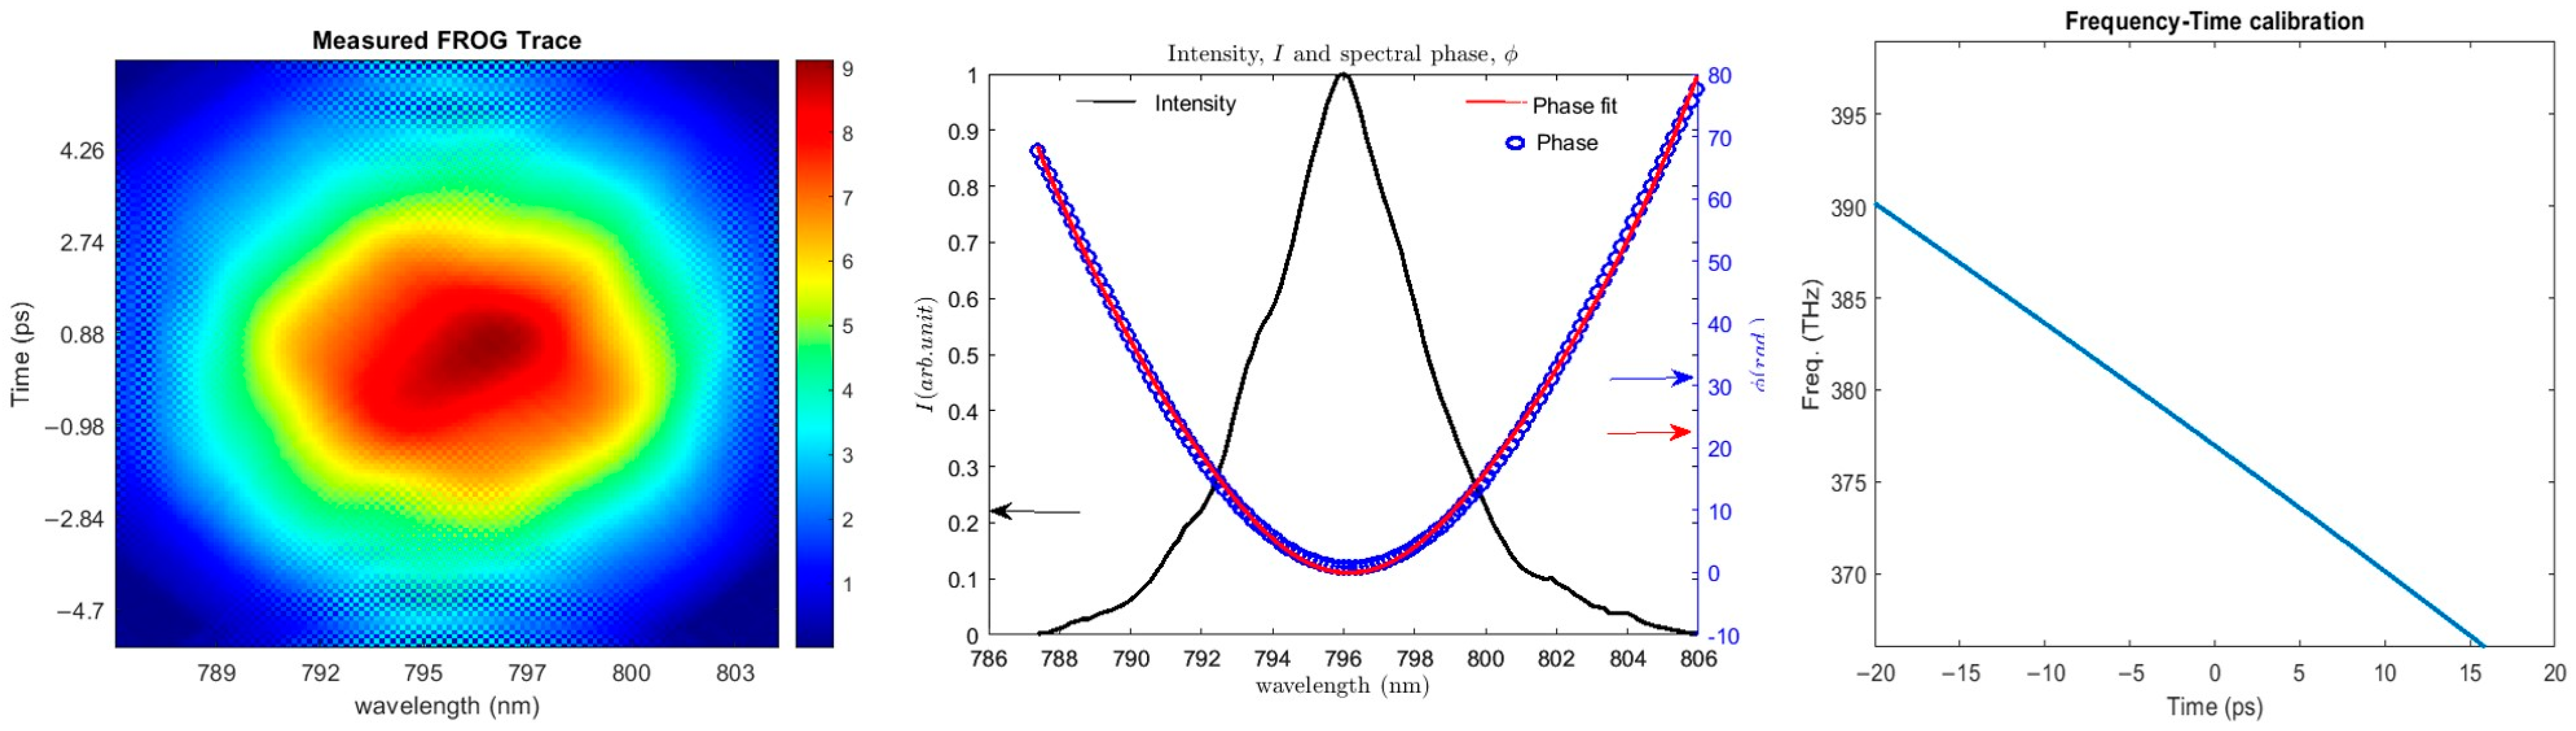
There are two possibilities to calibrate the time-frequency distribution to retrieve the duration of the THz signal, either by the FROG measurement of the chirped probe or its delay scan technique. The latter is a simple technique and involves translating the delay stage in order to observe a shift in the position of the corrugated pattern seen on top of the chirped probe due to the presence of the THz signal. However, the high order terms of the spectral term cannot be effectively estimated, leading to a loss of accuracy. Instead, we adopted the former to calibrate the THz signal.
This involved characterizing the chirped probe using a FROG technique to determine its spectral phase. The information about its spectral phase is then used to associate each frequency component to a time scale. During the THz-chirped probe interaction, we know that the THz signal overlaps on the chirped probe, so by mapping out the frequency region on which the THz signal lies, we construct the corresponding time scale for the THz signal. We have shown in
Figure 3 the retrieved spectrogram of the chirped probe pulse measured by the FROG device. We performed a 3rd order polynomial curve fit (red line) for the spectral phase of the chirped probe (blue circles), as shown in
Figure 3b. The group delay expression
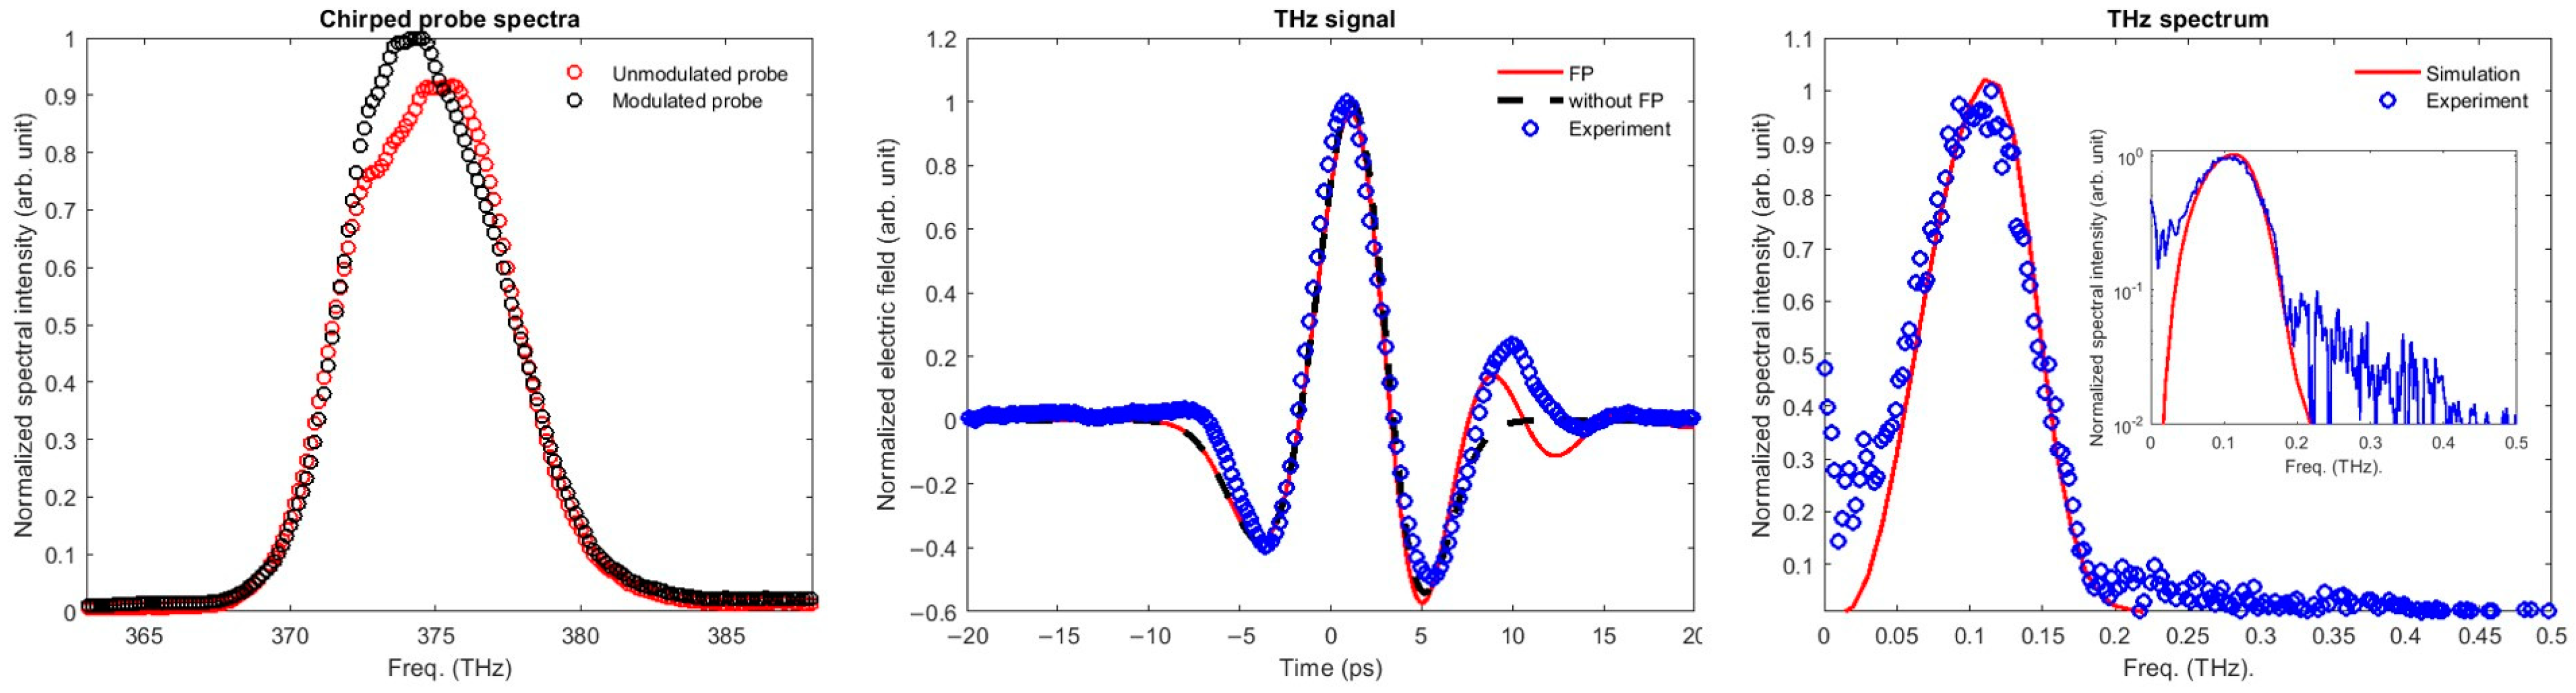
is then constructed from the coefficients of the fitted spectral phase. As such, a quadratic fit was obtained in which there is an observed linearity behavior within the spectral bandwidth of the chirped probe. We observed that it was possible to retrieve the THz signal by analyzing only one of the two polarization beams from the polarizer. Hence, an unbalanced detection was utilized to reconstruct the spectrally encoded THz signal. The optical spectrometer records the chirped probe signal in two sequences. The first measurement is taken in the absence of the pre-chirped pump to give rise to the unmodulated probe signal. This unmodulated probe which serves as the reference signal, is subtracted from the measurement taken afterward in the presence of the pre-chirped pump. The result of this subtraction is proportional to the product of the THz signal and the reference beam. To extract only the THz signal shown in
Figure 4b we normalized accordingly. In a way to verify the reproducibility of the spectrometer signals, several shots were recorded, and a resemblance was observed among the shots from which the average signals of these shots are, as shown in
Figure 4a. In the presence of the pre-chirped pump, the intensity of the chirped probe spectrum increased due to the overlapping THz signal.
In the data analysis, only the polarization (s) of both the modulated and unmodulated probes were analyzed and presented. The measured THz pulse has an FWHM duration of 6.5 ps and exhibits few cycles of oscillations. The corresponding spectrum is centered at 100 GHz with a width of 100 GHz. The narrow bandwidth is due to the long pulse duration of the pump. This THz pulse is generated with a significant contribution of the backward THz component. There is a conspicuous impact of the Fabry–Pérot effect due to the reflection of the THz pulse at the boundary of the crystal. Though the duration of the chirped pulse is not long enough to reveal the entire oscillation length of the Fabry–Pérot effect, the calculated magnitude of the maximum reflected pulse is around 25 percent which is in agreement with our experimental plot. We also evaluated the signal-to-noise ratio from the measurement of 100 shots. It is evaluated between 5 and 20%. This value is mostly due to laser fluctuation.
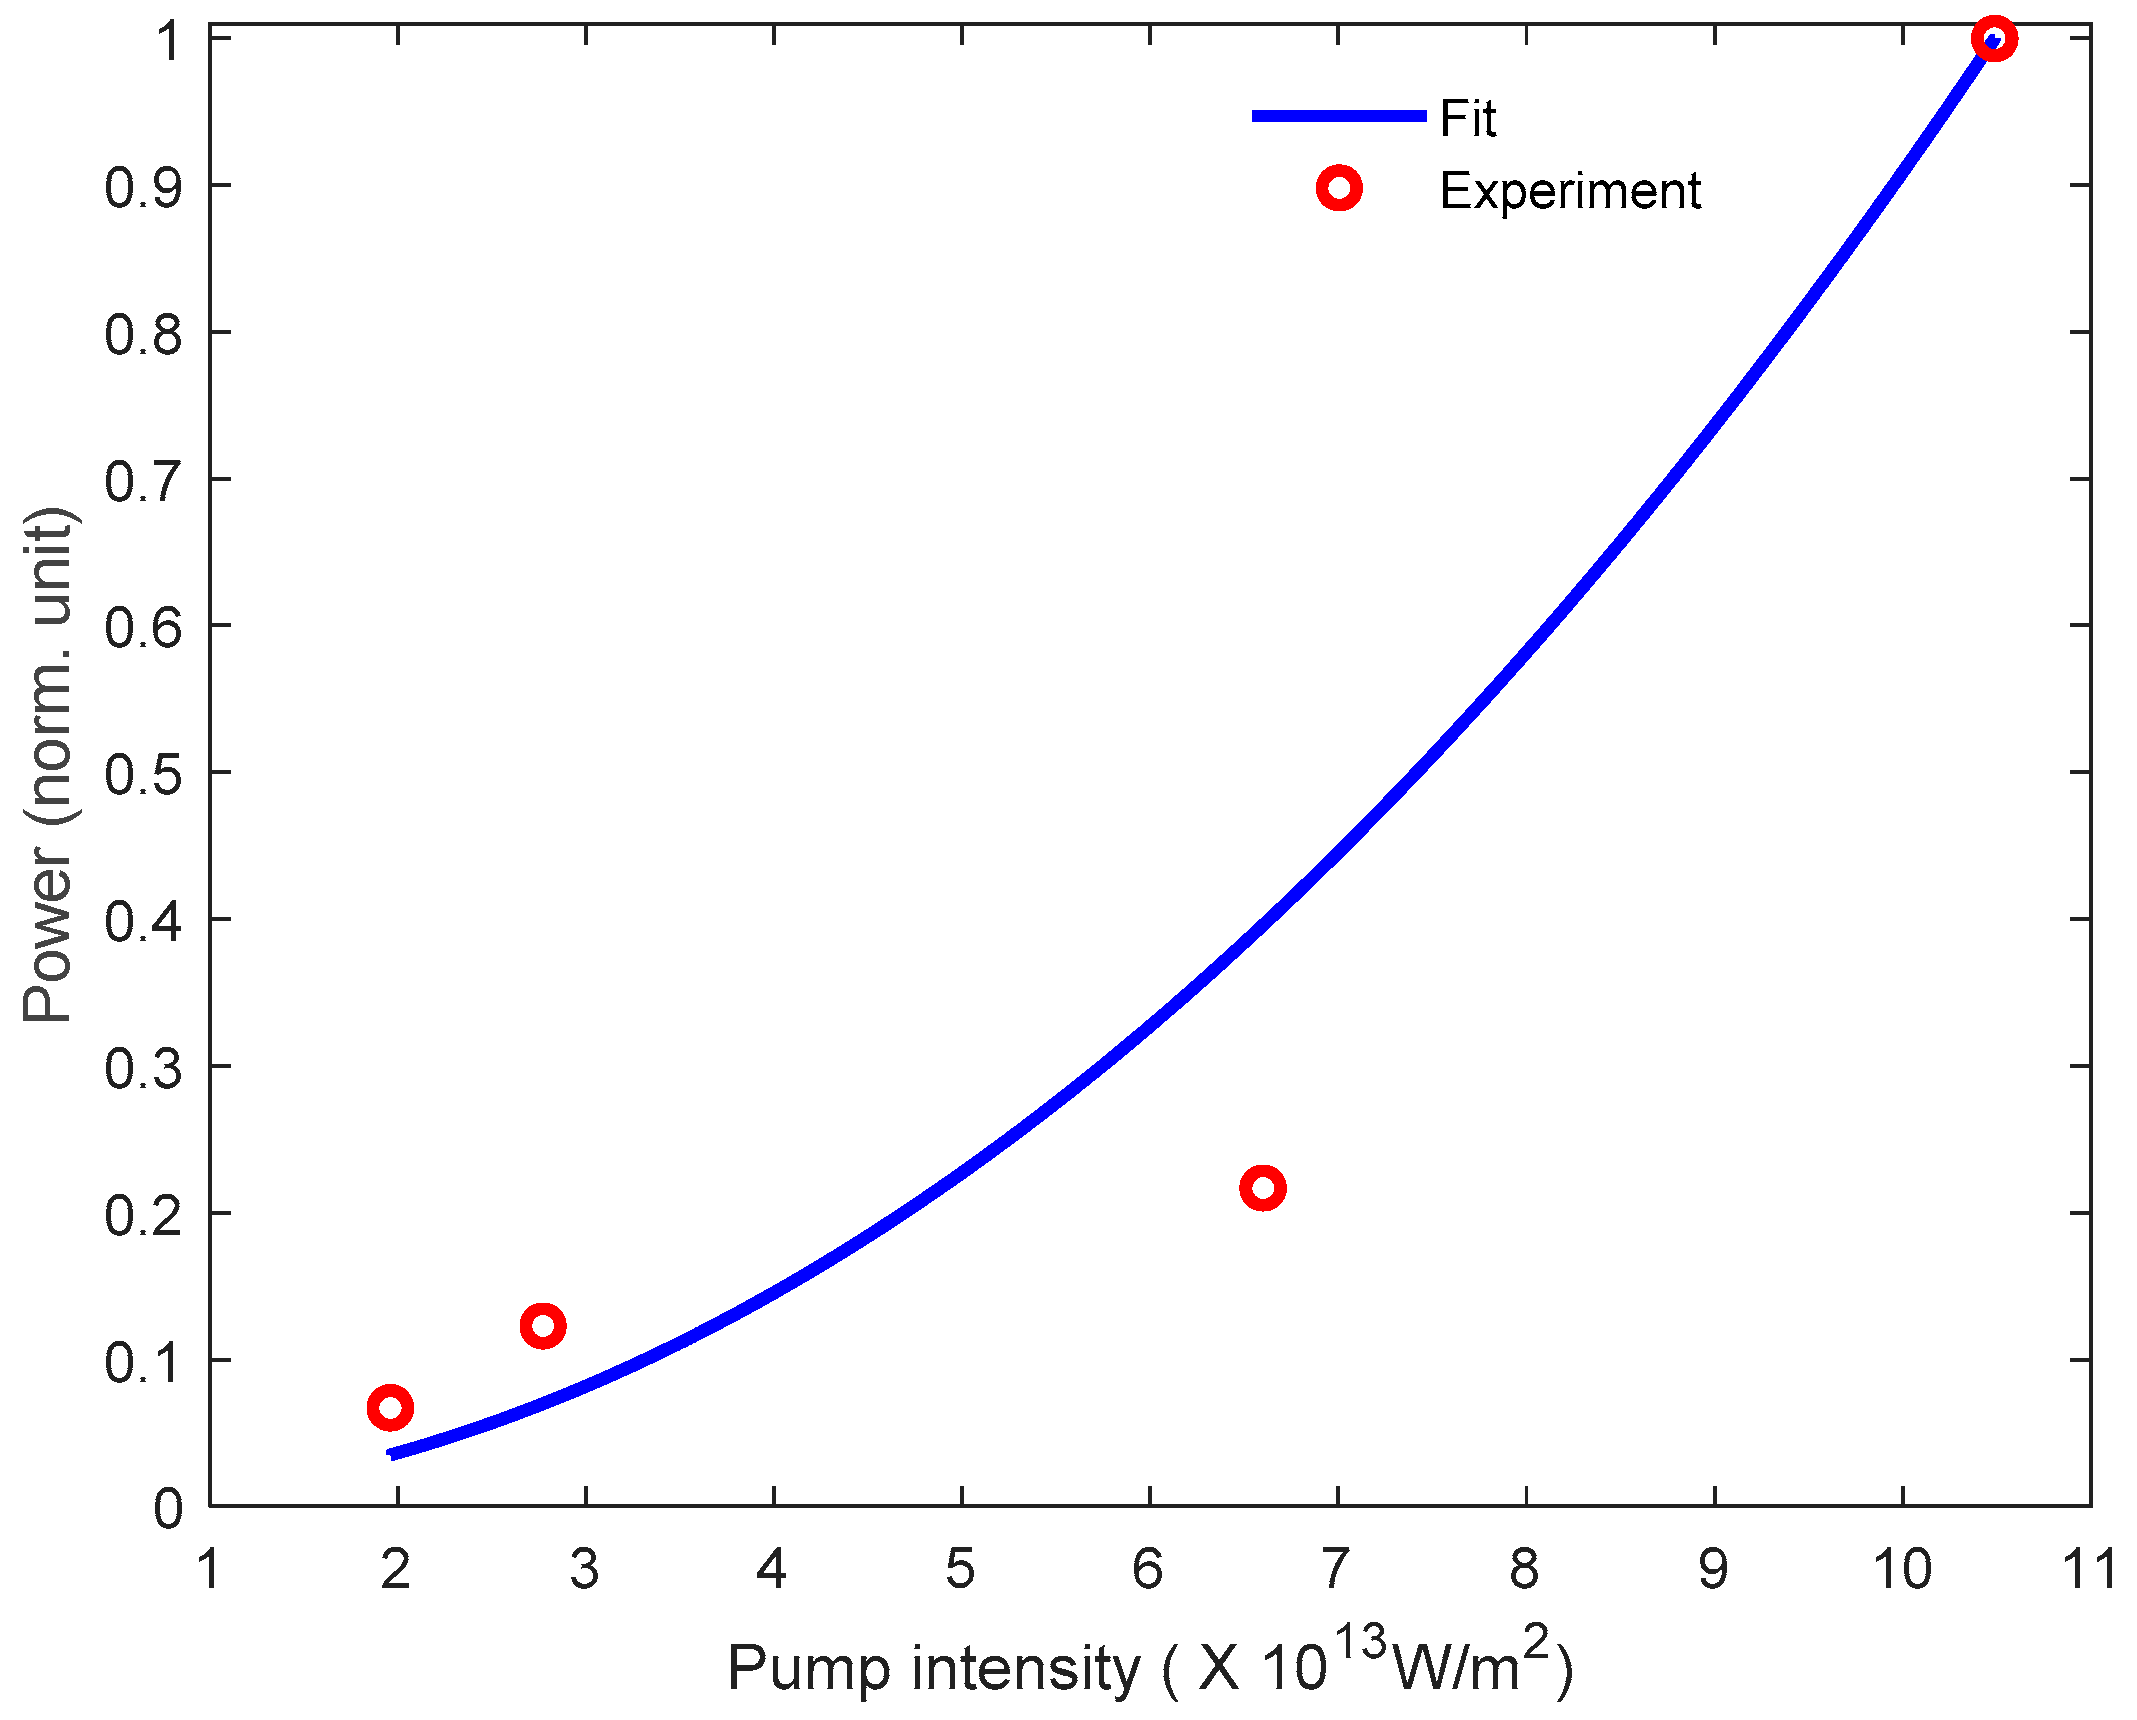
It is most likely that an increase in the intensity of the pump pulse will increase the THz signal strength and heighten the effect of TPA on the chirped probe, which in turn will decrease the amplitude of the measured THz pulse. However, this was contrary to our observation in that the THz signal increased in magnitude (see
Figure 5). As such, there is a reported negligible TPA effect that co-exists with the retrieved signal. Since the effect of TPA is negligible on the chirped probe, the huge number of photons in the pre-chirped pump freely participates in the DFG process, thus facilitating the optical THz conversion efficiency. In this work, the Kerr signal could not be isolated, contrary to the case of other works, where a temporally short pump pulse was used for pumping and in which the Kerr signal was situated around the overlap position between the probe and pump pulse, and lags the generated THz signal, making it possible to identify and isolate the Kerr signal to a certain extent [
15,
17]. We remark that since the presence of THz Kerr-like effect induced by the generated THz signal is less dominant in (110) ZnTe crystal as observed by He et al. [
16], coupled with the fact that our experiment and theory are in good agreement with no significant deviation that warrants the skepticism about the presence of other effects, we believe that such cascaded nonlinear effects and Kerr effect are minimally present. Compared to the experimental data, the simulated THz signal indicates some deviations at the edges, most prominently at the right side edge because the faster oscillations in the THz waveform occur at that region. The corresponding narrow bandwidth THz spectral in
Figure 4c has a peak frequency of around 0.1 THz and a cut-off at 0.2 THz. The high-frequency features in the spectrum correspond to the oscillatory part of the THz time-domain signal. The simulation and experimental data are in close agreement with only minor differences because the chirped probe is not long enough to properly retrieve the edges of the THz signal.
The relationship between the pre-chirped pump intensity and THz power is shown in
Figure 5. The fit (blue line) is a quadratic plot that follows the experimental data (red circles). We note that due to certain technical difficulties that arose in the laser source, only a few data points could be accurately illustrated. As earlier indicated, and in addition to the claim of the presence of the THz signal, this plot provides a conclusive note about excluding nonlinear effects in our set-up.
5. Conclusions
We have investigated the response of ZnTe crystal in the presence of a pre-chirped pump pulse. Our results indicate the feasibility of generating and detecting a few picosecond THz pulses in the same crystal. The THz pulse was characterized via the single-shot EO scheme with an accompanied high resolution. The experimental data conformed well to the predictions of optical rectification theory and the Fabry–Pérot effect with a negligible contribution of nonlinear effects such as TPA, Kerr, and Kerr-like effects. Furthermore, the polarization components of the THz-probe modulated beam were independently recovered, thanks to the simplicity and flexibility of the set-up. Usually, the set-up for THz sources and detection, which is huge and complex, does not facilitate their affordability and mobility for outdoor applications. So, there is often a need for an integrated system combining generation and detection in a miniature device. The quest for such compact THz spectroscopy systems has previously been realized using THz-integrated systems. The results of our findings further support the possibility of realizing photonic THz-integrated systems [
42] with the use of ZnTe crystals.
The measured THz spectrum, which possessed a characteristic narrow bandwidth, finds useful application in condensed matter physics where the lattice vibration modes of certain solids are located within narrow frequencies; as such, broadband THz spectrums are not often suitable for their studies. With the use of narrow THz spectra, the dynamics of the phonon lattice vibration can be effectively investigated and consequently tailored to manipulate the electronic, structural and magnetic properties of the materials. With a tunable narrow-band THz spectrum, the excitation of selective phonon modes has previously been achieved [
29]. Although we have generated a narrow-band THz spectrum at low frequency without focusing on the tunability of their spectrum, their frequencies can be tuned by adjusting the pump chirp rate via the separation distance between the gratings in the laser source. The choice between the selection of the bandwidth and chirp rate of the chirped probe used in this detection scheme was a compromise between the temporal window and the resolution of our measurement.
With the feature of a single-shot detection scheme, short-lived or instantaneous atomic and molecular processes have been captured in the past. In addition, molecular dynamics occurring on a fast time scale, such as laser-induced material damage, chemical reactions, and shock wave-induced structural phase transformations [
31], have been monitored previously. Therefore, we propose that certain modifications in the pump’s path of our set-up can be introduced in order to convert it to a time-resolved spectroscopy set-up.


