An Experimental Study Measuring the Image Field Angle of an Electron Beam Using a Streak Tube


Abstract
:1. Introduction
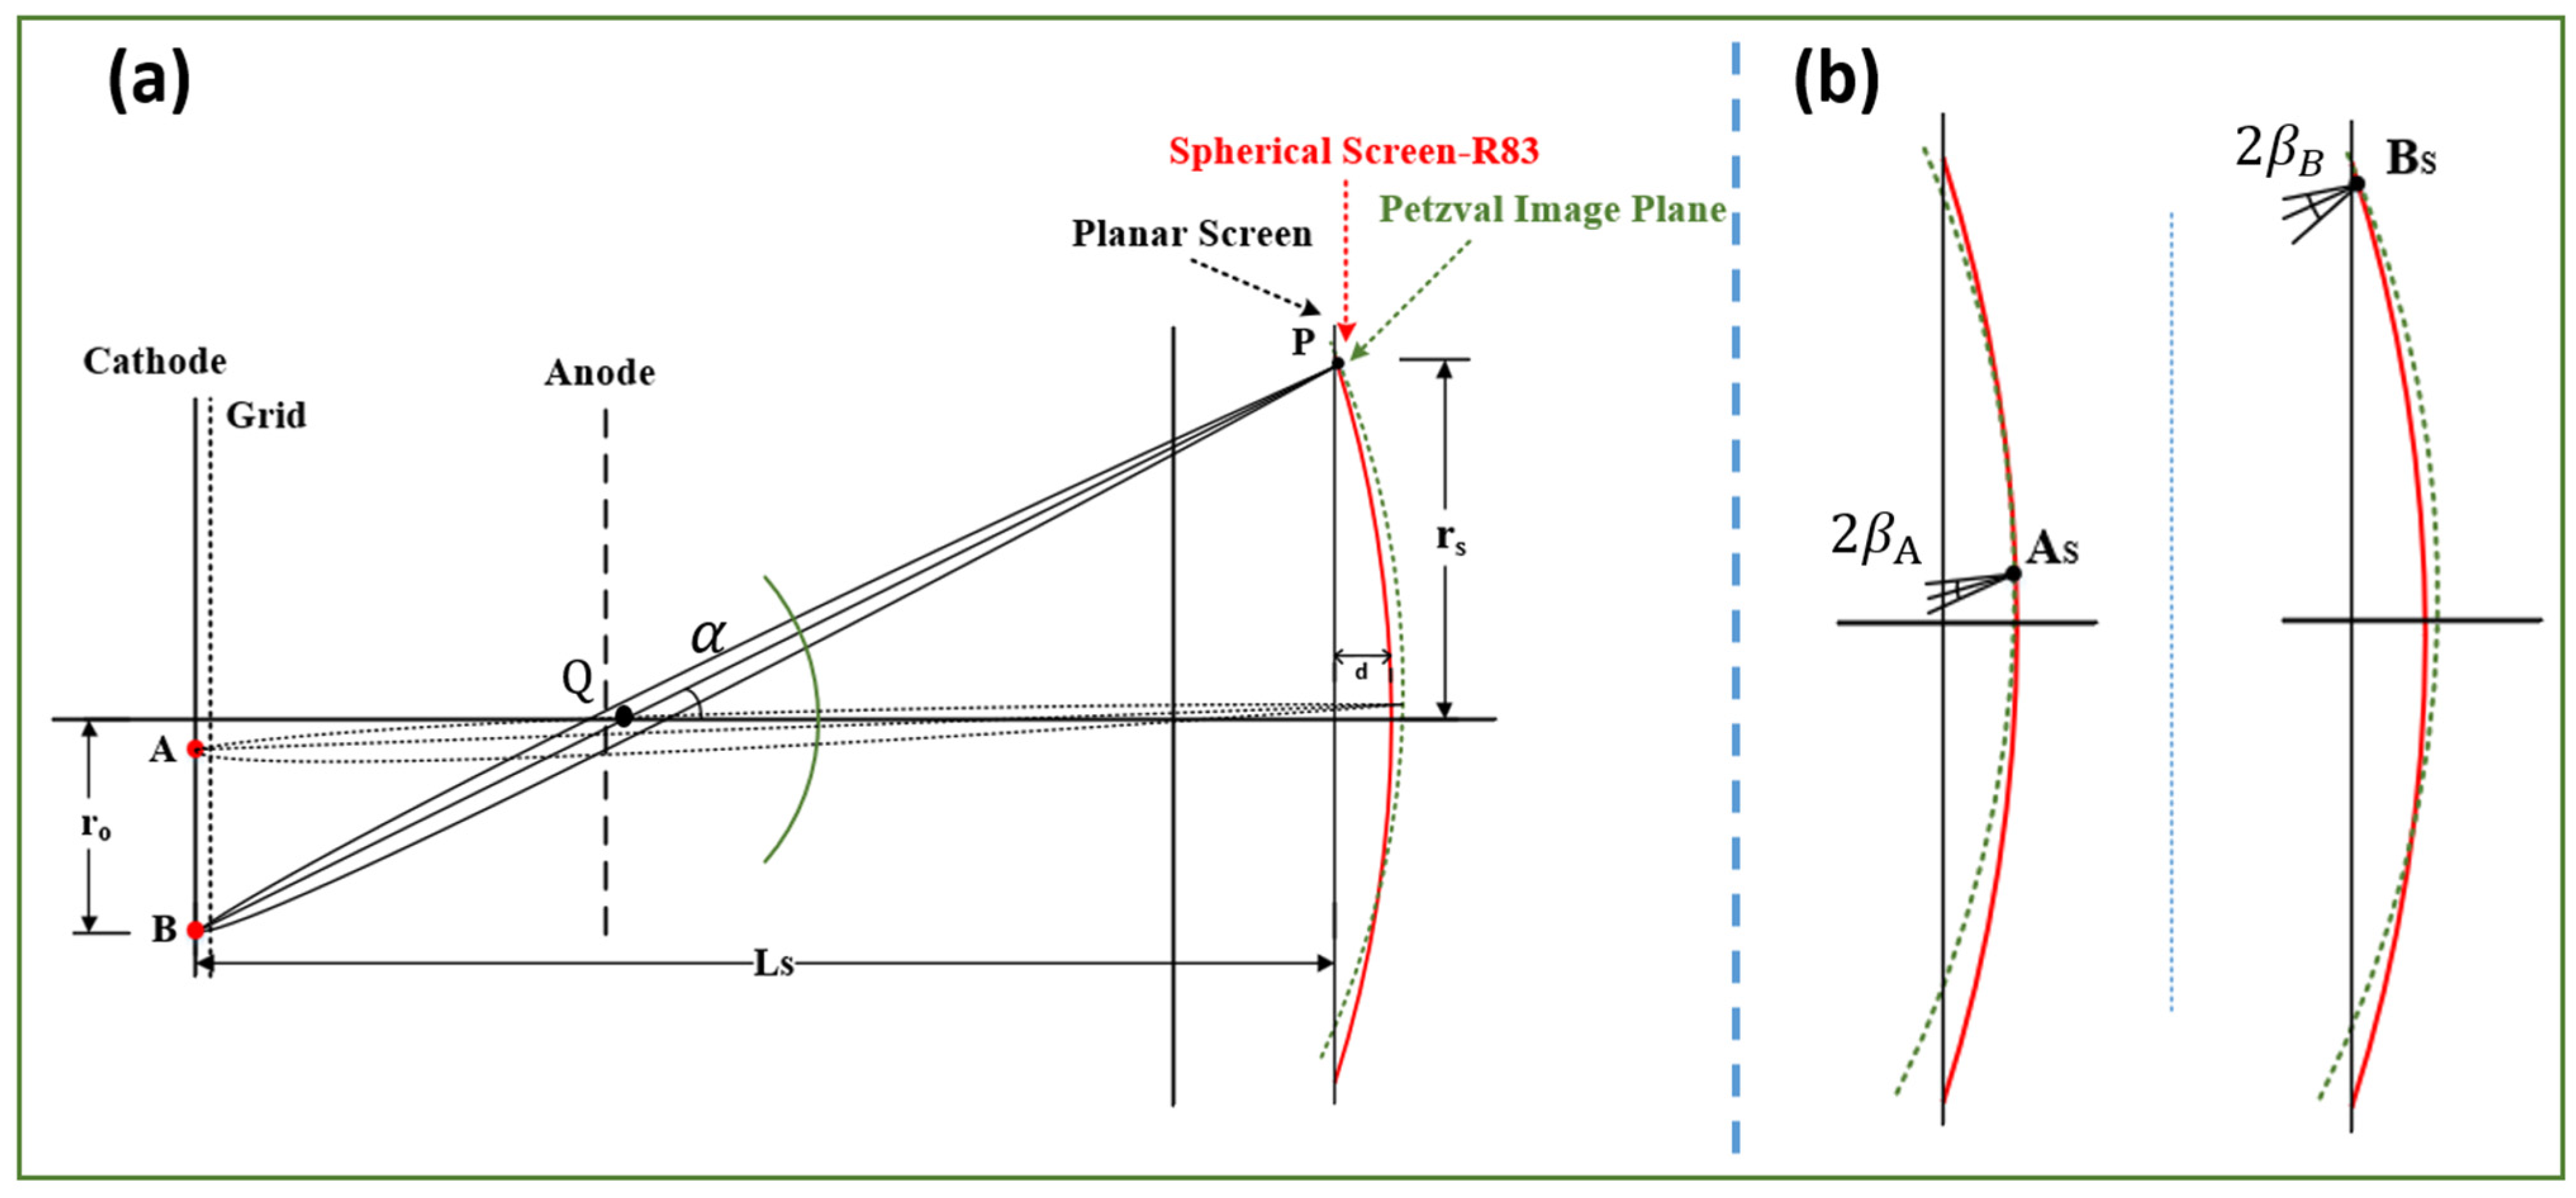
2. Test Principle
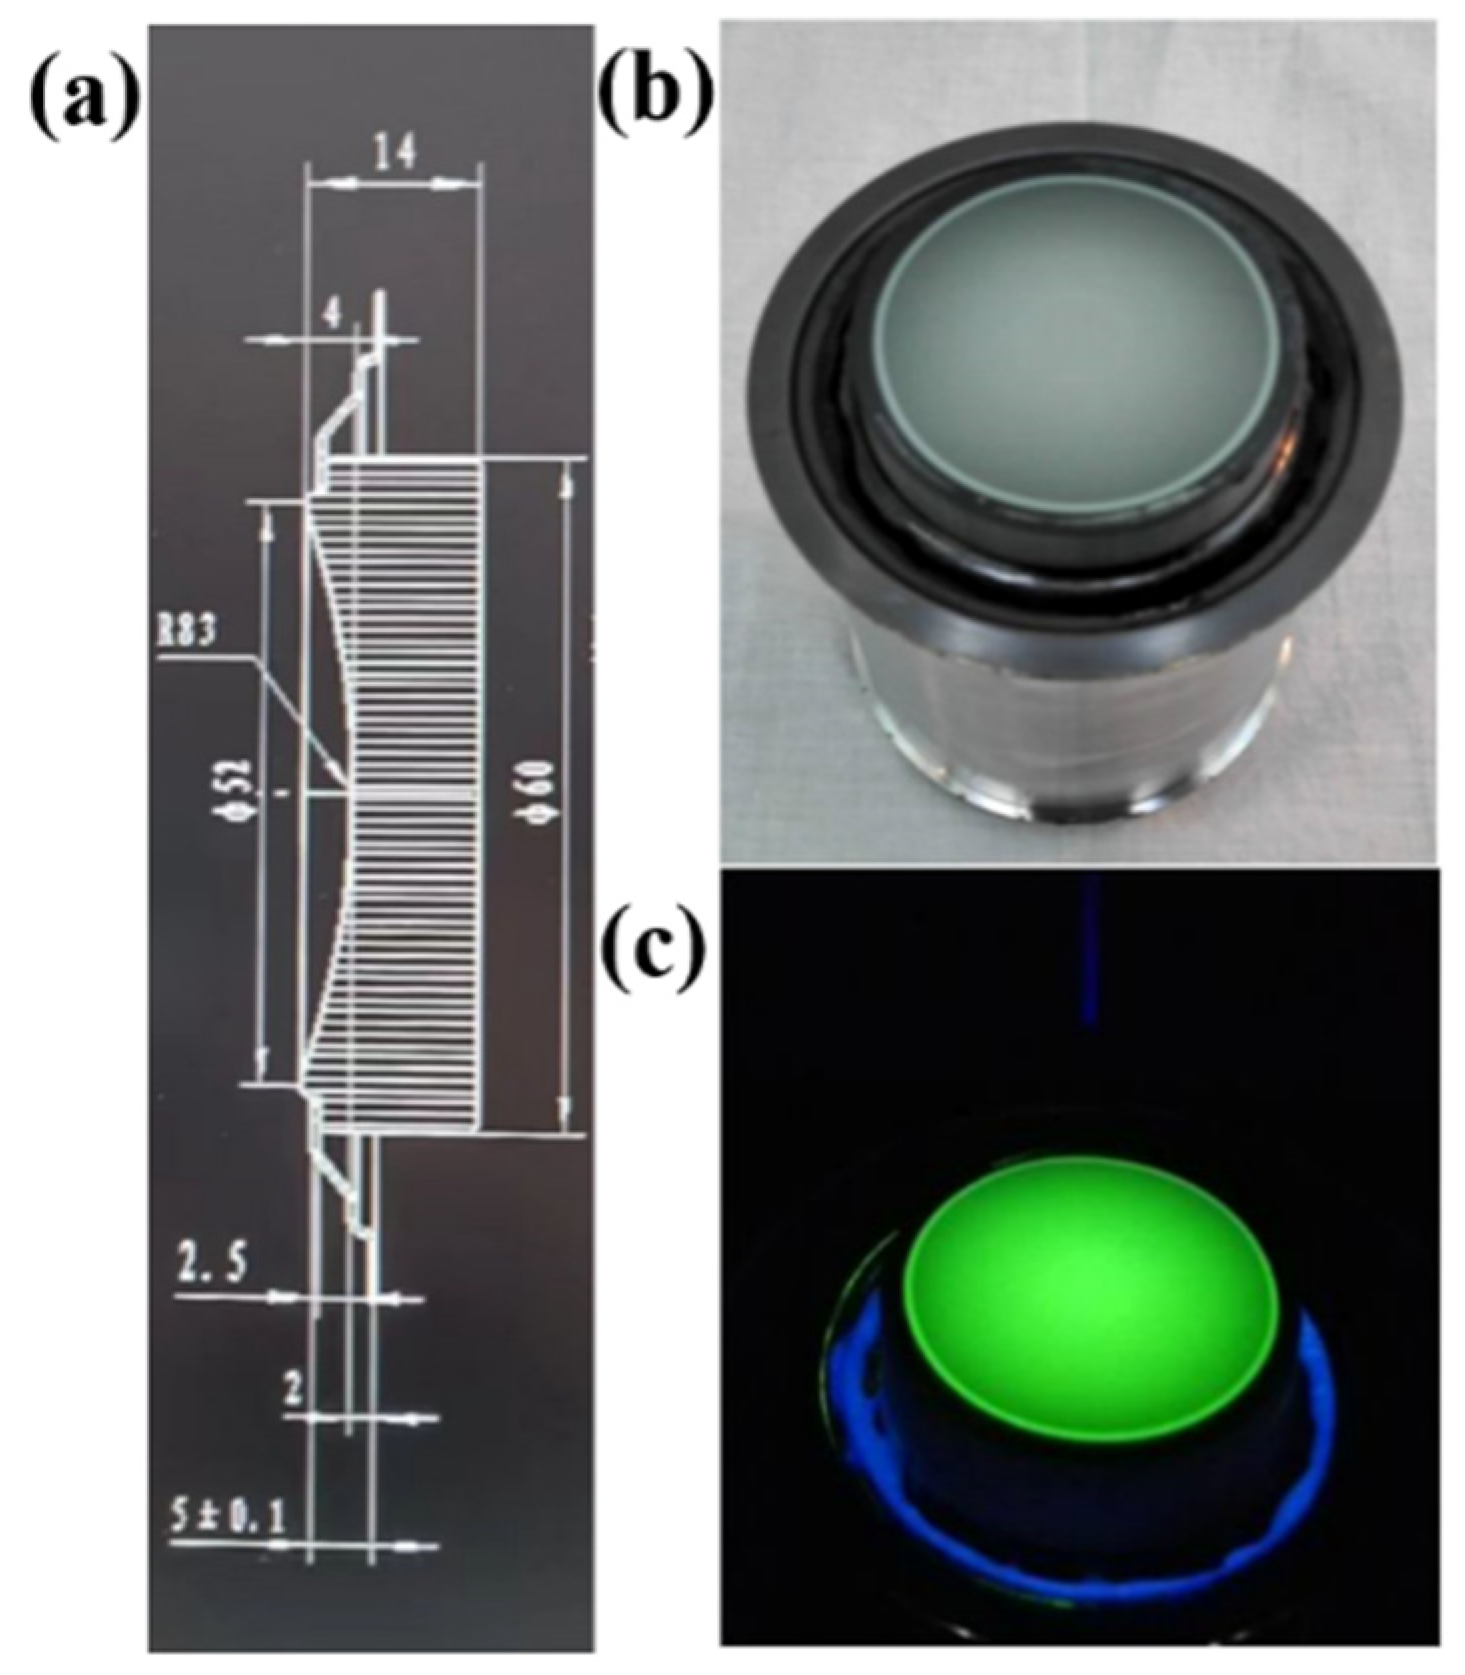
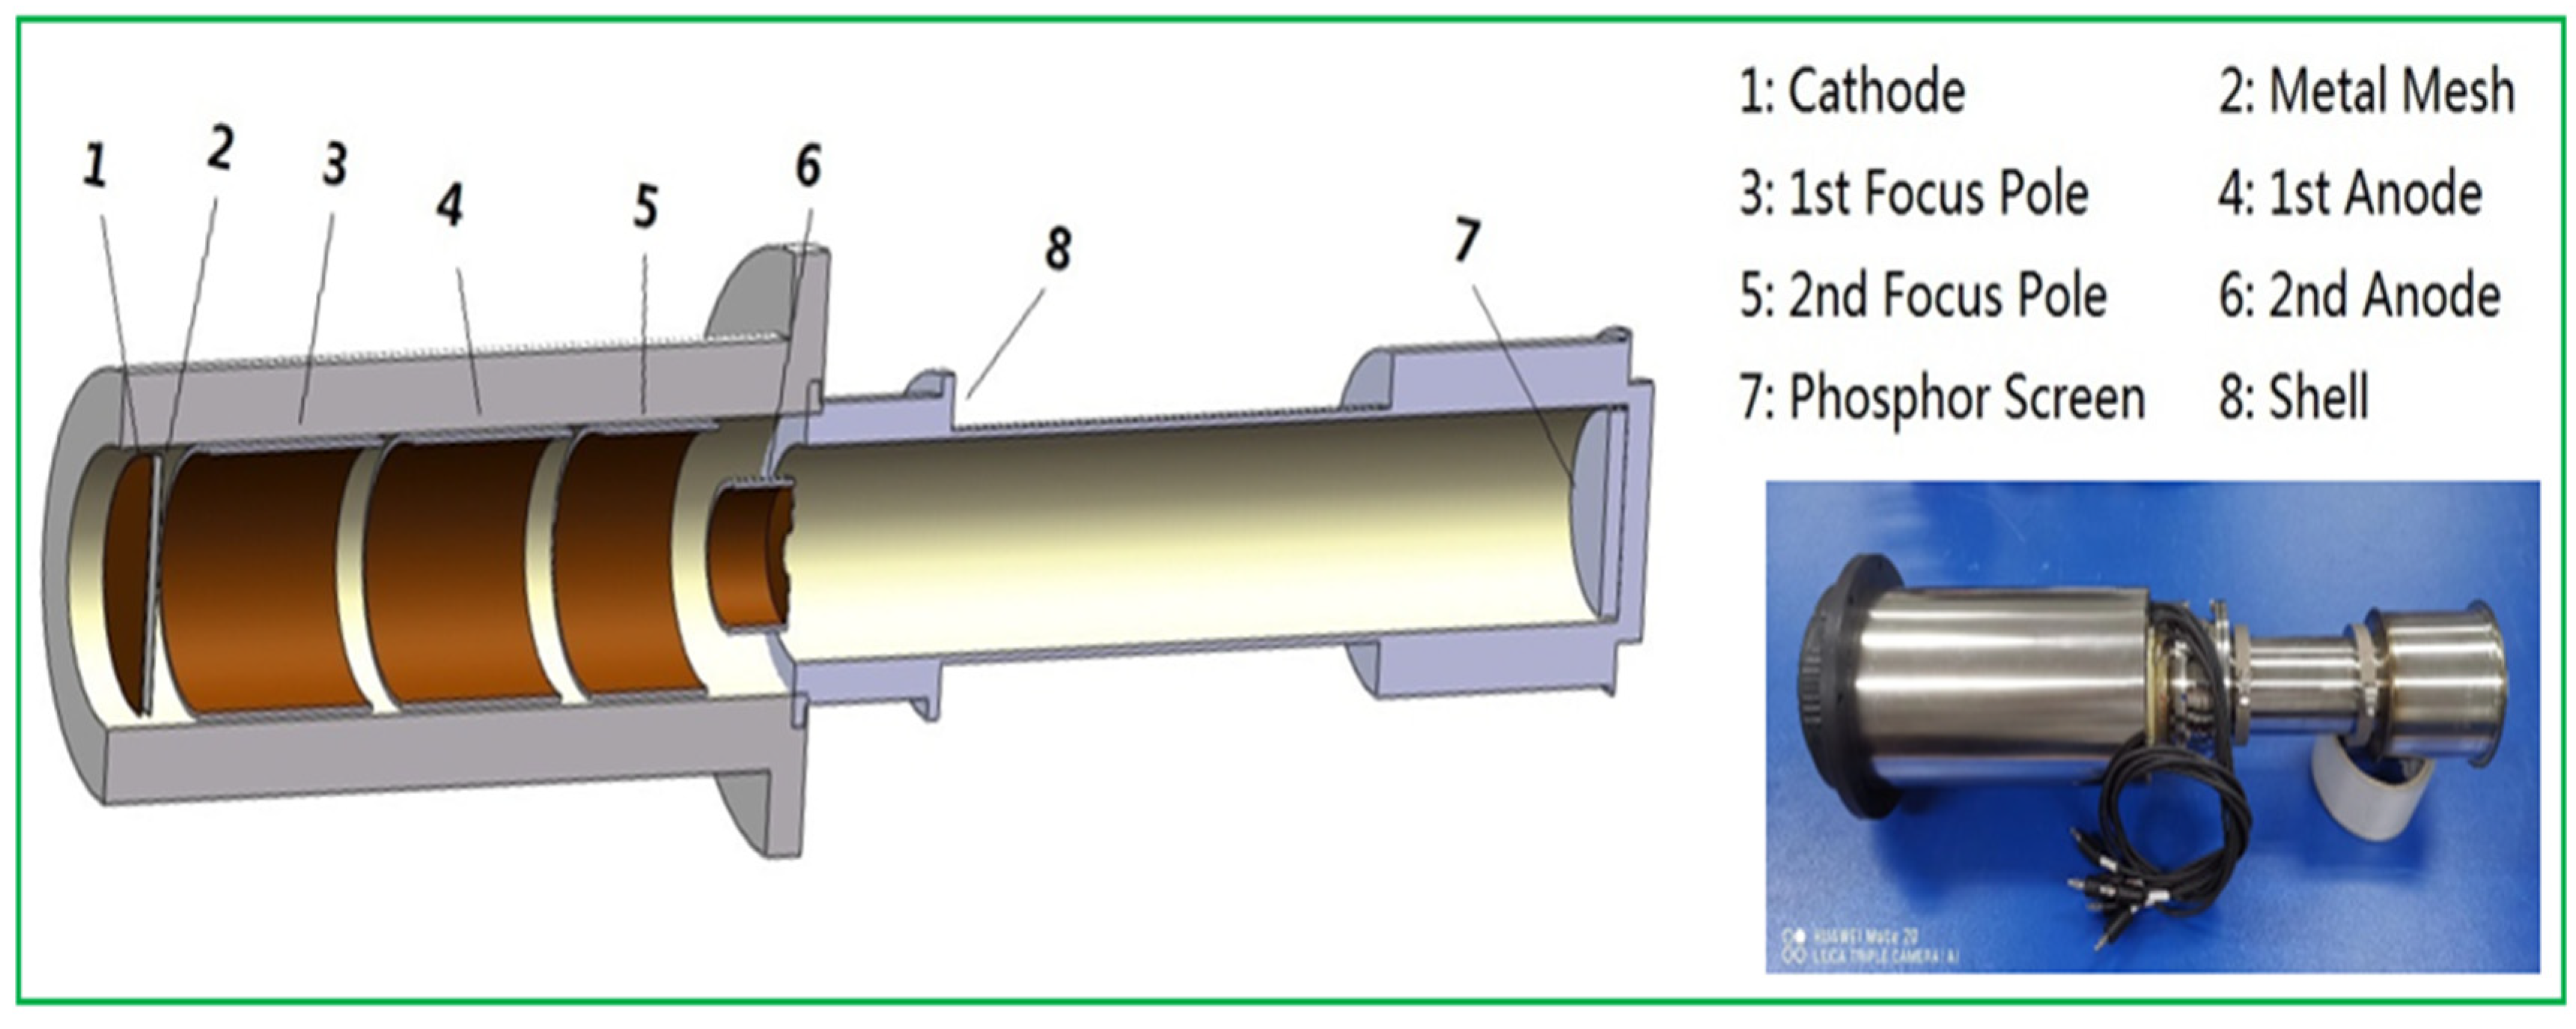
3. Experimental Equipment
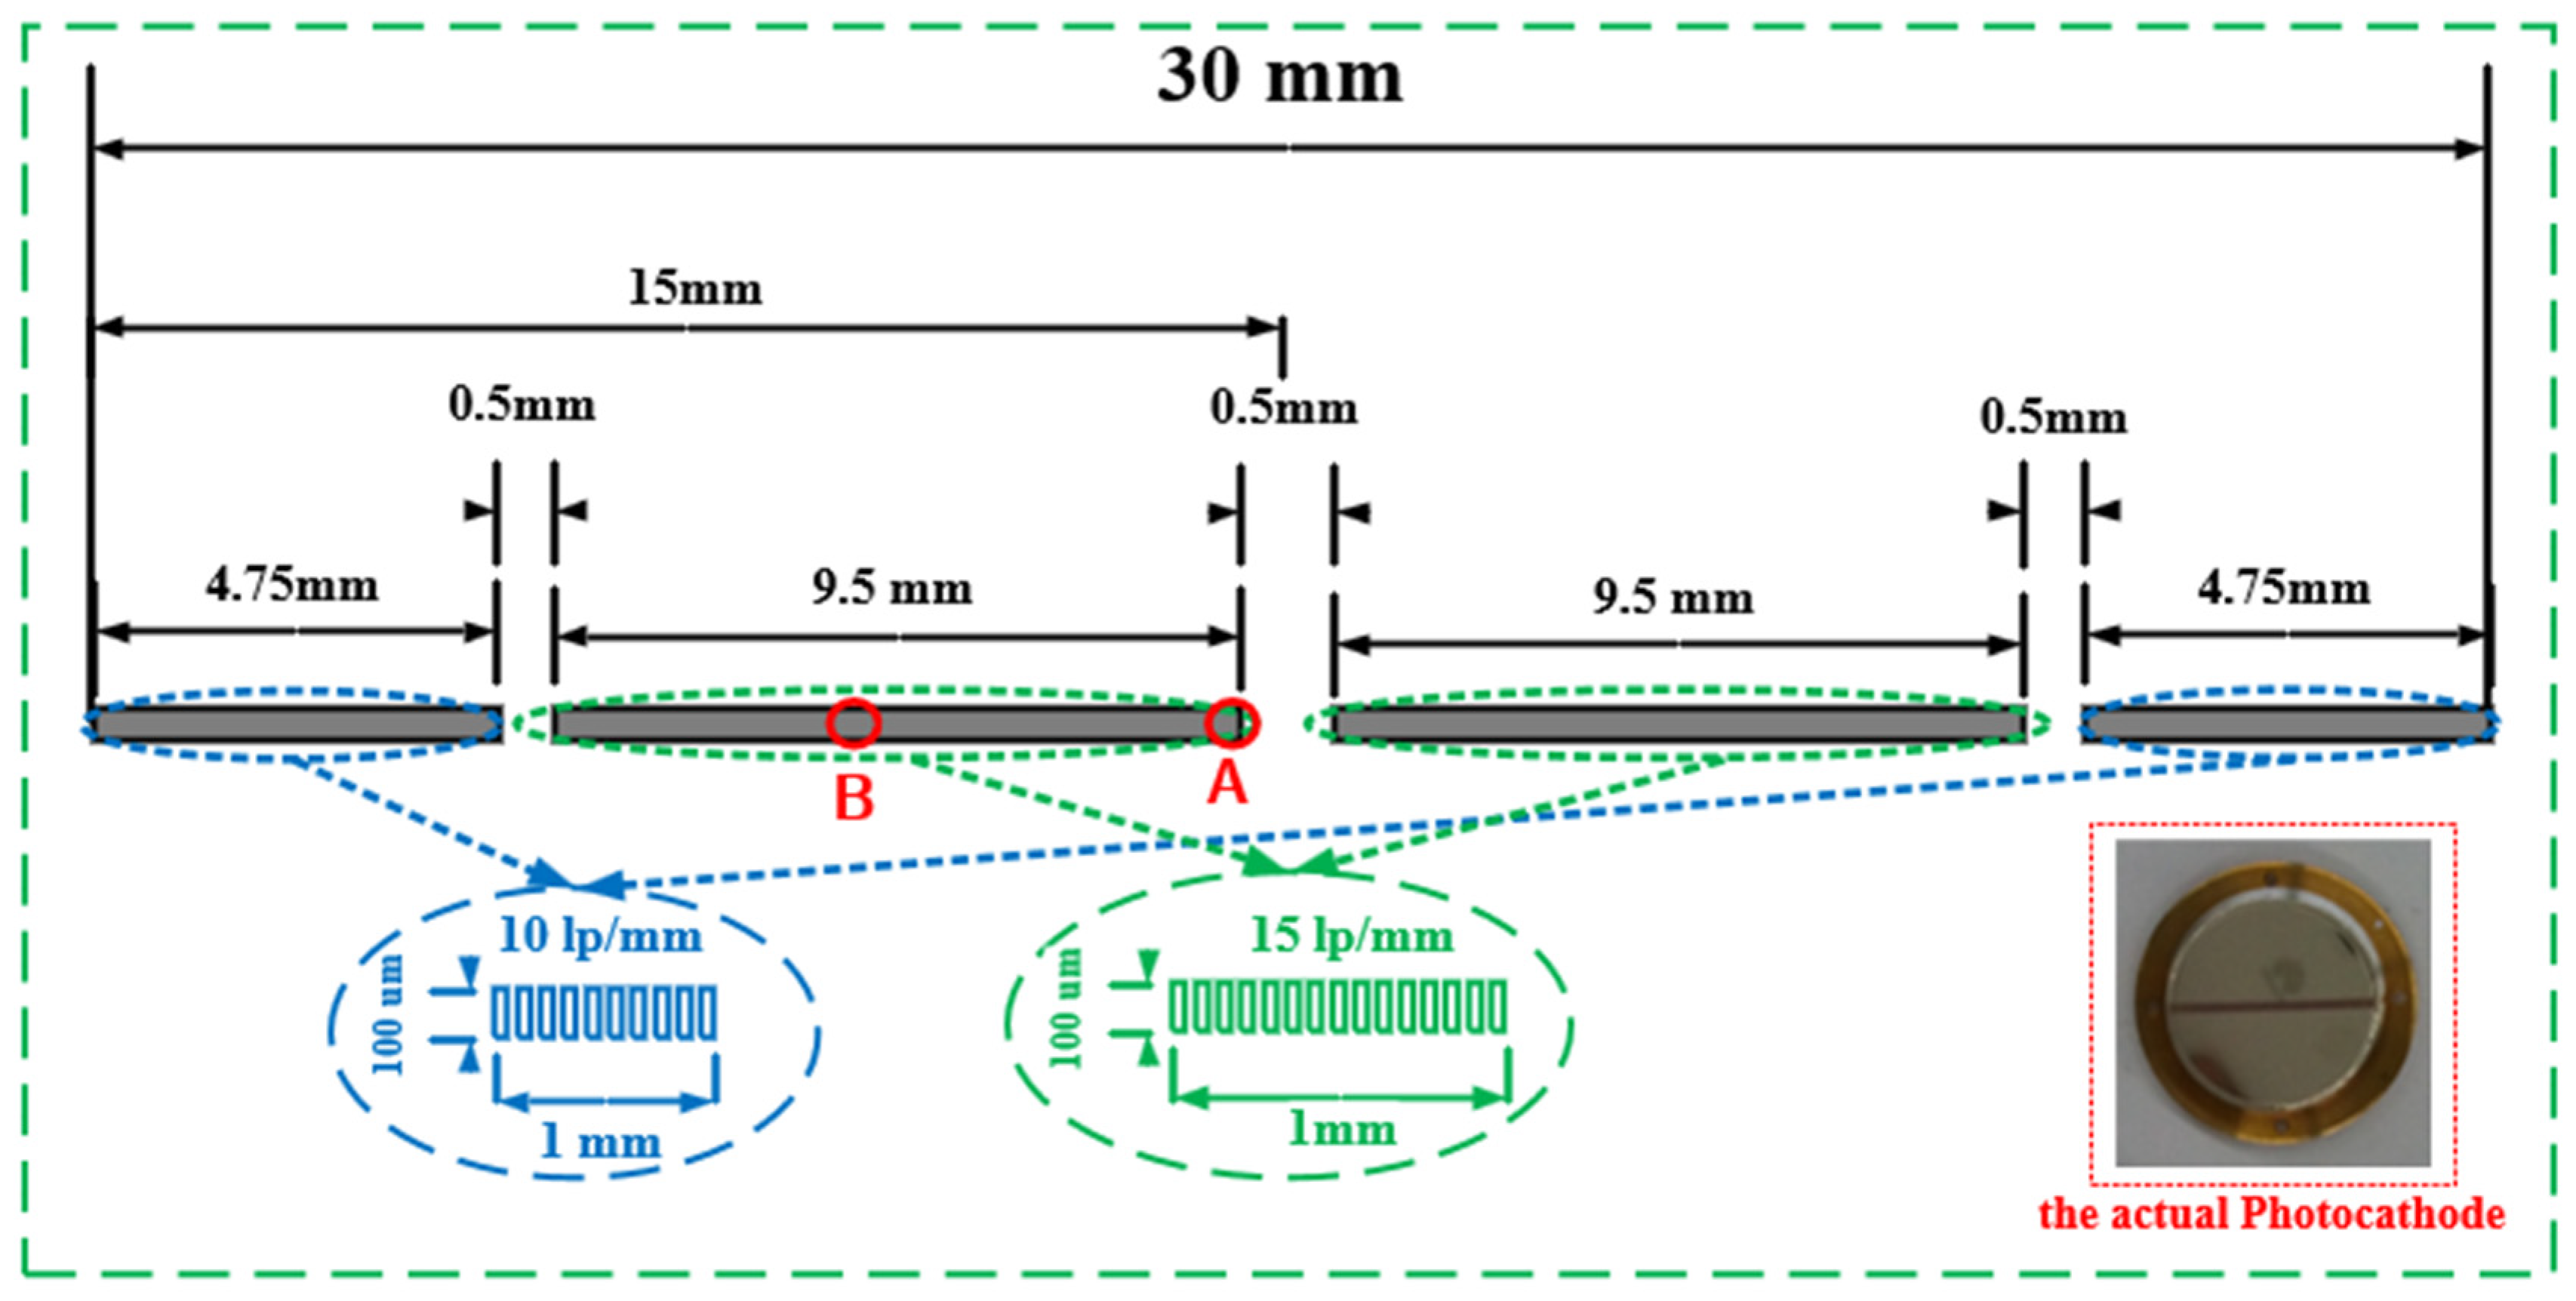
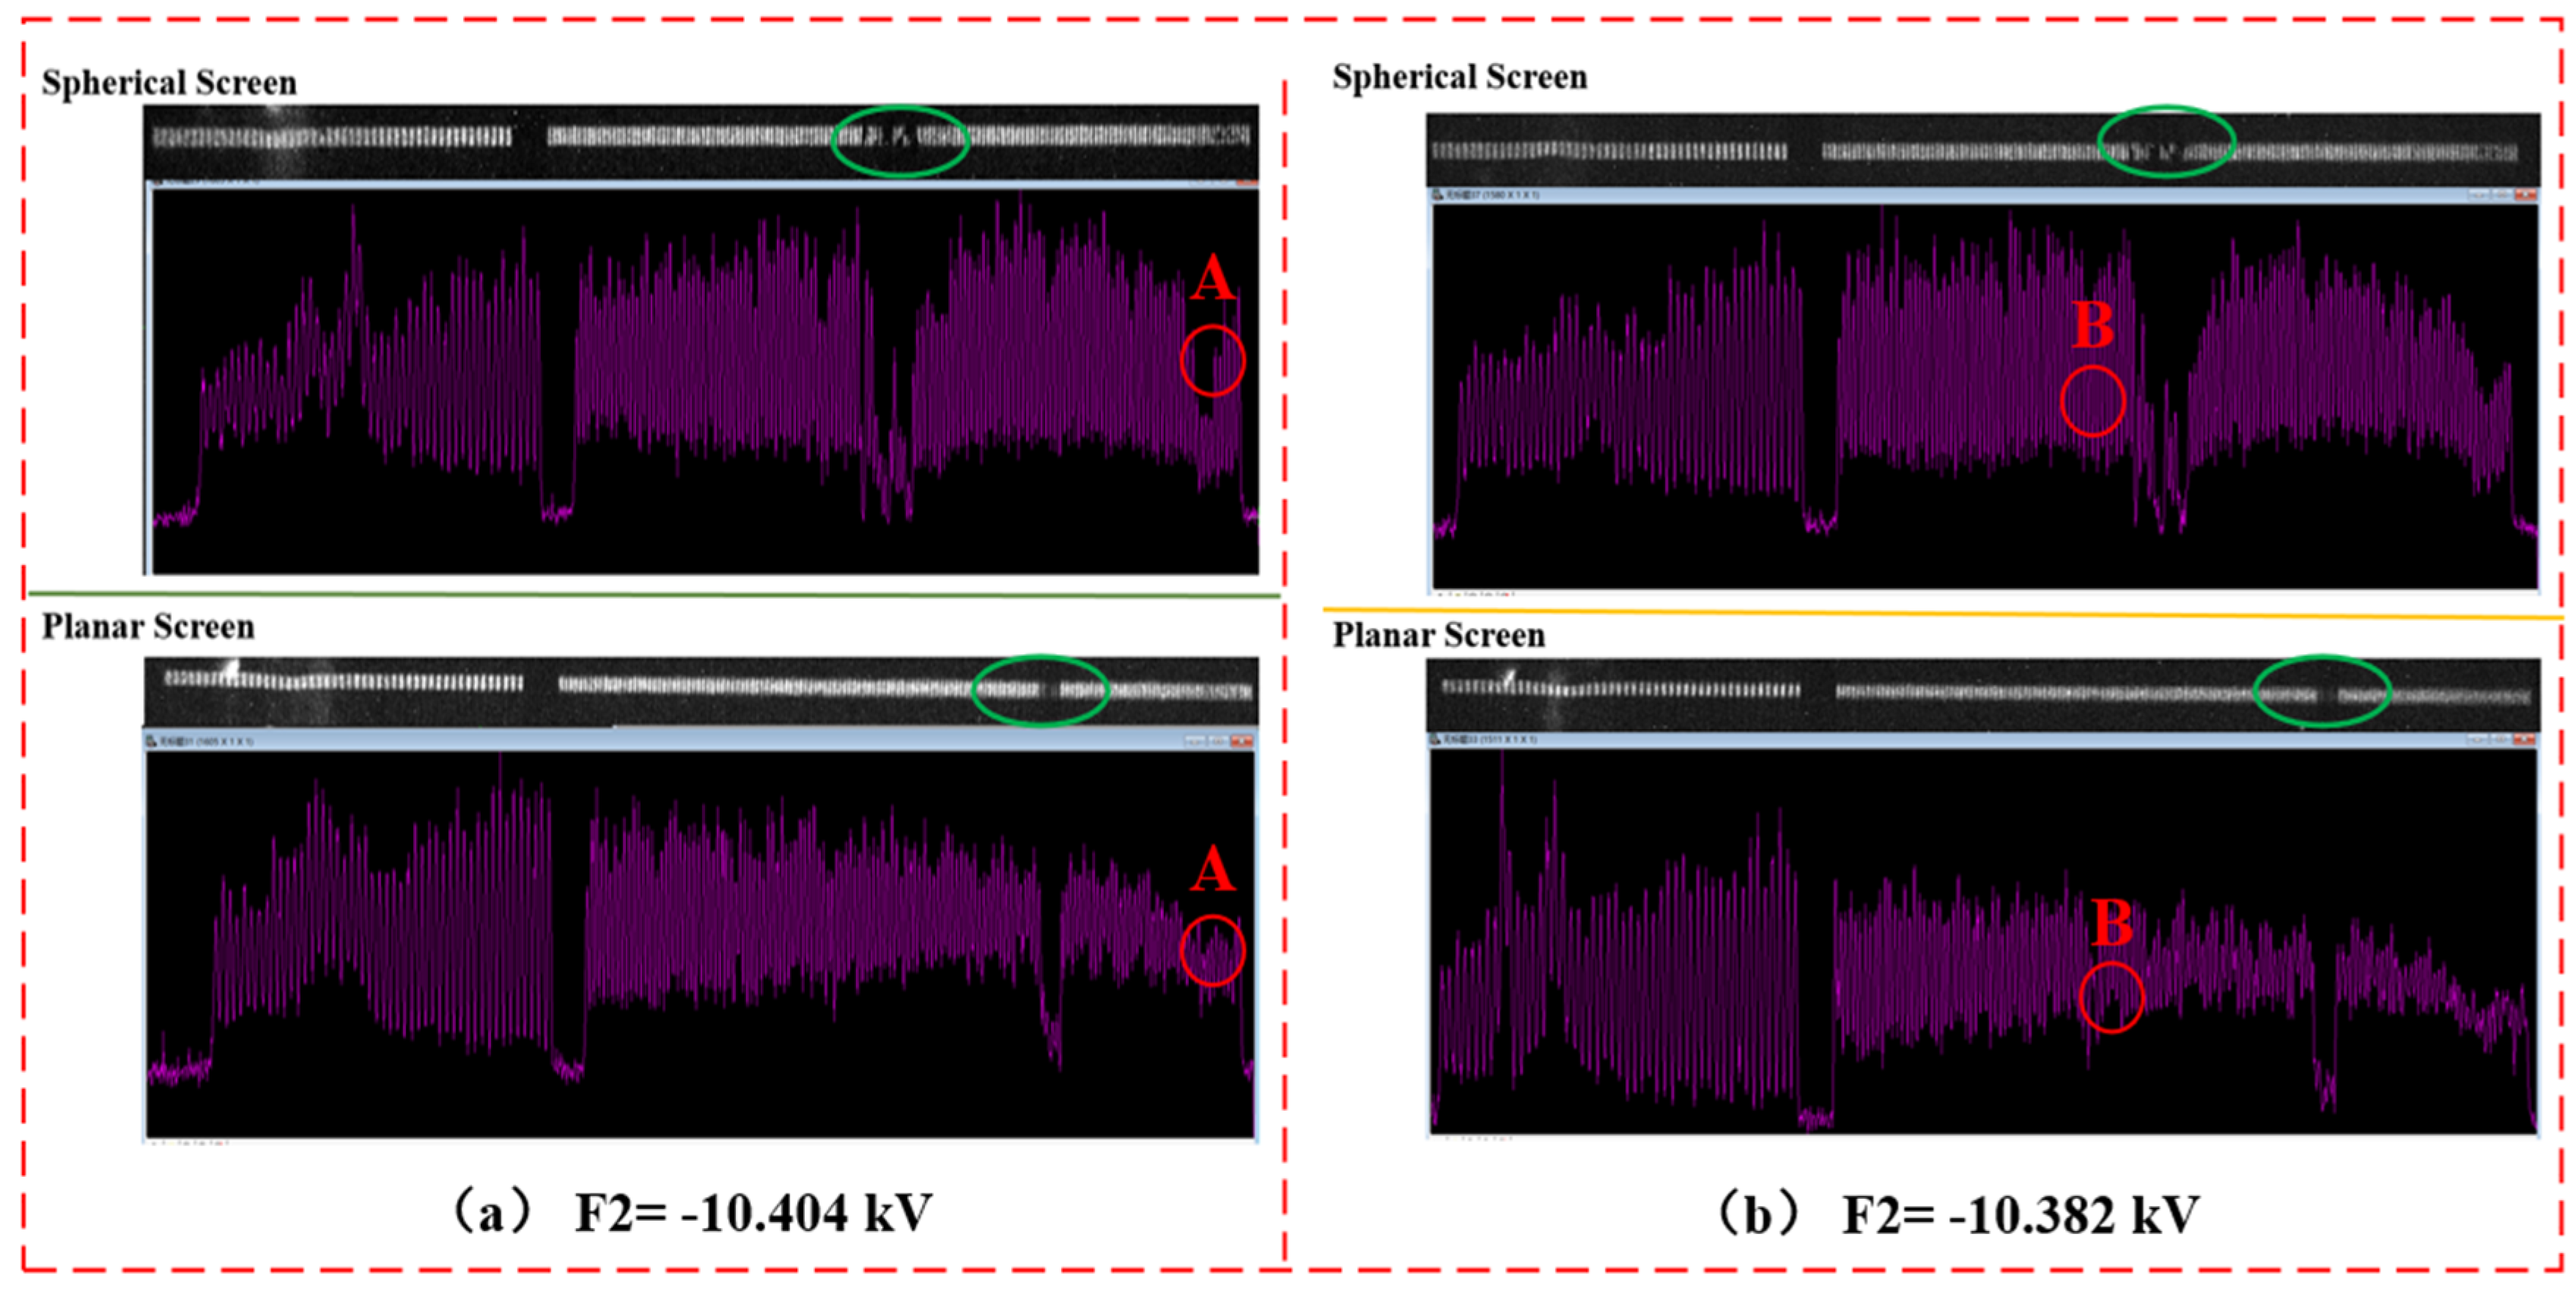
4. Experimental Test and Analysis
5. Conclusions
Author Contributions
Funding
Institutional Review Board Statement
Informed Consent Statement
Data Availability Statement
Conflicts of Interest
References
- Betti, R.; Hurricane, O.A. Inertial-confinement fusion with lasers. Nat. Phys. 2016, 12, 435–449. [Google Scholar] [CrossRef]
- Callahan, D.A.; Hurricane, O.A.; Hinke, D.E.; Ma, T.; Park, H.-S.; Garcia, M.A.B.; Hopkins, L.F.B.; Casey, D.T.; Cerjan, C.J.; Dewald, E.L.; et al. Higher velocity, high-foot implosions on the National Ignition Facility laser. Phys. Plasmas 2015, 22, 056314. [Google Scholar] [CrossRef] [Green Version]
- Hurricane, O.A.; Callahan, D.A.; Casey, D.T.; Celliers, P.M.; Cerjan, C.; Dewald, E.L.; Dittrich, T.R.; Döppner, T.; Hinkel, D.E.; Hopkins, L.F.B.; et al. Fuel gain exceeding unity in an inertially confined fusion implosion. Nature 2014, 506, 343–348. [Google Scholar] [CrossRef]
- Danly, C.; Christensen, K.; Fatherley, V.; Fittinghoff, D.N.; Grim, G.P.; Hibbard, R.; Izumi, N.; Jedlovec, D.; Merrill, F.E.; Schmidt, D.W.; et al. Combined neutron and x-ray imaging at the National Ignition Facility (invited). Rev. Sci. Instrum. 2016, 87, 11D703. [Google Scholar] [CrossRef]
- Bachmann, B.; Hilsabeck, T.; Field, J.; Masters, N.; Reed, C.; Pardini, T.; Rygg, J.R.; Alexander, N.; Benedetti, L.R.; Döppner, T.; et al. Resolving hot spot microstructure using x-ray penumbral imaging (invited). Rev. Sci. Instrum. 2016, 87, 11E201. [Google Scholar] [CrossRef]
- Pickworth, L.A.; Ayers, J.; Bell, P.; Brejnholt, N.F.; Buscho, J.G.; Bradley, D.; Decker, T.; Hau-Riege, S.; Kilkenny, J.; McCarville, T.; et al. The National Ignition Facility modular Kirkpatrick-Baez microscope. Rev. Sci. Instrum. 2016, 87, 11E316. [Google Scholar] [CrossRef]
- Hu, S.X.; Michel, D.T.; Davis, A.K.; Betti, R.; Radha, P.B.; Campbell, E.M.; Froula, D.H.; Stoeckl, C. Understanding the effects of laser imprint on plastic-target implosions on OMEGA. Phys. Plasmas 2016, 23, 102701. [Google Scholar]
- Igumenshchev, I.V.; Goncharov, V.N.; Marshall, F.J.; Knauer, J.P.; Campbell, E.M.; Forrest, C.J.; Froula, D.H.; Glebov, V.Y.; McCrory, R.L.; Regan, S.P.; et al. Three-dimensional modeling of direct-drive cryogenic implosions on OMEGA. Phys. Plasmas 2016, 23, 052702. [Google Scholar] [CrossRef]
- Spears, B.K.; Munro, D.H.; Sepke, S.; Caggiano, J.; Clark, D.; Hatarik, R.; Kritcher, A.; Sayre, D.; Yeamans, C.; Knauer, J.; et al. Three-dimensional simulations of National Ignition Facility implosions: Insight into experimental observables. Phys. Plasmas 2015, 22, 056317. [Google Scholar] [CrossRef]
- Rosch, R.; Trosseille, C.; Caillaud, T.; Allouche, V.; Bourgade, J.L.; Briat, M.; Brunel, P.; Burillo, M.; Casner, A.; Depierreux, S.; et al. First set of gated X-ray imaging diagnostics for the Laser Megajoule facility. Rev. Sci. Instrum. 2016, 87, 33706. [Google Scholar] [CrossRef]
- Bose, A.; Woo, K.M.; Betti, R.; Campbell, E.M.; Mangino, D.; Christopherson, A.R.; McCrory, R.L.; Nora, R.; Regan, S.P.; Goncharov, V.N.; et al. Core conditions for alpha heating attained in direct-drive inertial confinement fusion. Phys. Rev. E 2016, 94, 011201. [Google Scholar] [CrossRef] [Green Version]
- Hilsabeck, T.J.; Frenje, J.A.; Hares, J.D.; Wink, C.W. A stretch/compress scheme for a high temporal resolution detector for the magnetic recoil spectrometer time (MRSt). Rev. Sci. Instrum. 2016, 87, 11D807. [Google Scholar] [CrossRef] [Green Version]
- Yi, S.-Z.; Si, H.-X.; Huang, Q.-S.; Zhang, Z.; Jiang, L.; Qi, R.-Z.; Zhang, Z.; Wang, Z.-S. Research progress of multi-channel Kirkpatrick–Baez microscope for X-ray diagnostics in laser inertial confinement fusion. Acta Opt. Sin. 2022, 42, 1134007. [Google Scholar]
- Bradley, D.K.; Bell, P.M.; Dymoke-Bradshaw, A.K.L.; Hares, J.D.; Bahr, R.E.; Smalyuk, V.A.; Hargrove, D.R.; Piston, K. Development and characterization of a single-line-of-sight framing camera. Rev. Sci. Instrum. 2001, 72, 694–697. [Google Scholar] [CrossRef]
- Holder, J.P.; Piston, K.W.; Bradley, D.K.; Bell, P.M.; Dymoke-Bradshaw, A.K.L.; Hares, J.D. Further development of a single line of sight x-ray framing camera. Rev. Sci. Instrum. 2003, 74, 2191–2193. [Google Scholar] [CrossRef]
- Bradley, D.K.; Holder, J.P.; Damian, C.M.; Piston, K.W.; Bell, P.M.; Dymoke-Bradshaw, A.K.L.; Hares, J.D. Progress on the development of a single line of sight X-ray framing camera. Rev. Sci. Instrum. 2004, 75, 4054–4056. [Google Scholar] [CrossRef] [Green Version]
- Fu, W.; Cai, H.; Wang, D.; Lei, Y.; Liu, J. Time resolved x-ray image of laser plasma interactions using a dilation framing camera. Optik 2019, 186, 374–378. [Google Scholar] [CrossRef]
- Cai, H.-Z.; Fu, W.-Y.; Wang, D.; Lei, Y.-F.; Gu, L.; Liu, J.-Y. Large-format pulse-dilation framing tube with 5 1p/mm spatial resolution. Optik 2019, 185, 441–446. [Google Scholar] [CrossRef]
- Liu, J.; Fu, W.; Deng, P.; Wang, D.; Lei, Y.; Huang, J.; Wang, Y.; Cai, H. Simulation of a pulse-dilation framing tube with sensitive diameter of 60 mm using large aperture short magnetic lens. Optik 2019, 203, 163974. [Google Scholar] [CrossRef]
- Cai, H.; Fu, W.; Wang, D.; Lei, Y.; Liu, J. Three-strip microchannel plate gated x-ray framing camera. Sens. Actuators A Phys. 2018, 285, 355–361. [Google Scholar] [CrossRef]
- Zhang, J.-J.; Lei, B.-G.; Yang, Q.-L. Improvement of imaging performance for X-ray streak tube. J. Shenzhen Univ. Sci. Eng. 2017, 34, 14–19. [Google Scholar] [CrossRef]
- Zhang, J.-J.; Liu, A.-L.; Guo, B.-P.; Yang, Q.-L.; Zong, F.-K. Influence of geomagnetic field on the imaging performance of a streak tube. Nucl. Inst. Methods Phys. Res. A 2020, 950, 162808. [Google Scholar]
- Csorba, I.P. Modulation transfer function of image tube lenses. Appl. Opt. 1977, 16, 2647–2650. [Google Scholar] [CrossRef]
- Available online: http://www.opts.cn/ (accessed on 1 March 2023).
- Available online: http://www.newwaymask.com/ (accessed on 1 March 2023).


| Tube Length (mm) | Diameter (mm) | Magnification | Total Voltage (kV) | Length of Photocathode (mm) | Length of Focus Scope (mm) |
|---|---|---|---|---|---|
| 430 | 60 | −1.34 | 12 | 30 | 205 |
| Scheme | Cathode (kV) | Metal Mesh (kV) | 1st Focus Pole (kV) | 1st Anode Pole (kV) | 2nd Focus Pole (kV) | 2nd Anode Pole (kV) | Phosphor Screen (kV) | Shell (kV) |
|---|---|---|---|---|---|---|---|---|
| A | −12 | −10.5 | −6 | −1.482 | −10.404 | 0 | ||
| B | −10.382 | |||||||
| Scheme | Object Height (mm) | M | D (mm) | (mm) | ||||
|---|---|---|---|---|---|---|---|---|
| A | 49.2 | 28.9 | 20.3 | 0.25 | 1.34 | 0.00068 | 8 | 0.0025 |
| B | 48.7 | 30.1 | 14.8 | 5 | 0.275 | 7.456 | 0.00249 |
Disclaimer/Publisher’s Note: The statements, opinions and data contained in all publications are solely those of the individual author(s) and contributor(s) and not of MDPI and/or the editor(s). MDPI and/or the editor(s) disclaim responsibility for any injury to people or property resulting from any ideas, methods, instructions or products referred to in the content. |
© 2023 by the authors. Licensee MDPI, Basel, Switzerland. This article is an open access article distributed under the terms and conditions of the Creative Commons Attribution (CC BY) license (https://creativecommons.org/licenses/by/4.0/).
Share and Cite
Cai, H.; Deng, X.; Niu, L.; Yang, Q.; Zhang, J. An Experimental Study Measuring the Image Field Angle of an Electron Beam Using a Streak Tube. Photonics 2023, 10, 267. https://doi.org/10.3390/photonics10030267
Cai H, Deng X, Niu L, Yang Q, Zhang J. An Experimental Study Measuring the Image Field Angle of an Electron Beam Using a Streak Tube. Photonics. 2023; 10(3):267. https://doi.org/10.3390/photonics10030267
Chicago/Turabian StyleCai, Houzhi, Xuan Deng, Lihong Niu, Qinlao Yang, and Jingjin Zhang. 2023. "An Experimental Study Measuring the Image Field Angle of an Electron Beam Using a Streak Tube" Photonics 10, no. 3: 267. https://doi.org/10.3390/photonics10030267