Article

Polarization-Independent Terahertz Surface Plasmon Resonance Biosensor for Species Identification of Panax and Paeonia

Terahertz Technology Innovation Research Institute, Shanghai Key Lab of Modern Optical System, Terahertz Science Cooperative Innovation Center, Shanghai Institute of Intelligent Science and Technology, University of Shanghai for Science and Technology, Shanghai 200093, China
*
Author to whom correspondence should be addressed.
These authors contributed equally to this study and share first authorship.
Photonics 2023, 10(3), 250; https://doi.org/10.3390/photonics10030250
Submission received: 31 December 2022 / Revised: 13 February 2023 / Accepted: 14 February 2023 / Published: 27 February 2023
(This article belongs to the Special Issue Integrated Plasmonic Devices)

Abstract

:
In this paper, we proposed a polarization-independent terahertz surface plasmon resonance (SPR) biosensor based on an angular cyclic element structure. The biosensor has the advantages of high sensitivity detection and high stability against the polarization change of incident terahertz light. Based on the principle that the spatial longitudinal electric field of the SPR biosensor is nonlinear and sensitive to the dielectric constant of the sample, we theoretically proved that specific nonlinear response curves with certain saturating speed and amplitude can be formed to identify different samples. The biosensor was applied to identify Panax (notoginseng, ginseng and American ginseng, 48 samples each) and Paeonia (white peony and red peony, 48 samples each) with the accuracy of 95.8% and 94.4%, respectively. The standard deviations (SD) were less than 0.347% and 0.403%, respectively. Therefore, the polarization-independent terahertz biosensor can rapidly and accurately identify Panax species and Paeonia species. These results provide a new reference for rapid and low-cost identification of medicine species.

1. Introduction

Notoginseng, ginseng and American ginseng all belong to the Panax species, which are widely used as medicines, functional foods, health products and food additives [1,2]. Their plant morphology and chemical composition have similarities, but their pharmacological effects are different. Notoginseng contains pharmacological effects such as strengthening the heart, expanding the coronary artery, antithrombotic effects, detumescence and analgesia. It is used to treat coronary heart disease, myocardial ischemia and other diseases [3,4]. For example, Yunnan Baiyao is known for removing blood stasis, relieving pain, detoxification and detumescence. Ginseng can nourish the spleen and lungs, nourish the blood and greatly replenish qi. It is suitable for neurasthenia and dyspepsia and can effectively improve the body’s immunity. For example, the Ginseng Jianpi pill is used to tonify Qi, strengthen the spleen, improve digestion and benefit lung function [5,6,7]. American ginseng, which has a cooling effect on the liver, is widely used in many countries due to its ability to nourish the kidney, invigorate the spleen, nourish the stomach, reduce hypertension and fight diabetes. It is usually used to treat lung deficiency, prolonged cough, dry mouth and pharynx, blood loss and shortness of breath [8,9,10]. For example, nephritis rehabilitation tablets can be used to replenish vitality and clear inflammation and effectively relieve pharyngitis, a cough and a sore throat.
At present, the main methods used for the analysis of notoginseng, ginseng and American ginseng are high-performance liquid chromatography (HPLC), thermogravimetric analysis (TGA) and differential thermal analysis (DTA). Huang Zaiqiang et al. established the fingerprint of ginseng, notoginseng and American ginseng, respectively, by using HPLC analysis techniques, and made a comparative analysis of their differences to achieve the effect of distinguishing the three species of Panax. In HPLC, the sample powder was dissolved in 50% ethanol, followed by ultrasonic extraction, filtration and other procedures to obtain the sample solution. Then, according to the preset chromatographic conditions, the sample solution was analyzed and the chromatogram was collected. The results showed that the fingerprint peaks and chemical components of notoginseng, ginseng and American ginseng could be used to identify Panax species. This method has many steps, a cumbersome operation and a large sample loss [11]. Li Jiantao et al. used thermogravimetric analysis (TGA) and differential thermal analysis (DTA) to identify notoginseng, ginseng and American ginseng based on their differences in thermal stability. With the increase in temperature, they showed physical or chemical changes during heating. The difference of peak shape and inflection point on TGA and DTA maps was used to identify the Panax species. However, in order to ensure a reasonable peak shape on the spectrum, the atmosphere, pressure, heating rate and sample size have strict requirements, which are difficult to control [12]. In general, the above methods are time-consuming and has a large sample loss, as well as cumbersome preprocessing. Therefore, we hope to find a new method for the identification of Panax genus, which is simple, rapid and reproducible.
Terahertz (THz) waves enable non-destructive testing with high penetration and spectral fingerprint recognition and have been proven to be a promising method for material identification [13,14,15,16]. At present, terahertz technology has made a series of important achievements in biomedical sensing [14,17,18]. When terahertz waves are transmitted through a medicinal material, if the vibration and rotation frequencies of the molecules match a certain terahertz frequency, resonance absorption will occur and form a unique, characteristic absorption peak [19]. Therefore, this method is well-suited for recognizing medicine molecules [20,21]. However, due to the mismatch between the wavelength of the THz wave and the size of the target molecule, the detection sensitivity of trace analytes identified by terahertz radiation in free space is limited and cannot be detected for low concentrations of medicines. Therefore, some research groups have proposed a kind of biosensor to improve the detection sensitivity which enhances the interaction between terahertz waves and medicine molecules using the effect of surface plasmon resonance (SPR) [22,23,24,25,26].
An SPR biosensor is usually composed of two layers of materials: (1) the base layer, which is usually composed of polyimide, silicon, quartz and other materials with good transmission capacity for THz waves, and (2) the metal layer, which is usually composed of gold, copper, and other electrode materials with good electrical conductivity [27,28,29,30]. The metal layer must be designed graphically and must be composed of a non-closed unit structure to allow for a capacitive inductance effect when the layer is excited by THz waves, generating an oscillating current and resulting in a characteristic resonance peak [31,32]. The properties of the THz resonance peak determine the sensitivity, accuracy and stability of the method. However, THz waves have polarization, and the opening direction of the cell structure determines the polarization selectivity of the SPR biosensor. Therefore, once the angle between the polarization directions of the SPR biosensor and THz wave changes, the SPR biosensor will exhibit a frequency shift in the THz resonance peak that introduces a large error component to the test results [33]. For this reason, researchers have attempted to locate the SPR biosensor using a mechanical device, but due to the existence of mechanical tolerance, the SPR biosensor position cannot remain accurate and consistent, so this interference cannot be completely eliminated.
In this study, we first designed a polarization-independent SPR biosensor to improve the stability and efficiency of the test by solving the polarization selectivity problem. Based on the nonlinear distribution of spatial longitudinal electric field of THz SPR biosensor, a new method for the identification of medicine species was theoretically established. Then, notoginseng, ginseng, American ginseng, white peony and red peony were identified experimentally by 200 samples in total (5 kinds, 40 of each kind). Finally, another 40 samples were used to verify the accuracy and reliability of the method.

2. Theoretical Analysis

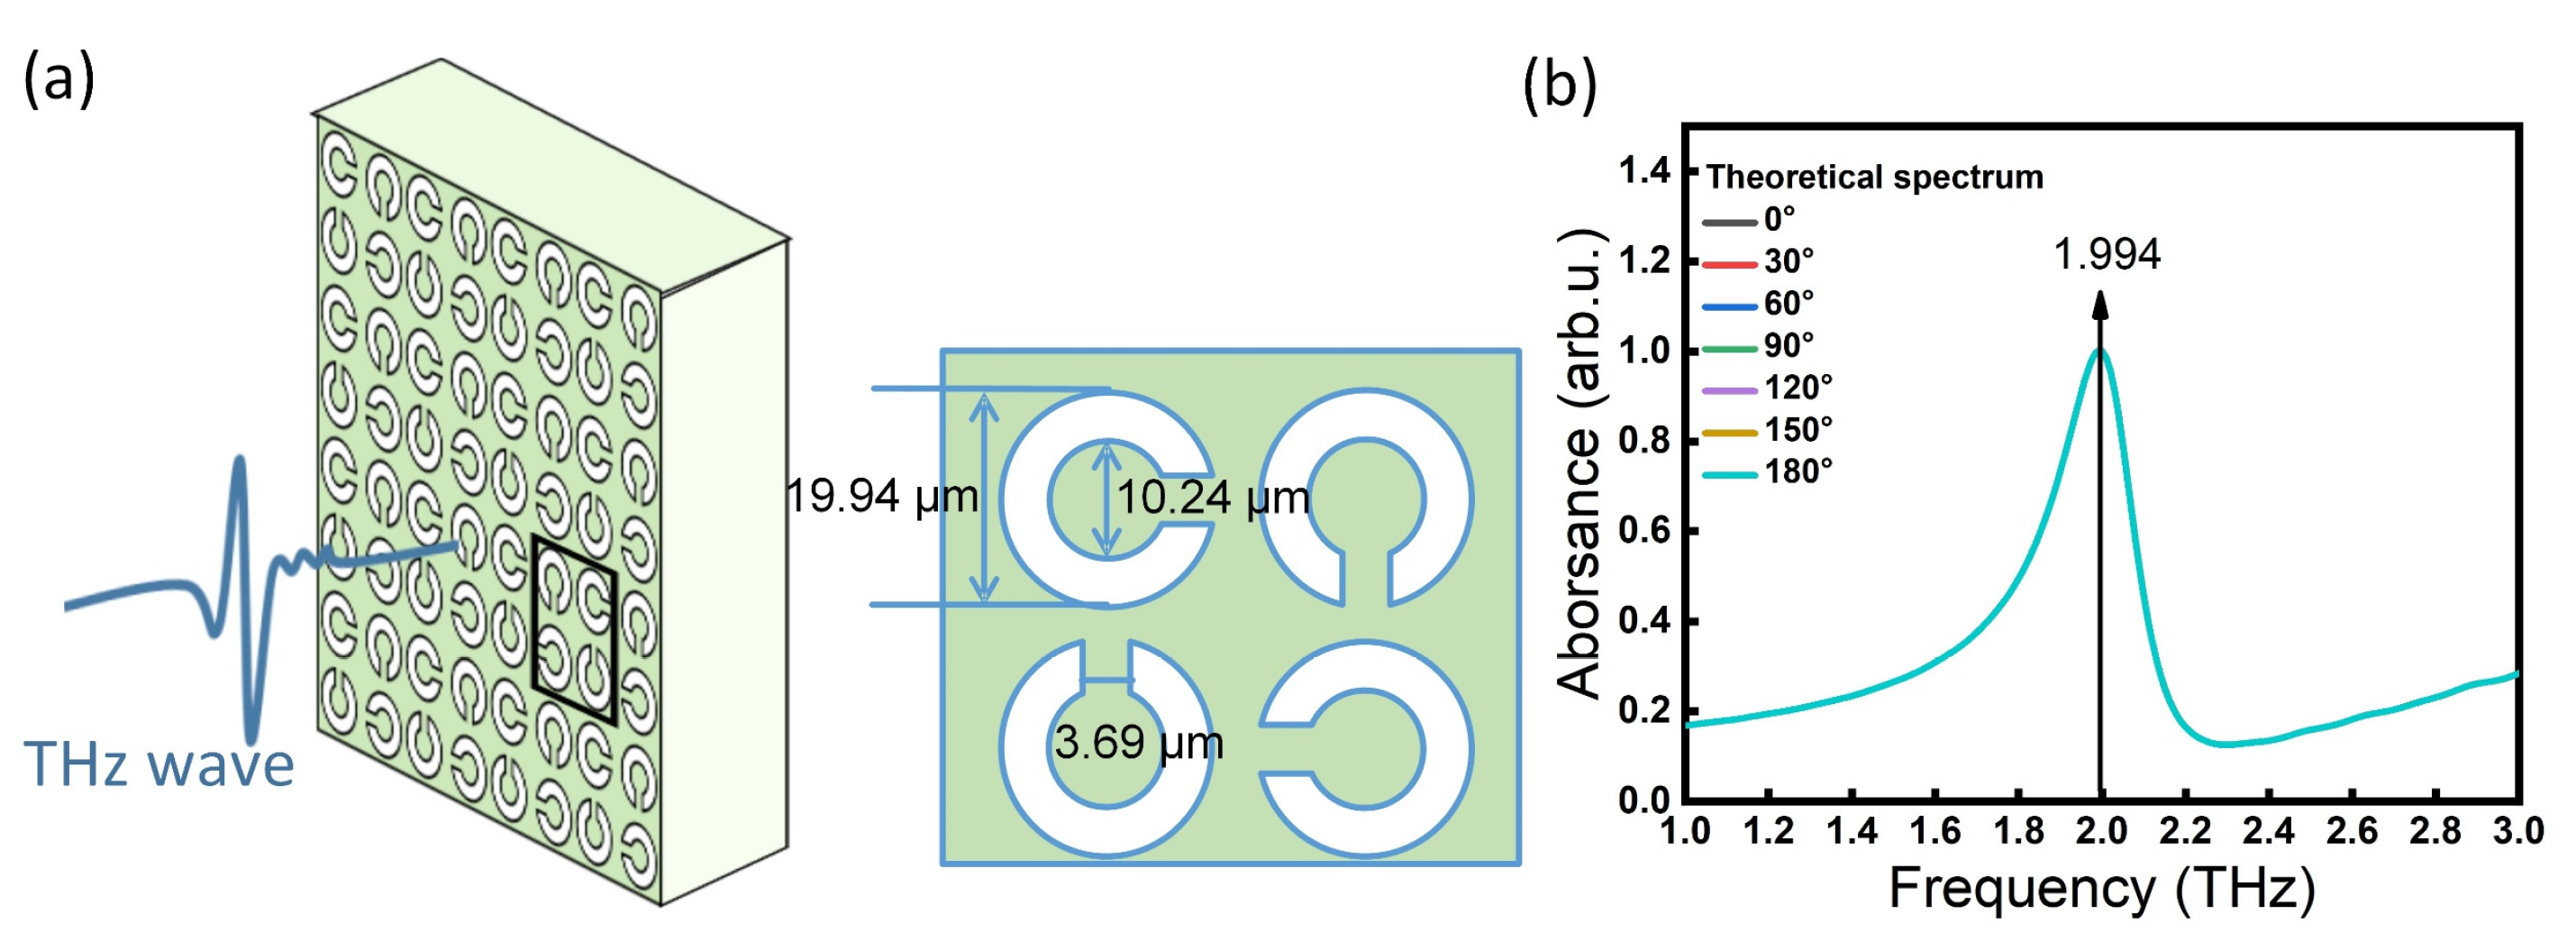
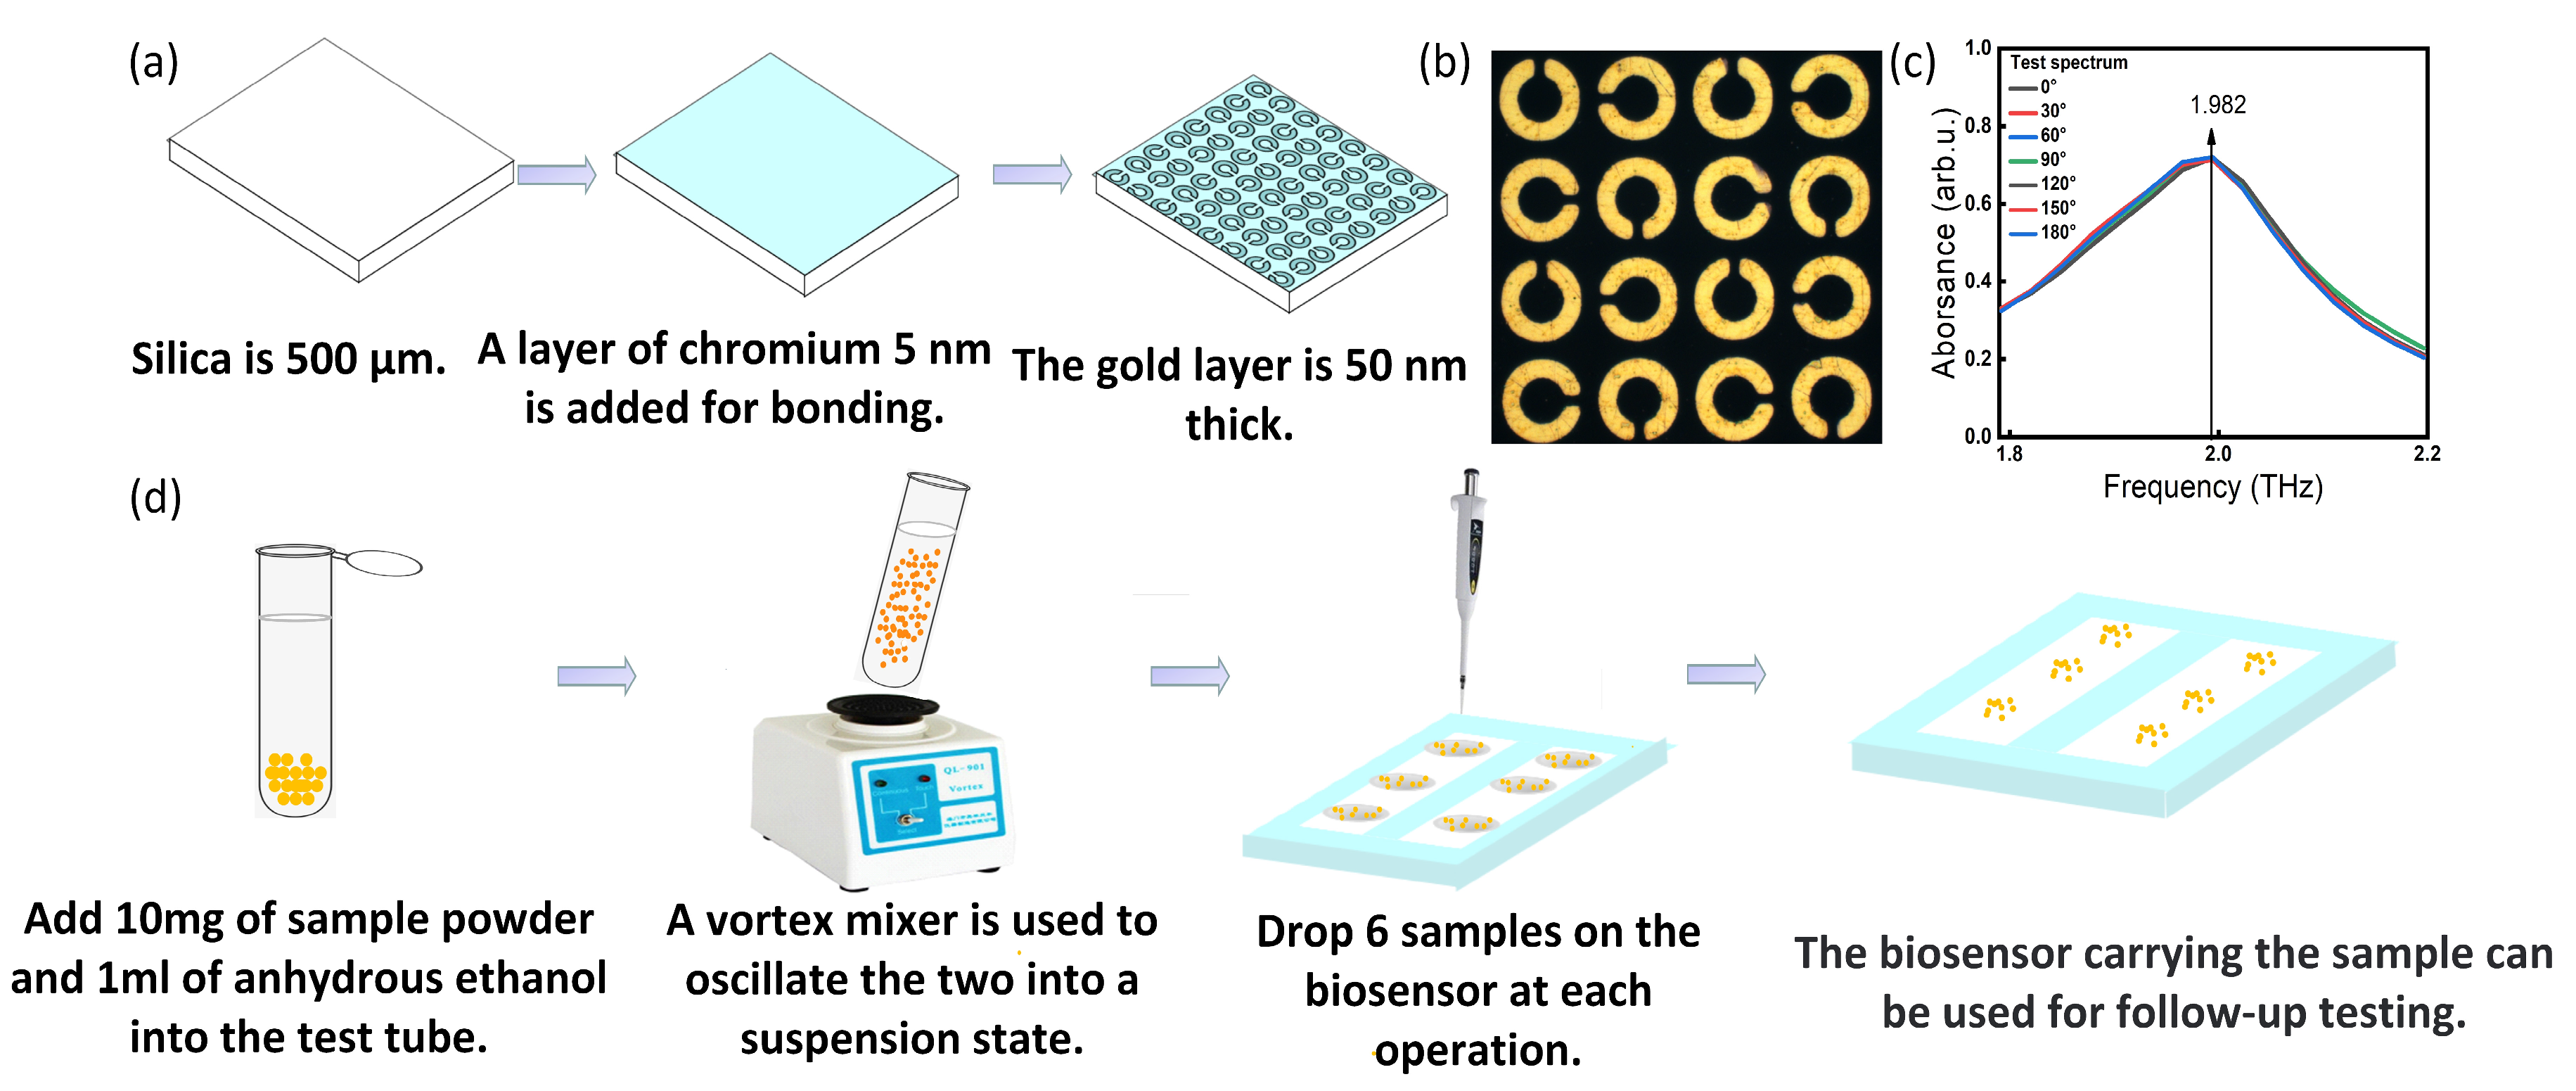
2.1. THz SPR Biosensor Design

It was found that the polarization selectivity of THz SPR biosensor is related to the structure of metal layer opening element. The resonance change caused by polarization can be eliminated by adjusting the notch direction to improve the measurement accuracy [34,35]. We attempted to design the biosensor with a metal layer structure to make it polarization-independent by using the commercial software COMSOL 5.4. The X- and Y-axis are shown in the figure and when the polarization angle α of the incident light is parallel to the X-axis, it is set to 0°.
As shown in Figure 1a, this open-loop structure can amplify the capacitive inductance effect and enhance the resonant absorption intensity of terahertz waves. However, as shown in Figure 1b, in this structure, terahertz waves irradiate the biosensor, and the amplitude of the absorption peak is not stable when α changes from 0° to 180°. We also observed and drew the cross section electric field distribution diagram, as shown in Figure 1c. It is worth noting that the electric fields under different α are normalized, with different colors representing different electric field intensities. Obviously, in this structure, with the change of angle, the polarization angle of the incident terahertz wave would affect its electric field intensity on the Y-axis component, and the electric field intensity would affect the intensity of the oscillating current, thus leading to the instability of the amplitude of the final absorption peak. This is not the polarization-independent structure that we want.
Next, we considered the design with axisymmetric opening directions and random opening directions, as shown in Figure 1d,g. As shown in Figure 1f,i, when α changed from 0° to 180°, the polarization angle of terahertz wave still had an effect on the electric field intensity of Y-axis component, and the induced current directions generated by these two structures could not offset each other, so they were still sensitive to the electric field direction of terahertz waves and had polarization selectivity. As shown in Figure 1e,h, the resonance absorption peaks between 1.0 and 3.0 THz were not stable, and they were not the stable structure that we required.
In view of the above tests, we re-optimized the spatial distribution of resonant ring openings and designed a centrally symmetrical structure of the opening of the metal layer to achieve the polarization independence of the biosensor, as shown in Figure 1j. The specific design was as follows: a unit consisted of four single-opened metal resonance rings with the same spacing and different opening directions, rotated 90 degrees towards each other to make them centrosymmetric. Under the action of the terahertz wave electric field, each resonance ring has the phenomenon of polarization selectivity. Due to the equivalent capacitance of each resonant ring being the same and the structure being centrosymmetric, the polarization selectivity of the whole structural unit offsets each component, which ensures the consistency of the response of the device to terahertz waves in all directions. This would allow it to realize the polarization independence of the SPR biosensor. As shown in Figure 1k, however α changed, the theoretical THz resonance absorption peak of the SPR biosensor always remained at the same peak position.
Based on the above polarization independent analysis, we refined the parameters of THz SPR biosensor. The specific parameters of the THz SPR biosensor that we designed are shown in Figure 2a. Silicon dioxide (SiO2) was used as the substrate, 5 nm chromium was used to connect the metal layer resonance ring, the thickness of the metal layer was 50 nm, its relative dielectric constant was defined as 4.7, the substrate thickness was t = 500 µm and the unit structure period was L = 45.6 µm. The substrate surface was coated with a gold (Au) film to form a periodic metal-opening resonance ring SRR on the substrate. The ring opening size had a diameter of d = 3.69 µm, the inner circle diameter was r = 10.24 µm, the outer circle diameter was R = 19.94 µm and the line width was g = 4.85 µm. The parameters of the SPR biosensor are shown in Figure 2a. Figure 2b shows the theoretical spectrum as α changed from 0° to 90°, with the formant remaining at 1.994 THz. The electric field distribution which corresponded to the resonant frequency of the SPR biosensor is shown in Figure 2.

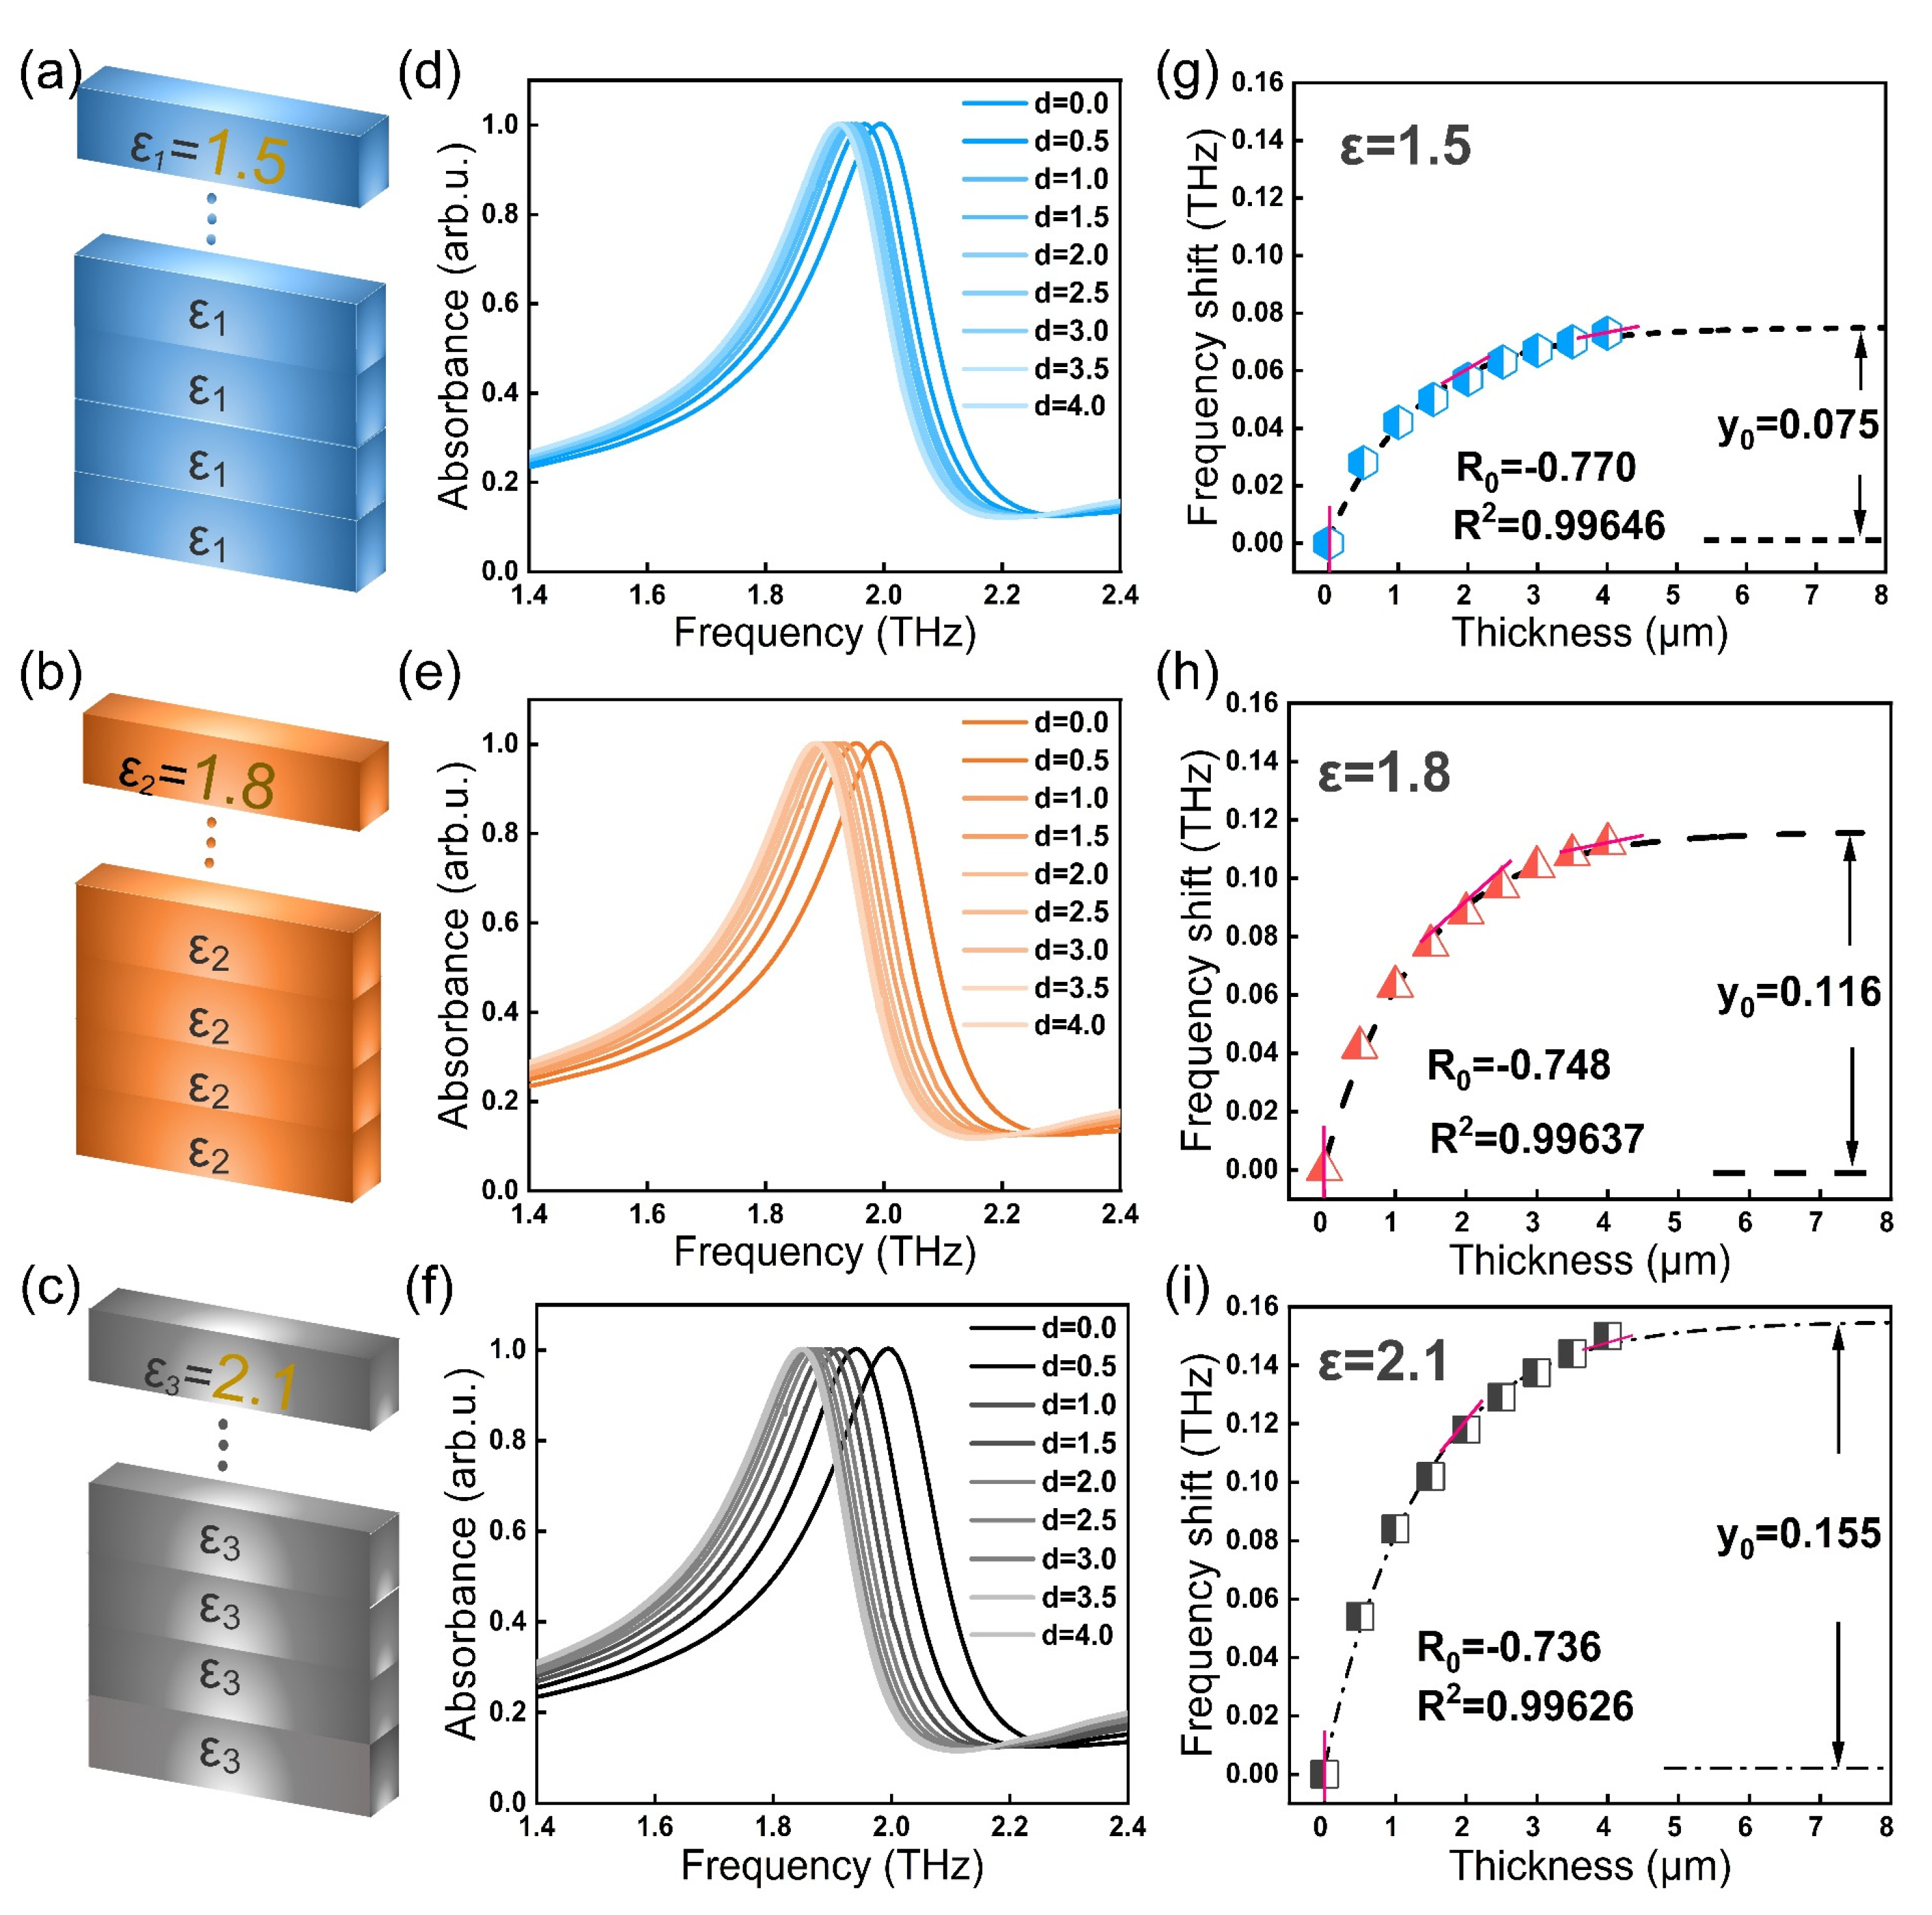
2.2. Theoretical Analysis of THz SPR Biosensor Identification Samples

After the polarization-independent THz SPR biosensor design was completed, we simulated its spectral response for substances with different material properties. The physical mechanism of the sample identification was as follows: when the sample is placed on the surface of biosensor, leading to the change of the dielectric constant of the biosensor, then the spatial longitudinal distribution of plasma wave on the metal layer and the parameters of the outgoing light will change accordingly. For the variation difference caused by different samples, it is possible to deduce the parameter information of the sample according to the nonlinear curve of the SPR response change by superimposing the same amount of samples on the biosensor surface many times.
Taking samples with the dielectric constants ε1 = 1.5, ε2 = 1.8, and ε3 = 2.1 as examples, we calculated the relations among the resonant peak displacement, the relative dielectric constant and the sample quality. As shown in Figure 3a–c, it was assumed that the superimposed samples in the simulation were uniform, the density is ρ, the coverage area is fixed as s, and the thickness is d. It can be seen from m = ρ v = ρ s d that the sample mass m was directly proportional to the sample thickness d. Here, we used the sample thickness d to represent the sample quality m. Assuming that with the superposition of samples, the thickness d gradually increased from 0.5 µm to 4.0 µm. The calculation results are shown in Figure 3d–f. When the sample thickness increased, the resonant peak of the THz SPR biosensor gradually redshifted, where the amplitude increase gradually slowed down until it becomes stable. This was because the spatial distance between the sample and the biosensor surface affected the sensing performance; that is, the farther the sample is from the metamaterial, the less the change in the overall equivalent capacitance of the surface space, so the change in frequency shift will become slower. The relation between the frequency shift of the terahertz resonant peak and sample thickness is fitted to a theoretical curve:
y = y 0 + A × exp   ( R 0 x )
where x is the sample coverage thickness, y is the frequency shift induced by the sample on the THz SPR biosensor, and R2 is the determination coefficient of the fitting curve. This equation represents a change in frequency shift, where y0 represents the total frequency shift when the nonlinear curve of each sample reaches saturation. The absolute value of coefficient A is close to y0 because when the sample thickness is 0, the sample frequency shift is 0. R0 represents the speed at which the curve reaches saturation, and the larger the absolute value of R0, the faster the curve grows to saturation. The slash line in Figure 3g–i represents the saturation velocity of the curve. Sample fitting curves of dielectric constants ε1 = 1.5, ε2 = 1.8, and ε3 = 2.1 are as follows:
When ε1 = 1.5, the function for the curve can be obtained:
y = ( 0.075 ± 0.002 ) ( 0.073 ± 0.002 ) × e x p [ ( 0.770 ± 0.069 ) x ] , R 2 = 0.996  
When ε2 = 1.8, the relation between the resonant peak frequency shift and sample thickness is:
y = ( 0.116 ± 0.003 ) ( 0.114 ± 0.003 ) × e x p [ ( 0.748 ± 0.057 ) x ] , R 2 = 0.996  
When ε3 = 2.1, the relation between the resonant peak frequency shift and sample thickness is:
y = ( 0.155 ± 0.003 ) ( 0.153 ± 0.004 ) × e x p [ ( 0.736 ± 0.049 ) x ] , R 2 = 0.996  
In our analysis, different samples presented different response curve parameters. The underlying principle was that samples with different dielectric constants cause different changes in the equivalent capacitance inductance of the THz SPR biosensor, and the resonance law will change with the repeated superposition of the samples. Based on the above principles, the combination of the THz SPR biosensor can rapidly identify medicine species.

3. Experimental Procedure

3.1. Materials and Methods

The root blocks of notoginseng, ginseng, American ginseng, white peony and red peony used in the experiment were all provided by Wenshan Institute for Food and Drug Control of Yunnan, China. There were 48 of each medicine, 240 samples in total. Absolute ethanol (C2H6O, 99%, CAS: 64-17-5, molecular weight: 46.07) for preparation of sample powder suspension was purchased from Sigma-Aldrich company, (St. Louis, MO, USA).

3.2. Experimental Device

The THz-TDS system used in the experiment was commercially produced (TAS7400, Advantest Ltd., Tokyo, Japan) to obtain terahertz spectra. The effective frequency range of the system was 0.9 to 3.0 THz, the signal dynamic range was 60 dB, and the spectral resolution was 1.9 GHz. During the experiment, the environment temperature was kept at 22 °C, and each spectrum was averaged 512 times, which was the best choice after balancing SNR and detection time. The system chamber was purged with dry air to eliminate the effects of water vapor and to maintain a humidity level below 3%. MM400 ball mill (Retsch, Haan, Germany) was used for sample grinding. Electronic balance (MS105DU, Mettler Toledo, Zurich, Switzerland., accuracy is 0.01 mg) was used to weigh medicine. Microscope (Axio Iager M2, Zeiss, Oberkhien, Germany) was used to observe the unit structure of the SPR biosensor. A pipette gun (Research Plus, Eppendorf, Hamburg, Germany, measuring range 0.5–10 µL, imprecision is 0.018 µL) was used to ingest the sample solution.

3.3. Experiment and Discussion of Biosensors

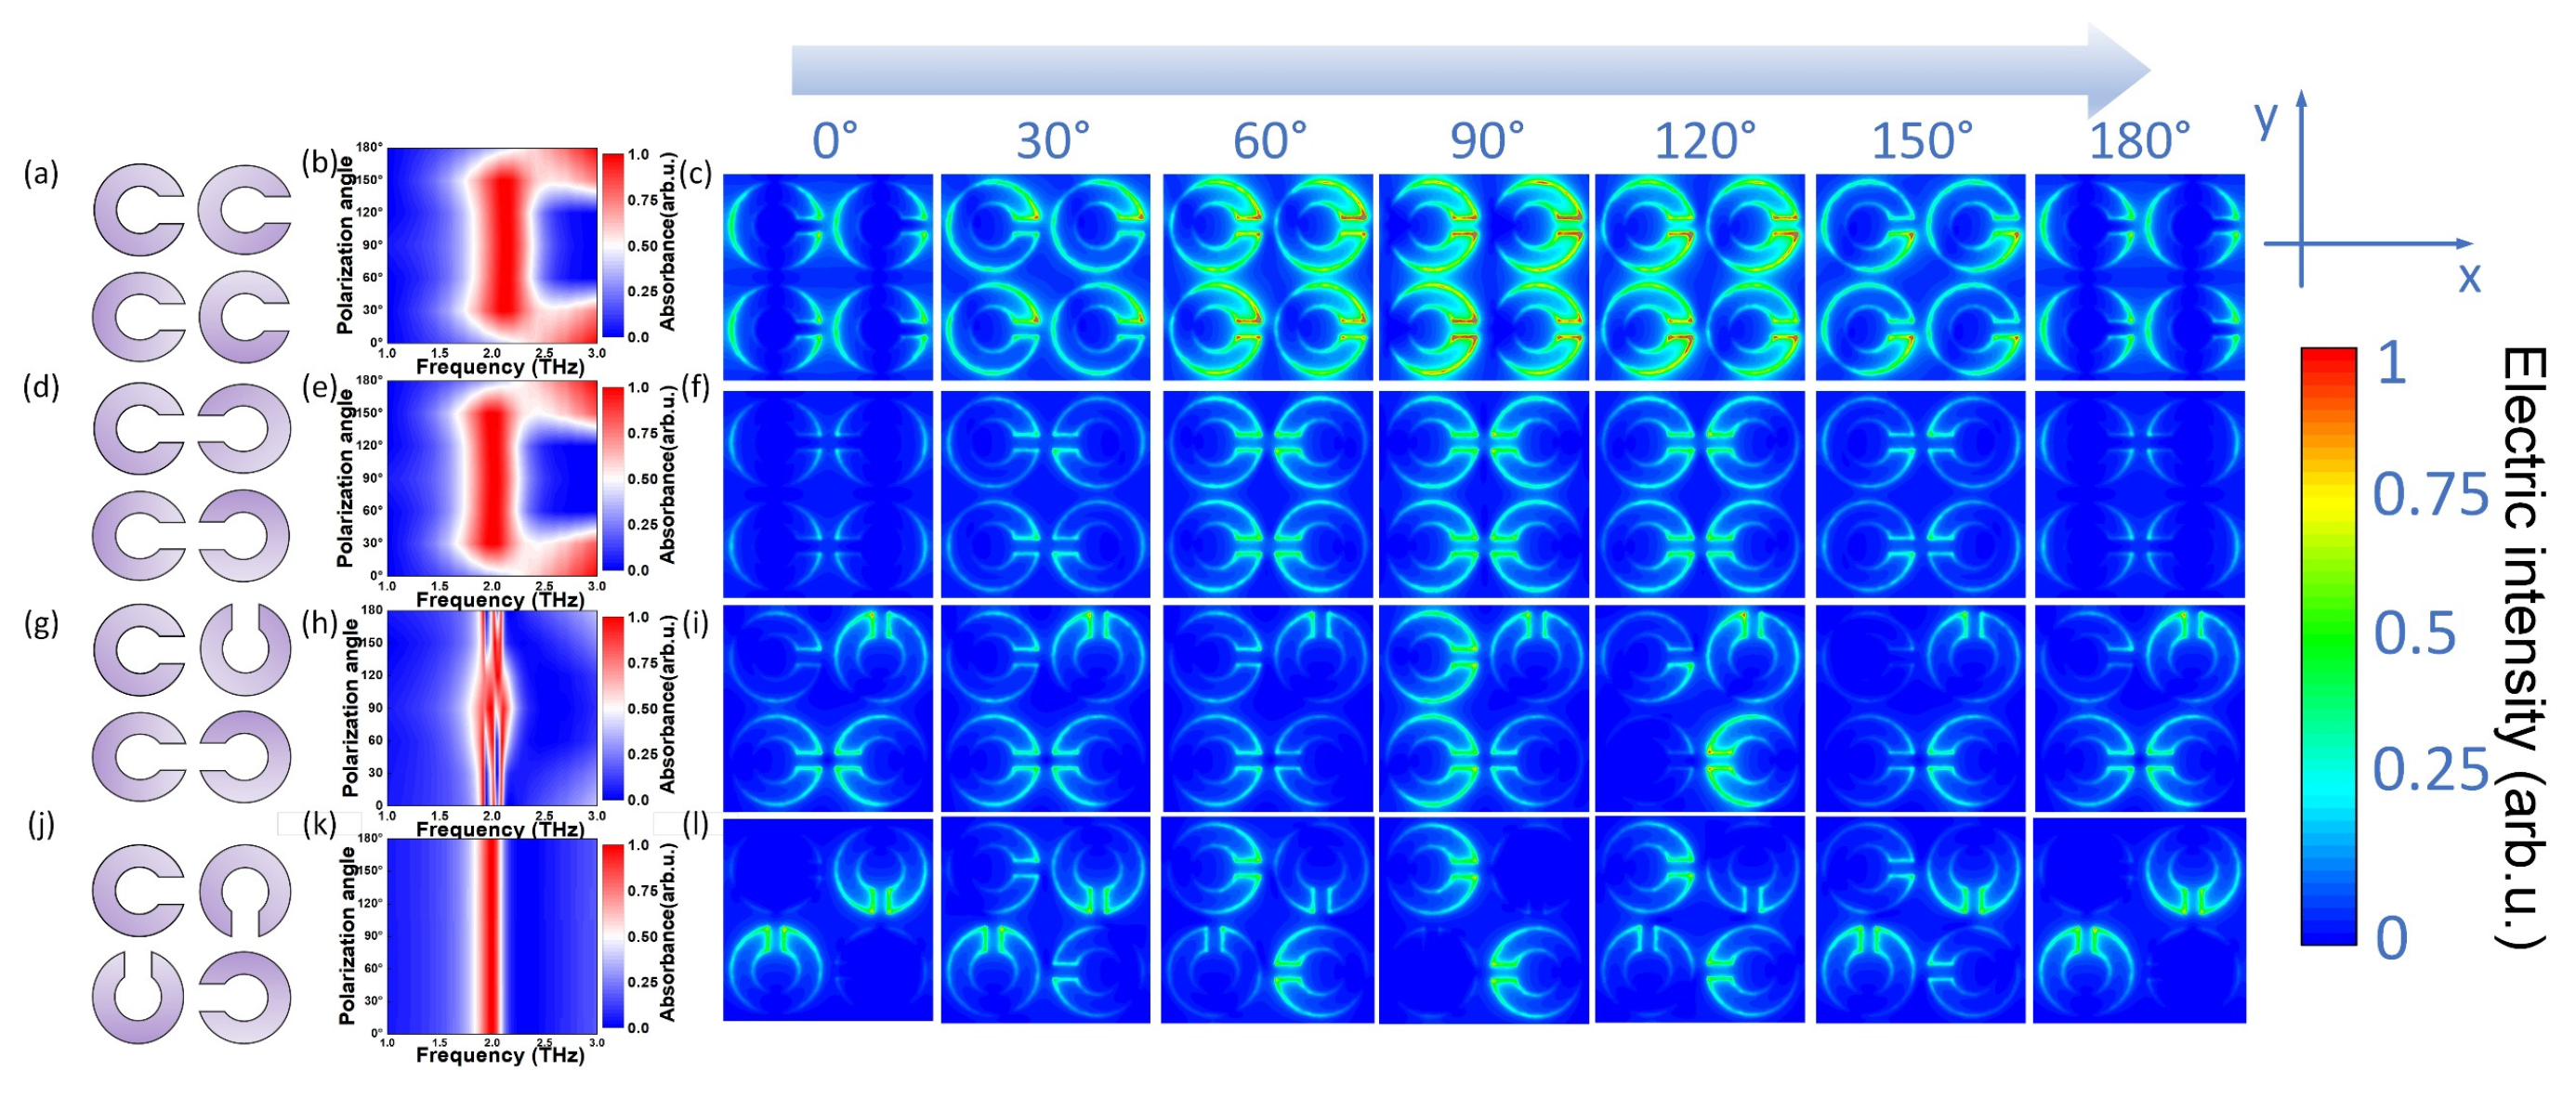
3.3.1. Polarization-Independent Testing of SPR Biosensor

According to the parameters designed in Section 2.1, the biosensor was processed, as shown in Figure 4a. Figure 4b shows a microscope image of the structure of the SPR biosensor. We also tested its polarization-independent performance, as shown in Figure 4c. It was found that the resonance absorption peak measured by the SPR biosensor remained at 1.982 THz, and the intensity was stable, showing a very high polarization independence. The difference between the experimental (1.982 THz) and theoretical peak value (1.994 THz) may be that in the theoretical calculation, we changed the Au/Cr layer into a perfect electrical conductor to improve the calculation efficiency, and the difference in the dielectric constant of the material leads to the deviation of the physical characteristic peak. Therefore, the structural design of this biosensor greatly improved the stability of the test.

3.3.2. Polarization-Independent Testing of SPR Biosensor Covering Samples

After confirming the polarization independence of the biosensor, we also verified the polarization independence of the SPR biosensor covering different sample powders. After measuring the polarization independence of the biosensor, we also verified the polarization-independence of the SPR biosensor covering different sample powders.
We added of 30 µg notoginseng, ginseng and American ginseng to the biosensor, respectively. Then, we adjusted the angle between the polarization direction of the SPR biosensor and the THz wave to 0°, 30°, 60°, 90°, 120°, 150°and 180°for the test. Here, the polarization angle of the THz wave was set as 0°when the biosensor was parallel to the X-axis. As shown in Figure 4a–c, regardless of how the polarization angle of the THz wave was deflected, the measured THz resonance absorption peak of the SPR biosensor of notoginseng, ginseng and American ginseng were always located at 1.961, 1.967 and 1.951 THz, and the intensity was stable. As can be seen from Figure 4d, the fluctuation range of polarization frequency shift of notoginseng, ginseng and American ginseng caused by angle change was 0.191%, 0% and 0.11%, respectively. The experimental results show that the SPR biosensor covered with samples still showed a good polarization-independent performance, which can ensure the test efficiency of the sample.

3.4. Sample Preparation and Measurement

The root blocks of five kinds of medicines were ground with MM400 ball mill for 3 min at 50 Hz vibration frequency, and ground twice to ensure that the sample powder was more finer and uniform. The particle size of the obtained powder was about 5 µm. The procedure for THz SPR biosensor processing and sample preparation is shown in Figure 5d. A total of 10 mg of sample powder and 1 mL of absolute ethanol was put into the test tube. The Vortex mixer with the rotation speed of 2800 rpm was used to shake the solution for 15 s, obtaining the sample solution in suspension. Then, 1 µL solution (containing 10 µg sample powder) was ingested and transferred to the biosensor by using a pipette with a fixed titration height of 1 cm. The droplet was distributed on the surface of the biosensor in a circular shape with a diameter of 4 mm. Based on this, the biosensor (18 × 14 mm2) was evenly divided into six samples (6 × 7 mm2), which could support the preparation of six samples at the same time. The sample powder adhered to the surface of the biosensor could form a thin layer with approximately uniform thickness after the absolute ethanol was evaporated. Next, THz SPR biosensor with sample powder attached was placed in the TAS7400 device to obtain the corresponding characteristic peak (each sample was tested three times to obtain the error bar). The operation process was repeated seven times.

3.5. Data Processing and Analysis

Matlab 2021 software and Origin 2019b software were used for data analysis. Each sample was tested 3 times, and all data were imported into Matlab software to obtain the average value and peak value. Then, the peaks were imported into Origin software for analysis. For data analysis, the peak value of the biosensor without sample was taken as the initial value, and the peak value of the biosensor with sample was subtracted from the initial value for analysis.

4. Results and Discussion

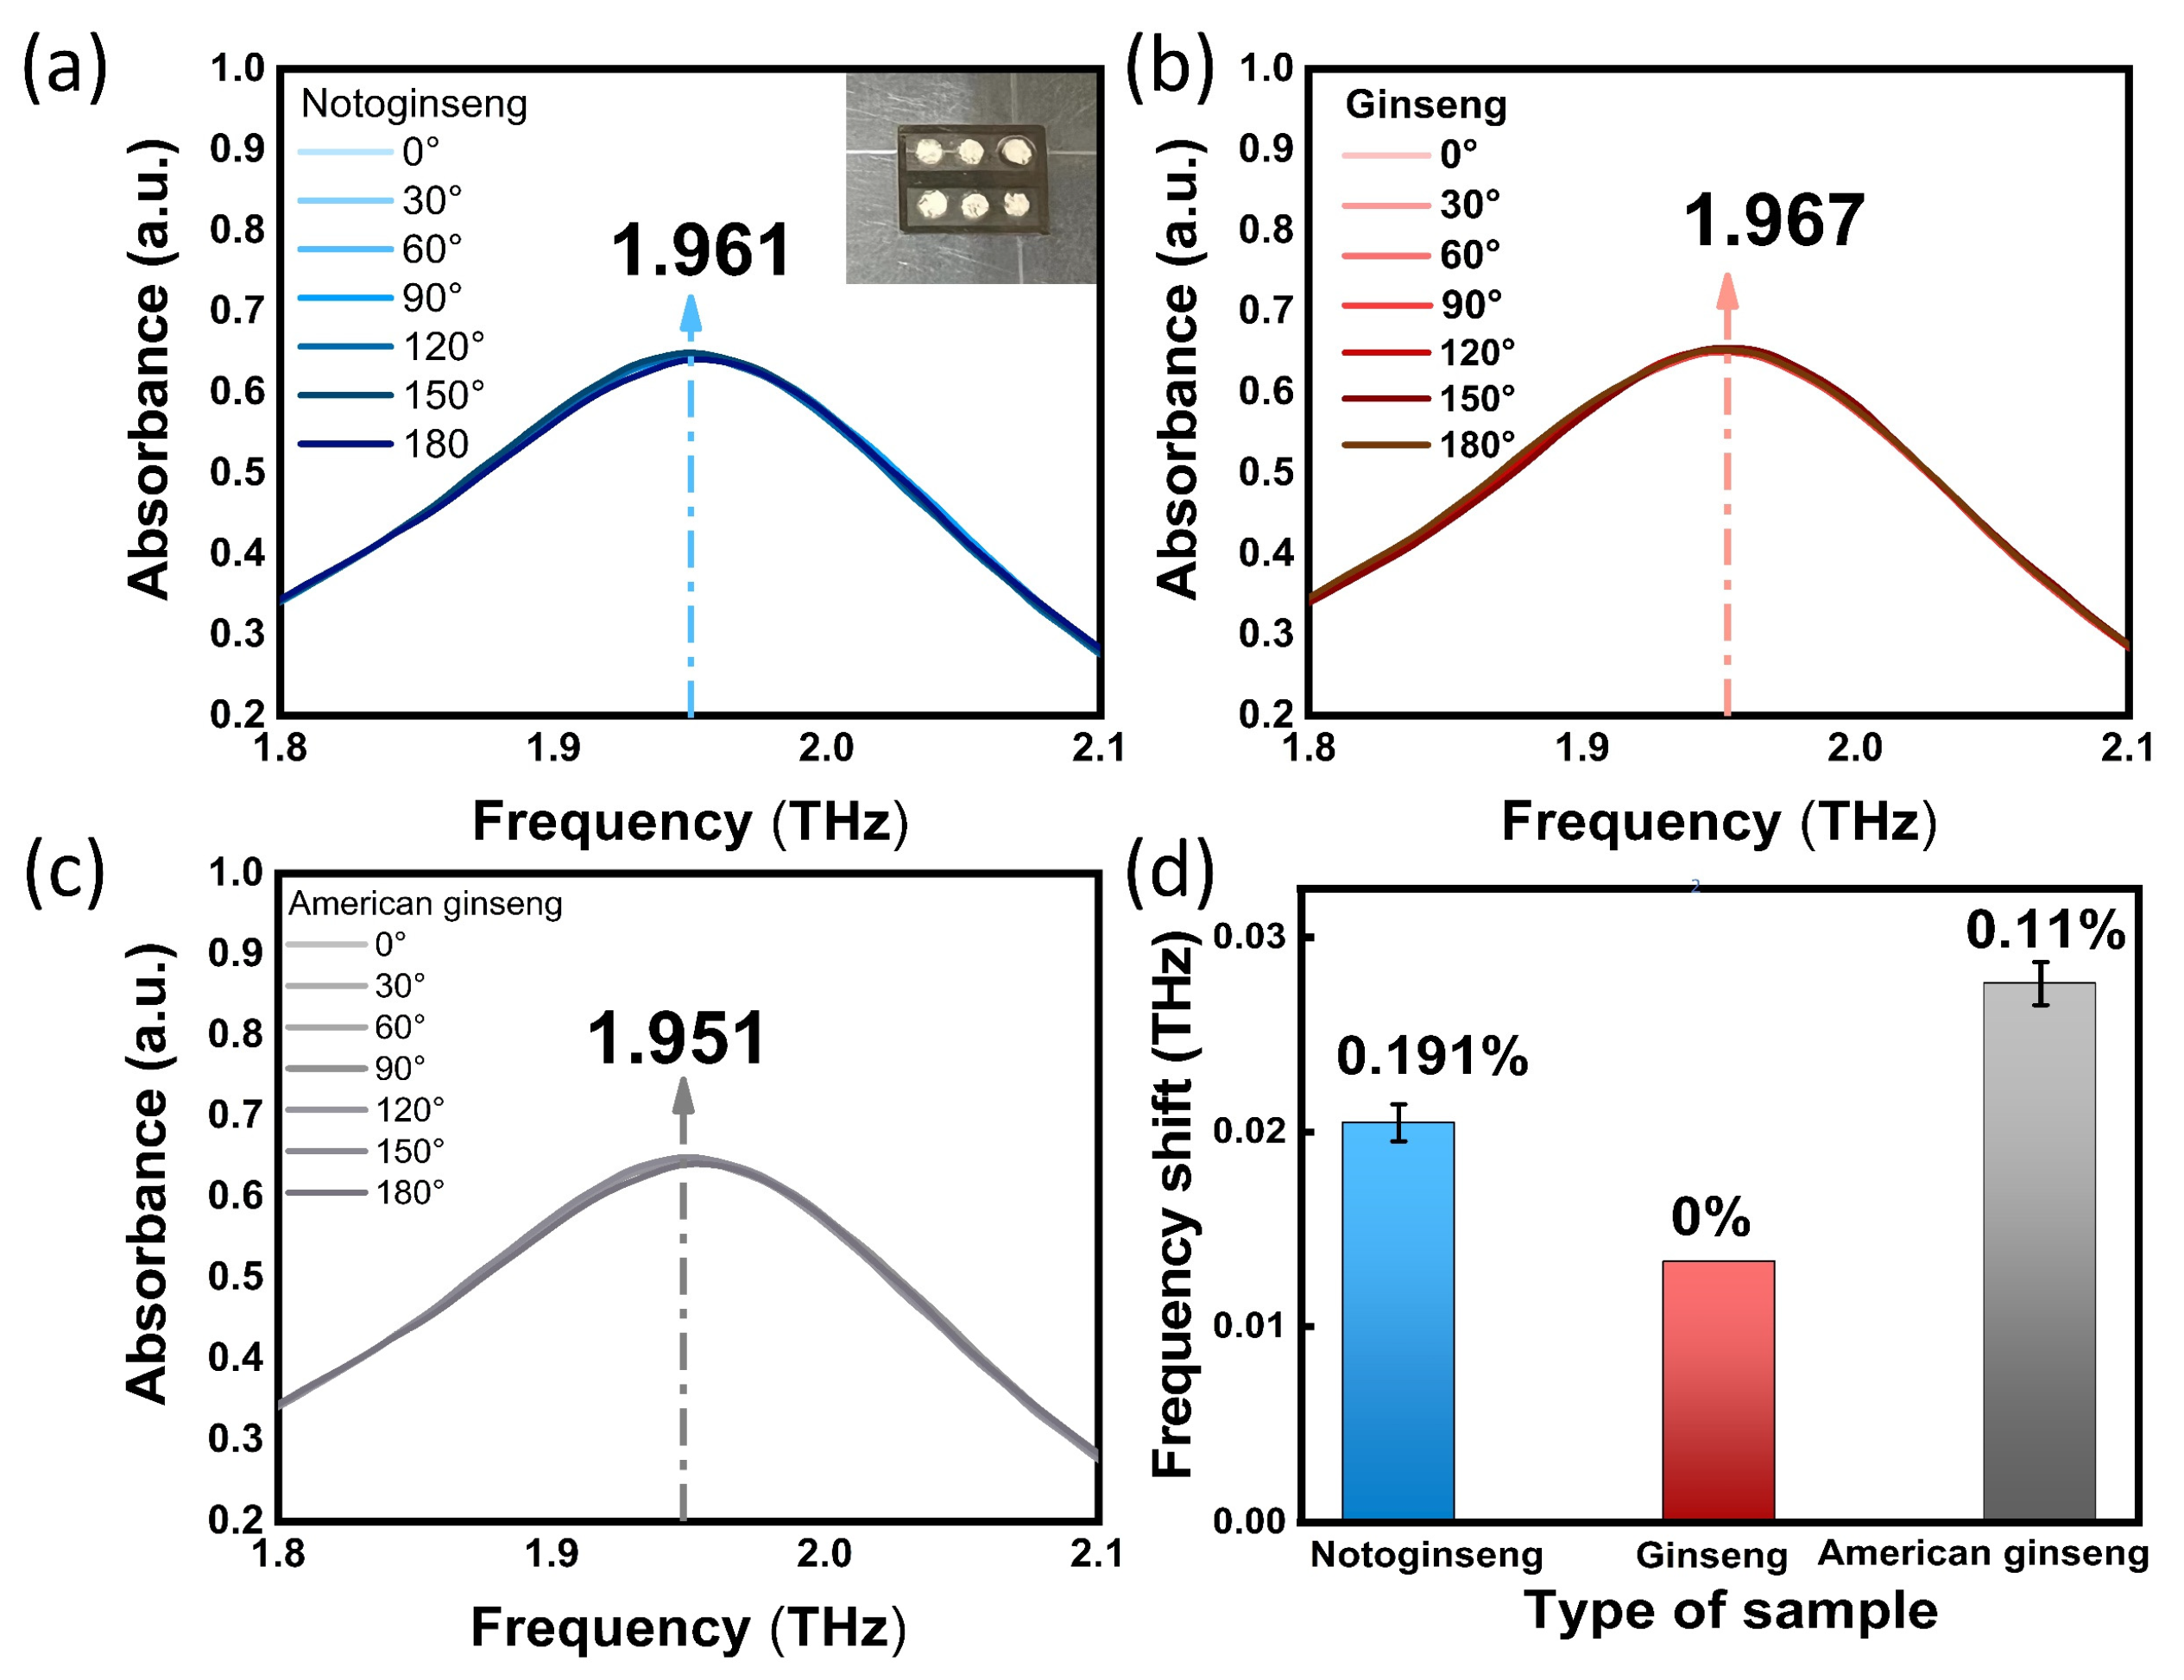
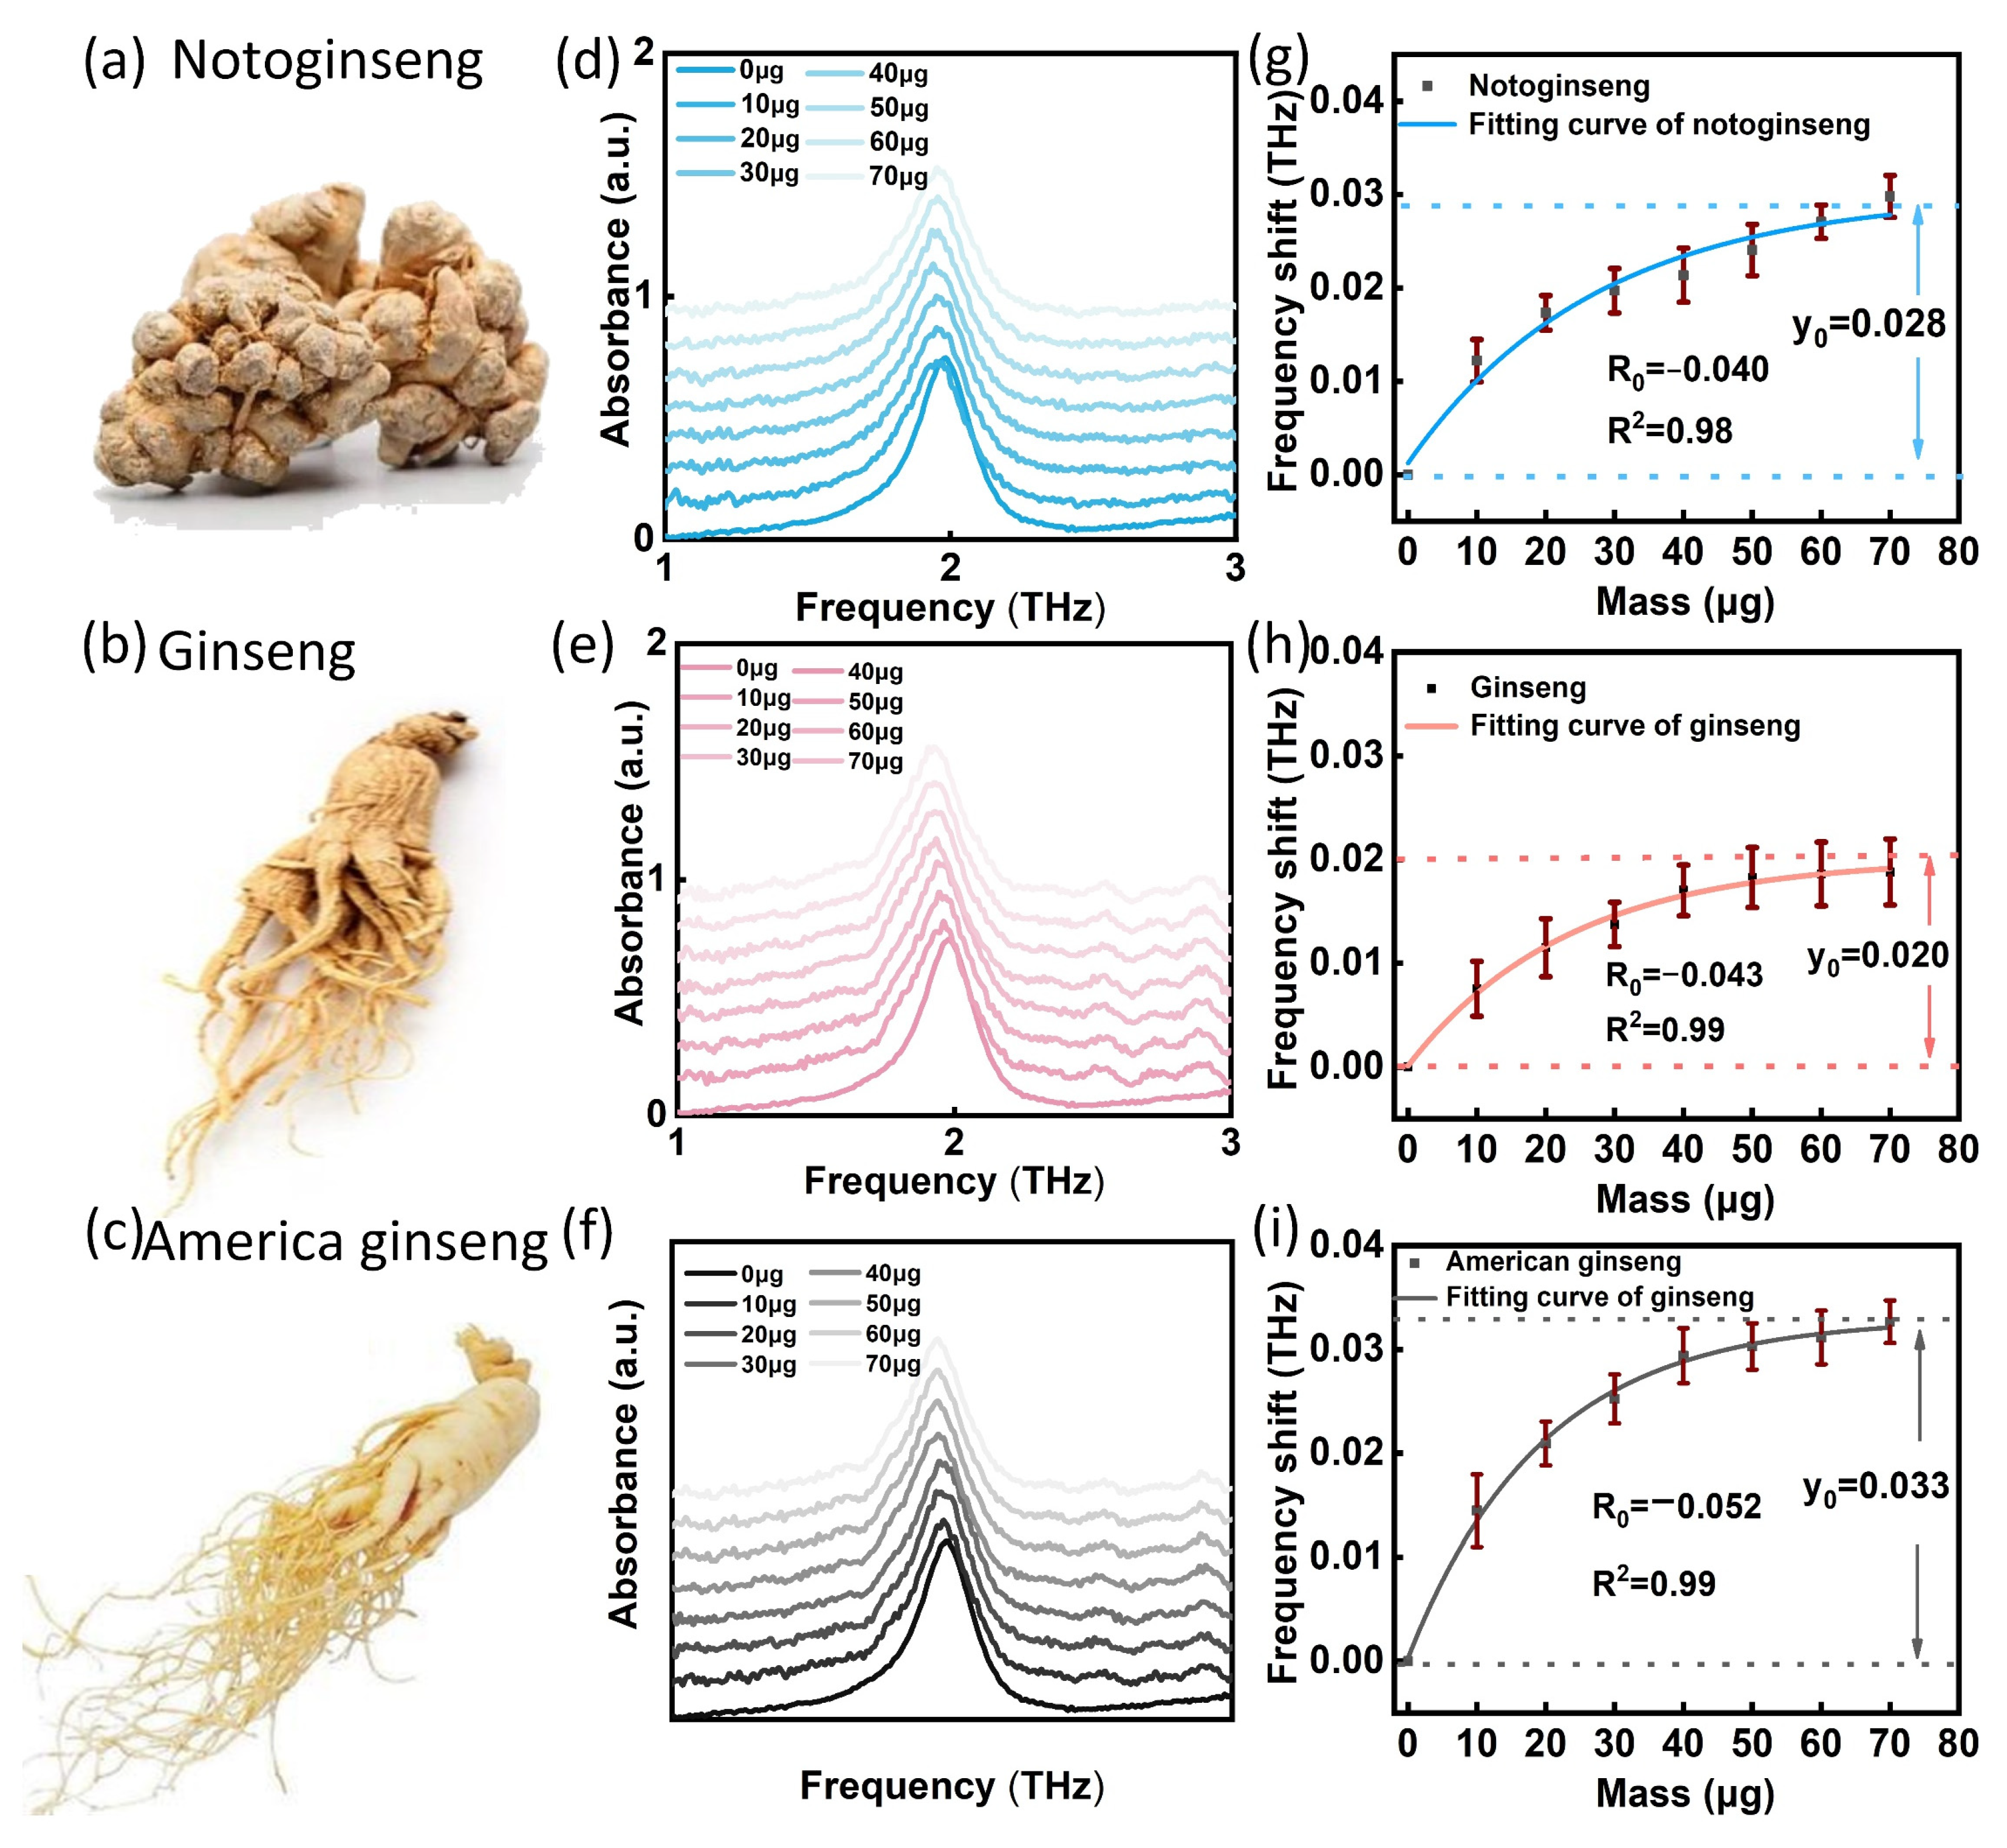
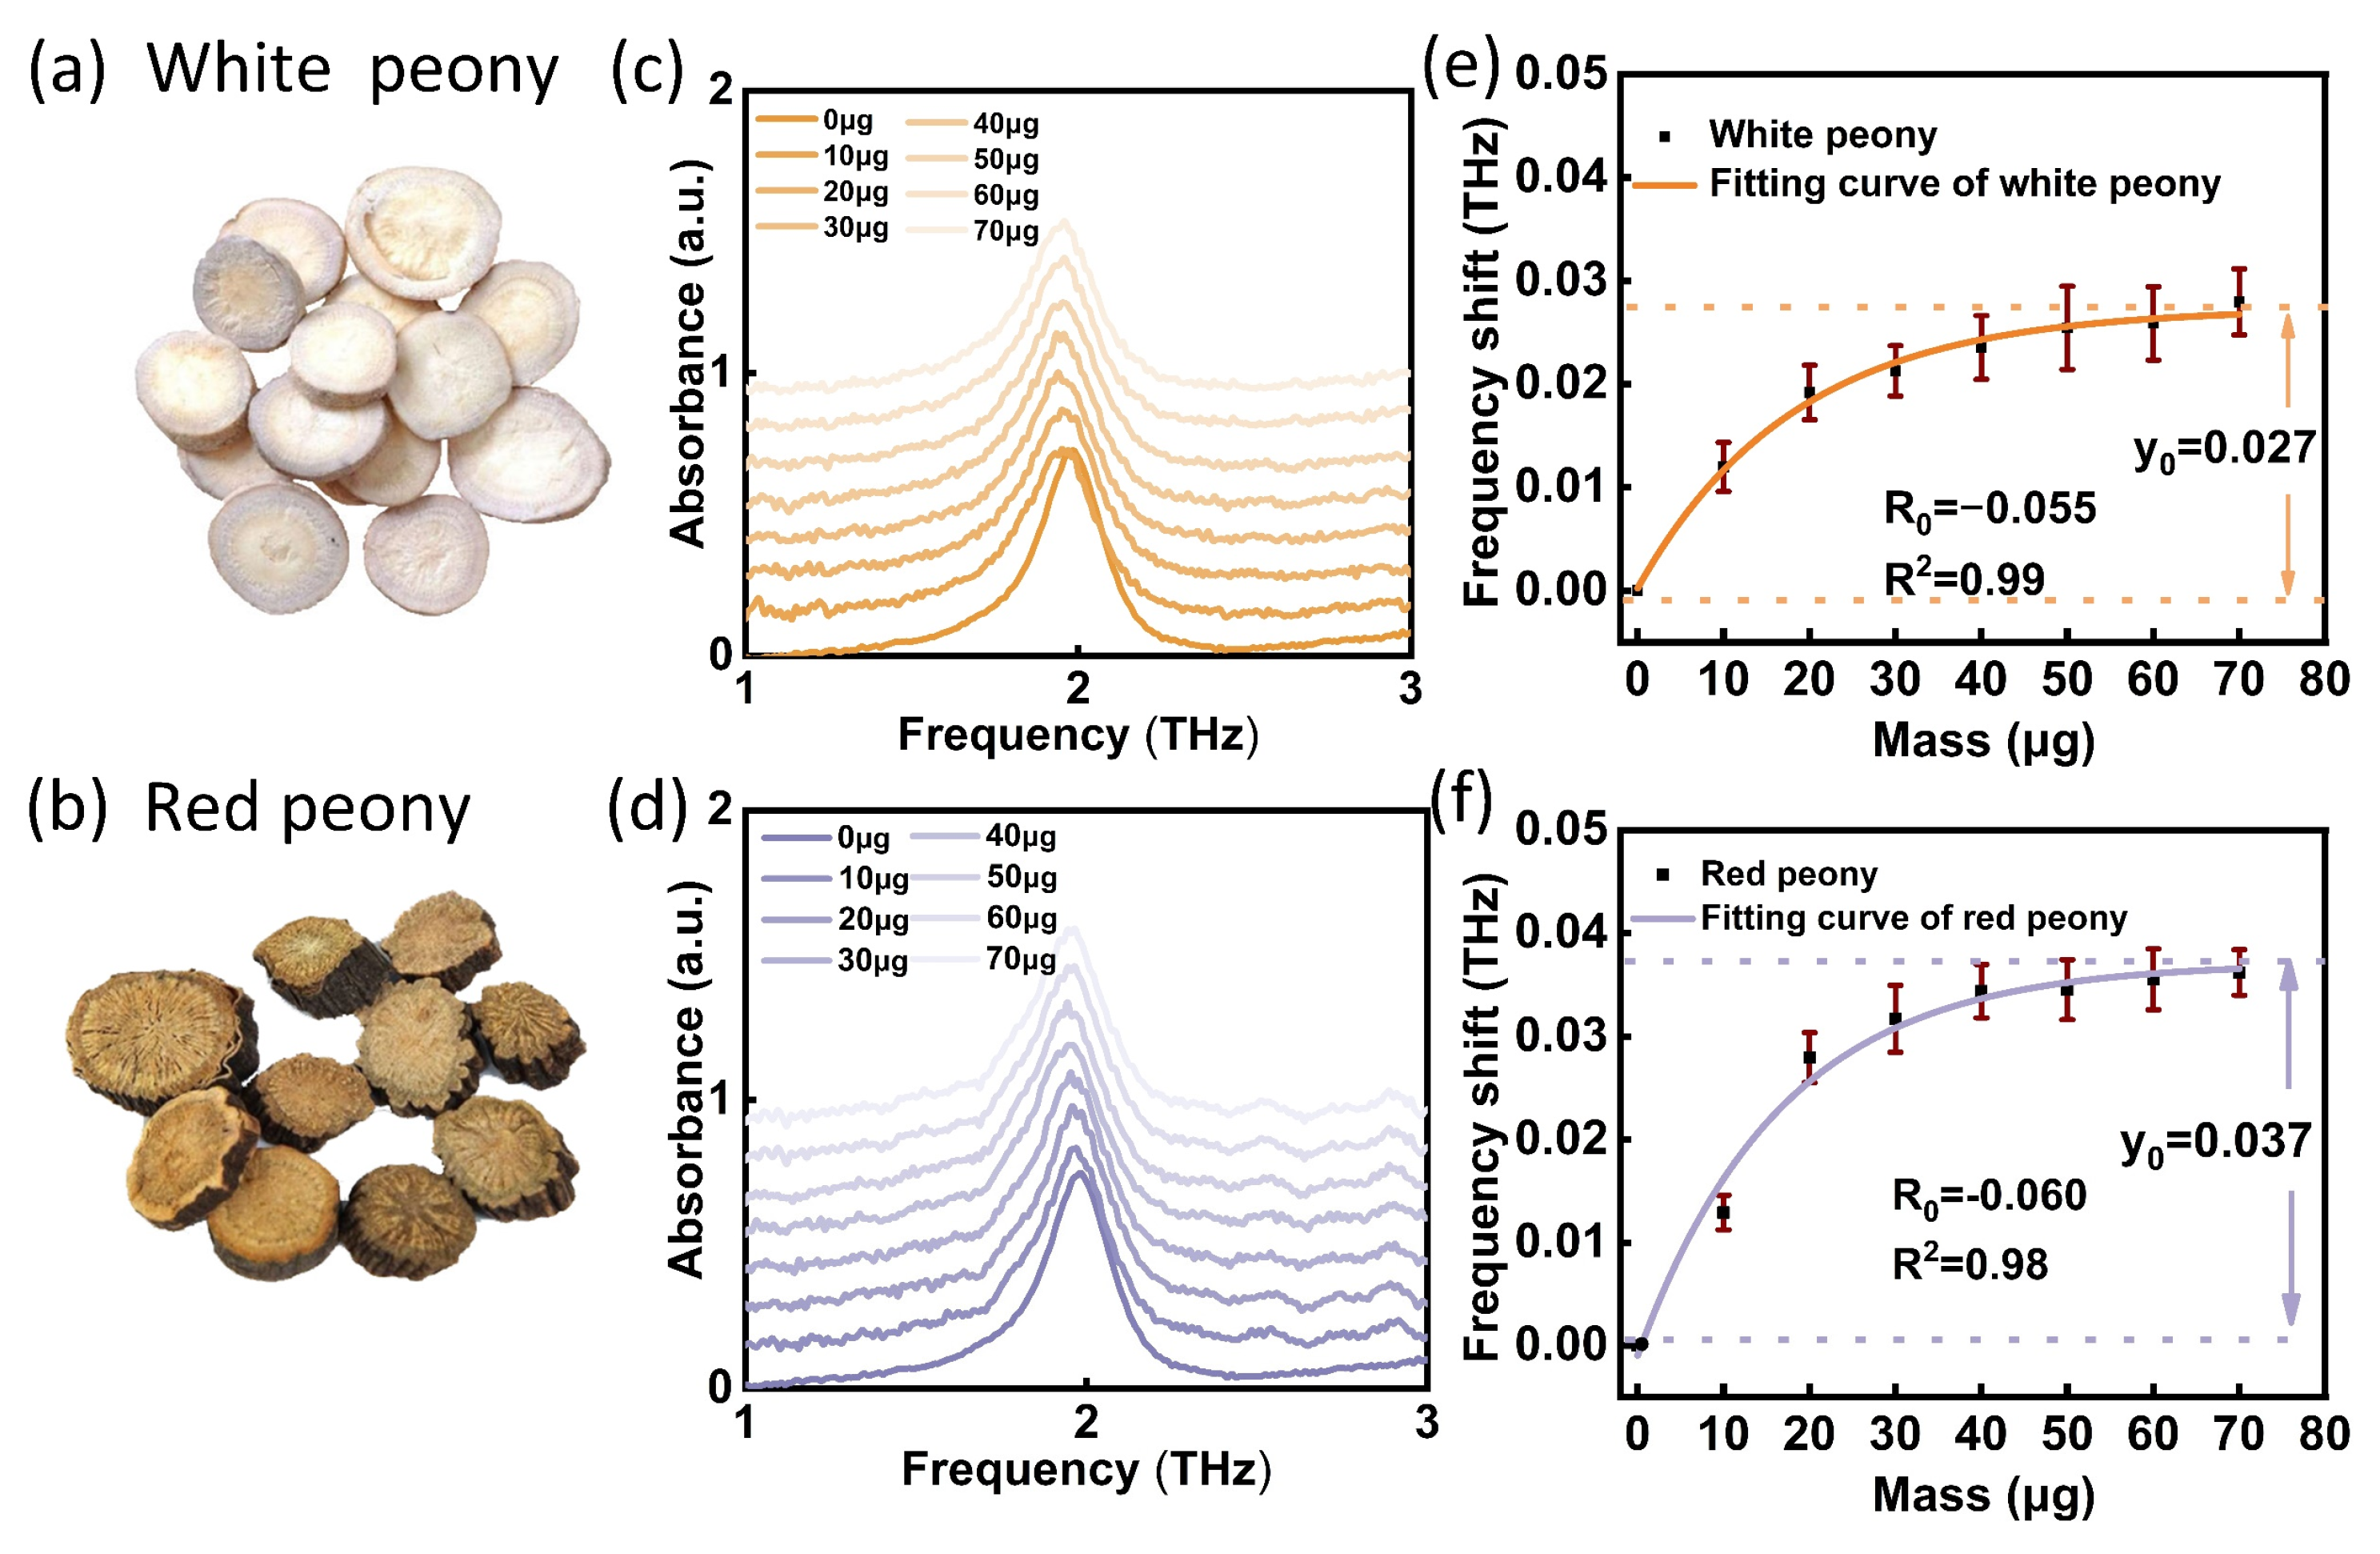
4.1. THz SPR Biosensor Characterization of Different Medicines

After the simulation analysis confirmed the feasibility of the THz SPR biosensor for identification of samples with different dielectric constants, we selected notoginseng, ginseng and American ginseng as samples for testing and identification. Here, we fixed the sample volume of each drop on the biosensor surface for testing. Figure 6a–c shows the sample images of notoginseng, ginseng and American ginseng. As the volume of the sample dropped on the biosensor surface increased, the mass of the samples contained in the suspension increased gradually from 10 µg to 70 µg. With the superposition of sample, the resonant peak of SPR biosensor moved to a low frequency, as shown in Figure 6d–f. Through nonlinear fitting of the relation between the frequency shift and mass (Figure 6g–i), the respective fitting equations of notoginseng, ginseng and American ginseng can be obtained:
y = ( 0.028 ± 0.002 ) ( 0.028 ± 0.002   ×   e x p [ ( 0.040 ± 0.007 ) x ] , R 2 = 0.98
y = ( 0.020 ± 0.001 ) ( 0.020 ± 0.001   ×   e x p [ ( 0.043 ± 0.004 ) x ] , R 2 = 0.99
y = ( 0.033 ± 0.001 ) ( 0.033 ± 0.001   ×   e x p [ ( 0.052 ± 0.004 ) x ] , R 2 = 0.98
It can be seen that the fitting equations of the three kinds of Panax obtained from the experiment are consist with the simulated Equation (1) with independent coefficients, in which the determination coefficients (R2) of the fitting equations were all greater than 0.98, and the standard deviation (SD) ranges of notoginseng, ginseng and American ginseng were 0.168~0.279%, 0.214~0.318%, and 0.205~0.347%, respectively. It was found that different species of Panax showed different maximum frequency shift y0 and saturating speed R0, which is consistent with the theoretical simulation. In Table 1, we list the different parameters corresponding to its formula. The three parameters of notoginseng, ginseng and American ginseng are different, and the error range does not overlap. Therefore, the correlation coefficient can be used to distinguish Panax species effectively.
To further verify that this method can also be used to distinguish other kinds of medicines, we selected white peony and red peony (both belong to the Paeonia genus) for testing. The same test flow was shown in Figure 5d. The corresponding fitting equations of white peony and red peony can be obtained:
y = ( 0.027 ± 0.001 ) ( 0.027 ± 0.001   ×   e x p [ ( 0.055 ± 0.005 ) x ] , R 2 = 0.99
y = ( 0.037 ± 0.001 ) ( 0.038 ± 0.002   ×   e x p [ ( 0.060 ± 0.009 ) x ] , R 2 = 0.98
As shown in Figure 7e–f, the fitting equations of the two medicines obtained by the experiment are consistent with the simulated Equation (1) with independent coefficients. The measurement coefficients (R2) of the fitting equations were all greater than 0.98, and the standard deviation (SD) ranges of white peony and red peony were 0.168–0.325% and 0.237–0.403%, respectively. It was found that different species of Paeonia showed different maximum frequency shift y0 and saturating speed R0, which is also consistent with the theoretical simulation results. In Table 2, we list the different parameters corresponding to the formula. The fitting parameters of white peony and red peony were also different, and the error range did not overlap. Therefore, the detection method based on the SPR biosensor can realize the identification of Panax species and can also be applied to the identification of other kinds of medicines. Compared with the traditional method, this method has the advantages of simple operation, less time consumption and less sample consumption.

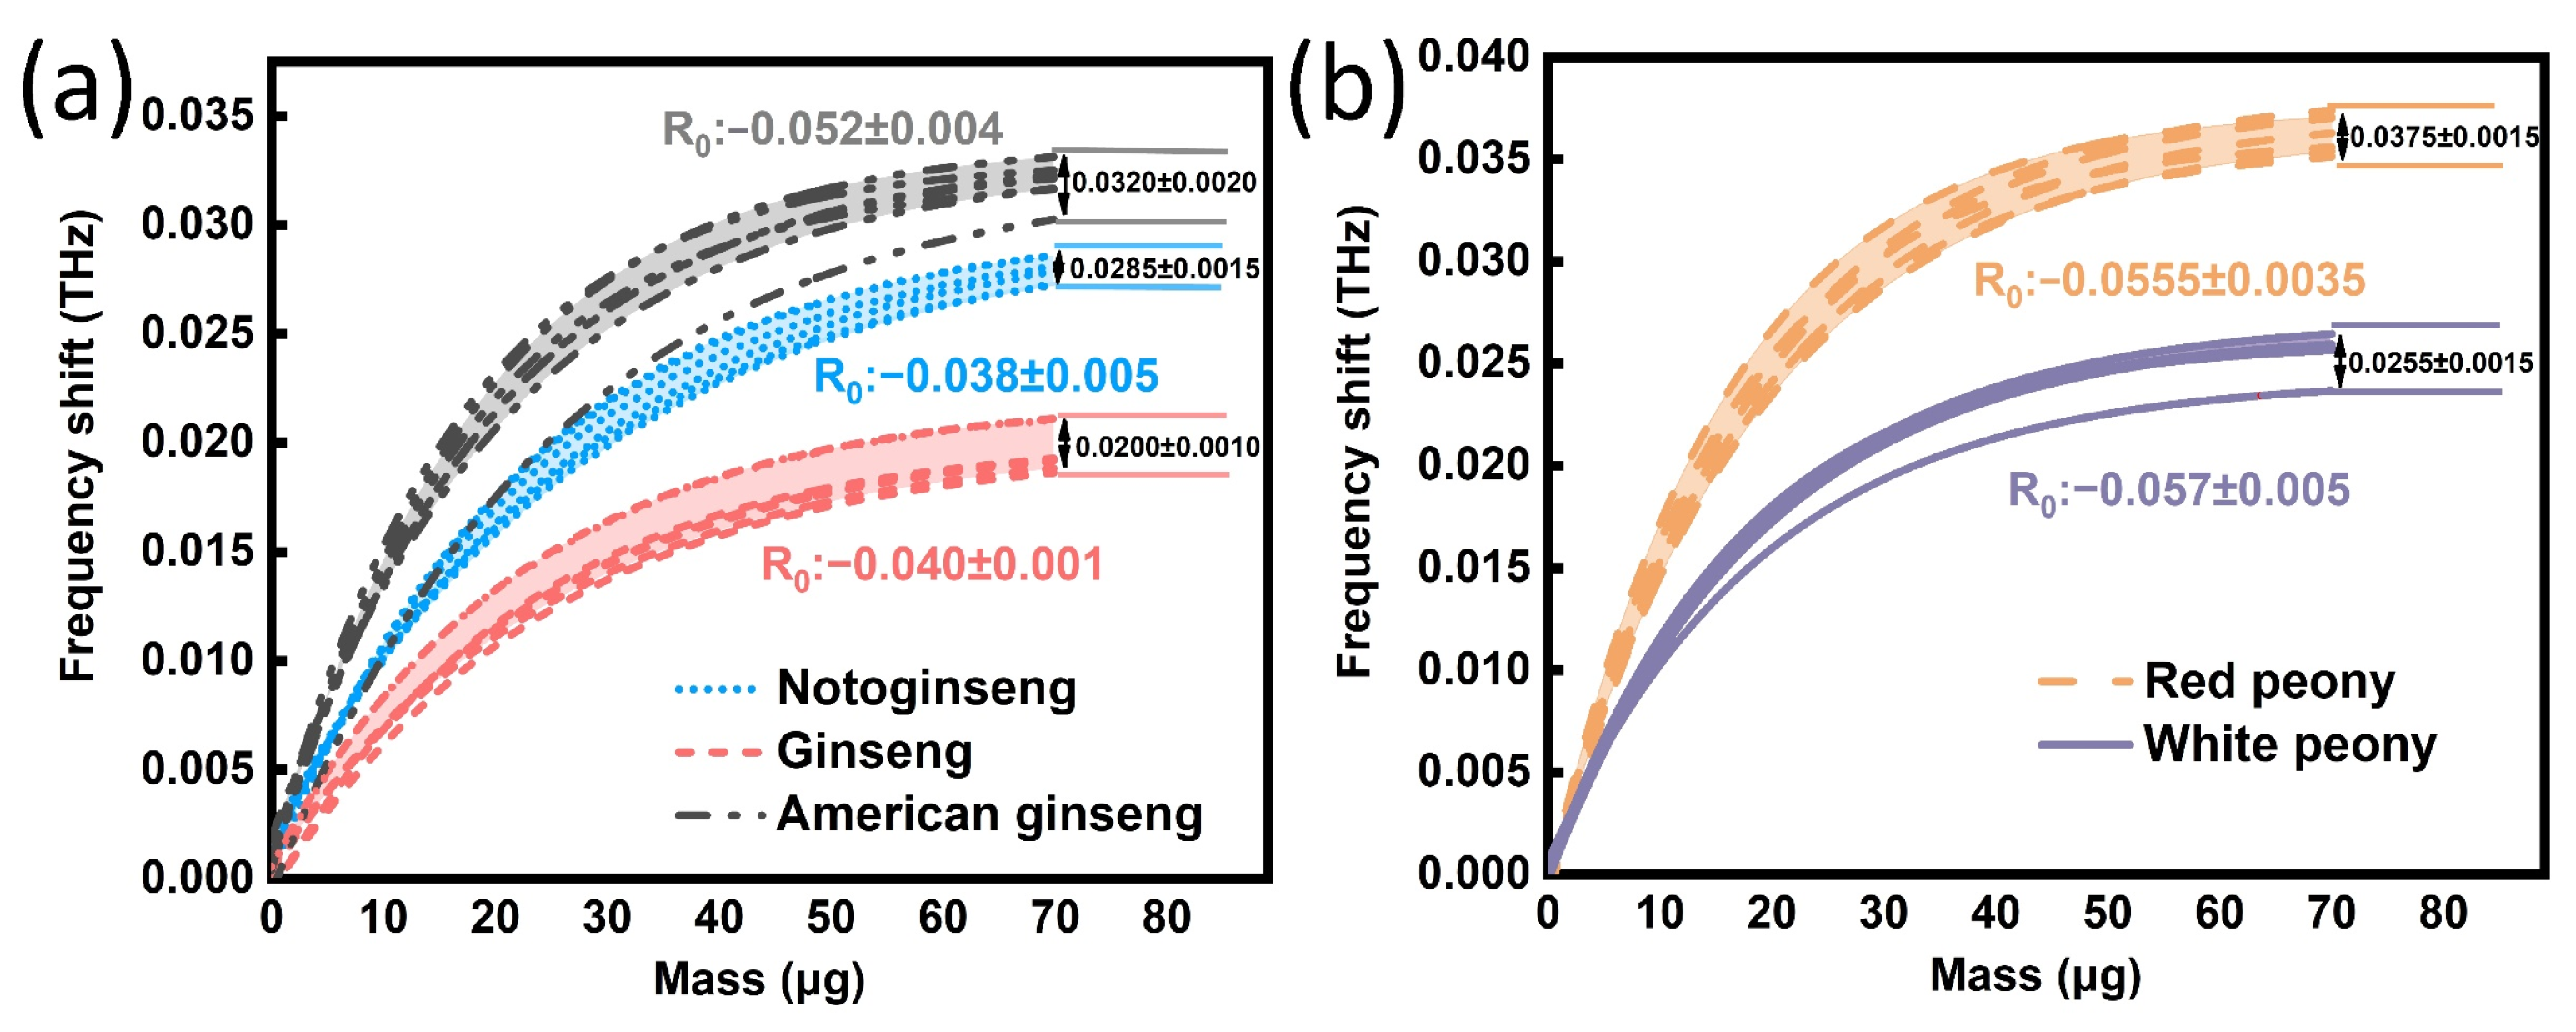
4.2. Method Validation

In order to verify the accuracy and reliability of the method described in Section 4.1, another 40 samples were selected for verification (five kinds as above, eight for each kind). As shown in Figure 8a, the fitting curve of each medicine of the Panax genus all conformed to Equation (1). We determined the fluctuation ranges of the parameters R0 and y0 of American ginseng (R0: −0.048~−0.056, y0: 0.030~0.034), ginseng (R0: −0.039~−0.041, y0: 0.019~0.021) and notoginseng (R0: −0.033~−0.043, y0: 0.027~0.030). Among them, the fitting parameters of seven American ginseng samples, all ginseng and notoginseng samples were consistent with the corresponding fluctuation range in Table 1 of Section 4.1. Here, the accuracy of this method in identifying Panax genus was 95.8%. Figure 8b shows the verification results of Paeonia genus. It was found that the fitting curve of the medicines of the Paeonia genus also conform to Equation (1). We determined the fluctuation ranges of the parameters R0 and y0 of the white peony (R0: −0.052~−0.059, y0: 0.024~0.027) and the red peony (R0: −0.052~−0.062, y0: 0.036~0.039). Among them, the fitting parameters of seven white peony samples and all samples of red peony are consistent with the corresponding fluctuation range in Table 2 of Section 4.1. Here, the accuracy of this method in identifying the Paeonia genus was 94.4%. These results indicate that the nonlinear response curves based on the SPR biosensor can rapidly and accurately identify medicine species. The specific process is as follows. First, the method requires the establishment of a medicine database including different medicine standard curves and parameter fluctuation intervals. Then, the unknown medicine is tested, and the corresponding fitting curves and parameters are obtained. By comparing with the standard curve in the database, an unknown medicine species is identified.

5. Conclusions

In this paper, we proposed a polarization-independent terahertz SPR biosensor. Based on the characteristic that medicines with different dielectric constant can lead to different changes in the equivalent capacitance and inductance of the SPR biosensor, we used the SPR biosensor to identify Panax species and Paeonia species. These nonlinear curves obtained from different Panax species and Paeonia species followed the same fitting function, but their specific fitting parameters were different. According to these rules, the SPR biosensor can realize the identification of Panax genus and Paeonia genus. Compared with traditional methods, this method has fewer experimental steps, less sample demand and a lower detection limit. This provides a new reference for the identification of medicine species.

Author Contributions

S.H. performed experiments, data processing, mathematical modeling and writing the article. C.S. and X.W. designed a terahertz SPR biosensor. Y.P. developed the idea and supervised the project. All authors have read and agreed to the published version of the manuscript.

Funding

This work was supported in part by the Key domestic scientific and technological cooperation projects in Shanghai (21015800200), the National Natural Science Foundation of China (No. 61922059, No. 81961138014, and No. 61805140).

Institutional Review Board Statement

Not applicable.

Informed Consent Statement

Not applicable.

Data Availability Statement

Data underlying the results presented in this paper are not publicly available at this time but may be obtained from the authors upon reasonable request.

Conflicts of Interest

The authors declare no conflict of interest.

References

  1. Wei, G.; Yang, F.; Wei, F.; Zhang, L.; Gao, Y.; Qian, J.; Chen, Z.; Jia, Z.; Wang, Y.; Su, H.; et al. Metabolomes and transcriptomes revealed the saponin distribution in root tissues of Panax quinquefolius and Panax notoginseng. J. Ginseng Res. 2020, 44, 757–769. [Google Scholar] [CrossRef] [PubMed]
  2. Liu, J.; Liu, Y.; Zhao, L.; Zhang, Z.-H.; Tang, Z.-H. Profiling of ginsenosides in the two medicinal Panax herbs based on ultra-performance liquid chromatography-electrospray ionization-mass spectrometry. Springerplus 2016, 5, 1–11. [Google Scholar] [CrossRef] [PubMed] [Green Version]
  3. Yang, K.; Yang, L.; Fan, W.; Long, G.-Q.; Xie, S.-Q.; Meng, Z.-G.; Zhang, G.-H.; Yang, S.-C.; Chen, J.-W. Illumina-based transcriptomic analysis on recalcitrant seeds of Panax notoginseng for the dormancy release during the after-ripening process. Physiol. Plant 2019, 167, 597–612. [Google Scholar] [CrossRef] [PubMed]
  4. Wei, C.C.; Yue, L.F.; You, F.T.; Tao, C. Panax notoginseng saponins alleviate osteoporosis and joint destruction in rabbits with antigen-induced arthritis. Exp. Ther. Med. 2021, 22, 1302. [Google Scholar] [CrossRef] [PubMed]
  5. Fang, X.; Wang, H.; Zhao, L.; Wang, M.; Sun, M. Diversity and structure of the rhizosphere microbial communities of wild and cultivated ginseng. Bmc Microbiol. 2022, 22, 1–12. [Google Scholar] [CrossRef] [PubMed]
  6. Kou, T.; Ye, J.; Wang, J.; Peng, Y.; Wang, Z.; Shi, C.; Wu, X.; Hu, X.; Chen, H.; Zhang, L.; et al. Terahertz Spectroscopy for Accurate Identification of Panax quinquefolium Basing on Nonconjugated 24(R)-Pseudoginsenoside F-11. Plant Phenomics 2021, 2021, 6793457. [Google Scholar] [CrossRef]
  7. Liu, S.; Wang, X.; Ding, N.; Liu, Y.; Li, N.; Ma, Y.; Zhao, J.; Wang, Z.; Li, X.; Fu, X.; et al. Nucleotide Sequence Variation in Long-Term Tissue Cultures of Chinese Ginseng (Panax ginseng C. A. Mey.). Plants 2022, 11, 79. [Google Scholar] [CrossRef]
  8. Liu, J.; Dong, Q.; Du, G.; Wang, J.; An, Y.; Liu, J.; Su, J.; Xie, H.; Yin, J. Identification of metabolites in plasma related to different biological activities of Panax ginseng and American ginseng. Rapid Commun. Mass Spectrom. 2022, 36, e9219. [Google Scholar] [CrossRef]
  9. Peters, J.D.J.; Griscom, H.P. Highlighting an Overlooked Hotspot for American Ginseng (Panax quinquefolius) in Virginia. Nat. Areas J. 2022, 42, 109–119. [Google Scholar] [CrossRef]
  10. Zheng, Z.; Zheng, Y.; Luo, Y.; Yi, Z.; Zhang, J.; Liu, Z.; Yang, W.; Yu, Y.; Wu, X.; Wu, P. A switchable terahertz device combining ultra-wideband absorption and ultra-wideband complete reflection. Phys. Chem. Chem. Phys. 2022, 24, 2527–2533. [Google Scholar] [CrossRef]
  11. Huang, Z.Q.; Gao, M.J.; Zhu, L.; Feng, G.Q.; Ma, N. Fingerprint identification of panax notoginseng flower, panax ginseng flower and panax quinquefolium fower based on hplc and nirs technology. Basic Clin. Pharmacol. Toxicol. 2019, 125, 4–5. [Google Scholar]
  12. Tao, L.J.; Zhang, Q.; Feng, Y.G.; College, M. Identification of Radix ginseng., Radix panacis quinquefolii., Radix Notoginseng. and Radix ginseng rubra. by Themogravimetric/Differential Thermal Analysis. Ginseng Res. 2019, 31, 5. [Google Scholar] [CrossRef]
  13. Peng, Y.; Shi, C.; Xu, M.; Kou, T.; Wu, X.; Song, B.; Ma, H.; Guo, S.; Liu, L.; Zhu, Y. Qualitative and Quantitative Identification of Components in Mixture by Terahertz Spectroscopy. Ieee Trans. Terahertz Sci. Technol. 2018, 8, 696–701. [Google Scholar] [CrossRef]
  14. Peng, Y.; Shi, C.; Wu, X.; Zhu, Y.; Zhuang, S.J. Terahertz Imaging and Spectroscopy in Cancer Diagnostics: A Technical Review. BME Front. 2020, 1, 11. [Google Scholar] [CrossRef]
  15. da Silva, I.J.G.; Raimundo, I.M.; Mizaikoff, B. Analysis of sugars and sweeteners via terahertz time-domain spectroscopy. Anal. Methods 2022, 14, 2657–2664. [Google Scholar] [CrossRef]
  16. Tang, Z.M.; Deng, H.; Liu, Q.C.; Guo, J.; Shang, L.P. Quantitative analysis of low-concentration alpha-HMX based on terahertz spectroscopy. Anal. Methods 2020, 12, 5684–5690. [Google Scholar] [CrossRef]
  17. Kang, C.; Kim, S.; Lee, E.; Ryu, J.; Lee, M.; Kwon, Y. Genetically Encoded Sensor Cells for the Screening of Glucocorticoid Receptor (GR) Effectors in Herbal Extracts. Biosensors 2021, 11, 341. [Google Scholar] [CrossRef]
  18. Al-Naib, I. Terahertz Asymmetric S-Shaped Complementary Metasurface Biosensor for Glucose Concentration. Biosensors 2022, 12, 609. [Google Scholar] [CrossRef]
  19. Wei, A.-J.; Zhou, Z.-H.; Liu, S.-J.; Zuo, J.; Zhang, C.-L. Analytical method for studying terahertz vibrations in different ginseng. In Proceedings of the International Conference on Optical Instruments and Technology-IRMMW-THz Technologies and Applications, Beijing, China, 26–28 October 2019. [Google Scholar]
  20. Shao, Y.; Zhu, D.; Wang, Y.; Zhu, Z.; Tang, W.; Tian, Z.; Peng, Y.; Zhu, Y. Moxa Wool in Different Purities and Different Growing Years Measured by Terahertz Spectroscopy. Plant Phenomics 2022, 2022, 9815143. [Google Scholar] [CrossRef]
  21. Yang, S.; Zuo, J.; Liu, S.-J.; Zhang, C.-L. Application of Terahertz Spectroscopy in the Detection of Chinese Medicine Processed Drugs of Rhubarb. Spectrosc. Spectr. Anal. 2016, 36, 3870–3874. [Google Scholar] [CrossRef]
  22. Zhu, J.; Jiang, S.; Xie, Y.; Li, F.; Du, L.; Meng, K.; Zhu, L.; Zhou, J. Enhancing terahertz molecular fingerprint detection by a dielectric metagrating. Opt. Lett. 2020, 45, 2335–2338. [Google Scholar] [CrossRef] [PubMed]
  23. Wu, X.; Zheng, Y.; Luo, Y.; Zhang, J.; Yi, Z.; Wu, X.; Cheng, S.; Yang, W.; Yu, Y.; Wu, P. A four-band and polarization-independent BDS-based tunable absorber with high refractive index sensitivity. Phys. Chem. Chem. Phys. 2021, 23, 26864–26873. [Google Scholar] [CrossRef] [PubMed]
  24. Nitika; Kaur, J.; Khanna, R. Novel monkey-wrench-shaped microstrip patch sensor for food evaluation and analysis. J. Sci. Food Agric. 2022, 102, 1443–1456. [Google Scholar] [CrossRef] [PubMed]
  25. Deng, X.; Shen, Y.; Liu, B.; Song, Z.; He, X.; Zhang, Q.; Ling, D.; Liu, D.; Wei, D. Terahertz Metamaterial Sensor for Sensitive Detection of Citrate Salt Solutions. Biosensors 2022, 12, 408. [Google Scholar] [CrossRef]
  26. Chung, J.W.; Kim, S.D.; Bernhardt, R.; Pyun, J.C. Application of SPR biosensor for medical diagnostics of human hepatitis B virus (hHBV). Sens. Actuators B Chem. 2005, 111, 416–422. [Google Scholar] [CrossRef]
  27. Funano, S.-i.; Ota, N.; Tanaka, Y. A simple and reversible glass-glass bonding method to construct a microfluidic device and its application for cell recovery. Lab A Chip 2021, 21, 2244–2254. [Google Scholar] [CrossRef]
  28. Tang, C.; Yang, J.; Wang, Y.; Cheng, J.; Li, X.; Chang, C.; Hu, J.; Lu, J. Integrating terahertz metamaterial and water nanodroplets for ultrasensitive detection of amyloid beta aggregates in liquids. Sens. Actuators B Chem. 2021, 329, 129113. [Google Scholar] [CrossRef]
  29. Wang, D.; Yi, Z.; Ma, G.; Dai, B.; Yang, J.; Zhang, J.; Yu, Y.; Liu, C.; Wu, X.; Bian, Q. Two-channel photonic crystal fiber based on surface plasmon resonance for magnetic field and temperature dual-parameter sensing. Phys. Chem. Chem. Phys. 2022, 24, 21233–21241. [Google Scholar] [CrossRef]
  30. Shangguan, Q.; Chen, Z.; Yang, H.; Cheng, S.; Yang, W.; Yi, Z.; Wu, X.; Wang, S.; Yi, Y.; Wu, P. Design of Ultra-Narrow Band Graphene Refractive Index Sensor. Sensors 2022, 22, 6483. [Google Scholar] [CrossRef]
  31. Gu, H.; Shi, C.; Wu, X.; Peng, Y. Molecular methylation detection based on terahertz metamaterial technology. Analyst 2020, 145, 6705–6712. [Google Scholar] [CrossRef]
  32. Yan, P.; Wanqing, C.; Yiming, Z. Identification of biomarker (L-2HG) in real human brain glioma by terahertz spectroscopy. In Proceedings of the 2018 Conference on Lasers and Electro-Optics (CLEO 2018), San Jose, CA, USA, 13–18 May 2018. [Google Scholar]
  33. Yang, N.; Wang, Y.; Li, L.; Ren, Y.; He, Z.; Cui, W.; Yang, Z.; Lu, S.; Wu, X.; Bai, L. Multiple poles resonances coupling with high sensitivity sensing for multiple bulging black phosphorus-based metasurface. N. J. Phys. 2023, 25, 013034. [Google Scholar] [CrossRef]
  34. Weng, X.; Mao, Z.; Fu, H.-M.; Chen, Y.-P.; Guo, J.-S.; Fang, F.; Xu, X.-W.; Yan, P. Biofilm formation during wastewater treatment: Motility and physiological response of aerobic denitrifying bacteria under ammonia stress based on surface plasmon resonance imaging. Bioresour. Technol. 2022, 361, 127712. [Google Scholar] [CrossRef] [PubMed]
  35. Chen, H.; Chen, Z.; Yang, H.; Wen, L.; Yi, Z.; Zhou, Z.; Dai, B.; Zhang, J.; Wu, X.; Wu, P. Multi-mode surface plasmon resonance absorber based on dart-type single-layer graphene. Rsc Adv. 2022, 12, 7821–7829. [Google Scholar] [CrossRef] [PubMed]
Figure 1. Simulation results of different element biosensor designs under different polarization angles. (ac) Structure diagram of the same opening direction, corresponding frequency shift and electric field distribution. (df) Structure diagram of SPR biosensor with axisymmetric orientation opening, corresponding frequency shift and electric field distribution (gi) Structure diagram of SPR biosensor with random direction of opening, corresponding frequency shift and electric field distribution. (jl) Structure diagram of SPR biosensor with open center symmetry, corresponding frequency shift and electric field distribution.
Photonics 10 00250 g001
Figure 2. Polarization-independent THz SPR biosensor. (a) Structural unit parameters of the SPR biosensor. (b) Theoretical response spectra of the THz SPR biosensor.
Photonics 10 00250 g002
Figure 3. Theoretical calculation of THz SPR biosensor for materials with different dielectric constants. (ac) Schematic diagram of calculation model. (df) Theoretical results of different dielectric constant samples for THz SPR biosensors. (gi) Corresponding frequency shift as a function of different sample thickness.
Photonics 10 00250 g003
Figure 4. (ac) Absorption spectra of biosensor with notoginseng, ginseng and American ginseng at different angles. The illustration in (a) shows an example of a biosensor divided into 6 areas on average. (d) Frequency shift changes of notoginseng, ginseng and American ginseng biosensors with angle change.
Photonics 10 00250 g004
Figure 5. (a) Schematic diagram of THz SPR biosensor processing. (b) Microscope image of SPR biosensor structure. (c) Experimental response spectra of the THz SPR biosensor. (d) Schematic diagram of sample preparation process before test.
Photonics 10 00250 g005
Figure 6. Experimental results of THz SPR biosensor for notoginseng, ginseng and American ginseng. (ac) Sample images. (df) Test results of notoginseng, ginseng and American ginseng on THz SPR biosensor. (gi) Corresponding frequency shift of mass function of notoginseng, ginseng and American ginseng. Each data set is marked with a standard deviation.
Photonics 10 00250 g006
Figure 7. Experimental results of THz SPR biosensor for white peony and red peony. (a,b) Sample images. (c,d) Test results of white peony and red peony on THz SPR biosensor. (e,f) Corresponding frequency shift of mass function of white peony and red peony. Each data set is marked with a standard deviation.
Photonics 10 00250 g007
Figure 8. Verification results of method. (a) Test results of Panax genus. (b) Test results of Paeonia genus.
Photonics 10 00250 g008
Table 1. Parameters values corresponding to the fitting curves of notoginseng, ginseng and American ginseng.
y0AR0
Notoginseng0.028 ± 0.0020.028 ± 0.002−0.040 ± 0.007
Ginseng0.020 ± 0.0010.020 ± 0.001−0.043 ± 0.004
American ginseng0.033 ± 0.0010.033 ± 0.001−0.052 ± 0.004
Table 2. Parameters values corresponding to the fitting curves of white peony and red peony.
y0AR0
White peony 0.027 ± 0.001−0.027 ± 0.001−0.055 ± 0.005
Red peony 0.037 ± 0.0020.038 ± 0.002−0.060 ± 0.009
Disclaimer/Publisher’s Note: The statements, opinions and data contained in all publications are solely those of the individual author(s) and contributor(s) and not of MDPI and/or the editor(s). MDPI and/or the editor(s) disclaim responsibility for any injury to people or property resulting from any ideas, methods, instructions or products referred to in the content.

