Communication

Optical Chirality of Gold Chiral Helicoid Nanoparticles in the Strong Coupling Region

1
State Key Laboratory of Information Photonics and Optical Communications, School of Science, Beijing University of Posts and Telecommunications, Beijing 100876, China
2
State Key Laboratory for Artificial Microstructures and Mesoscopic Physics, School of Physics, Peking University, Beijing 100871, China
*
Authors to whom correspondence should be addressed.
Photonics 2023, 10(3), 251; https://doi.org/10.3390/photonics10030251
Submission received: 19 January 2023 / Revised: 16 February 2023 / Accepted: 22 February 2023 / Published: 27 February 2023

Abstract

:
The far- and near-field chirality properties are usually characterized by circular dichroism (CD) and optical chirality (OC), respectively. As a light–matter interaction for the hybrid states consisting of plasmons and excitons, the strong coupling interactions can affect the original chiral electromagnetic modes. However, there are few works on this influence process, which prevents an in-depth understanding of chirality. Here, we theoretically investigate both the far-field and near-field characteristics of the chiral plasmonic gold helicoid nanoparticle (GHNP) to explore the chirality mechanism further. We found that the electromagnetic field distribution of GHNP consists of one dark mode and two bright modes. The dark mode is observed more clearly in CD than in extinction spectra. Two bright modes can strongly couple with excitons respectively, which is confirmed by the anticrossing behavior and mode splitting exhibited in the extinction and CD spectra. We also analyzed the near-field OC distribution of the GHNP hybrid system and obtained the chiral responses as well as the spectral correspondence between OC and CD. Furthermore, although the strong coupling interaction changes the energy levels, resulting in mode splitting, the chiral hotspot distributions of both the upper polariton branch and lower polariton branch are consistent with the original bright mode in OC maps. Our findings provide guidance for the design of structures with strong chiral responses and enhance the comprehension of chiral strong coupling systems.

1. Introduction

Chirality, a fundamental property of objects widely found in nature, means that the object cannot be coincident with its mirror image by translation and rotation [1]. In recent years, chiral plasmonic nanostructures and metamaterials have received extensive attention and development [2,3]. They have excellent optical manipulation capabilities, such as asymmetric transmission [4], polarization control [5], and negative refractive index [6], and they can be applied in chiral catalysis [7,8], chiral sensing [9,10], pharmaceuticals [11], and other optical devices [12,13]. Up to now, specific chiral plasmonic particles could be synthesized by various methods according to the needs of different applications, such as DNA biotemplates [14], FIB milling [15], and the wet chemical method [16]. It is worth noting that K. T. Nam et al. excogitated a chemical-directed synthesis to prepare 432 helicoid III nanoparticles, which has pioneering significance in how to induce precise chiral growth at the nanoscale [17,18]. Furthermore, this structure has abundant electromagnetic modes, and its representative three-dimensional complex chirality remains to be researched.
The prepared nanostructures can form hybrid systems consisting of plasmons and excitons through light–matter interactions. If this interaction between plasmons and excitons caused by the energy exchange is stronger than their individual dissipation, then the energy levels responsible for the emission are also changed and the system attains a strong coupling regime. This results in a hybrid state, which exhibits half-light and half-material properties [19,20]. Because of the driving role of chiral light–matter interactions in the field of chiral quantum optics [21,22] and the possibility of adding a new dimension to the control of light–matter interactions [23], recent studies of this hybrid coupled system, especially the strong coupling regime, have turned to focus on chiral nanostructures [24,25]. Related works no longer focus only on the achiral spectroscopy characteristics of the hybrid systems [26]. Moreover, the chiral responses are advantageous for accurately distinguishing hybrid modes in those systems that support multiple adjacent modes [27]. In addition, the chiral-controlled optical phenomena can be significantly enhanced by utilizing light–matter interactions in the plasmonic nanostructures, which is important for future highly integrated on-chip plasmonic nanocircuits [28,29,30], plasmonic biosensing [31,32], and the design of numerous chiral devices [33].
Chiral structures can exhibit specific phenomena illuminated with circularly polarized light. A traditional tool for researching chiral optical response is circular dichroism (CD) spectroscopy, which is derived from the different extinction cross-sections of chiral objects to left-handed (LCP) and right-handed circularly polarized (RCP) light [34]. It indicates that CD characterizes the far-field property. In addition, some research shows that localized electromagnetic fields on chiral plasmonic nanostructures can generate strong superchiral near fields, i.e., optical chirality (OC) fields [35,36]. This near-field effect has been widely applied for high-sensitivity chiral sensing [37,38] and has great advantages on chiral source analysis, which is helpful for future chiral structural design. However, the change of chiral electromagnetic modes affected by the strong light–matter interactions has yet to be discussed.
In this paper, we use the commercial software COMSOL Multiphysics to analyze both the far-field and near-field chiral characteristics of the chiral plasmonic gold helicoid nanoparticle (GHNP) in the strong coupling region. By investigating the distribution of the electric field and OC maps, we found that the electromagnetic modes of the GHNP contain one dark mode and two bright modes. The dark mode exists as a localized field and is not observed easily in far-field but is more apparent in CD than in extinction spectra. Each bright mode can be strongly coupled with excitons. Anticrossing behavior and mode splitting are exhibited in both extinction and CD spectra. Furthermore, we analyze the near-field properties of the GHNP hybrid system. The energy exchange process involved in the strong coupling can cause mode splitting, but the chiral hotspot distribution of both the upper polariton branch and lower polariton branch is consistent with the original bright mode in OC maps. Our research helps to understand chiral optics and contributes to designing nanoparticles with unique optical properties based on application requirements.

2. Results and Discussion

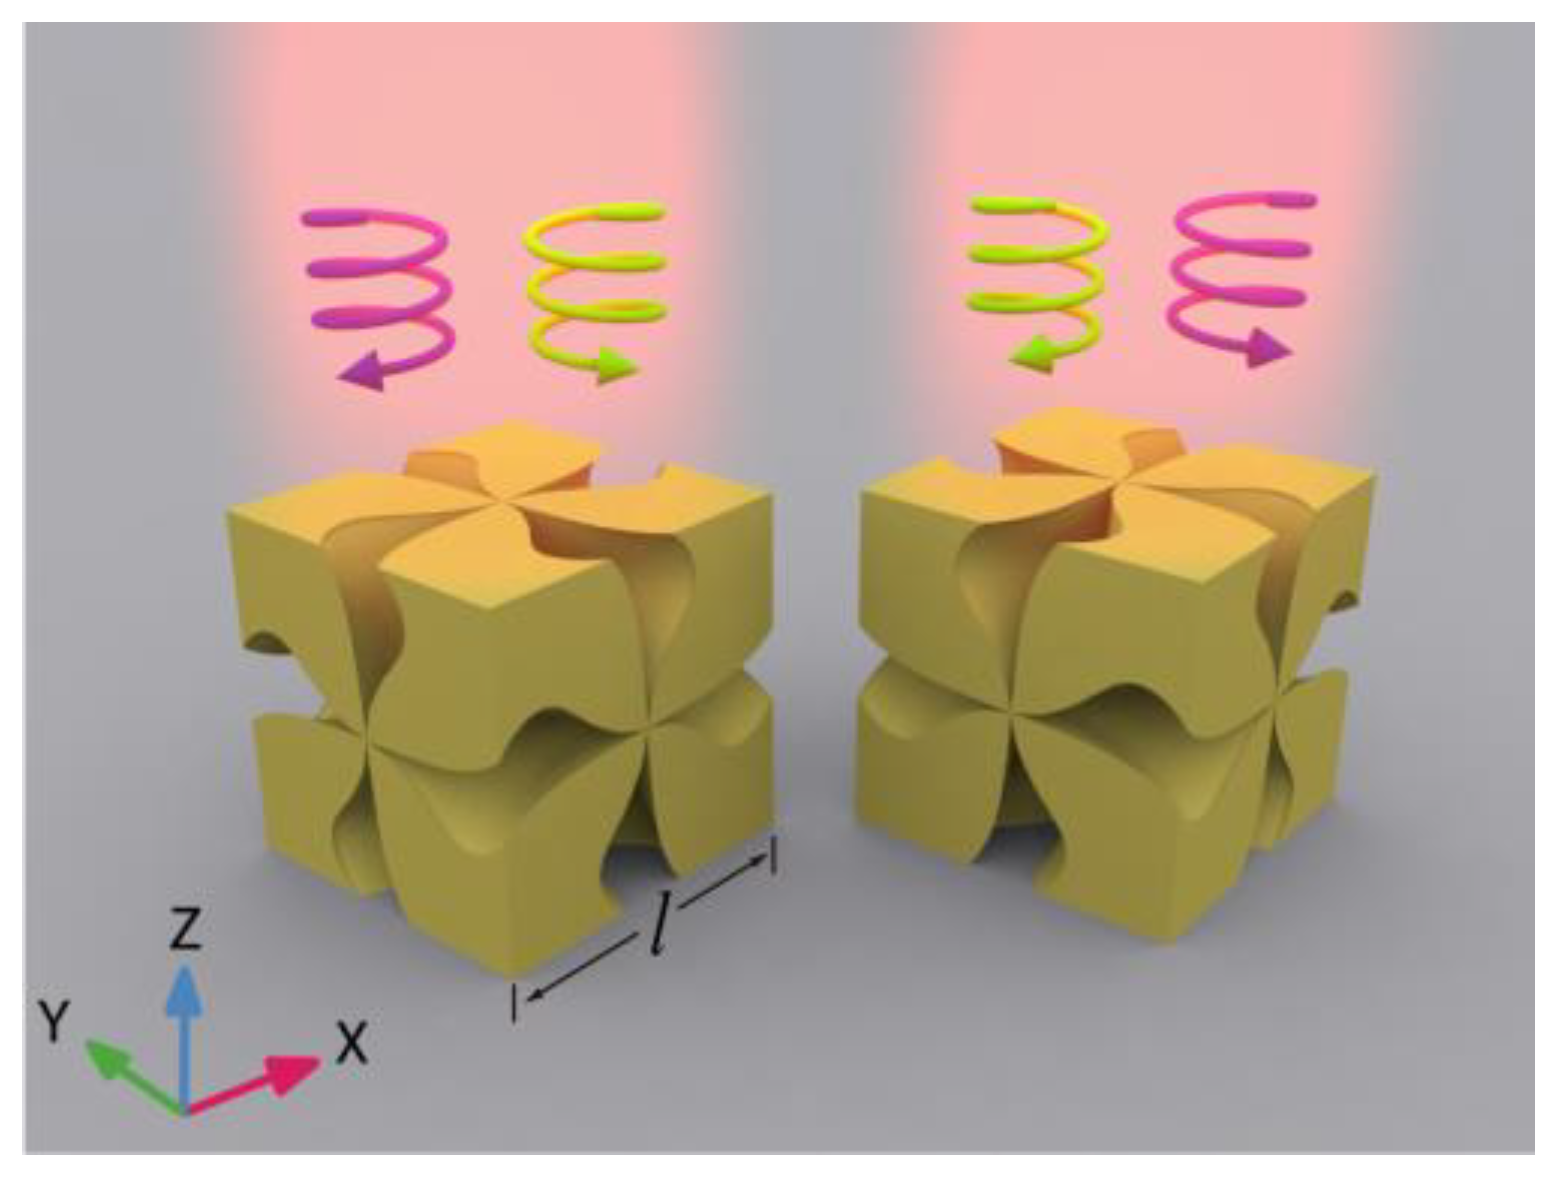
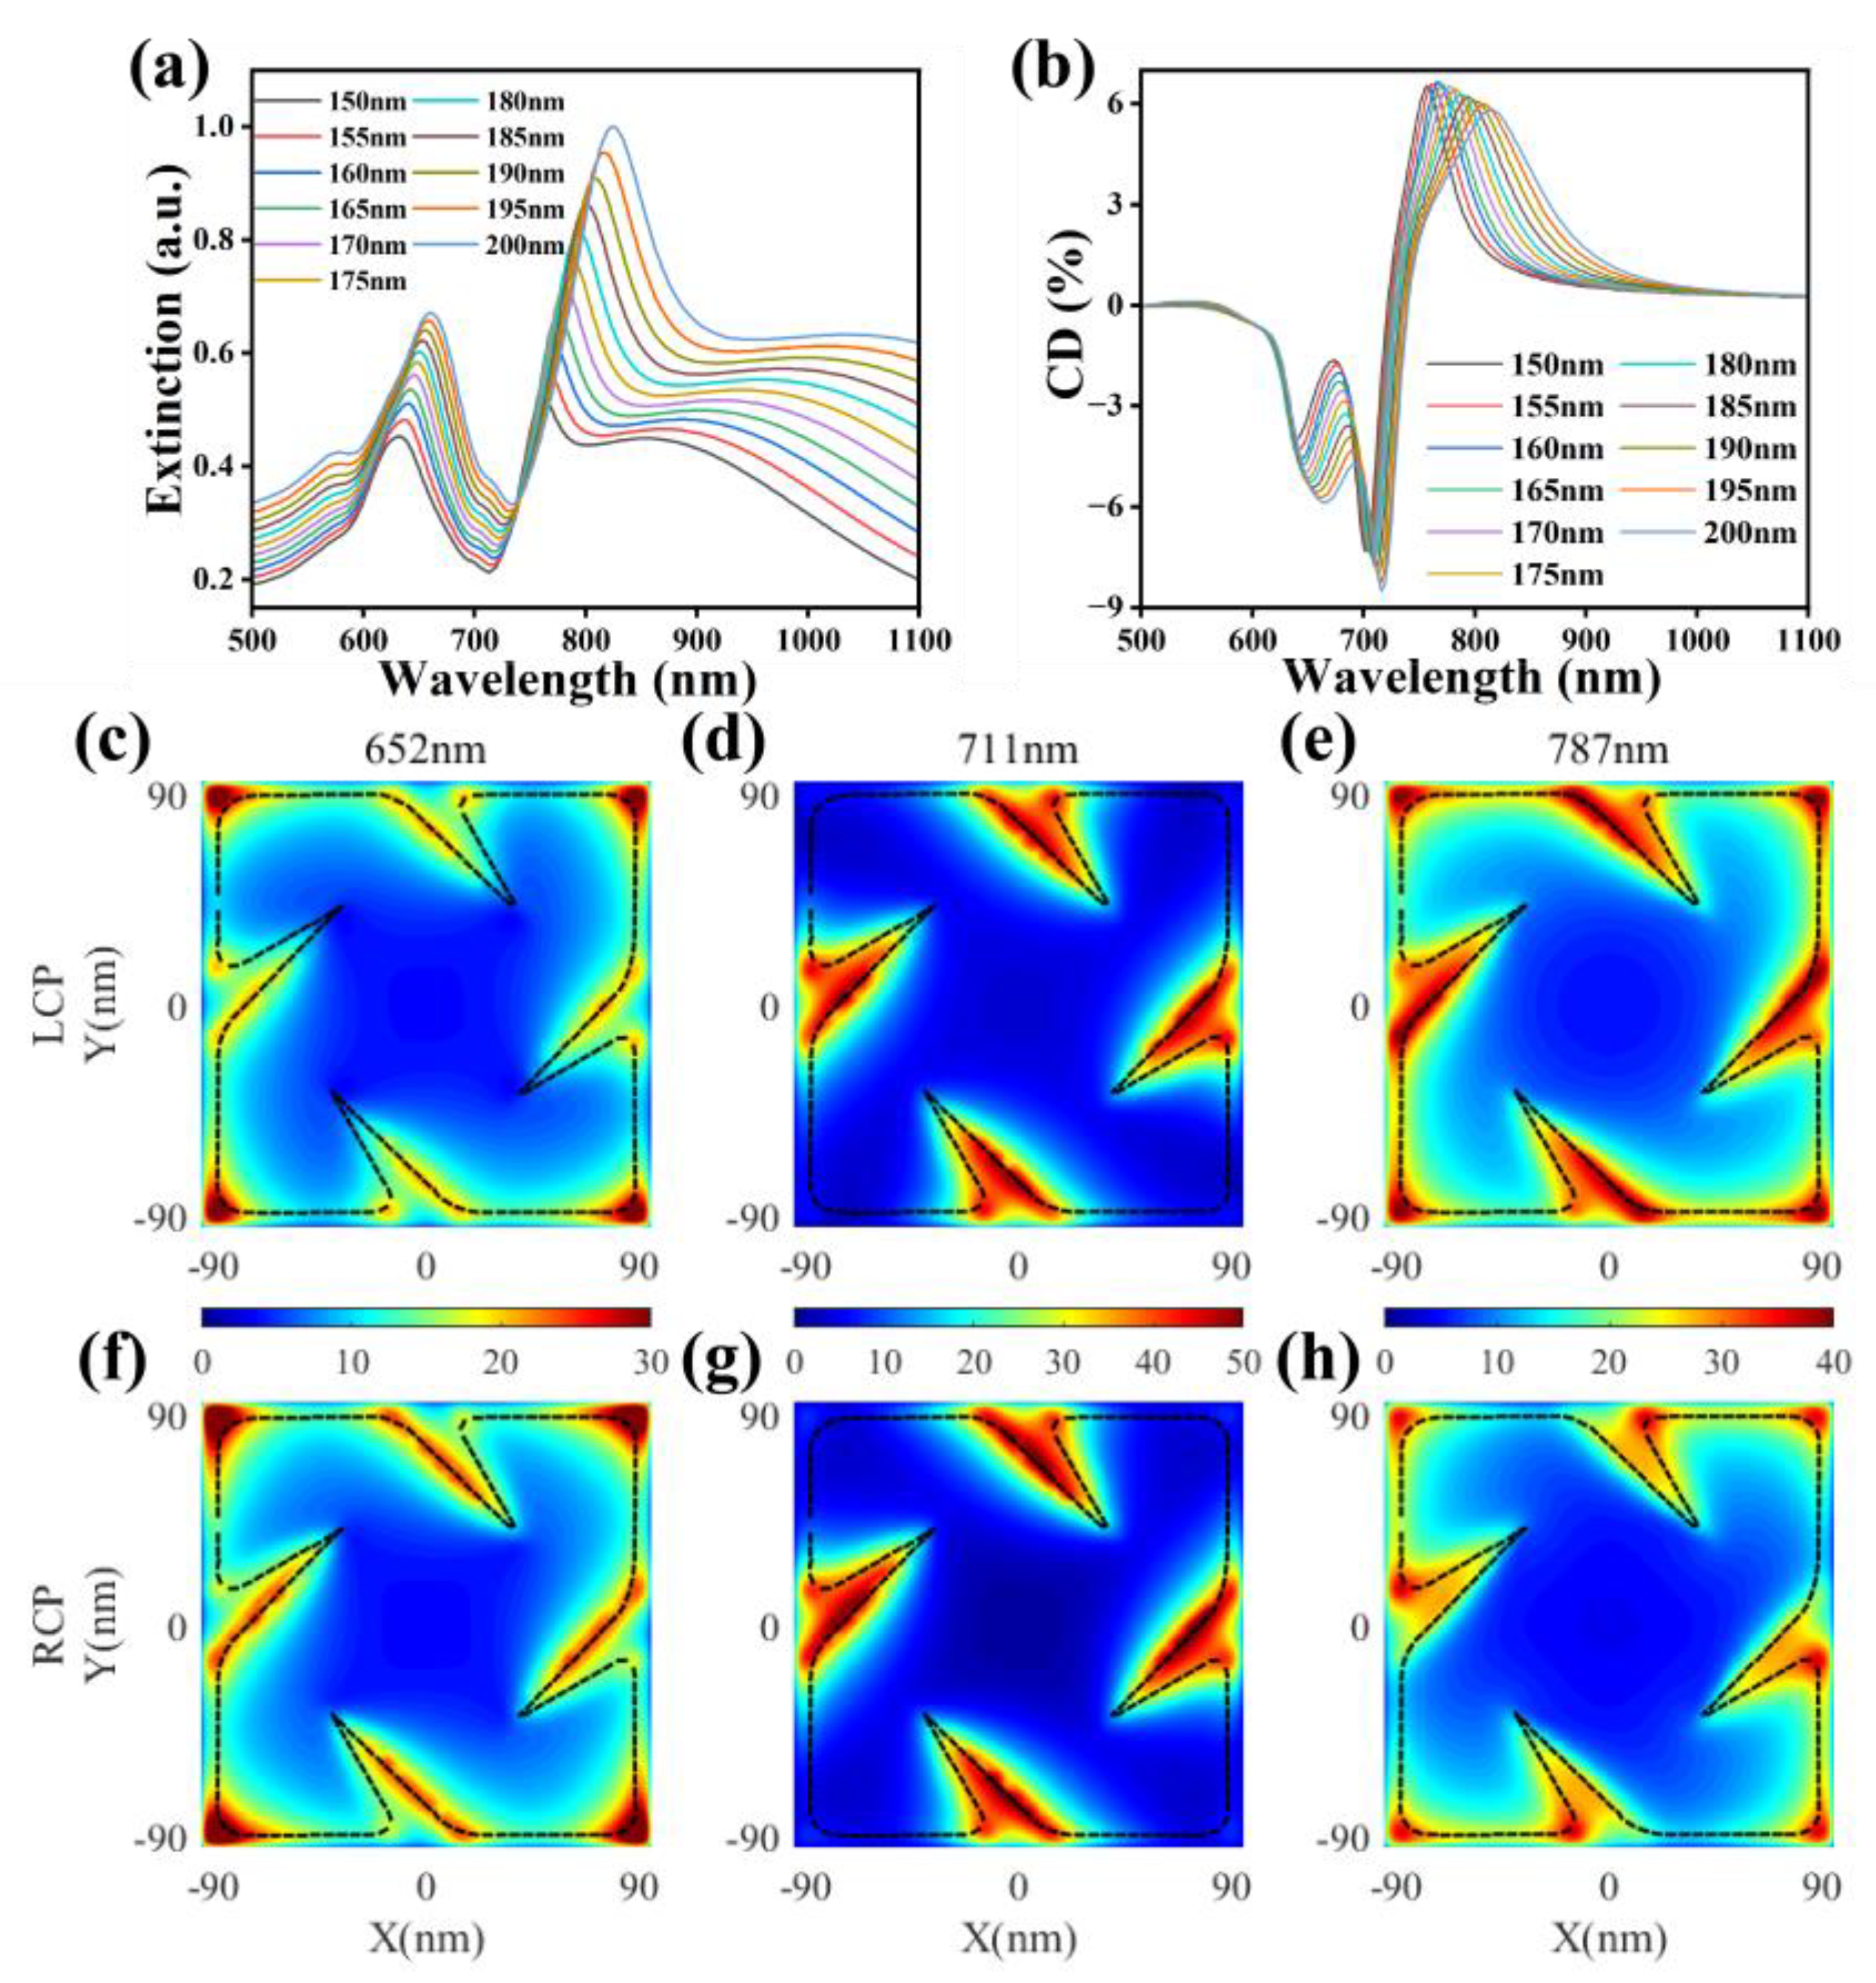
2.1. Modes Analysis and Chirality of the Single GHNP

As shown in Figure 1, the GHNP has pinwheel-like structures distributed on each of the six faces of the cubic geometry, which contains four arms of increasing width. A gap can be created between every two adjacent arms, and the arms can evolve in opposite directions, resulting in two types of chiral structures (L-handed and R-handed) exhibited in the illustration. Because these two structures present contrary chiral optical responses illuminated with the same polarized incident light, we mainly discuss L-handed GHNP for simplicity. In this paper, the triangular gap shape is adopted because of the limitations of modeling and calculation during simulation. The side length l of GHNP varies from 150 to 200 nm. It is worth noting that several different shapes can be obtained in other synthesis processes involving this nanoparticle. Their main differences are reflected in gap shapes such as triangular, rectangular, and curved. However, all these models can successfully reproduce the spectral characteristic observed in experiments [17]. Our research applies to all these structures and the details of the simulation can be seen in Appendix A.
In order to explore the spectral characteristics and electromagnetic field distribution of a single GHNP, we simulated the extinction spectra as a function of the incident light wavelength and nanoparticle side length l, as shown in Figure 2a. The figure indicates that the GHNP has two main resonant peaks representing two kinds of electromagnetic field modes. By adjusting side length l, the linear tuning of resonance position can be achieved. With side length l varying in the range of 150–200 nm, these two resonant peaks present a red shift from 632 nm to 661 nm and 761 nm to 825 nm, respectively. This is because the ability to confine the electromagnetic field to the surface of the particles decreases as the size of nanoparticles increases. These retardation effects, combined with extrinsic-size effects, cause a red shift phenomenon [39]. Figure 2b describes the CD spectra as a function of the incident light wavelength and nanoparticle side length l. It is worth noting that the chiral optical responses of GHNP show an additional mode compared with extinction spectra. Along with the tuning of side length l, the resonance positions 640 nm, 701 nm, and 757 nm present redshifts from 640 nm to 666 nm, 701 nm to 716 nm, and 757 nm to 815 nm, respectively. Figure 2c–h display the distribution of the electric field corresponding to these positions (652 nm, 711 nm, and 787 nm) in the CD spectra when side length l = 180 nm, where Figure 2c–e represent the LCP incidence and Figure 2f–h represent the RCP incidence. The dashed line indicates the outline of the bottom surface of the GHNP. Figure 2c,f show that the electric field mainly concentrates in the vertex of the cubic geometry, and the responses of RCP in gaps are slightly stronger than that of LCP. This mode is a bright mode that is defined as the vertex mode. Figure 2d,g show that the electric field mainly concentrates in the gap region, and there is no obvious difference between LCP and RCP incidence. This mode is a dark mode that is defined as the gap mode. It exists as a localized field and is not observed easily in the far field but is more apparent in CD than in extinction spectra. The electric field distribution of the remaining mode concentrates in both vertex and gap regions, as shown in Figure 2e,h. It is the result of the interaction from both parts, so it is a bright mode defined as the mixed mode, and the overall responses of LCP are stronger than that of RCP. It is worth noting that these three modes are all analyzed for the individual GHNP, so they are localized modes generated by charge-density oscillations rather than delocalized Bragg modes generated by collective oscillations of free electrons [40,41,42].
In addition, we theoretically investigate the near-field characteristics of the single GHNP. The density of optical chirality, which also is referred to as local OC, is important in analyzing near-field electromagnetic modes, and its much simpler equation is as follows [43]:
OC = ε 0 ω 2 I m E * · B ,
where ε 0 is the permittivity of free space, ω is the angular frequency, E and B denote the complex electric and magnetic field, respectively. OC describes the degree to which the electric and magnetic field vectors E and B wrap around a helical axis at each point in space [44]. The origin of the large chiral optical response generated by GHNP can be figured out by connecting near-field OC and far-field CD. On the bottom surface of the particle facing away from the direction of the incident light, we calculate the integral of OC illuminated with LCP and RCP. Figure 3a indicates their difference and CD spectra of a single GHNP when side length l = 150 nm. We can discover that both spectral lines have similar resonance positions, revealing a marked correspondence between these two fields. Figure 3b–g indicate the OC distribution on the integral surface at different resonance positions shown in Figure 3a, 608 nm, 665 nm, and 704 nm, with LCP incidence (Figure 3b–d) and RCP incidence (Figure 3e–g). The OC maps exhibit chiral hotspots mainly concentrating in the gap region and diffusing from the gap to the interior. When the incident light wavelength is 608 nm and 665 nm, the overall intensity of the OC field with RCP incidence is stronger than that with LCP incidence. In comparison, the opposite trend is shown at the incident light wavelength of 704 nm. More importantly, when comparing these OC distributions with the electric fields shown in Figure 2, we find that the distribution of chiral hotspots differs from the regions where the electromagnetic field is highest. This means that the chiral responses of GHNP are mainly determined by the asymmetric structure rather than the effect of electric field enhancement.

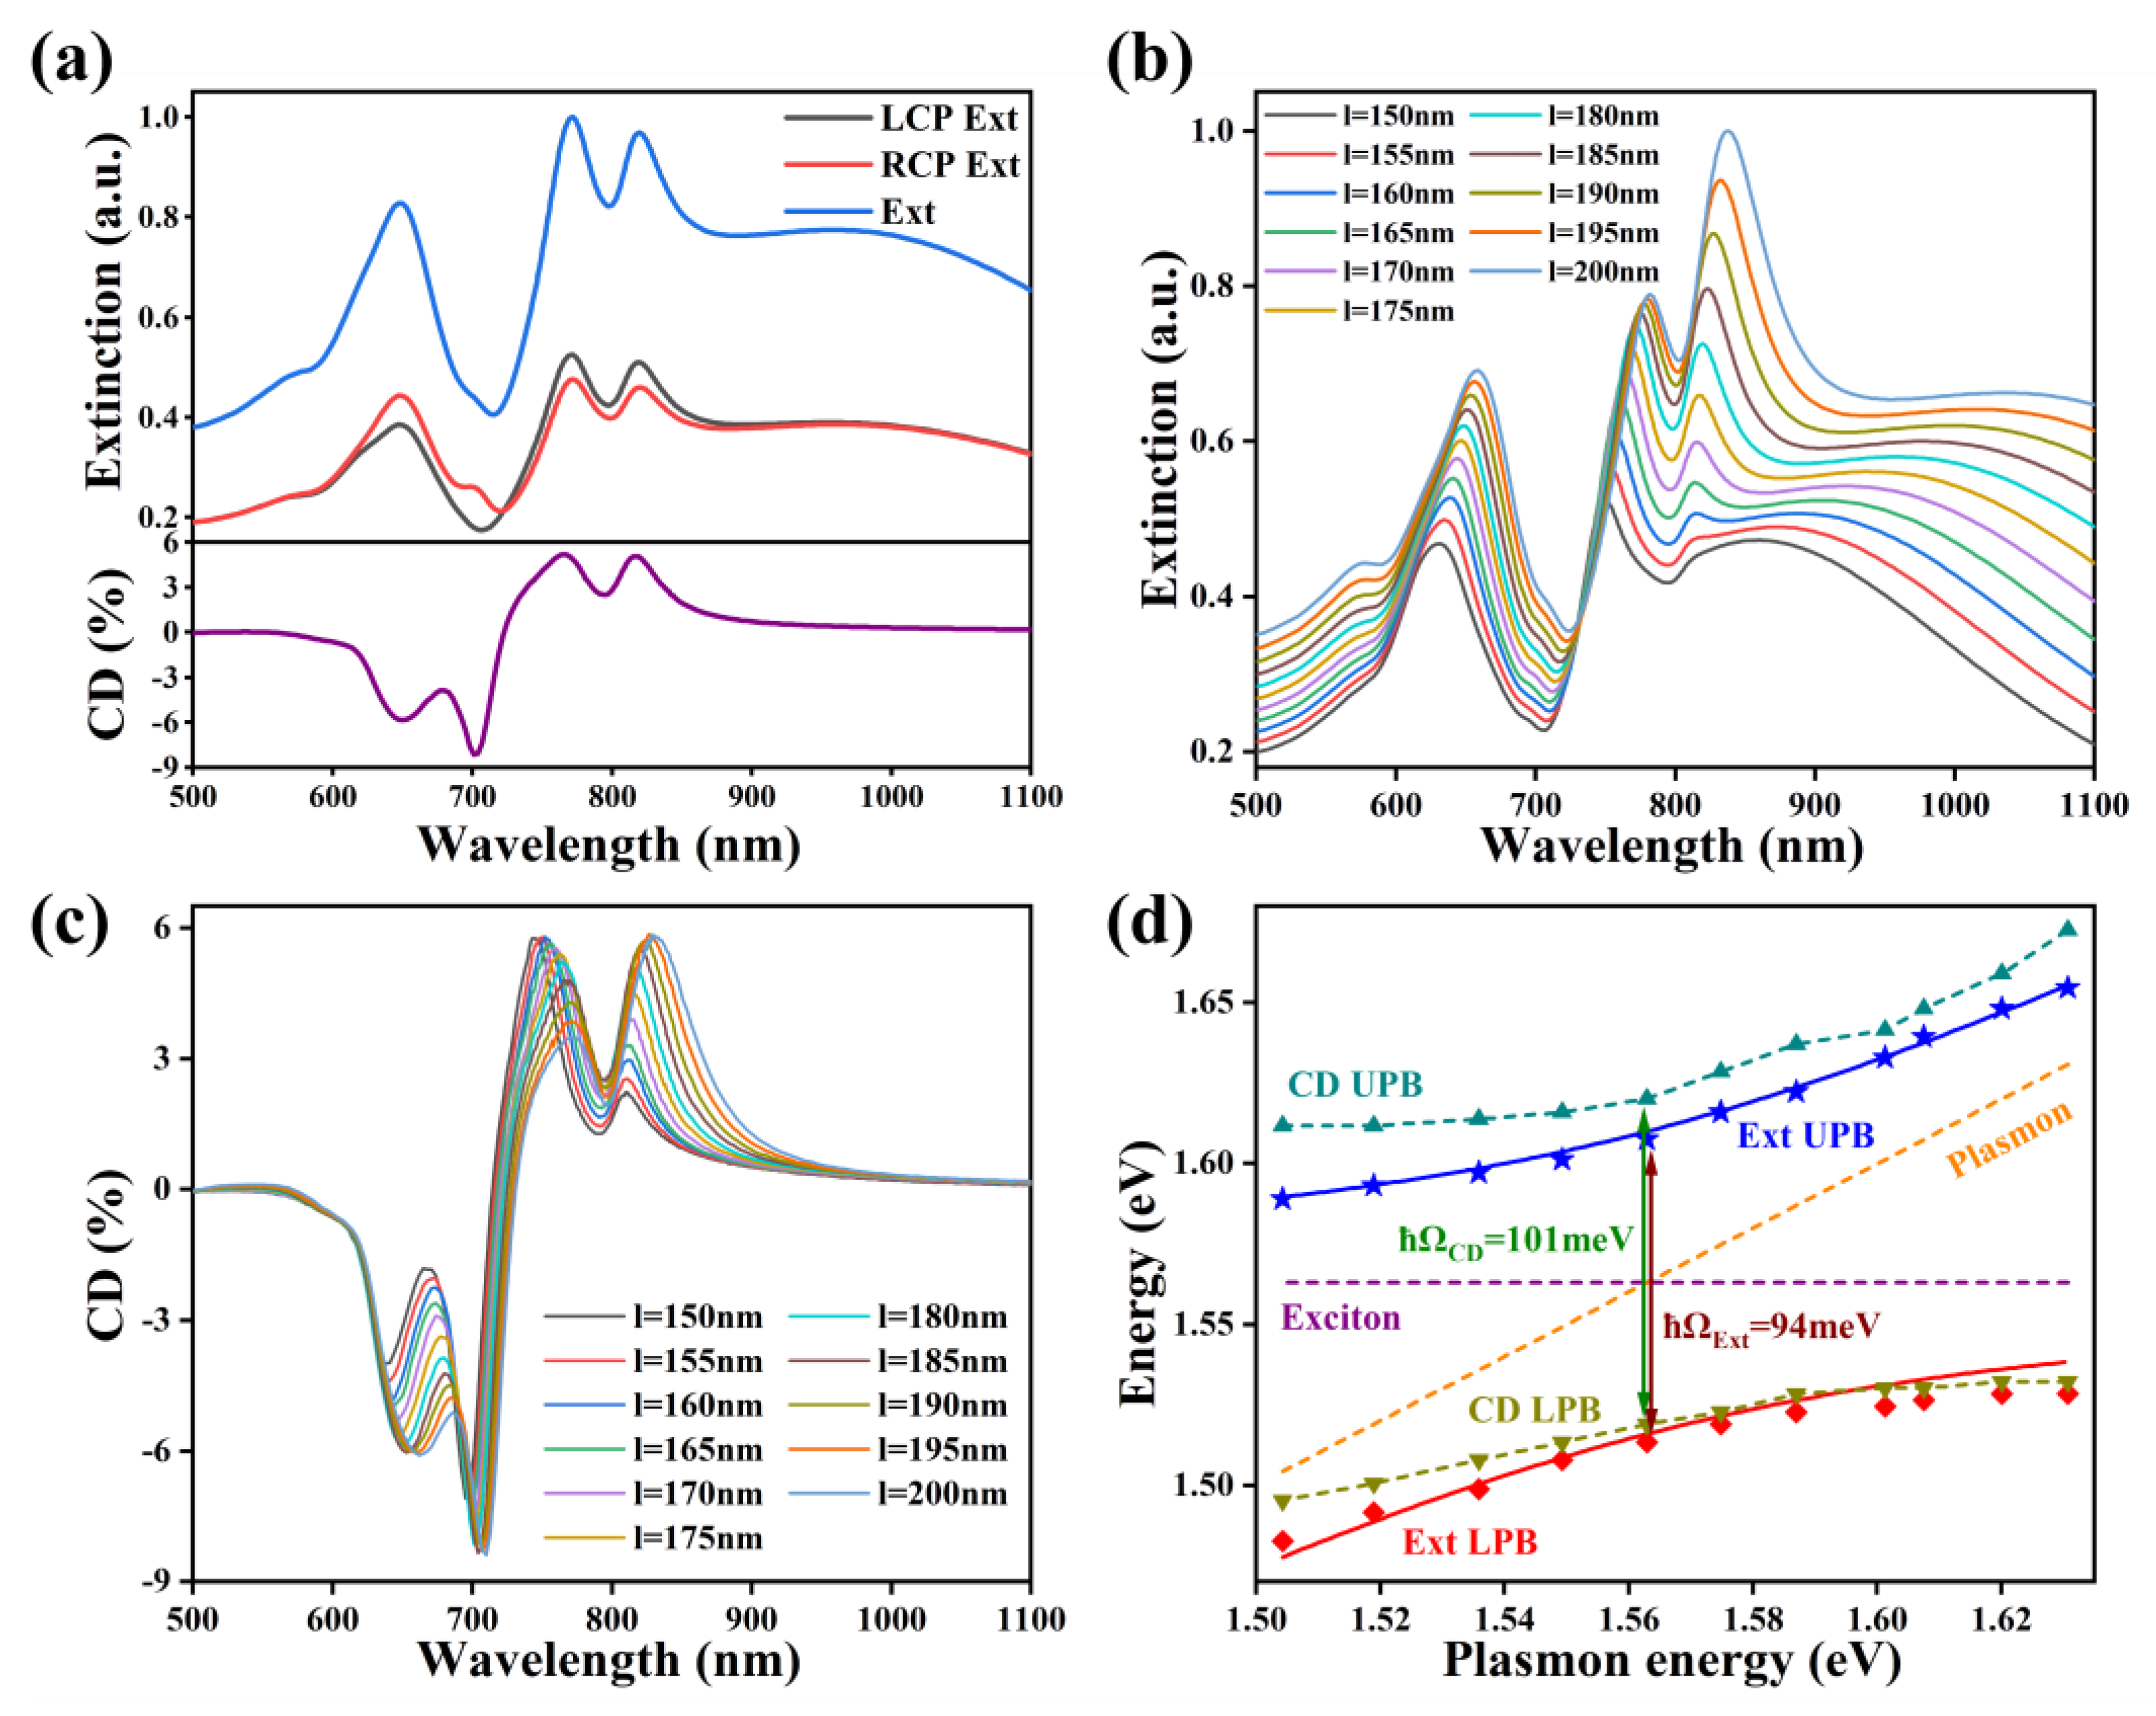
2.2. Strong Coupling Systems Composed of Bright Modes and Emitters

In order to explore the chirality of GHNP in the strong coupling region, each of the two bright modes forms a strong coupling system with emitters. Figure 4a shows the LCP extinction, the RCP extinction, the total extinction, and the CD spectrum of the vertex mode–excitons hybrid system at side length l = 173 nm when this coupling system achieves resonance. It can be seen that the dark mode only exists when illuminated with RCP, so it is not entirely invisible in the total extinction spectrum. The mode splitting can be observed in the extinction spectra at LCP and RCP incidence. As depicted in Figure 4b, the two new hybrid polariton modes appear, which represent the upper polariton branch (UPB) and the lower polariton branch (LPB). With the tuning of side length l from 148 nm to 198 nm, resonance positions of UPB and LPB move from 619 nm to 632 nm and 657 nm to 676 nm, respectively. Furthermore, similar phenomena of chiral optical responses can also be seen in the CD spectra (Figure 4c), such as Rabi splitting and energy branch variation. With the tuning of side length l from 148 nm to 198 nm, resonance positions of UPB and LPB in CD splitting move from 625 nm to 636 nm and 666 nm to 681 nm, respectively. Both spectra exhibit anticrossing behavior, and dispersions of the hybrid modes extracted from the simulated extinction and CD spectra are displayed in Figure 4d. The energy splitting of CD spectra (108 meV) at zero detuning is slightly smaller than its value in extinction spectra (110 meV).
The coupled oscillator model (COM) is applied to fit two energy branches of our simulation results [45,46]:
E ± = E s p + E 0 2 i γ s p + γ 0 4 ± g 2 + 1 4 E s p E 0 + i γ s p γ 0 2 2 ,
where E s p , E 0 , γ s p , and γ 0 are the uncoupled plasmon, exciton energies, and their decay rates, respectively; g reflects the plasmon-exciton coupling strength; and E ± represents the energy of UPB and LPB. The basic criterion for strong coupling is g 2 γ s p γ 0 4 2 > 0 at zero detuning ( E s p = E 0 ). However, a stricter criterion needs to be satisfied in order to make Rabi splitting experimentally observable: Ω = 4 g 2 γ s p γ 0 2 4 > γ s p + γ 0 2 , which means the minimal difference between the upper and lower energy branches should be larger than the average line width of the hybrid modes. In the situation of vertex mode–excitons hybrid system, E 0 = 1.912   eV , γ s p = 171   meV , γ 0 = 26   meV , and g = 66   meV , so a large splitting can be calculated with Ω = 110   meV > γ s p + γ 0 2 = 98.5   meV , which indicates that the strong coupling regime is reached. The blue and red solid lines in Figure 4d are fit results of the extinction data obtained via the COM, and the fitted curve is basically consistent with the points obtained by simulation.
The extinction and the chiral optical characteristics of the mixed mode–excitons hybrid system are also analyzed. Figure 5a shows the LCP extinction, the RCP extinction, the total extinction, and the CD spectrum of the hybrid system at zero detuning when side length l = 180 nm. The significant hybrid mode characteristics of UPB and LPB are basically similar to the vertex mode. As depicted in Figure 5b, with the tuning of side length l from 150 nm to 200 nm, resonance positions of UPB and LPB move from 750 nm to 781 nm and 812 nm to 837 nm, respectively. Rabi splitting and tuning variation can also be seen in the CD spectra (Figure 5c). With the tuning of side length l from 150 nm to 200 nm, resonance positions of two branches of CD splitting move from 742 nm to 770 nm and 810 nm to 830 nm, respectively. Dispersions of the hybrid modes extracted from the simulated extinction and CD spectra are shown in Figure 5d. In the situation of vertex mode–excitons hybrid system, E 0 = 1.563   eV , γ s p = 110   meV , γ 0 = 52   meV , and g = 49   meV . In addition, Ω = 94   meV > γ s p + γ 0 2 = 81   meV , indicating that the strong coupling regime is reached. The energy splitting of CD spectra (101 meV) at zero detuning is slightly larger than its value in extinction spectra (94 meV).
Additionally, UPB and LPB of the mixed mode–excitons hybrid system exhibit the same intensities and line widths at zero detuning in the extinction spectra. When comparing the spectral changes of these two bright modes, there are significant differences in the energy branch intensities mentioned above of the vertex mode–excitons hybrid system. This is because the coupling line type is greatly affected by oscillator strength f. Only when f becomes very small, can the UPB and LPB cross each other in the transition from red to blue detuning. However, these two branches of the vertex mode and the mixed mode manifest nearly the same intensities and line widths in CD spectra. This indicates that the chiral strong coupling system is more accessible to observe the zero detuning position through the CD spectrum than the extinction spectrum, demonstrating the advantages of spectroscopy containing chiral information [26].

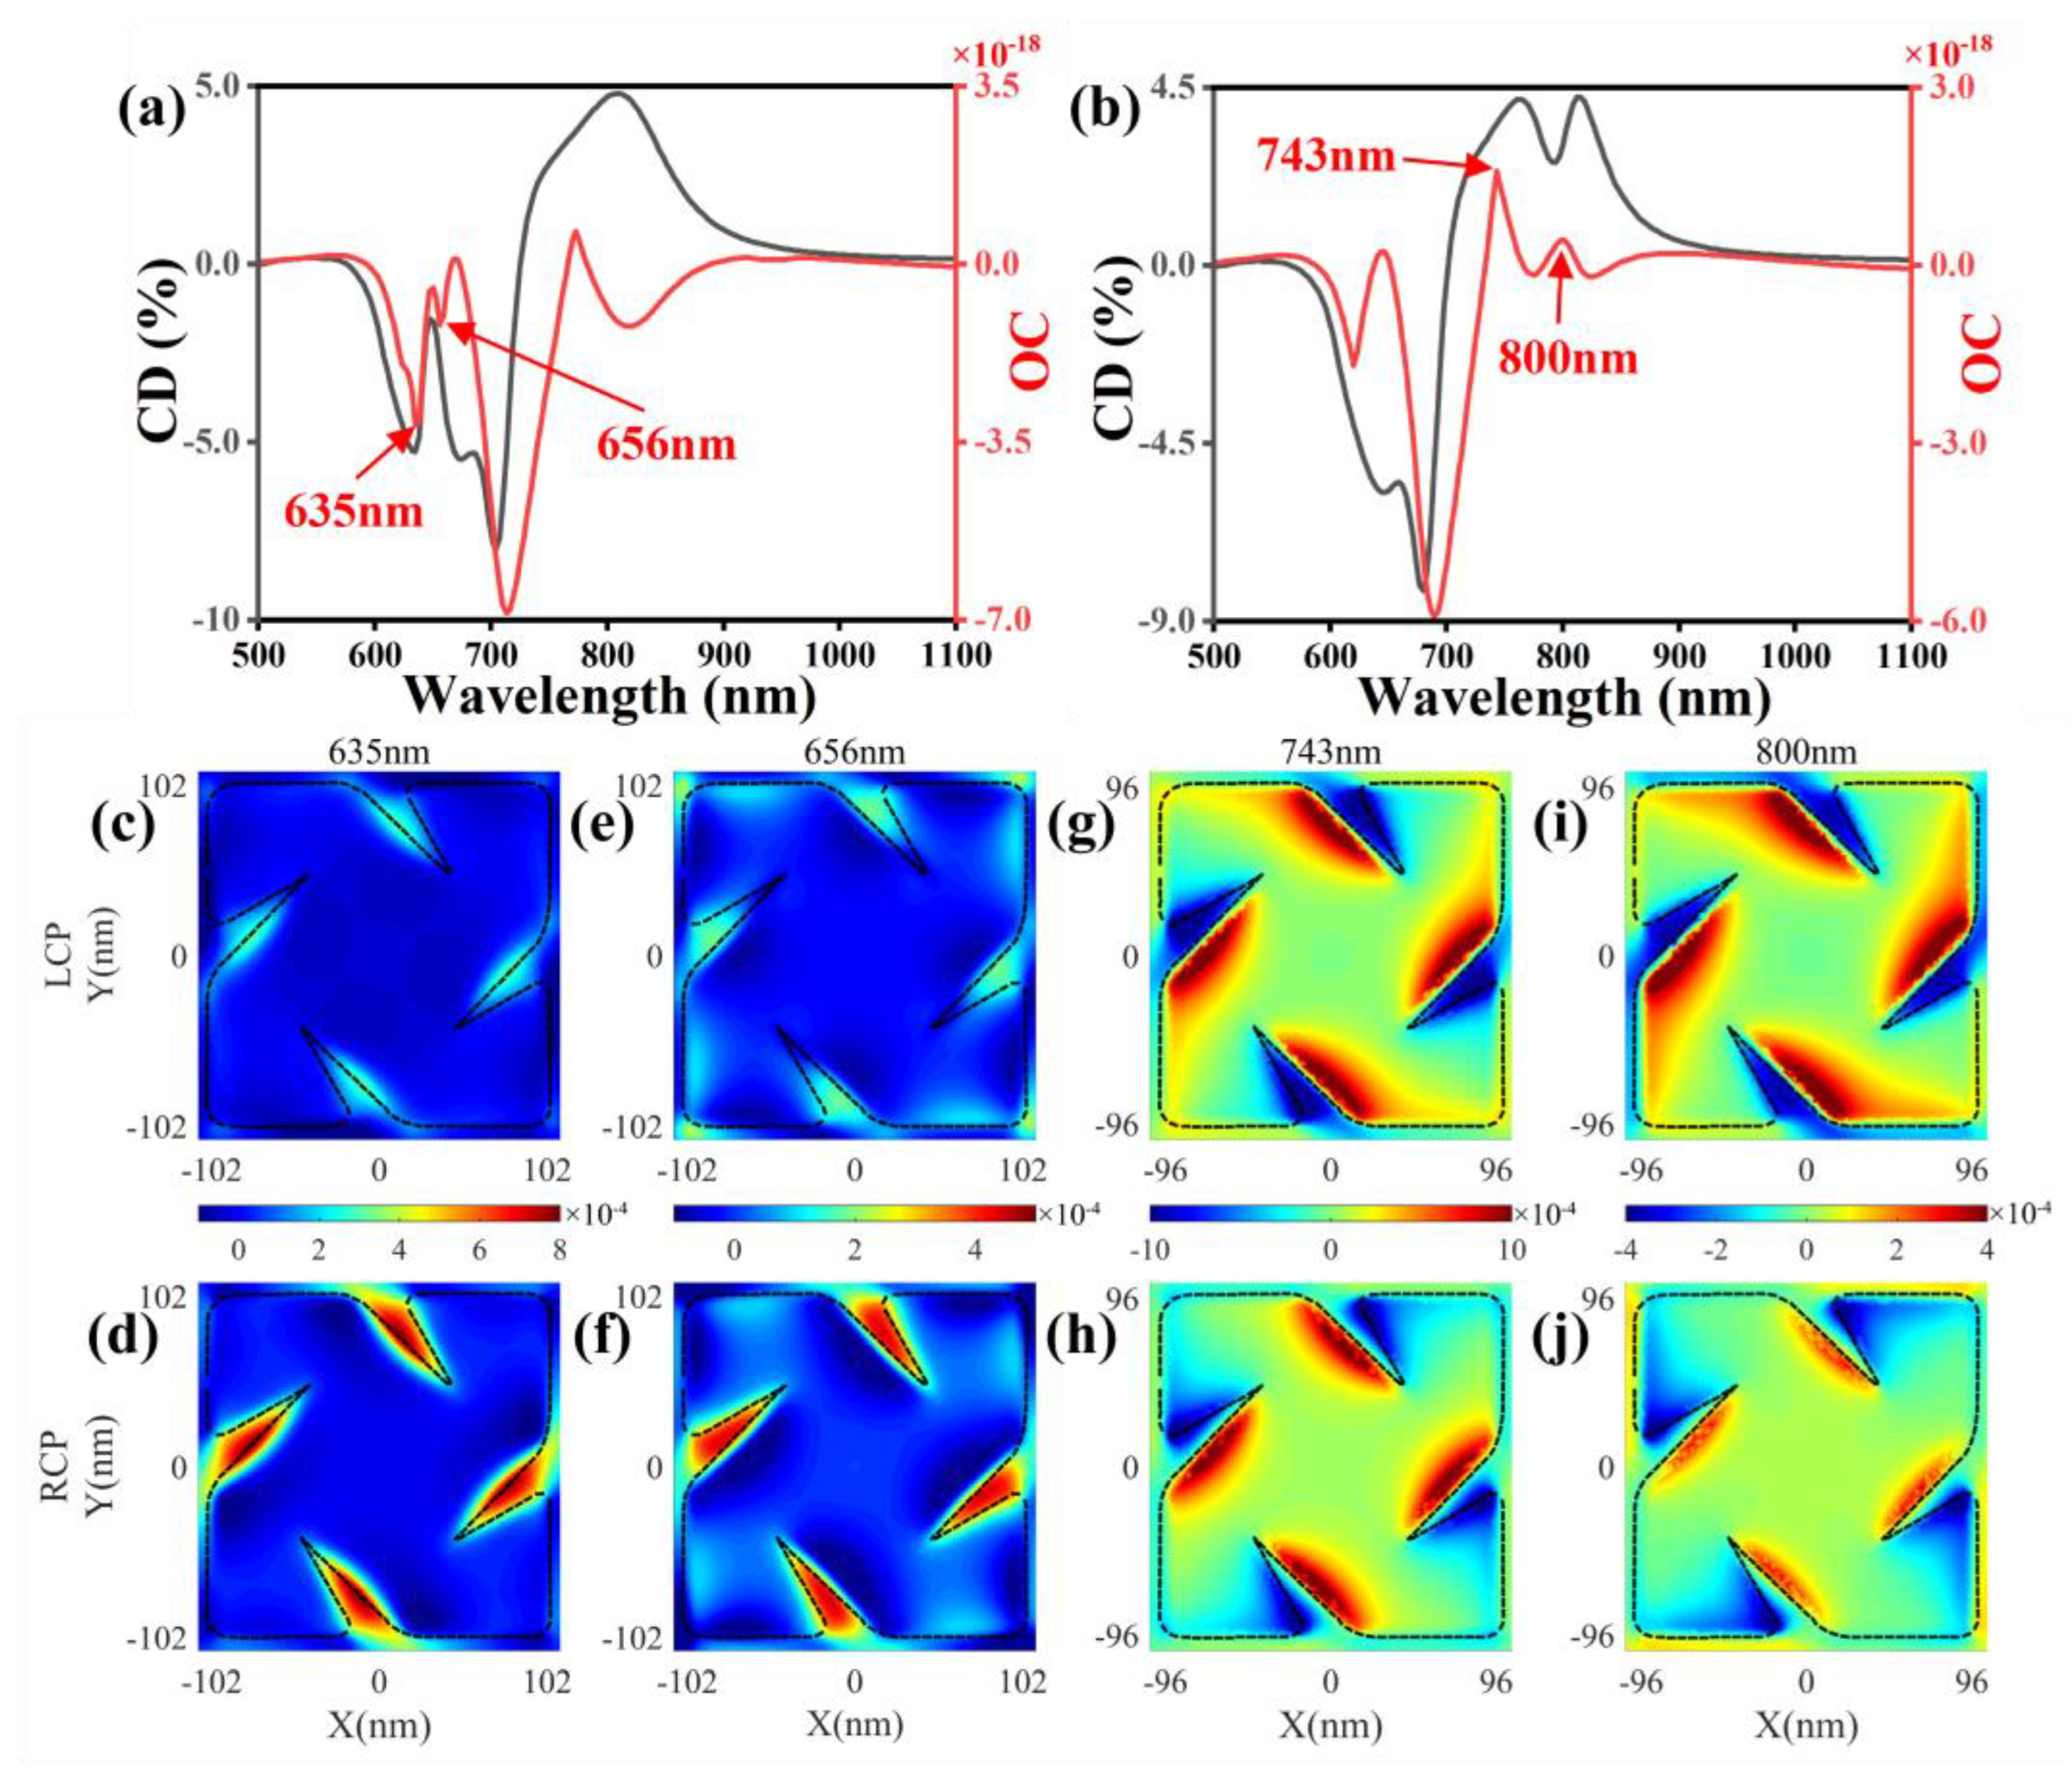
2.3. Chirality Analysis of GHNP in the Strong Coupling Region

To further investigate the near-field chiral characteristics of UPB and LPB, the corresponding spectral lines and distribution of the OC field are analyzed. CD and OC integral spectra of vertex mode–excitons strong coupling system when side length l = 205 nm are shown in Figure 6a. In addition, the same content of mixed mode–excitons strong coupling system when side length l = 192 nm are shown in Figure 6b. The OC spectrum can still correspond to the CD spectrum in the strong coupling system with the same exciton after mode splitting. Side length l is adjusted in each coupling system to get as close as possible to zero detuning. The OC distribution on the integral surface at resonance positions of UPB and LPB in vertex mode–excitons (635 nm, 656 nm) and mixed mode–excitons (743 nm, 800 nm) strong coupling system are shown in Figure 6c–j. The OC maps exhibit distinct pinwheel-like structures, and the chiral hotspots have roughly the same distribution. In the vertex mode–excitons hybrid system, the average response of RCP is stronger than that of LCP, and the overall strength is larger at 635 nm. Comparing Figure 6a,b, it can be figured out that the mixed mode is more dominant without interference from other impurity modes. Thus, the spectral line after mode splitting is better fitted to CD. In the mixed mode–excitons hybrid system, the distribution of chiral hotspots at resonance positions of UPB and LPB is similar. The average response of LCP is stronger than that of RCP, different from the vertex mode–excitons hybrid system. Although the strong coupling interaction changes the energy levels resulting in mode splitting, the chiral hotspot distributions of both UPB and LPB are consistent with the original bright mode in OC maps. This indicates that the chirality of nanoparticles can extend to hybrid energy branches in the strong coupling system.

3. Conclusions

In summary, the far-field and near-field chiralities of the GHNP hybrid system are investigated through the CD and OC spectra exhibiting a spectral correspondence. We simulate the electric field and OC field distributions of GHNP illuminated with different circularly polarized light and found its electromagnetic modes contain one dark mode and two bright modes. The dark mode, i.e., gap mode, is observed more clearly in CD than in extinction spectra. Two bright modes, i.e., vertex mode and mixed mode, can strongly couple with excitons, which is confirmed by the anticrossing behavior and mode splitting exhibited in extinction and CD spectra. Furthermore, by analyzing the distribution characteristics of chiral hotspots, we found that the chiral responses are mainly determined by the asymmetric structure rather than the effect of electric field enhancement. In addition, the chiral hotspot distribution of both the UPB and LPB are consistent with the original bright mode in OC maps. Our work demonstrates a methodology for analyzing a single nanoparticle with complex chirality, which is meaningful for designing chiral plasmonic near-field sources based on geometrically chiral nanostructures.

Author Contributions

H.C. is responsible for thesis writing and simulations; J.G. and L.Y. provided theoretical guidance and reviewed the paper; K.L. and X.D. helped polish the paper; L.J., J.S., and J.Z. helped check the paper for errors. All authors have read and agreed to the published version of the manuscript.

Funding

This research was funded by the National Nature Science Foundation of China (12174037, 12204061), Fundamental Research Funds for the Central Universities (2022XD-A09), State Key Laboratory of Information Photonics and Optical Communications (No. IPOC2021ZZ02).

Institutional Review Board Statement

Not applicable.

Informed Consent Statement

Not applicable.

Data Availability Statement

All data are available from the authors upon reasonable request.

Conflicts of Interest

The authors declare no conflict of interest.

Appendix A. Electromagnetic and Chiral Optical Simulation

We use the commercial software COMSOL Multiphysics based on the finite element method to simulate the electromagnetic and chiroptical responses of GHNP. In the simulation, the circularly polarized light illuminating GHNP is calculated in the form of a background electric field, whose irradiation is normal incidence along the positive direction of the z-axis. All simulation work in this paper is carried out in an environment whose refractive index n = 1.33, and the optical properties of gold are taken from Johnson and Christy [47].
The Lorentz model is used to describe J-aggregates [48], whose specific formula is as follows: ε J = ε + f ω 0 2 ω 2 ω 0 2 i γ 0 ω , where ε J represents the dielectric constant of J-aggregates, ε = n b g 2 , n b g = 1.33 is the index of the background to simulate solution environment, ω 0 = h c / λ is the resonant frequency of J-aggregates, γ 0 is the damping constant of J-aggregates, f is the oscillator strength, and ω is the frequency of incident light. A layer of J-aggregates is uniformly added close to the chiral Au NP to achieve strong coupling with emitters. When the vertex mode is coupled, λ = 649 nm , ω = 0.026 eV , and f = 0.015 . When the mixed mode is coupled, λ = 794 nm , ω = 0.052 eV , and f = 0.015 .
When building the simulation model, GHNP with side length l is placed in the center position. In order to achieve the convergence of the simulation, its edges and corners are smoothed without affecting the structure. The strong coupling condition determines whether to add the J-aggregates layer. Then, a sphere large enough to enclose the particle is set as the integrated cross-section. The absorption and scattering spectra can be calculated using the scattering parameters in COMSOL, and the sum of these two is extinction spectra. OC is calculated by Equation (1), and its spectra are calculated by the integral of OC. The normalized CD is calculated by E x t L C P E x t R C P / E x t L C P m a x + E x t R C P m a x . The perfect matching layers are used on the outside to avoid reflectance. Grid sequence type is a physical field control grid.

References

  1. Luo, Y.; Chi, C.; Jiang, M.; Li, R.; Zu, S.; Li, Y.; Fang, Z. Plasmonic chiral nanostructures: Chiroptical effects and applications. Adv. Opt. Mater. 2017, 5, 1700040. [Google Scholar] [CrossRef] [Green Version]
  2. Zhao, Y.; Belkin, M.; Alù, A. Twisted optical metamaterials for planarized ultrathin broadband circular polarizers. Nat. Commun. 2012, 3, 870. [Google Scholar] [CrossRef] [Green Version]
  3. Kaschke, J.; Blume, L.; Wu, L.; Thiel, M.; Bade, K.; Yang, Z.; Wegener, M. A helical metamaterial for broadband circular polarization conversion. Adv. Opt. Mater. 2015, 3, 1411–1417. [Google Scholar] [CrossRef]
  4. Hendry, E.; Carpy, T.; Johnston, J.; Popland, M.; Mikhaylovskiy, R.; Lapthorn, A.; Kelly, S.; Barron, L.; Gadegaard, N.; Kadodwala, M. Ultrasensitive detection and characterization of biomolecules using superchiral fields. Nat. Nanotechnol. 2010, 5, 783–787. [Google Scholar] [CrossRef] [Green Version]
  5. Zhang, S.; Zhou, J.; Park, Y.-S.; Rho, J.; Singh, R.; Nam, S.; Azad, A.K.; Chen, H.-T.; Yin, X.; Taylor, A.J.; et al. Photoinduced handedness switching in terahertz chiral metamolecules. Nat. Commun. 2012, 3, 942. [Google Scholar] [CrossRef] [Green Version]
  6. Pendry, J. A chiral route to negative refraction. Science 2004, 306, 1353–1355. [Google Scholar] [CrossRef] [Green Version]
  7. Tamura, M.; Fujihara, H. Chiral bisphosphine binap-stabilized gold and palladium nanoparticles with small size and their palladium nanoparticle-catalyzed asymmetric reaction. J. Am. Chem. Soc. 2003, 125, 15742–15743. [Google Scholar] [CrossRef]
  8. Zhan, P.; Wang, Z.-G.; Li, N.; Ding, B. Engineering gold nanoparticles with dna ligands for selective catalytic oxidation of chiral substrates. ACS Catal. 2015, 5, 1489–1498. [Google Scholar] [CrossRef]
  9. Jeong, H.; Mark, A.G.; Alarcón-Correa, M.; Kim, I.; Oswald, P.; Lee, T.C.; Fischer, P. Dispersion and shape engineered plasmonic nanosensors. Nat. Commun. 2016, 7, 11331. [Google Scholar] [CrossRef] [Green Version]
  10. Kumar, J.; Erana, H.; López-Martínez, E.; Claes, N.; Martín, V.F.; Solís, D.M.; Bals, S.; Cortajarena, A.L.; Castilla, J.; Liz-Marzán, L.M. Detection of amyloid fibrils in parkinsonąŕs disease using plasmonic chirality. Proc. Natl. Acad. Sci. USA 2018, 115, 3225–3230. [Google Scholar] [CrossRef] [Green Version]
  11. Nguyen, L.A.; He, H.; Pham-Huy, C. Chiral drugs: An overview. Int. J. Biomed. Sci. 2006, 2, 85–100. [Google Scholar] [PubMed]
  12. Tang, Y.; Liu, Z.; Deng, J.; Li, K.; Li, J.; Li, G. Nano-kirigami metasurface with giant nonlinear optical circular dichroism. Laser Photonics Rev. 2020, 14, 2000085. [Google Scholar] [CrossRef]
  13. Ohnoutek, L.; Cho, N.H.; Allen Murphy, A.W.; Kim, H.; Rasadean, D.M.; Pantos, G.D.; Nam, K.T.; Valev, V.K. Single nanoparticle chiroptics in a liquid: Optical activity in hyper-rayleigh scattering from au helicoids. Nanoletters 2020, 20, 5792–5798. [Google Scholar] [CrossRef] [PubMed]
  14. Kuzyk, A.; Schreiber, R.; Fan, Z.; Pardatscher, G.; Roller, E.-M.; Hogele, A.; Simmel, F.C.; Govorov, A.O.; Liedl, T. Dna-based self-assembly of chiral plasmonic nanostructures with tailored optical response. Nature 2012, 483, 311–314. [Google Scholar] [CrossRef] [Green Version]
  15. Long, G.; Adamo, G.; Tian, J.; Klein, M.; Krishnamoorthy, H.N.; Feltri, E.; Wang, H.; Soci, C. Perovskite metasurfaces with large superstructural chirality. Nat. Commun. 2022, 13, 1551. [Google Scholar] [CrossRef]
  16. Chen, J.; Gao, X.; Zheng, Q.; Liu, J.; Meng, D.; Li, H.; Cai, R.; Fan, H.; Ji, Y.; Wu, X. Bottom-up synthesis of helical plasmonic nanorods and their application in generating circularly polarized luminescence. ACS Nano 2021, 15, 15114–15122. [Google Scholar] [CrossRef] [PubMed]
  17. Lee, H.-E.; Ahn, H.-Y.; Mun, J.; Lee, Y.Y.; Kim, M.; Cho, N.H.; Chang, K.; Kim, W.S.; Rho, J.; Nam, K.T. Amino-acid-and peptide-directed synthesis of chiral plasmonic gold nanoparticles. Nature 2018, 556, 360–365. [Google Scholar] [CrossRef]
  18. Spreyer, F.; Mun, J.; Kim, H.; Kim, R.M.; Nam, K.T.; Rho, J.; Zentgraf, T. Second harmonic optical circular dichroism of plasmonic chiral helicoid-iii nanoparticles. ACS Photonics 2022, 9, 784–792. [Google Scholar] [CrossRef]
  19. He, Z.; Li, F.; Liu, Y.; Yao, F.; Xu, L.; Han, X.; Wang, K. Principle and applications of the coupling of surface plasmons and excitons. Appl. Sci. 2020, 10, 1774. [Google Scholar] [CrossRef] [Green Version]
  20. Li, S.; Li, Y.; Lv, H.; Ji, C.; Gao, H.; Sun, Q. Chiral Dual-Core Photonic Crystal Fiber for an Efficient Circular Polarization Beam Splitter. Photonics 2023, 10, 45. [Google Scholar] [CrossRef]
  21. Sollner, I.; Mahmoodian, S.; Hansen, S.L.; Midolo, L.; Javadi, A.; Kiršanske, G.; Pregnolato, T.; El-Ella, H.; Lee, E.H.; Song, J.D.; et al. Deterministic photon–emitter coupling in chiral photonic circuits. Nat. Nanotechnol. 2015, 10, 775–778. [Google Scholar] [CrossRef] [PubMed] [Green Version]
  22. Lodahl, P.; Mahmoodian, S.; Stobbe, S.; Rauschenbeutel, A.; Schneeweiss, P.; Volz, J.; Pichler, H.; Zoller, P. Chiral quantum optics. Nature 2017, 541, 473–480. [Google Scholar] [CrossRef] [PubMed] [Green Version]
  23. Aiello, A.; Banzer, P.; Neugebauer, M.; Leuchs, G. From transverse angular momentum to photonic wheels. Nat. Photonics 2015, 9, 789–795. [Google Scholar] [CrossRef]
  24. Guo, J.; Song, G.; Huang, Y.; Liang, K.; Wu, F.; Jiao, R.; Yu, L. Optical chirality in a strong coupling system with surface plasmons polaritons and chiral emitters. ACS Photonics 2021, 8, 901–906. [Google Scholar] [CrossRef]
  25. Guo, J.; Wu, F.; Song, G.; Huang, Y.; Jiao, R.; Yu, L. Diverse axial chiral assemblies of j-aggregates in plexcitonic nanoparticles. Nanoscale 2021, 13, 15812–15818. [Google Scholar] [CrossRef]
  26. Wu, F.; Guo, J.; Huang, Y.; Liang, K.; Jin, L.; Li, J.; Deng, X.; Jiao, R.; Liu, Y.; Zhang, J.; et al. Plexcitonic optical chirality: Strong exciton–plasmon coupling in chiral j-aggregate-metal nanoparticle complexes. ACS Nano 2020, 15, 2292–2300. [Google Scholar] [CrossRef]
  27. Zhu, J.; Wu, F.; Han, Z.; Shang, Y.; Liu, F.; Yu, H.; Yu, L.; Li, N.; Ding, B. Strong light–matter interactions in chiral plasmonic–excitonic systems assembled on dna origami. Nano Lett. 2021, 21, 3573–3580. [Google Scholar] [CrossRef]
  28. Thomaschewski, M.; Yang, Y.; Wolff, C.; Roberts, A.S.; Bozhevolnyi, S.I. On-Chip Detection of Optical Spin–Orbit Interactions in Plasmonic Nanocircuits. Nano Lett. 2019, 19, 1166–1171. [Google Scholar] [CrossRef]
  29. Ren, H.; Wang, X.; Li, C.; He, C.; Wang, Y.; Pan, A.; Maier, S.A. Orbital-Angular-Momentum-Controlled Hybrid Nanowire Circuit. Nano Lett. 2021, 21, 6220–6227. [Google Scholar] [CrossRef]
  30. Ma, Y.; Liu, B.; Huang, Z.; Li, J.; Han, Z.; Wu, D.; Zhou, J.; Ma, Y.; Wu, Q.; Maeda, H. High-directionality spin-selective routing of photons in plasmonic nanocircuits. Nanoscale 2022, 14, 428–432. [Google Scholar] [CrossRef]
  31. Bhaskar, S.; Srinivasan, V.; Ramamurthy, S.S. Nd2O3-Ag Nanostructures for Plasmonic Biosensing, Antimicrobial, and Anticancer Applications. ACS Appl. Nano Mater. 2023, 6, 1129–1145. [Google Scholar] [CrossRef]
  32. Bhaskar, S.; Das, P.; Srinivasan, V.; Bhaktha, S.B.N.; Ramamurthy, S.S. Plasmonic-Silver Sorets and Dielectric-Nd2O3 nanorods for Ultrasensitive Photonic Crystal-Coupled Emission. Mater. Res. Bull. 2022, 145, 111558. [Google Scholar] [CrossRef]
  33. Feng, W.; Kim, J.-Y.; Wang, X.; Calcaterra, H.A.; Qu, Z.; Meshi, L.; Kotov, N.A. Assembly of mesoscale helices with near-unity enantiomeric excess and light-matter interactions for chiral semiconductors. Sci. Adv. 2017, 3, e1601159. [Google Scholar] [CrossRef] [PubMed] [Green Version]
  34. Berova, N.; Nakanishi, K.; Woody, R.W. Circular Dichroism: Principles and Applications; John Wiley & Sons: Hoboken, NJ, USA, 2000. [Google Scholar]
  35. García-Guirado, J.; Svedendahl, M.; Puigdollers, J.; Quidant, R. Enantiomer-selective molecular sensing using racemic nanoplasmonic arrays. Nano Lett. 2018, 18, 6279–6285. [Google Scholar] [CrossRef] [PubMed] [Green Version]
  36. Liu, W.; Deng, L.; Guo, Y.; Yang, W.; Xia, S.; Yan, W.; Yang, Y.; Qin, J.; Bi, L. Enhanced chiral sensing in achiral nanostructures with linearly polarized light. Opt. Express 2022, 30, 26306–26314. [Google Scholar] [CrossRef]
  37. Zhao, Y.; Askarpour, A.N.; Sun, L.; Shi, J.; Li, X.; Alù, A. Chirality detection of enantiomers using twisted optical metamaterials. Nat. Commun. 2017, 8, 14180. [Google Scholar] [CrossRef]
  38. Kelly, C.; Tullius, R.; Lapthorn, A.J.; Gadegaard, N.; Cooke, G.; Barron, L.D.; Karimullah, A.S.; Rotello, V.M.; Kadodwala, M. Chiral plasmonic fields probe structural order of biointerfaces. J. Am. Chem. Soc. 2018, 140, 8509–8517. [Google Scholar] [CrossRef]
  39. Das, R.; Sarkar, S. Optical properties of silver nano-cubes. Opt. Mater. 2015, 48, 203–208. [Google Scholar] [CrossRef]
  40. Rai, A.; Bhaskar, S.; Ganesh, K.M.; Ramamurthy, S.S. Hottest Hotspots from the Coldest Cold: Welcome to Nano 4.0. ACS Appl. Nano Mater. 2022, 5, 12245–12264. [Google Scholar] [CrossRef]
  41. Bhaskar, S.; Thacharakkal, D.; Ramamurthy, S.S.; Subramaniam, C. Metal–Dielectric Interfacial Engineering with Mesoporous Nano-Carbon Florets for 1000-Fold Fluorescence Enhancements: Smartphone-Enabled Visual Detection of Perindopril Erbumine at a Single-molecular Level. ACS Sustain. Chem. Eng. 2023, 11, 78–91. [Google Scholar] [CrossRef]
  42. Kelf, T.A.; Sugawara, Y.; Baumberg, J.J.; Abdelsalam, M.; Bartlett, P.N. Plasmonic Band Gaps and Trapped Plasmons on Nanostructured Metal Surfaces. Phys. Rev. Lett. 2005, 95, 116802. [Google Scholar] [CrossRef] [PubMed] [Green Version]
  43. Schäferling, M. Chiral nanophotonics. Springer Ser. Opt. Sci. 2017, 205, 159. [Google Scholar]
  44. Tang, Y.; Cohen, A.E. Enhanced enantioselectivity in excitation of chiral molecules by superchiral light. Science 2011, 332, 333–336. [Google Scholar] [CrossRef] [PubMed] [Green Version]
  45. Baranov, D.G.; Wersäll, M.; Cuadra, J.; Antosiewicz, T.J.; Shegai, T. Novel nanostructures and materials for strong light–matter interactions. ACS Photonics 2018, 5, 24–42. [Google Scholar] [CrossRef]
  46. Cao, E.; Lin, W.; Sun, M.; Liang, W.; Song, Y. Exciton-plasmon coupling interactions: From principle to applications. Nanophotonics 2018, 7, 145–167. [Google Scholar] [CrossRef]
  47. Johnson, P.B.; Christy, R.-W. Optical constants of the noble metals. Phys. Rev. B 1972, 6, 4370. [Google Scholar] [CrossRef]
  48. Song, G.; Guo, J.; Duan, G.; Jiao, R.; Yu, L. Interactions between a single metallic nanoparticle and chiral molecular j-aggregates in the strong coupling regime and the weak coupling regime. Nanotechnology 2020, 31, 345202. [Google Scholar] [CrossRef]
Figure 1. Two chirality types of particle structure (L-handed and R-handed) illuminated with circularly polarized light; l is the side length of GHNP.
Photonics 10 00251 g001
Figure 2. (a) Extinction and (b) CD spectra of the single GHNP with different nanoparticle side length l. (ch) Electric field distribution of three modes shown in CD spectra when l = 180 nm. Their resonance positions are 652 nm, 711 nm, and 787 nm. Figure (ce) and (fh) indicate LCP and RCP incidence, respectively.
Photonics 10 00251 g002
Figure 3. (a) CD spectra (black line) and OC integral spectra (red line) of single GHNP when side length l = 150 nm. These two spectra exhibit a clear correspondence. The red arrows mark out three resonance positions. (bg) The OC distribution on integral surface at each resonance position (608 nm, 665 nm, and 704 nm) with LCP incidence (bd) and RCP incidence (eg).
Photonics 10 00251 g003
Figure 4. (a) The LCP extinction, the RCP extinction, the total extinction, and the CD spectrum of GHNP hybrid system at zero detuning. (b) Extinction and (c) CD spectra of the vertex mode–excitons strong coupling system with the detuning of side length l. (d) Dispersions of the hybrid modes extracted from the simulated extinction (blue stars, red diamonds) and CD (cyan positive triangles, yellow inverted triangles) spectra. The blue and red solid lines are fit results of the extinction data obtained via the COM. Rabi splitting of the anticrossing curves extracted from extinction and CD spectra are 110 meV and 108 meV, respectively. The purple and orange dashed lines represent uncoupled plasmon and exciton energies, respectively.
Photonics 10 00251 g004
Figure 5. (a) The LCP extinction, the RCP extinction, the total extinction, and the CD spectrum of GHNP hybrid system at zero detuning. (b) Extinction and (c) CD spectra of the mixed mode–excitons strong coupling system with the detuning of side length l. (d) Dispersions of the hybrid modes extracted from the simulated extinction (blue stars, red diamonds) and CD (cyan positive triangles, yellow inverted triangles) spectra. The blue and red solid lines are fit results of the extinction data obtained via the COM. Rabi splitting of the anticrossing curves extracted from extinction and CD spectra are 94 meV and 101 meV, respectively. The purple and orange dashed lines represent uncoupled plasmon and exciton energies, respectively.
Photonics 10 00251 g005
Figure 6. (a) CD spectra (black line) and OC integral spectra (red line) of the vertex mode–excitons strong coupling system when side length l = 205 nm. (b) CD spectra (black line) and OC integral spectra (red line) of the mixed mode–excitons strong coupling system when side length l = 192 nm. The red arrows mark out positions of two energy branches. (cj) The OC distribution on integral surface at resonance positions of UPB and LPB in vertex mode–excitons (635 nm, 656 nm) and mixed mode–excitons (743 nm, 800 nm) strong coupling system. Top panels and bottom panels indicate LCP and RCP incidence, respectively.
Photonics 10 00251 g006
Disclaimer/Publisher’s Note: The statements, opinions and data contained in all publications are solely those of the individual author(s) and contributor(s) and not of MDPI and/or the editor(s). MDPI and/or the editor(s) disclaim responsibility for any injury to people or property resulting from any ideas, methods, instructions or products referred to in the content.

