Communication

Simultaneous Detection of Gas Concentration and Light Intensity Based on Dual-Quartz-Enhanced Photoacoustic-Photothermal Spectroscopy

1
Key Laboratory of Environmental Optics and Technology, Hefei Institute of Physical Science, Chinese Academy of Sciences, Hefei 230031, China
2
Science Island Branch of Graduate School, University of Science and Technology of China, Hefei 230022, China
3
Department of Mechanical and Automation Engineering, The Chinese University of Hong Kong, Hong Kong
*
Authors to whom correspondence should be addressed.
Photonics 2023, 10(2), 165; https://doi.org/10.3390/photonics10020165
Submission received: 4 January 2023 / Revised: 26 January 2023 / Accepted: 2 February 2023 / Published: 4 February 2023
(This article belongs to the Special Issue Emerging Frontiers in Photoacoustic Spectroscopy Detection)

Abstract

:
This research proposes a method for the simultaneous acquisition of the second harmonic (2f) signal of quartz-enhanced photoacoustic spectroscopy (QEPAS) and the first harmonic (1f) signal of quartz-enhanced photothermal spectroscopy (QEPTS) based on the dual-quartz-enhanced photoacoustic–photothermal spectroscopy. The laser beam is first wavelength-modulated by the injection current and then intensity-modulated by an acoustic-optic modulator. The frequency of the wavelength modulation is half of the QTF1 resonant frequency, and the frequency of the intensity modulation is equal to the QTF2 resonant frequency. A modulated laser beam traveled through the two arms of the QTF1 and converged on the root of the QTF2. The 2f photoacoustic and 1f photothermal signals are concurrently obtained using the frequency division multiplexing technology and lock-in amplifiers, which allows the simultaneous detection of the gas concentration and laser light intensity. CH4 is chosen as the target gas, and the variations of the 2f photoacoustic and 1f photothermal signals are evaluated at various gas concentrations and light intensities. According to the experiments, the amplitude of the 1f photothermal signal has a good linear connection with light intensity (R2 = 0.998), which can be utilized to accurately revise the 2f photoacoustic signal while light intensity fluctuates. Over a wide range of concentrations, the normalized 2f photoacoustic signals exhibit an excellent linear response (R2 = 0.996). According to the Allan deviation analysis, the minimum detection limit for CH4 is 0.39 ppm when the integration time is 430 s. Compared with the light intensity correction using a photodetector for the QEPAS system, this approach offers a novel and effective light intensity correction method for concentration measurements employing 2f analysis. It also has the advantages of low cost and compact volume, especially for mid-infrared and terahertz systems.

1. Introduction

The advantages of laser absorption spectroscopy, which is based on the Beer–Lambert law, include high selectivity and sensitivity, as well as non-invasive and real-time detection [1,2]. Additionally, it is crucial for poisonous and flammable gas [3], combustion diagnosis [4], life science [5], and fire alarms [6]. Quartz-enhanced photoacoustic spectroscopy (QEPAS) is one of the most promising technologies for trace gas sensing. In QEPAS, a quartz tuning fork (QTF) is employed in place of the microphones used in conventional photoacoustic spectroscopy (PAS) to detect acoustic waves [7]. The QTF has greater quality factor, narrower response bandwidth, and higher resonance frequency [8,9]. As a result, QEPAS has the advantages of ultra-high sensitivity, immunity to environmental noise, and compact volume [10,11].
Since the non-radiative relaxation of the gas absorption, acoustic waves are produced when the modulated laser passes through the gas sample to be measured [12,13]. The QTF serves as a transducer for the detection of the acoustic signal, and the photoacoustic sensitivity is often improved by using an appropriate acoustic microresonator [14,15]. Other laser absorption spectroscopy methods, such as tunable diode laser absorption spectroscopy (TDLAS) [16], are different from the QEPAS. The ability to enhance sensor performance by boosting the excitation light source power is a crucial benefit of QEPAS [17,18].
Unlike QEPAS, quartz-enhanced photothermal spectroscopy (QEPTS) is another laser absorption spectroscopy technique based on QTF [19]. In QEPTS, the QTF is used as a high-performance photothermal transducer [20,21]. When the modulated laser light is incident on the QTF surface through the gas analytes, some of the light energy absorbed by the QTF is converted into photothermal energy due to photo-thermo-elastic conversion, which leads to thermo-elastic expansion and deformation of the QTF and brings about mechanical vibration of the QTF [22]. Based on the QTF with the piezoelectric effect, the vibration caused by photo–thermal–elastic conversion generates a piezoelectric charge on the surface of the QTF, which is eventually converted into a piezoelectric signal [23]. The QEPTS is a non-contact trace gas detection technique. By using this technology, it is possible to monitor the laser light intensity in addition to detecting dangerous chemicals at a distance [24,25]. By applying the method of scanning wavelength modulation, the amplitude of the demodulated 1f component is proportional to the light intensity and can be used to accurately track fluctuations in light intensity [26]. As a result, several academics paid close attention to QEPTS [27,28].
In the QEPAS system, the amplitude of 2f photoacoustic signal is proportional to the laser light intensity. Therefore, the system sensitivity is affected by the jitter of laser light intensity during long-term field measurements [29]. As a result, it is necessary to monitor the laser light intensity. As a low-cost commercial device, the QTF has the advantages of small size, large dynamic range, and no wavelength selectivity [30]. In this paper, a dual-quartz-enhanced photoacoustic–photothermal spectroscopy for the simultaneous measurement of gas concentration and light intensity is proposed. Two QTFs are used for the simultaneous detection of photoacoustic and photothermal signals. A laser beam passing through the QEPAS system is incident directly on the bottom of other QTFs to excite the photothermal signal. Eventually, the light intensity of the laser beam can be monitored while achieving high sensitivity for the detection of trace gases. The methane (CH4) absorption line at 1653.72 nm is chosen for the experiment. Simultaneous measurement of gas concentration and light intensity based on the dual-quartz-enhanced photoacoustic–photothermal spectroscopy system is investigated.

2. Experimental Setup

The experimental setup diagram for simultaneous measurement of gas concentration and light intensity of the dual-quartz-enhanced photoacoustic–photothermal spectroscopy system is shown in Figure 1. Standard commercial QTFs with a resonant frequency of ~32 kHz are used as acoustoelectric transducers. In this experiment, a fiber-coupled, distributed feedback (DFB), continuous-wave (CW) diode laser (NLK1U5FAAA, NEL) with a wavelength of 1653.72 nm and maximum output power of 20 mW is selected as the excitation source. The CH4 absorption line located at 1653.72 nm is investigated. The laser is controlled using a homemade laser control circuit. Wavelength modulation spectroscopy (WMS) and harmonic detection technology based on the modulation capability of the DFB-CW laser are adopted. The superposition of a ramp signal with a scanning frequency of 0.05 Hz and a sinusoidal modulating signal with a frequency of f1/2, where f1 is just the resonance frequency of the QTF1 that produced the photoacoustic signal, is utilized to modulate the DFB laser injection current. Once more having its intensity modulated, the modulated laser is connected to the acousto-optic modulator (AOM) (SGTF80-1654, SMART) through the flange. The drive current of the acousto-optic modulator has a frequency of f2, which is also the resonant frequency of the QTF2 that produces the photothermal signal. All modulating and scanning signals are generated by the waveform generator (SDG1032X, Siglent). To ensure no loss of laser power, the laser beam is collimated and put into the QEPAS system by using a fiber collimator (FC). Acoustic microresonators are typically utilized in QEPAS to boost the system detection sensitivity through the amplification of the acoustic signal. The experiment utilized the more popular dual acoustic microresonator. The high sensitivity of the system is ensured by this technique, and the structure is also rather straightforward, making it simple to install and modify. The laser beam passing through the QEPAS system, with almost no loss of light intensity, ensures that a sufficient photothermal signal can be excited in the QEPTS system. The laser beam is focused directly on the root of the QTF2. Since the volume of the photoacoustic cell is about 3 mL, the absorption generated in the QEPTS system can be neglected. In the experiment, the laser light intensity is adjusted using a fiber optic attenuator (OA) when the laser light intensity needs to be altered. The piezoelectric currents generated by the photoacoustic and photothermal effects, respectively, are converted into voltage signals by homemade low-noise transimpedance amplifier circuits with 10 MΩ feedback resistors. The photoacoustic and photothermal signals are subsequently demodulated using two lock-in amplifiers (RS865A, Stanford Research Systems). The 2f signals are demodulated from the photoacoustic signal for measuring the concentration of target gas; the 1f signals are demodulated from the photothermal signal for monitoring the jitter in the laser light intensity. The integration time of the lock-in amplifier is set to 300 ms, and the reference signals used for demodulation are generated by the waveform generator. Finally, the 2f photoacoustic and 1f photothermal signal data are acquired by a data acquisition device (USB 6363, National Instruments) with a sampling rate of 2 kS/s and a vertical resolution of 16 bits. The experiments are conducted in the laboratory at a temperature of 25 °C and atmosphere pressure.

3. Results and Discussion

3.1. Frequency Response of QTF

In this sensor system, two standards ~32 kHz QTFs are used to, respectively, measure the photoacoustic and photothermal signals. Since the response frequency of QTF is affected by environmental changes, it is necessary to calibrate the response frequency of QTF. Experiments are conducted to measure the response frequency of QTF utilizing electrical excitation. A function generator is utilized to generate a sinusoidal signal with an amplitude of 50 mV. The frequency ranges from 32,730 Hz to 32,780 Hz, and the response frequencies of QTF1 and QTF2 are measured, respectively. The experimental result is shown in Figure 2, and the center response frequencies of QTF and the quality factor Q values are calculated by fitting the Lorentz function. Table 1 demonstrates the center frequencies of QTF1 and QTF2, as well as the quality factor Q.

3.2. Modulation Signal Optimization

To improve the amplitude of the 2f photoacoustic signal, the modulation depth of the laser needs to be optimized when the 2f signal is detected in the QEPAS system. A fixed concentration of CH4:N2 mixture gas is passed into the photoacoustic cell, and the amplitude of the 2f photoacoustic signal with different modulation depths is recorded. Figure 3 depicts the amplitude of the 2f photoacoustic signal as a function of the laser modulation depth. The amplitude of the 2f photoacoustic signal has the maximum value when the modulation depth is 0.26 cm−1, which is the optimal condition. In the following experiments, the optimal modulation depth is chosen to be 0.26 cm−1.

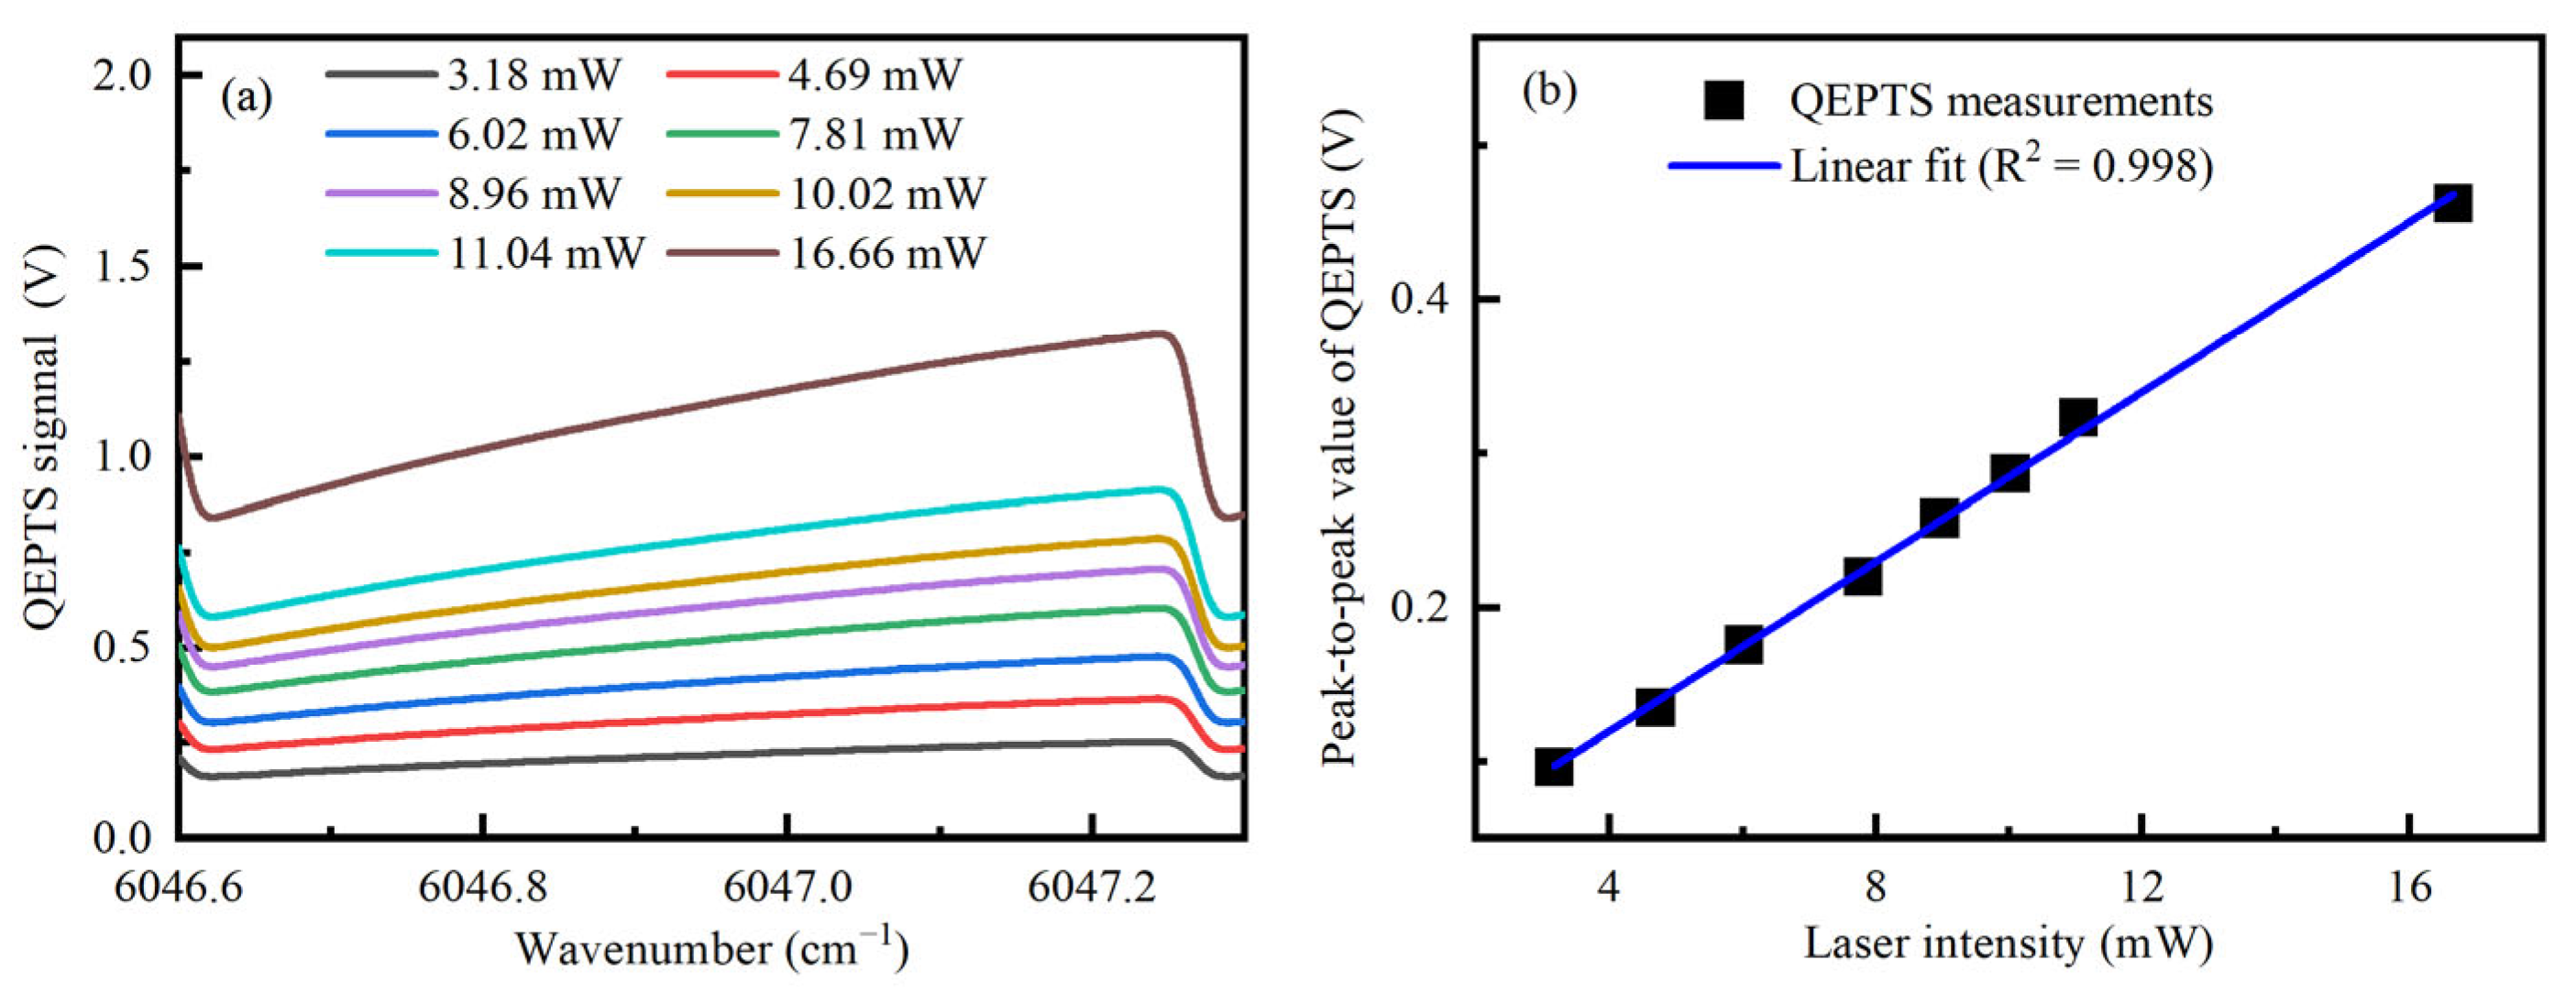
3.3. Investigation on Light Intensity Correction

To verify the light intensity normalization of the 2f photoacoustic signal using the 1f photothermal signal, the experiments are measured simultaneously for the 2f photoacoustic and 1f photothermal signals at different light intensities. The laser light intensity is varied from 3.18 mW to 16.66 mW using a fiber optic attenuator. Figure 4a illustrates the 2f photoacoustic signal at various light intensities. A linear fit to the amplitude of the 2f photoacoustic signal is performed to obtain the linearity of the 2f photoacoustic signal with light intensity with a linearity (R2) of 0.998. The result is shown in Figure 4b. Hence, it can be seen that the amplitude of the 2f photoacoustic signal is positively correlated with the light intensity. Similarly, Figure 5a shows the 1f photothermal signal at different light intensities, from which it can be seen that the amplitude, as well as the bias of the 1f photothermal signal, are positively correlated with the light intensity. When the laser power is 16.66 mW, the amplitude of the 1f photothermal signal is ~483 mV with a 1σ-noise level of 0.238 mV, resulting in a signal-to-noise ratio (SNR) of ~ 2029. Therefore, the sensitivity of laser intensity detection is estimated to be about 7.3 μW. As shown in Figure 5b, the linear fit to the amplitude of the 1f photothermal signal is performed and obtains the linearity (R2) of 0.998. The experimental result demonstrated that the amplitude of the 1f photothermal signal is linearly related to light intensity. Therefore, the jitter of light intensity can be monitored using the 1f photothermal signal, which can protect the 2f photoacoustic signal from the detrimental effects of the jitter of light intensity. Finally, the amplitude of the 1f photothermal signal is used to normalize the amplitude of the 2f photoacoustic signal, and the result is shown in Figure 6. The result shows that the amplitude fluctuation of the normalized 2f photoacoustic signal is less than 1.6%. It is demonstrated that normalization of the 2f photoacoustic signal using the 1f photothermal signal can effectively be immunized from the effects of light intensity changes in the 2f measurement in the QEPAS system.

3.4. Concentration Calibration

To evaluate the linear concentration response of this sensor system, samples of standard gas mixtures of CH4:N2 are measured at different concentrations. The 2f photoacoustic signal at various concentrations is depicted in Figure 7a. Since the volume of the photoacoustic cell is about 3 mL, the absorption optical path in the QEPTS system is very short and the absorption of the gas at different concentrations can be negligible. Thus, the measured 1f photothermal signals are almost identical at different gas concentrations. The 1f photothermal signal at varying concentrations is demonstrated in Figure 7b. The amplitude of the 1f photothermal signal is used to normalize the amplitude of the 2f photoacoustic signal, and the amplitude of the normalized 2f photoacoustic signal at different concentrations is fitted linearly. Figure 7c illustrates the result, and it shows that there is an excellent linear relationship between concentration and the amplitude of the normalized 2f photoacoustic signal, with a linearity (R2) of 0.996.

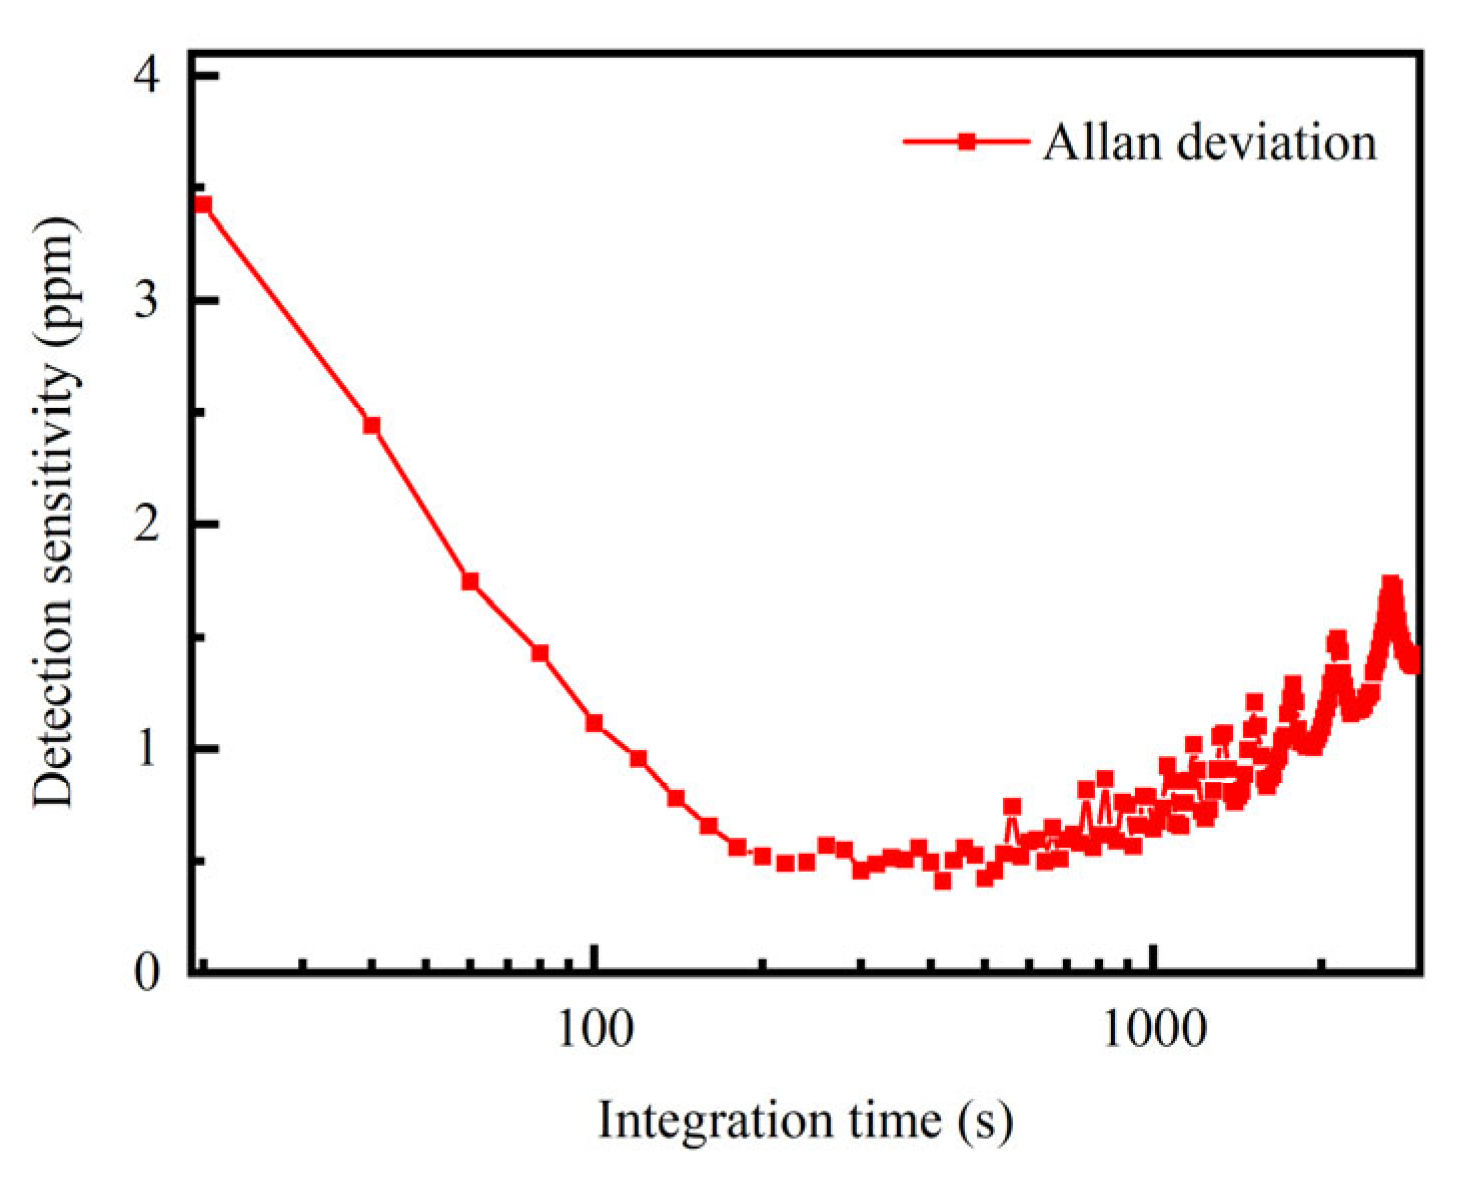
3.5. Allan Deviation

Finally, long-term continuous measurements of gas samples with constant concentrations are performed to evaluate the detection sensitivity of the sensor system. A gas sample of a CH4:N2 mixture with a concentration of 500 ppm is continuously passed into the photoacoustic cell, and the 2f photoacoustic and 1f photothermal signals are recorded for approximately 3 h, and the amplitude of the 2f photoacoustic signal is normalized using the amplitude of the 1f photothermal signal. Allan deviation analysis [31,32] is performed on the amplitude of the normalized 2f photoacoustic signal, and the result is shown in Figure 8. When the integration time is 20 s, the detection limit of the sensor system is 3.42 ppm. When the integration time is 420 s, the detection limit of the sensor system is 0.39 ppm. The experimental result showed that the sensor system has a high detection sensitivity.

4. Conclusions

In summary, this research proposed the method for the simultaneous acquisition of the 2f signal of the QEPAS system and the 1f signal of QEPTS system based on the dual-quartz-enhanced photoacoustic–photothermal spectroscopy. Two QTFs are used to detect the photoacoustic signal as well as the photothermal signal, and the 2f photoacoustic signal and the 1f photothermal signal are obtained simultaneously using frequency division multiplexing technique and lock-in amplifier. The laser light intensity can be obtained simultaneously with the detection of the concentration of target gas. The experimental result demonstrated that both the 2f photoacoustic and 1f photothermal signals have a good linear relationship with the light intensity (R2 = 0.998). The amplitude of the 1f photothermal signal is used to normalize the 2f photoacoustic signal, and the amplitude fluctuation of the normalized 2f signal is obtained to be less than 1.6%. To put it another way, the 1f photothermal signal is used to normalize the 2f photoacoustic signal so that it is protected from the harmful effects of the jitter of light intensity throughout the measurement process. The normalized 2f photoacoustic signal is displayed with a good linear response (R2 = 0.996) over a wide range of concentrations. Finally, according to Allan deviation analysis, the minimum detection limit for CH4 is 0.39 ppm when the integration time is 430 s. This method provides a novel and effective means of simultaneously obtaining gas concentration and light intensity measurements for the QEPAS system. It shows tremendous advantages for the light intensity drift caused by various environmental unpredictabilities during long-term field measurements, especially in its harsh environment.

Author Contributions

Conceptualization, X.C.; formal analysis, L.Y.; methodology, X.C.; project administration, Z.X., M.H. and R.K.; resources, M.H. and R.K.; validation, H.L.; writing—original draft, H.L.; writing—review and editing, H.L. and X.C. All authors have read and agreed to the published version of the manuscript.

Funding

This research was supported by the National Key Research and Development Project (2020YFA0405703), and the Foundation from the Key Laboratory of Environmental Optics and Technology (2005DP173065-2021-03).

Institutional Review Board Statement

Not applicable.

Informed Consent Statement

Informed consent was obtained from all subjects involved in the study.

Data Availability Statement

The data that support the plots within this paper are available from the corresponding author on request basis.

Conflicts of Interest

The authors declare no conflict of interest.

References

  1. Wang, Q.; Wang, Z.; Zhang, H.; Jiang, S.; Wang, Y.; Jin, W.; Ren, W. Dual-comb Photothermal Spectroscopy. Nat. Commun. 2021, 13, 2181. [Google Scholar] [CrossRef] [PubMed]
  2. Wang, Z.; Zhang, H.; Wang, J.; Jiang, S.; Gao, S.; Wang, Y.; Jin, W.; Wang, Q.; Ren, W. Photothermal multi-species detection in a hollow-core fiber with frequency-division multiplexing. Sens. Actuators B Chem. 2022, 369, 132333. [Google Scholar] [CrossRef]
  3. Chen, X.; Yang, C.G.; Hu, M.; Shen, J.-K.; Niu, E.-C.; Xu, Z.-Y.; Fan, X.-L.; Wei, M.; Yao, L.; He, Y.-B. Highly-sensitive NO, NO2, and NH3 measurements with an open-multipass cell based on mid-infrared wavelength modulation spectroscopy. Chin. Phys. B 2018, 27, 040701. [Google Scholar] [CrossRef]
  4. Xia, H.-H.; Kan, R.-F.; Liu, J.-G.; Xu, Z.-Y.; He, Y.-B. Analysis of algebraic reconstruction technique for accurate imaging of gas temperature and concentration based on tunable diode laser absorption spectroscopy. Chin. Phys. B 2016, 25, 064205. [Google Scholar] [CrossRef]
  5. Milde, T.; Hoppe, M.; Tatenguem, H.; Mordmüller, M.; O’Gorman, J.; Willer, U.; Schade, W.; Sacher, J. QEPAS sensor for breath analysis: A behavior of pressure. Appl. Opt. 2018, 57, C120–C127. [Google Scholar] [CrossRef]
  6. Bradshaw, J.L.; Bruno, J.D.; Lascola, K.M.; Leavitt, R.P.; Pham, J.T.; Towner, F.J.; Sonnenfroh, D.M.; Parameswaran, K.R. Parameswaran, Small, low-power consumption CO-sensor for post-fire cleanup aboard spacecraft. Proc. SPIE 2011, 8032, 80320D. [Google Scholar]
  7. Kosterev, A.; Bakhirkin, Y.; Curl, R.; Tittel, F. Quartz-enhanced photoacoustic spectroscopy. Opt. Lett. 2002, 27, 1902–1904. [Google Scholar] [CrossRef]
  8. Russo, S.D.; Sampaolo, A.; Patimisco, P.; Menduni, G.; Giglio, M.; Hoelzl, C.; Passaro, V.M.N.; Wu, H.; Dong, L.; Spagnolo, V. Quartz-enhanced photoacoustic spectroscopy exploiting low-frequency tuning forks as a tool to measure the vibrational relaxation rate in gas species. Photoacoustics 2021, 21, 100227. [Google Scholar] [CrossRef]
  9. Qiao, S.; Ma, Y.; Patimisco, P.; Sampaolo, A.; He, Y.; Lang, Z.; Tittel, F.K.; Spagnolo, V. Multi-pass quartz-enhanced photoacoustic spectroscopy-based trace gas sensing. Opt. Lett. 2021, 46, 977–980. [Google Scholar] [CrossRef]
  10. Wang, F.; Xue, Q.; Chang, J.; Wang, Z.; Sun, J.; Luan, X.; Li, C. Wavelength scanning Q-switched fiber-ring laser intra-cavity QEPAS using a standard 32.76 kHz quartz tuning fork for acetylene detection. Opt. Laser Technol. 2021, 134, 106612. [Google Scholar] [CrossRef]
  11. Menduni, G.; Sgobba, F.; Russo, S.D.; Ranieri, A.C.; Sampaolo, A.; Patimisco, P.; Giglio, M.; Passaro, V.M.N.; Csutak, S.; Assante, D.; et al. Fiber-coupled quartz-enhanced photoacoustic spectroscopy system for methane and ethane monitoring in the near-infrared spectral range. Molecules 2020, 25, 5607. [Google Scholar] [CrossRef]
  12. Ma, Y.; Tong, Y.; He, Y.; Jin, X.; Tittel, F.K. Compact and sensitive mid-infrared all-fiber quartz-enhanced photoacoustic spectroscopy sensor for carbon monoxide detection. Opt. Express 2019, 27, 9302–9312. [Google Scholar] [CrossRef]
  13. Lv, H.; Zheng, H.; Liu, Y.; Yang, Z.; Wu, Q.; Lin, H.; Montano, B.A.Z.; Zhu, W.; Yu, J.; Kan, R.; et al. Radial-cavity quartz-enhanced photoacoustic spectroscopy. Opt. Lett. 2021, 46, 3917–3920. [Google Scholar] [CrossRef]
  14. Zheng, H.; Dong, L.; Wu, H.; Yin, X.; Xiao, L.; Jia, S.; Curl, R.F.; Tittel, F.K. Application of acoustic micro-resonators in quartz-enhanced photoacoustic spectroscopy for trace gas analysis. Chem. Phys. Lett. 2018, 691, 462–472. [Google Scholar] [CrossRef]
  15. Yi, H.; Liu, K.; Chen, W.; Tan, T.; Wang, L.; Gao, X. Application of a broadband blue laser diode to trace NO 2 detection using off-beam quartz-enhanced photoacoustic spectroscopy. Opt. Lett. 2011, 36, 481–483. [Google Scholar] [CrossRef]
  16. Lackner, M. Tunable diode laser absorption spectroscopy (TDLAS) in the process industries—A review. Rev. Chem. Eng. 2007, 23, 65–147. [Google Scholar] [CrossRef]
  17. Wu, H.; Sampaolo, A.; Dong, L.; Patimisco, P.; Liu, X.; Zheng, H.; Yin, X.; Ma, W.; Zhang, L.; Yin, W.; et al. Quartz enhanced photoacoustic H2S gas sensor based on a fiber-amplifier source and a custom tuning fork with large prong spacing. Appl. Phys. Lett. 2015, 107, 111104. [Google Scholar] [CrossRef]
  18. Wang, Z.; Wang, Q.; Zhang, H.; Borri, S.; Galli, I.; Sampaolo, A.; Patimisco, P.; Spagnolo, V.L.; De Natale, P.; Ren, W. Doubly resonant sub-ppt photoacoustic gas detection with eight decades dynamic range. Photoacoustics 2022, 27, 100387. [Google Scholar] [CrossRef]
  19. Ma, Y.; He, Y.; Tong, Y.; Yu, X.; Tittel, F.K. Quartz-tuning-fork enhanced photothermal spectroscopy for ultra-high sensitive trace gas detection. Opt. Express 2018, 26, 32103–32110. [Google Scholar] [CrossRef]
  20. Mi, Y.; Ma, Y. Ultra-Highly Sensitive Ammonia Detection Based on Light-Induced Thermoelastic Spectroscopy. Sensors 2021, 21, 4548. [Google Scholar] [CrossRef]
  21. Zhang, Q.; Chang, J.; Cong, Z.; Wang, Z. Application of quartz tuning fork in photodetector based on photothermal effect. IEEE Photonics Technol. Lett. 2019, 31, 1592–1595. [Google Scholar] [CrossRef]
  22. Lang, Z.; Qiao, S.; He, Y.; Ma, Y. Quartz tuning fork-based demodulation of an acoustic signal induced by photo-thermo-elastic energy conversion. Photoacoustics 2021, 22, 100272. [Google Scholar] [CrossRef] [PubMed]
  23. Zhang, Q.; Gong, W.; Chang, J.; Wei, Y.; Zhang, T.; Wang, Z.; Li, Y.; Zhang, W.; Liu, T. Long-distance free space gas detection system based on QEPTS technique for CH4 leakage monitoring. Infrared Phys. Technol. 2022, 122, 104091. [Google Scholar] [CrossRef]
  24. Hu, L.; Zheng, C.; Zhang, M.; Zheng, K.; Zheng, J.; Song, Z.; Li, X.; Zhang, Y.; Wang, Y.; Tittel, F.K. Long-distance in-situ methane detection using near-infrared light-induced thermo-elastic spectroscopy. Photoacoustics 2021, 21, 100230. [Google Scholar] [CrossRef]
  25. Zhang, Q.; Chang, J.; Cong, Z.; Wang, Z. Long-path quartz tuning fork enhanced photothermal spectroscopy gas sensor using a high power Q-switched fiber laser. Measurement 2020, 156, 107601. [Google Scholar] [CrossRef]
  26. Chen, X.; Hu, M.; Liu, H.; Yao, L.; Xu, Z.; Kan, R. Light intensity correction for QEPAS using photothermal baseline. Front. Phys. 2022, 10, 964. [Google Scholar] [CrossRef]
  27. Russo, S.D.; Zifarelli, A.; Patimisco, P.; Sampaolo, A.; Wei, T.; Wu, H.; Dong, L.; Spagnolo, V. Light-induced thermo-elastic effect in quartz tuning forks exploited as a photodetector in gas absorption spectroscopy. Opt. Express 2020, 28, 19074–19084. [Google Scholar] [CrossRef]
  28. He, Y.; Ma, Y.; Tong, Y.; Yu, X.; Tittel, F.K. Ultra-high sensitive light-induced thermoelastic spectroscopy sensor with a high Q-factor quartz tuning fork and a multipass cell. Opt. Lett. 2019, 44, 1904–1907. [Google Scholar] [CrossRef]
  29. Xu, L.; Li, J.; Liu, N.; Zhou, S. Quartz crystal tuning fork based 2f/1f wavelength modulation spectroscopy. Spectrochim. Acta Part A Mol. Biomol. Spectrosc. 2022, 267, 120608. [Google Scholar] [CrossRef]
  30. Zhang, Q.; Chang, J.; Cong, Z.; Wang, Z. Quartz tuning fork enhanced photothermal spectroscopy gas detection system with a novel QCTF-self-difference technique. Sens. Actuators A Phys. 2019, 299, 111629. [Google Scholar] [CrossRef]
  31. Borri, S.; Patimisco, P.; Sampaolo, A.; Beere, H.E.; Ritchie, D.A.; Vitiello, M.S.; Scamarcio, G.; Spagnolo, V. Terahertz quartz enhanced photo-acoustic sensor. Appl. Phys. Lett. 2013, 113, 021105. [Google Scholar] [CrossRef]
  32. Werle, P. Accuracy and precision of laser spectrometers for trace gas sensing in the presence of optical fringes and atmospheric turbulence. Appl. Phys B 2011, 102, 313–329. [Google Scholar] [CrossRef]
Figure 1. Schematic diagram of the experimental setup. AOM: acousto-optic modulator; OA: fiber optic attenuator; and FC: fiber collimator.
Photonics 10 00165 g001
Figure 2. Response frequency curve of two QTFs measured by the electrical excitation method.
Photonics 10 00165 g002
Figure 3. The amplitude of the 2f photoacoustic signal relative to the modulation depth of the laser.
Photonics 10 00165 g003
Figure 4. QEPAS system measurements at different light intensities. (a) The 2f photoacoustic signal at different light intensities; and (b) linear fitting curve of the amplitude of the 2f photoacoustic signal at different light intensities.
Photonics 10 00165 g004
Figure 5. QEPTS system measurements at different light intensities. (a) The 1f photothermal signal at different light intensities; and (b) linear fitting curve of the amplitude of the 1f photothermal signal at different light intensities.
Photonics 10 00165 g005
Figure 6. The amplitude of normalized the 2f photoacoustic signal relative to light intensities.
Photonics 10 00165 g006
Figure 7. The system measured different concentrations of target gases. (a) The 2f photoacoustic signal at different gas concentrations; (b) the 1f photothermal signal at different gas concentrations; and (c) the relationship between the amplitude of the normalized 2f photoacoustic signal and target gas concentrations.
Photonics 10 00165 g007
Figure 8. Allan deviation analysis of the amplitude of normalized 2f photoacoustic signal.
Photonics 10 00165 g008
Table 1. Measurement parameters of QTFs.
QTF No.Resonant Frequency f (Hz)Q Factor
QTF132,751.947214
QTF232,758.878666
Disclaimer/Publisher’s Note: The statements, opinions and data contained in all publications are solely those of the individual author(s) and contributor(s) and not of MDPI and/or the editor(s). MDPI and/or the editor(s) disclaim responsibility for any injury to people or property resulting from any ideas, methods, instructions or products referred to in the content.

