Compression Optical Coherence Elastography for Assessing Elasticity of the Vaginal Wall under Prolapse after Neodymium Laser Treatment

 , ,
, ,  , and
, and 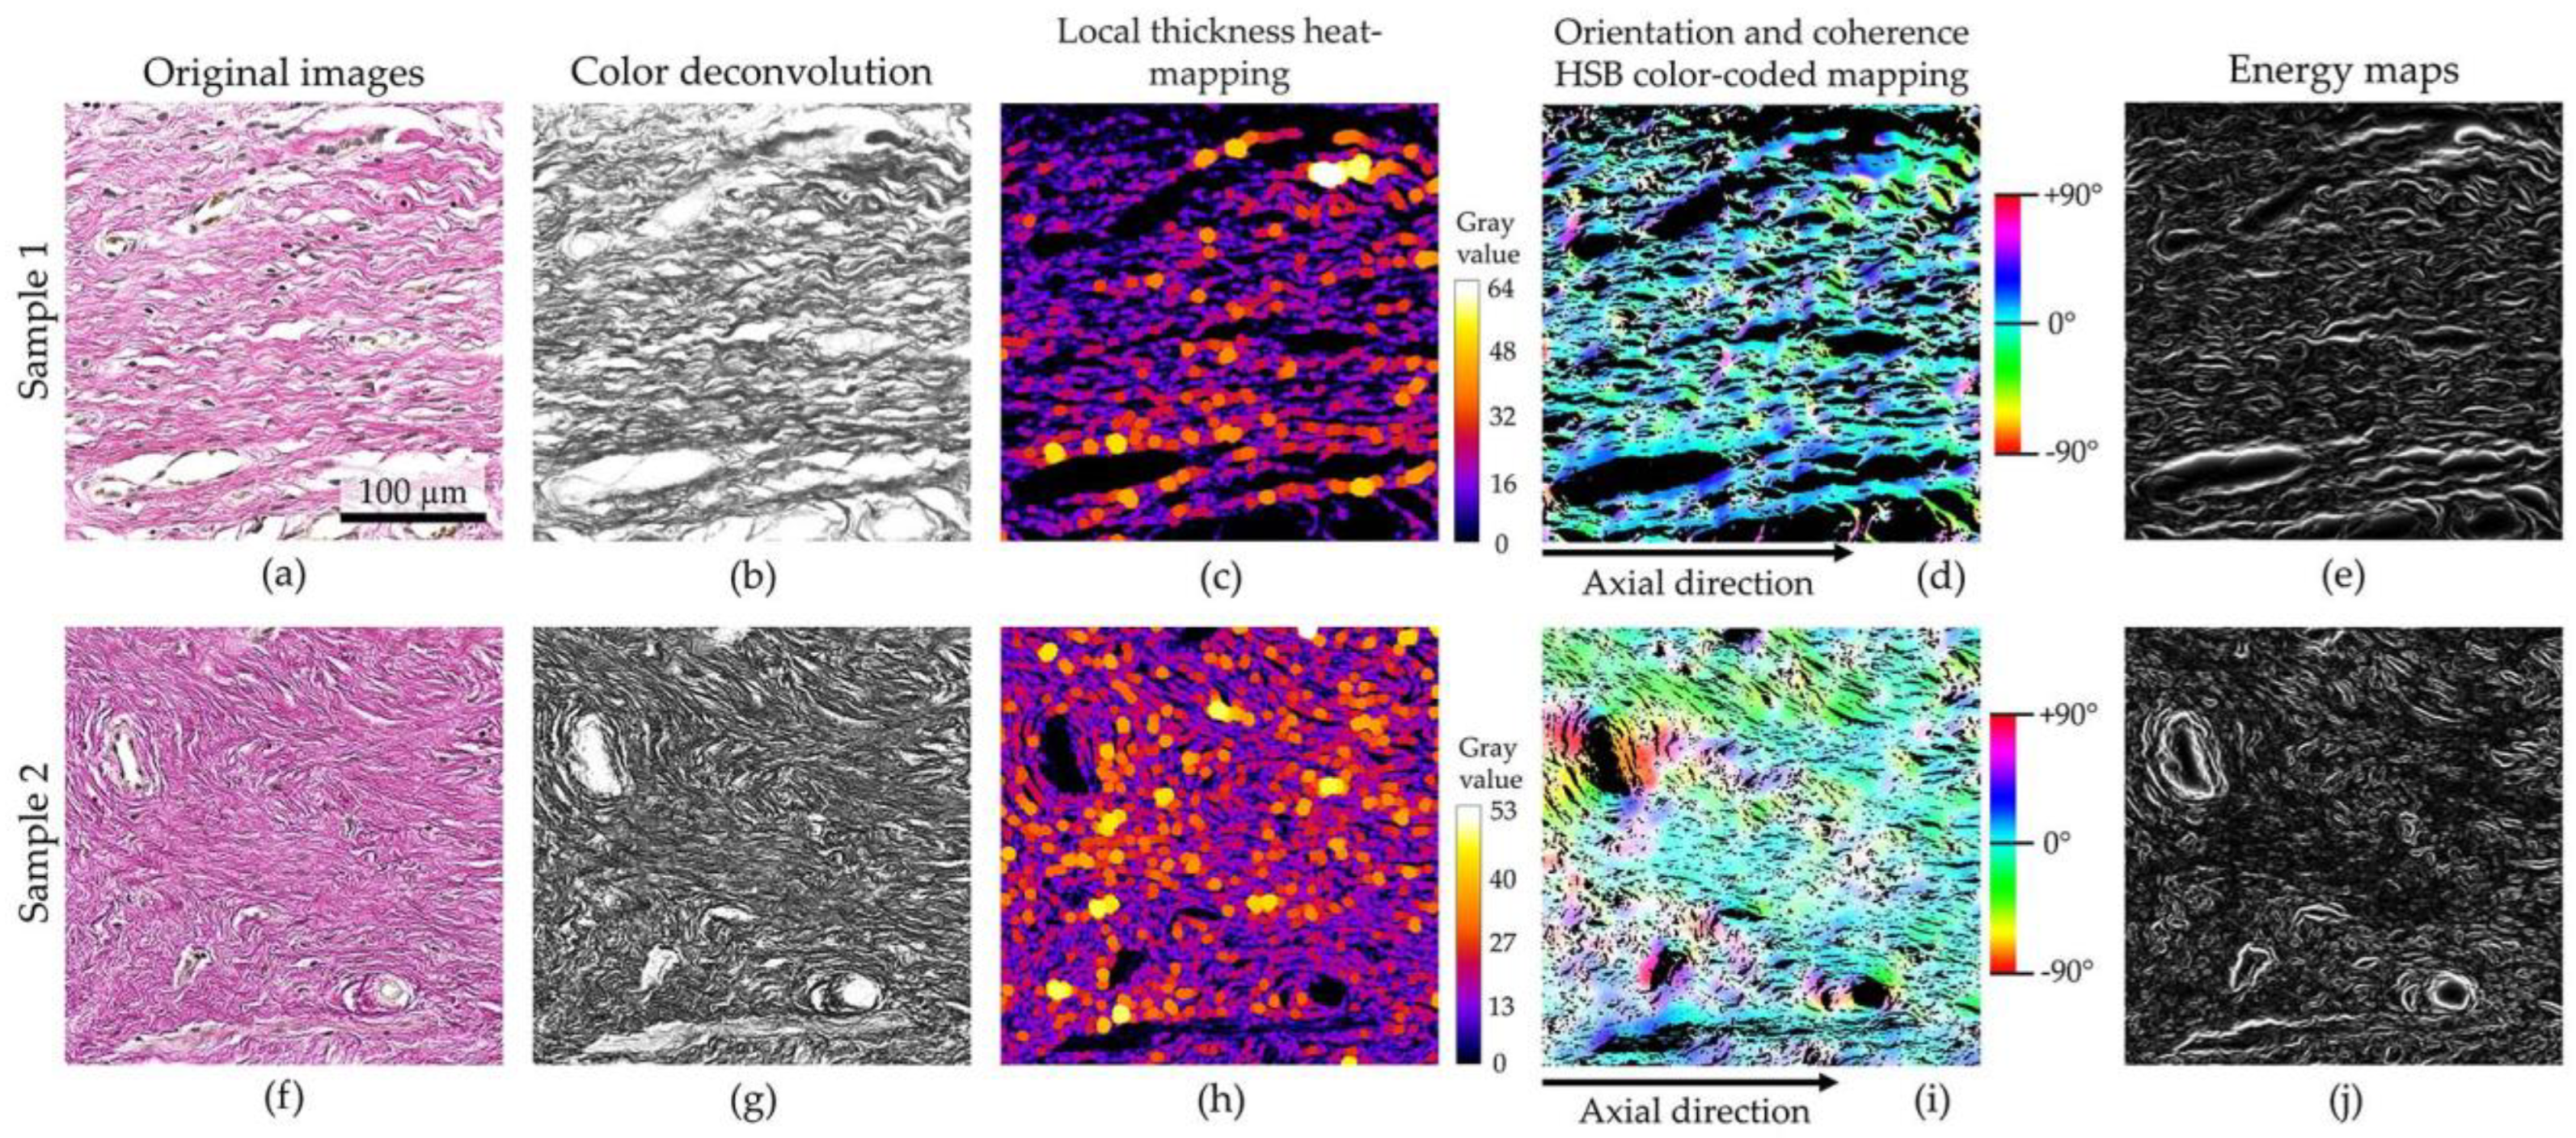
Abstract
:1. Introduction
2. Materials and Methods
2.1. Patients and Samples
2.2. Intravaginal Laser Treatment
2.3. Multimodal OCT Device
2.4. Compression OCE Imaging
2.5. Histology Imaging and Analysis
2.6. Statistics
3. Results
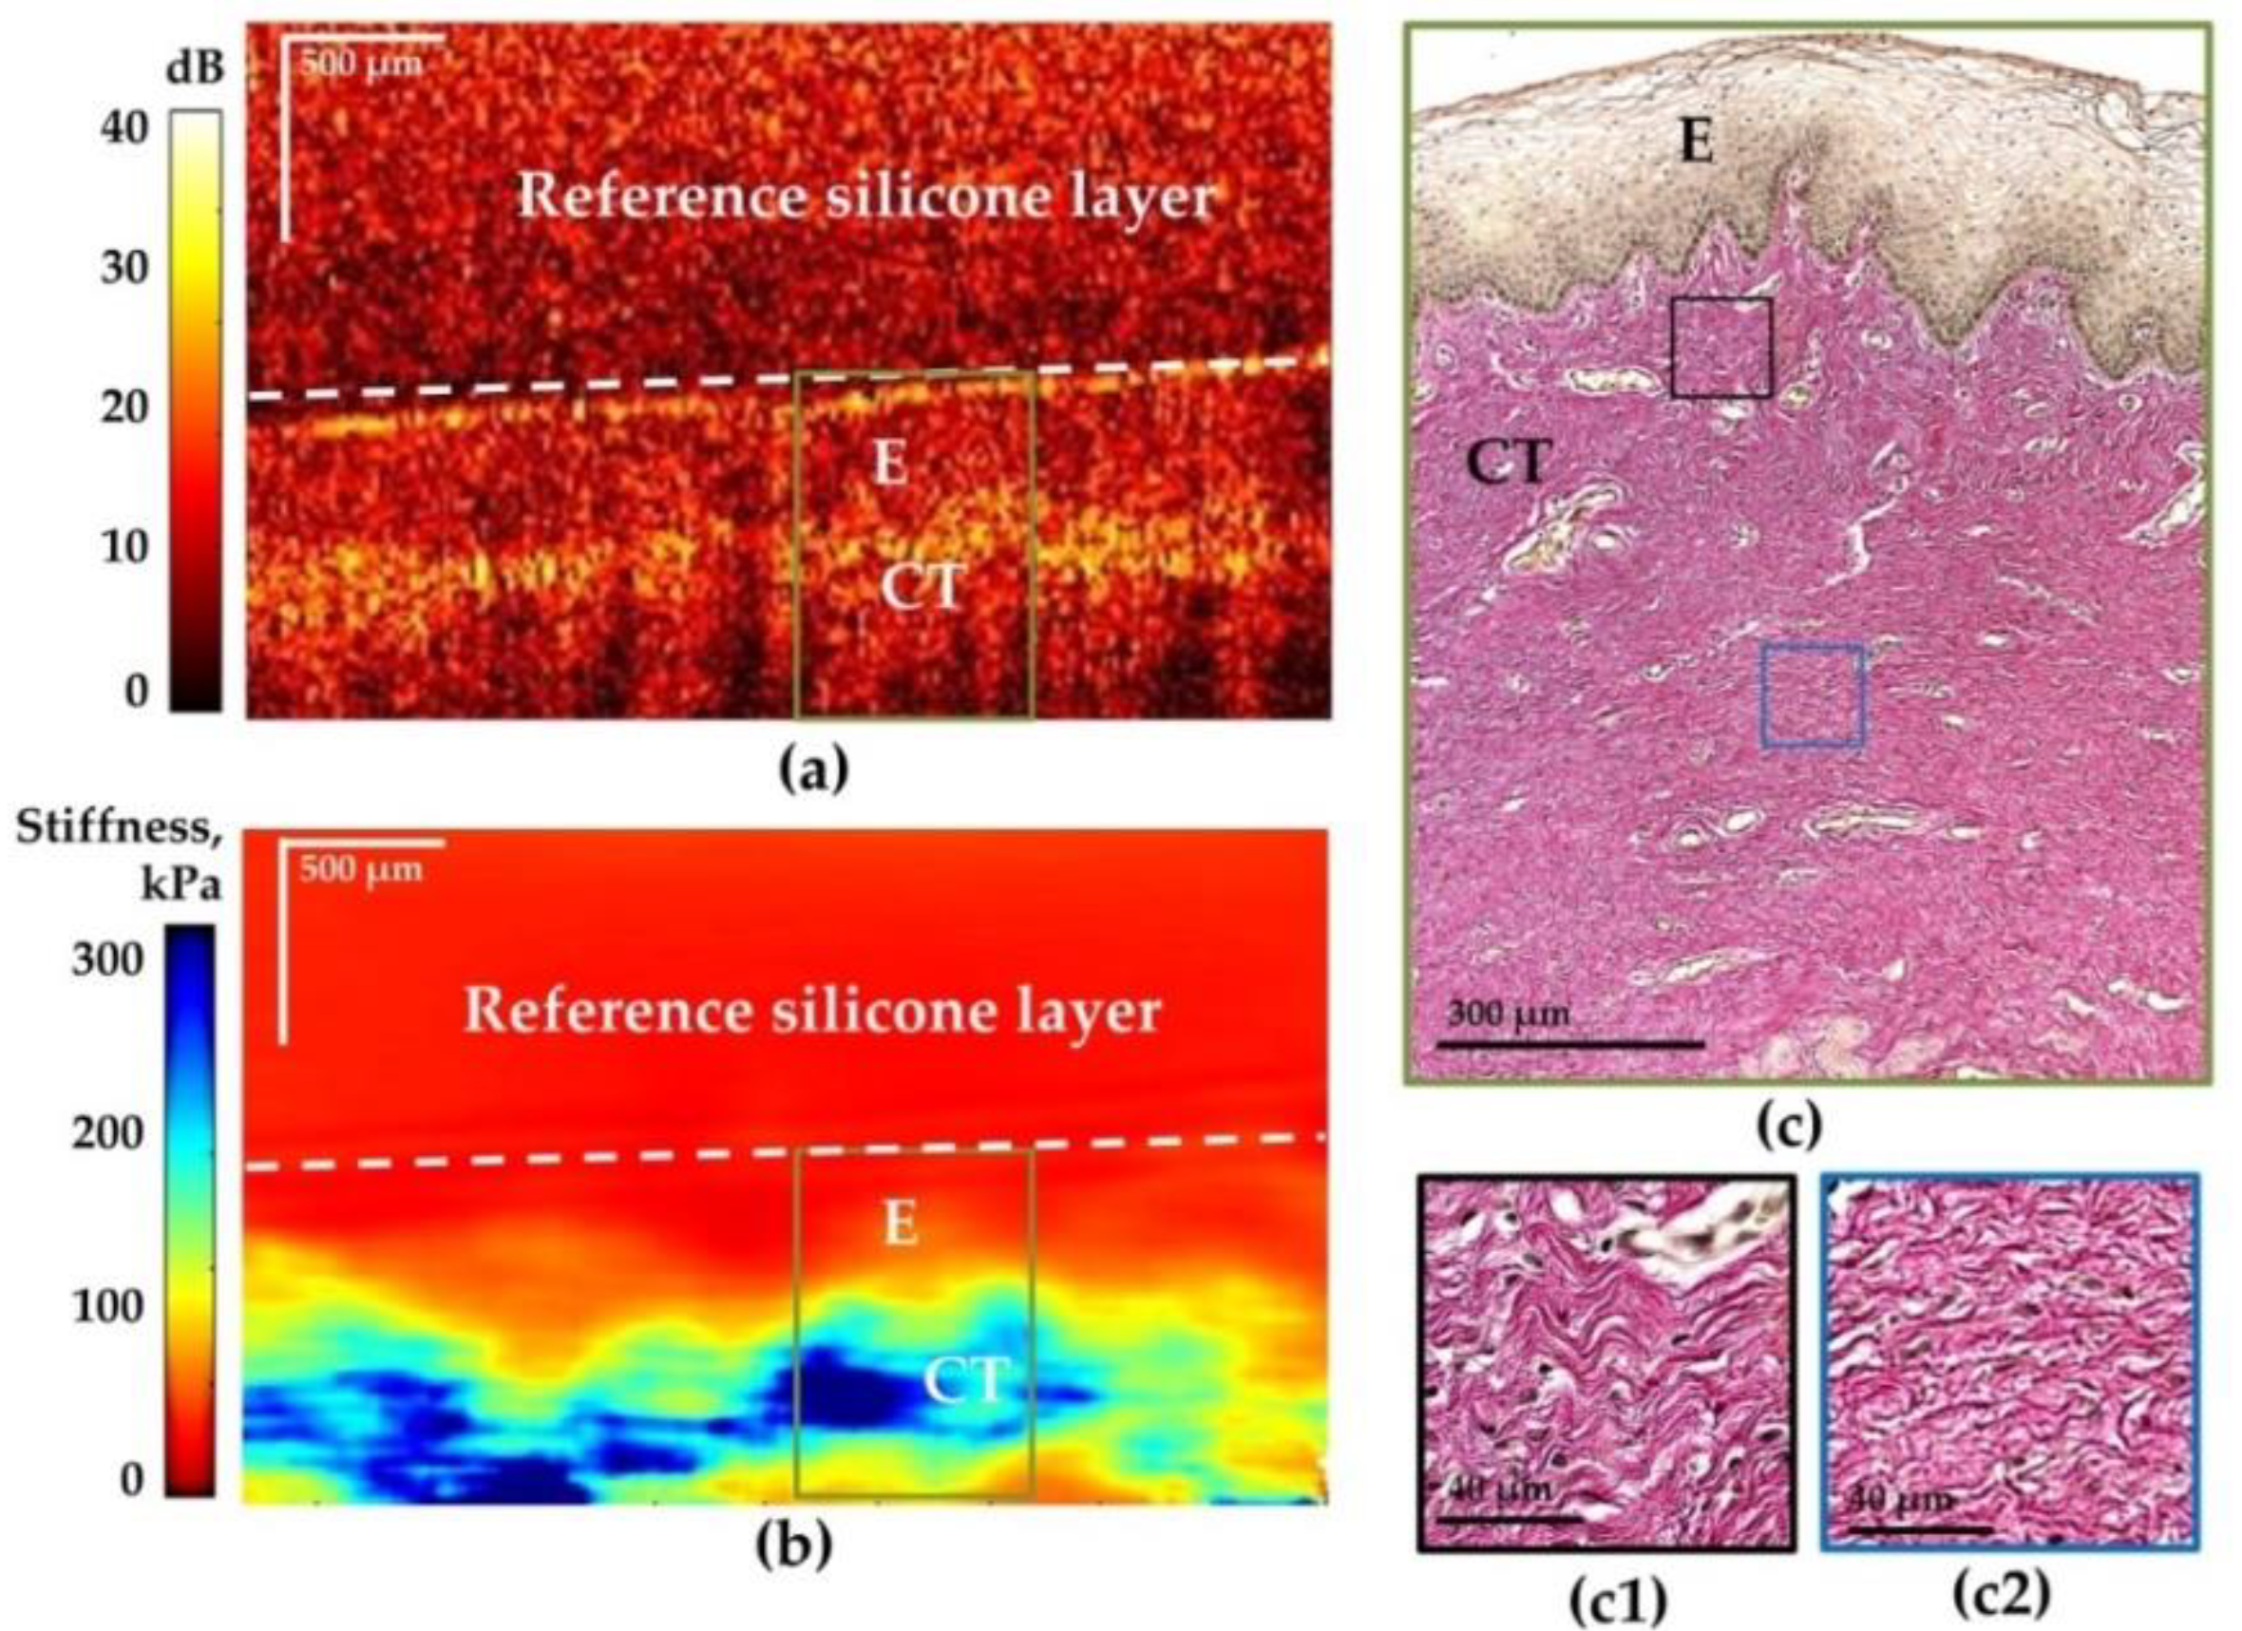
3.1. Comparative Visual Assessment of the OCT and C-OCE Images for Vaginal Wall at Different Conditions: Age Norm, Stages I–II Prolapse and Prolapse after Laser Treatment
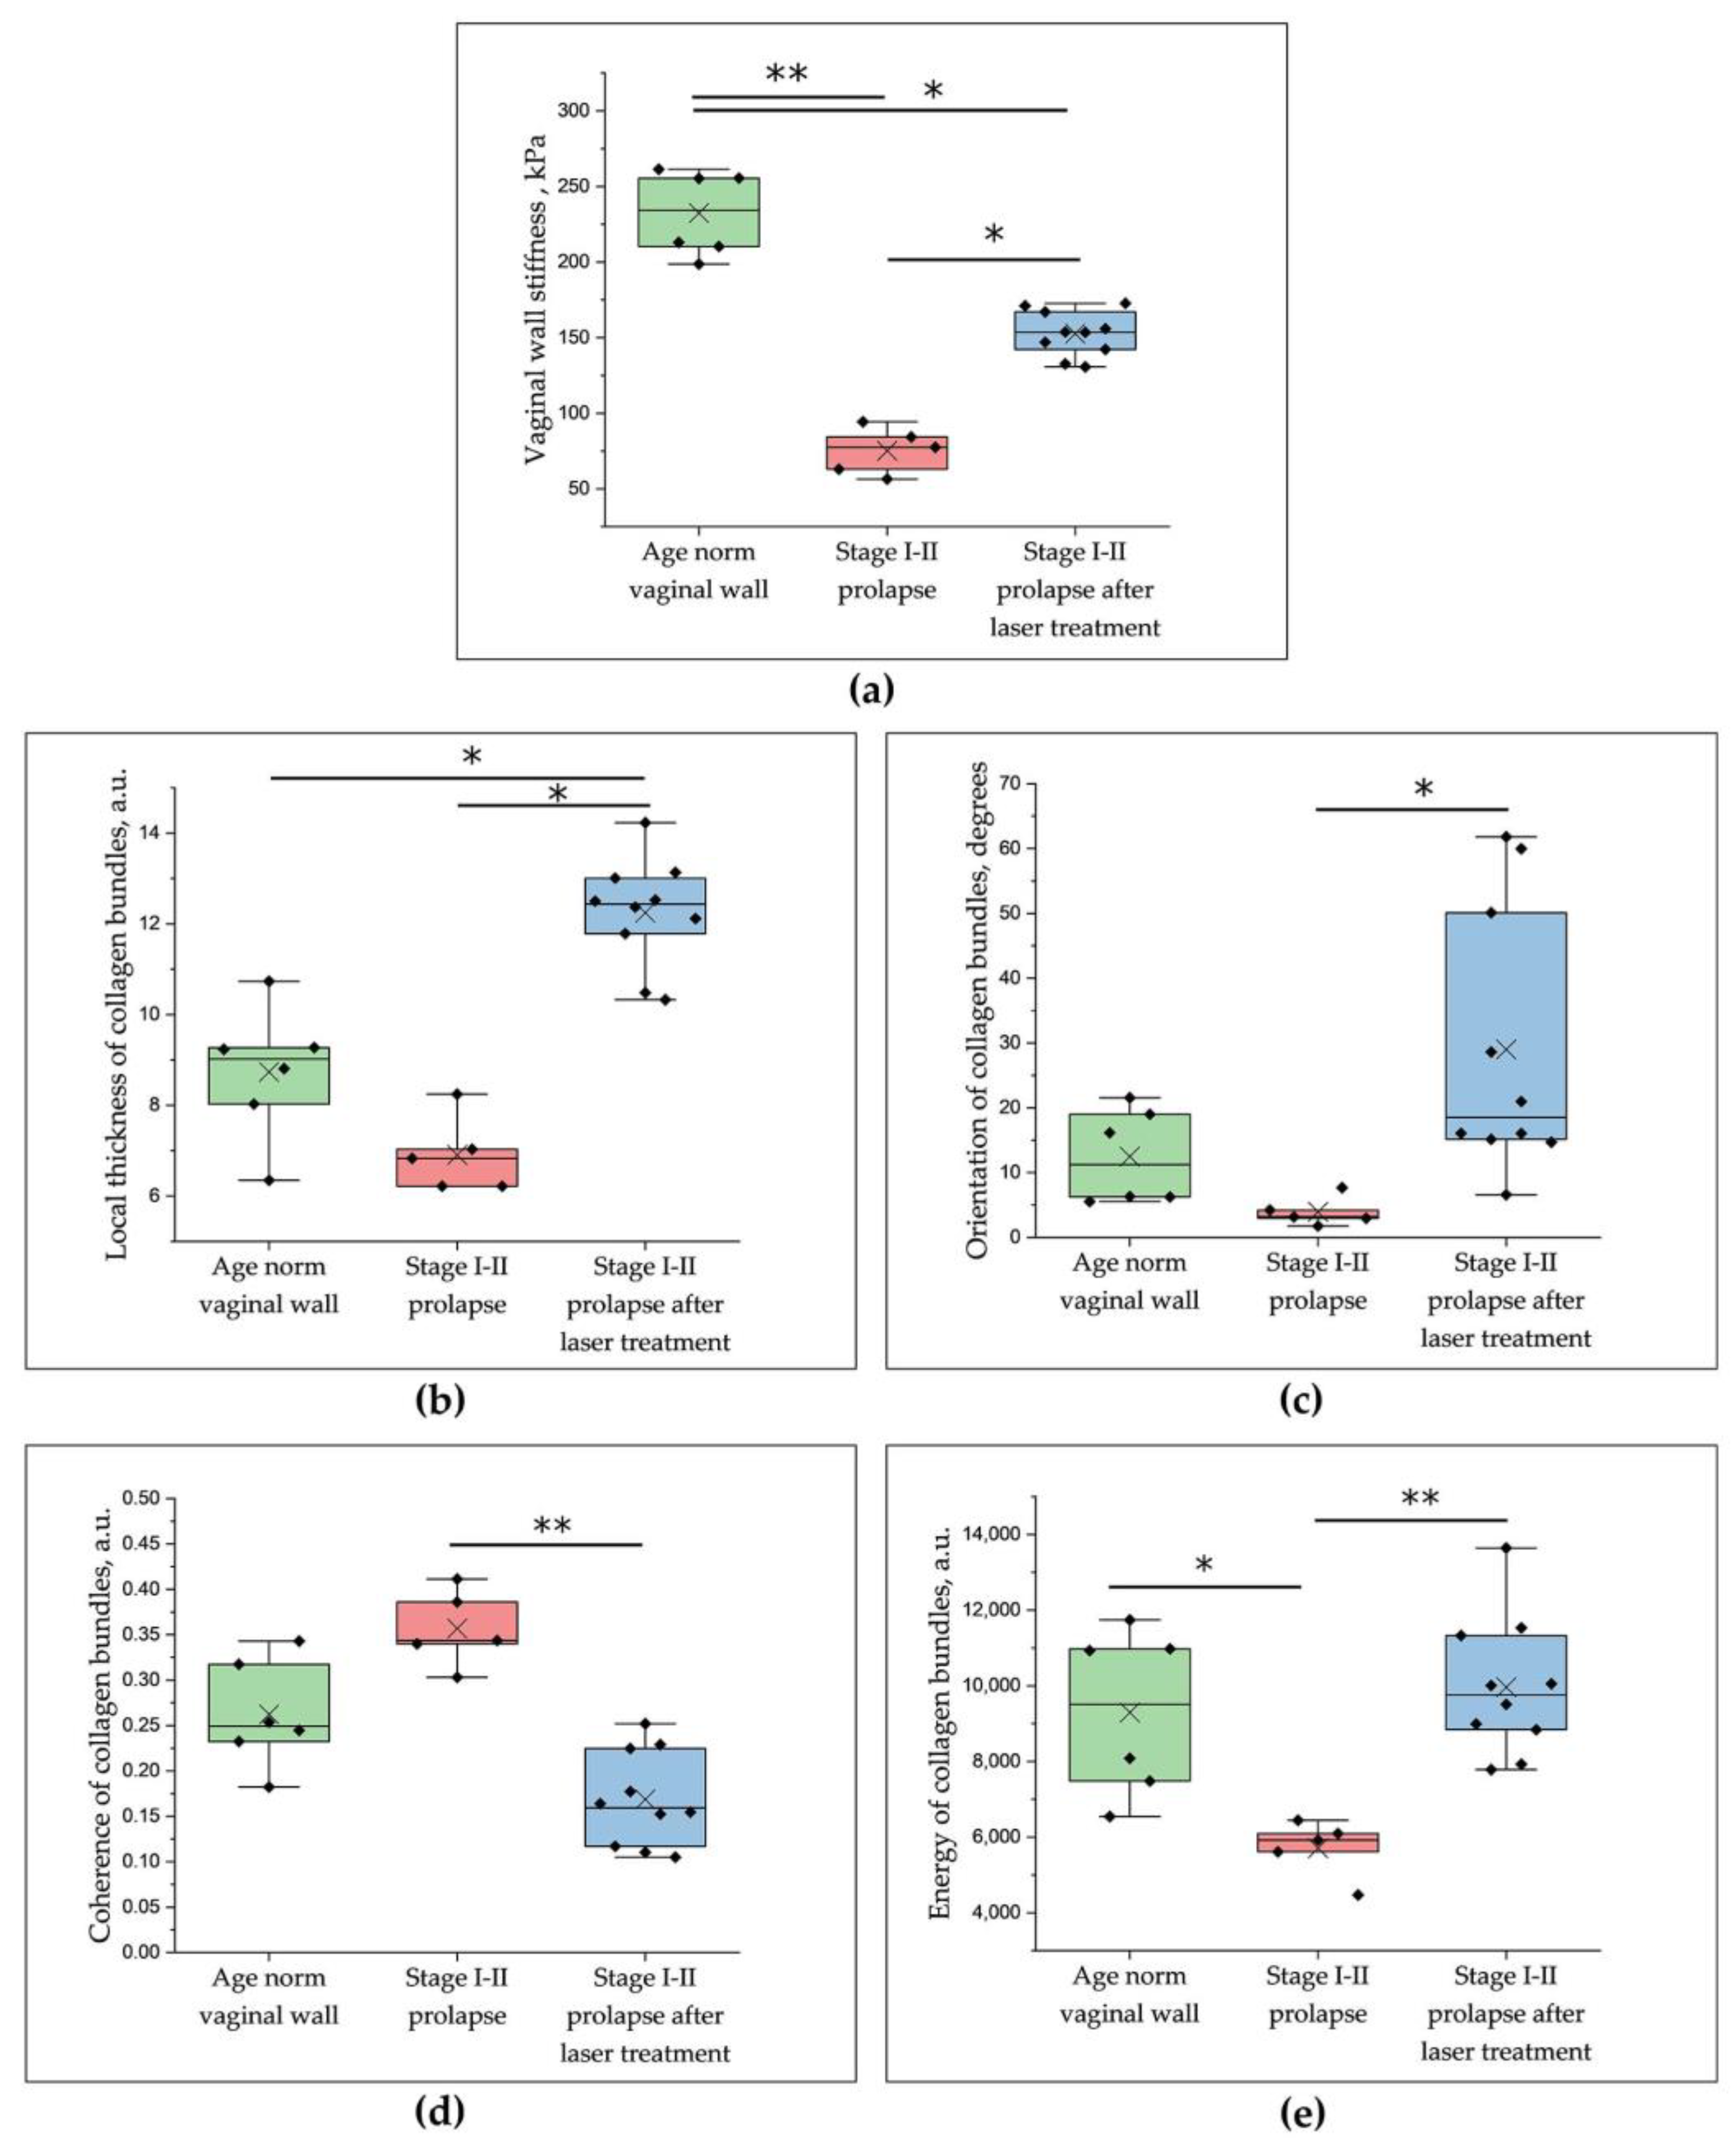
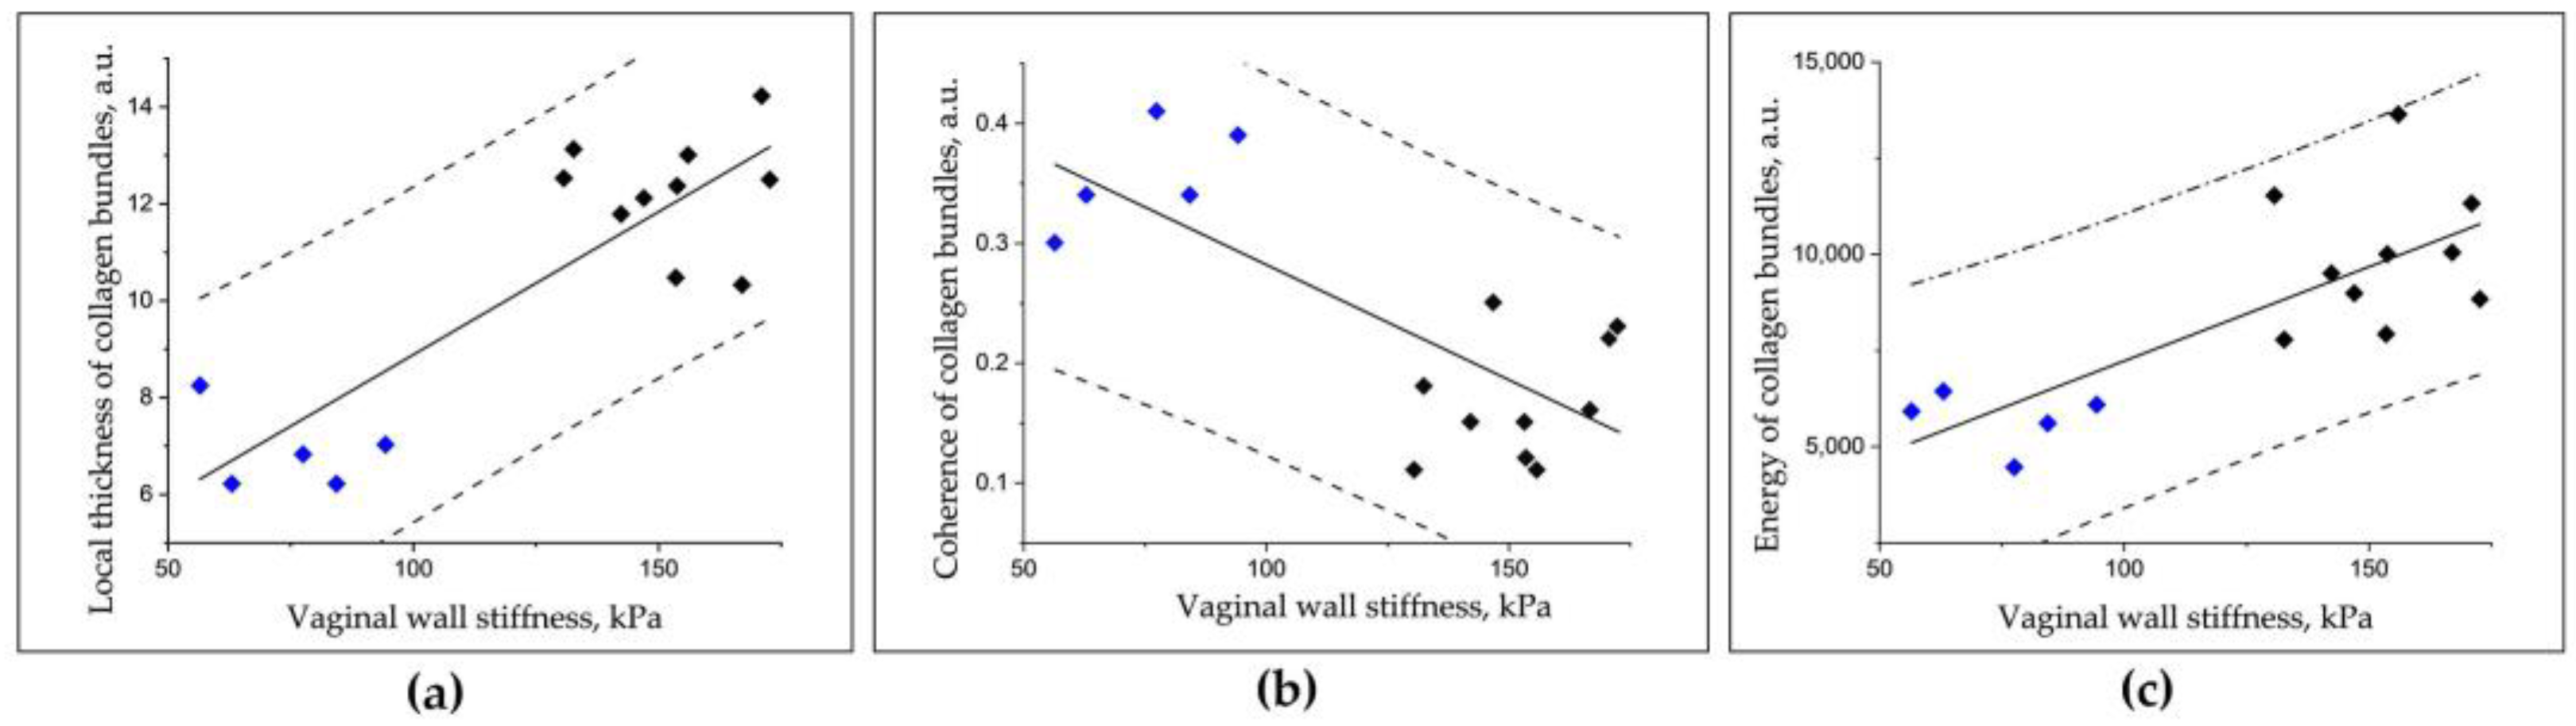
3.2. Comparative Numerical Assessment of the C-OCE and Histological Images for Vaginal Wall at Different Conditions: Age Norm, Stages I–II Prolapse and Prolapse after Laser Treatment
4. Discussion
5. Conclusions
Author Contributions
Funding
Institutional Review Board Statement
Informed Consent Statement
Data Availability Statement
Acknowledgments
Conflicts of Interest
References
- Abhyankar, P.; Uny, I.; Semple, K.; Wane, S.; Hagen, S.; Wilkinson, J.; Guerrero, K.; Tincello, D.; Duncan, E.; Calveley, E.; et al. Women’s Experiences of Receiving Care for Pelvic Organ Prolapse: A Qualitative Study. BMC Women’s Health 2019, 19, 45. [Google Scholar] [CrossRef]
- Hallock, J.L.; Handa, V.L. The Epidemiology of Pelvic Floor Disorders and Childbirth. Obstet. Gynecol. Clin. N. Am. 2016, 43, 1–13. [Google Scholar] [CrossRef] [PubMed] [Green Version]
- Vergeldt, T.F.M.; Weemhoff, M.; IntHout, J.; Kluivers, K.B. Risk Factors for Pelvic Organ Prolapse and Its Recurrence: A Systematic Review. Int. Urogynecol. J. 2015, 26, 1559–1573. [Google Scholar] [CrossRef] [PubMed] [Green Version]
- Weintraub, A.Y.; Glinter, H.; Marcus-Braun, N. Narrative Review of the Epidemiology, Diagnosis and Pathophysiology of Pelvic Organ Prolapse. Int. Braz. J. Urol. 2020, 46, 5–14. [Google Scholar] [CrossRef] [PubMed]
- Iglesia, C.B.; Smithling, K.R. Pelvic Organ Prolapse. Am. Fam. Physician 2017, 96, 179–185. [Google Scholar]
- Abramowitch, S.D.; Feola, A.; Jallah, Z.; Moalli, P.A. Tissue Mechanics, Animal Models, and Pelvic Organ Prolapse: A Review. Eur. J. Obstet. Gynecol. Reprod. Biol. 2009, 144, S146–S158. [Google Scholar] [CrossRef] [PubMed]
- Jean-Charles, C.; Rubod, C.; Brieu, M.; Boukerrou, M.; Fasel, J.; Cosson, M. Biomechanical Properties of Prolapsed or Non-Prolapsed Vaginal Tissue: Impact on Genital Prolapse Surgery. Int. Urogynecol. J. 2010, 21, 1535–1538. [Google Scholar] [CrossRef]
- Ophir, J. Elastography: A Quantitative Method for Imaging the Elasticity of Biological Tissues. Ultrason. Imaging 1991, 13, 111–134. [Google Scholar] [CrossRef]
- Manduca, A.; Oliphant, T.E.; Dresner, M.A.; Mahowald, J.L.; Kruse, S.A.; Amromin, E.; Felmlee, J.P.; Greenleaf, J.F.; Ehman, R.L. Magnetic Resonance Elastography: Non-Invasive Mapping of Tissue Elasticity. Med. Image Anal. 2001, 5, 237–254. [Google Scholar] [CrossRef]
- Nanjappa, M.; Kolipaka, A. Magnetic Resonance Elastography of the Brain. Magn. Reson. Imaging Clin. N. Am. 2021, 29, 617–630. [Google Scholar] [CrossRef]
- Wang, J.; Deng, Y.; Jondal, D.; Woodrum, D.M.; Shi, Y.; Yin, M.; Venkatesh, S.K. New and Emerging Applications of Magnetic Resonance Elastography of Other Abdominal Organs. Top. Magn. Reson. Imaging 2018, 27, 335–352. [Google Scholar] [CrossRef] [PubMed]
- Sigrist, R.M.S.; Liau, J.; Kaffas, A.E.; Chammas, M.C.; Willmann, J.K. Ultrasound Elastography: Review of Techniques and Clinical Applications. Theranostics 2017, 7, 1303–1329. [Google Scholar] [CrossRef] [PubMed]
- Morris, D.C.; Chan, D.Y.; Palmeri, M.L.; Polascik, T.J.; Foo, W.-C.; Nightingale, K.R. Prostate Cancer Detection Using 3-D Shear Wave Elasticity Imaging. Ultrasound Med. Biol. 2021, 47, 1670–1680. [Google Scholar] [CrossRef] [PubMed]
- Huang, D.; Swanson, E.A.; Lin, C.P.; Schuman, J.S.; Stinson, W.G.; Chang, W.; Hee, M.R.; Flotte, T.; Gregory, K.; Puliafito, C.A.; et al. Optical Coherence Tomography. Science 1991, 254, 1178–1181. [Google Scholar] [CrossRef] [PubMed] [Green Version]
- Drexler, W.; Liu, M.; Kumar, A.; Kamali, T.; Unterhuber, A.; Leitgeb, R.A. Optical Coherence Tomography Today: Speed, Contrast, and Multimodality. J. Biomed. Opt. 2014, 19, 071412. [Google Scholar] [CrossRef] [PubMed]
- Leitgeb, R.; Placzek, F.; Rank, E.; Krainz, L.; Haindl, R.; Li, Q.; Liu, M.; Andreana, M.; Unterhuber, A.; Schmoll, T.; et al. Enhanced Medical Diagnosis for DOCTors: A Perspective of Optical Coherence Tomography. J. Biomed. Opt. 2021, 26. [Google Scholar] [CrossRef]
- Cogliati, A.; Canavesi, C.; Hayes, A.; Tankam, P.; Duma, V.-F.; Santhanam, A.; Thompson, K.P.; Rolland, J.P. MEMS-Based Handheld Scanning Probe with Pre-Shaped Input Signals for Distortion-Free Images in Gabor-Domain Optical Coherence Microscopy. Opt. Express 2016, 24, 13365. [Google Scholar] [CrossRef]
- Loran, O.B.; Seregin, A.S.; Dovlatov, Z.A. The clinical outcomes of the modern minimally invasive technologies in the treatment of the female pelvic organ prolaps. Eksperimental’naya I Klin. Urol. 2015, 2, 124–130. [Google Scholar]
- Baessler, K.; Christmann-Schmid, C.; Maher, C.; Haya, N.; Crawford, T.J.; Brown, J. Surgery for Women with Pelvic Organ Prolapse with or without Stress Urinary Incontinence. Cochrane Database Syst. Rev. 2018, 2018. [Google Scholar] [CrossRef]
- González Isaza, P.; Jaguszewska, K.; Cardona, J.L.; Lukaszuk, M. Long-Term Effect of Thermoablative Fractional CO2 Laser Treatment as a Novel Approach to Urinary Incontinence Management in Women with Genitourinary Syndrome of Menopause. Int. Urogynecol. J. 2018, 29, 211–215. [Google Scholar] [CrossRef]
- Paraiso, M.F.R.; Ferrando, C.A.; Sokol, E.R.; Rardin, C.R.; Matthews, C.A.; Karram, M.M.; Iglesia, C.B. A Randomized Clinical Trial Comparing Vaginal Laser Therapy to Vaginal Estrogen Therapy in Women with Genitourinary Syndrome of Menopause: The VeLVET Trial. Menopause 2020, 27, 50–56. [Google Scholar] [CrossRef] [PubMed]
- Salvatore, S.; Leone Roberti Maggiore, U.; Athanasiou, S.; Origoni, M.; Candiani, M.; Calligaro, A.; Zerbinati, N. Histological Study on the Effects of Microablative Fractional CO2 Laser on Atrophic Vaginal Tissue: An Ex Vivo Study. Menopause 2015, 22, 845–849. [Google Scholar] [CrossRef] [PubMed]
- Mothes, A.R.; Runnebaum, M.; Runnebaum, I.B. An Innovative Dual-Phase Protocol for Pulsed Ablative Vaginal Erbium:YAG Laser Treatment of Urogynecological Symptoms. Eur. J. Obstet. Gynecol. Reprod. Biol. 2018, 229, 167–171. [Google Scholar] [CrossRef] [PubMed]
- Gambacciani, M.; Palacios, S. Laser Therapy for the Restoration of Vaginal Function. Maturitas 2017, 99, 10–15. [Google Scholar] [CrossRef] [PubMed]
- Lukac, M.; Gaspar, A.; Bajd, F. Dual tissue regeneration: Non-ablative resurfacing of soft tissues with FotonaSmooth® mode Er:YAG laser. J. Laser Health Acad. 2018, 1, 1–15. [Google Scholar]
- Fistonić, N.; Fistonić, I.; Guštek, Š.F.; Turina, I.S.B.; Marton, I.; Vižintin, Z.; Kažič, M.; Hreljac, I.; Perhavec, T.; Lukač, M. Minimally Invasive, Non-Ablative Er:YAG Laser Treatment of Stress Urinary Incontinence in Women—a Pilot Study. Lasers Med. Sci. 2016, 31, 635–643. [Google Scholar] [CrossRef] [Green Version]
- Gaspar, A.; Brandi, H.; Gomez, V.; Luque, D. Efficacy of Erbium:YAG Laser Treatment Compared to Topical Estriol Treatment for Symptoms of Genitourinary Syndrome of Menopause: EFFICACY OF ERBIUM:YAG LASER TREATMENT OF GSM. Lasers Surg. Med. 2017, 49, 160–168. [Google Scholar] [CrossRef]
- Ishchenko, A.A.; Ishchenko, A.I.; Shulchina, I.V.; Muravlev, A.I. Use of Laser Technologies in a Complex of Arrangements to Patients Operated for the Genital Prolapse. GYN 2016, 18. [Google Scholar] [CrossRef]
- Vogel, A.; Venugopalan, V. Mechanisms of Pulsed Laser Ablation of Biological Tissues. Chem. Rev. 2003, 103, 577–644. [Google Scholar] [CrossRef] [Green Version]
- Jacques, S.L. Optical Properties of Biological Tissues: A Review. Phys. Med. Biol. 2013, 58, R37–R61. [Google Scholar] [CrossRef]
- Taroni, P.; Comelli, D.; Pifferi, A.; Torricelli, A.; Cubeddu, R. Absorption of Collagen: Effects on the Estimate of Breast Composition and Related Diagnostic Implications. J. Biomed. Opt. 2007, 12, 014021. [Google Scholar] [CrossRef] [PubMed]
- Sajjadi, A.Y.; Mitra, K.; Grace, M. Expression of Heat Shock Proteins 70 and 47 in Tissues Following Short-Pulse Laser Irradiation: Assessment of Thermal Damage and Healing. Med. Eng. Phys. 2013, 35, 1406–1414. [Google Scholar] [CrossRef] [PubMed]
- Souil, E.; Capon, A.; Mordon, S.; Dinh-Xuan, A.T.; Polla, B.S.; Bachelet, M. Treatment with 815-Nm Diode Laser Induces Long-Lasting Expression of 72-KDa Heat Shock Protein in Normal Rat Skin. Br. J. Dermatol. 2001, 144, 260–266. [Google Scholar] [CrossRef]
- Goldberg, D.J.; Silapunt, S. Histologic Evaluation of a Q-Switched Nd:YAG Laser in the Nonablative Treatment of Wrinkles. Dermatol. Surg. 2001, 27, 744–746. [Google Scholar] [CrossRef] [PubMed]
- Kulikov, I.A.; Apolikhina, I.A.; Spokoinyi, L.B. Vozmozhnosti primeneniia neodimovogo lazera (ND:YAG) v ginekologii. Metamorfozy 2019, 26, 26–31. (In Russian) [Google Scholar]
- Pauzina, O.A.; Apolikhina, I.A. Vozmozhnosti primeneniya neodimovogo lazera (ND:YAG) v ginekologicheskoy praktike. GLAVVRACH 2020, 6. (In Russian) [Google Scholar] [CrossRef]
- Pauzina, O.A.; Apolikhina, I.A.; Malyshkina, D.A. Possibilities of using neodymium laser (Nd:YAG) in patients with concomitant diseases which are accompanied by pathological discharge from the genital tract. Gynecology 2020, 22, 75–81. [Google Scholar] [CrossRef]
- Vincent, K.L.; Stanberry, L.R.; Moench, T.R.; Breitkopf, C.R.; Loza, M.L.; Wei, J.; Grady, J.; Paull, J.; Motamedi, M.; Rosenthal, S.L. Optical Coherence Tomography Compared With Colposcopy for Assessment of Vaginal Epithelial Damage: A Randomized Controlled Trial. Obstet. Gynecol. 2011, 118, 1354–1361. [Google Scholar] [CrossRef] [Green Version]
- Shalom, D.F.; Ledford, K.J.; Qadir, A.; Lind, L.R.; Winkler, H.A. Visualization of Synthetic Mesh Utilizing Optical Coherence Tomography. Int. Urogynecol. J. 2013, 24, 1909–1914. [Google Scholar] [CrossRef]
- Nandy, S.; Sanders, M.; Zhu, Q. Classification and Analysis of Human Ovarian Tissue Using Full Field Optical Coherence Tomography. Biomed. Opt. Express 2016, 7, 5182. [Google Scholar] [CrossRef] [Green Version]
- Yang, Y.; Wang, T.; Biswal, N.C.; Wang, X.; Sanders, M.; Brewer, M.; Zhu, Q. Optical Scattering Coefficient Estimated by Optical Coherence Tomography Correlates with Collagen Content in Ovarian Tissue. J. Biomed. Opt. 2011, 16, 090504. [Google Scholar] [CrossRef] [PubMed] [Green Version]
- Hariri, L.P.; Bonnema, G.T.; Schmidt, K.; Winkler, A.M.; Korde, V.; Hatch, K.D.; Davis, J.R.; Brewer, M.A.; Barton, J.K. Laparoscopic Optical Coherence Tomography Imaging of Human Ovarian Cancer. Gynecol. Oncol. 2009, 114, 188–194. [Google Scholar] [CrossRef] [PubMed] [Green Version]
- Sudol, N.T.; Miao, Y.; Li, Y.; Chen, J.J.; Jing, J.C.; Zhu, J.; Tadir, Y.; Chen, Z.; Lane, F. Optical Vaginal Biopsy Using Optical Coherence Tomography. Female Pelvic. Med. Reconstr. Surg. 2020, 26, 155–158. [Google Scholar] [CrossRef] [PubMed]
- Gubarkova, E.V.; Kiseleva, E.B.; Sirotkina, M.A.; Vorontsov, D.A.; Achkasova, K.A.; Kuznetsov, S.S.; Yashin, K.S.; Matveyev, A.L.; Sovetsky, A.A.; Matveev, L.A.; et al. Diagnostic Accuracy of Cross-Polarization OCT and OCT-Elastography for Differentiation of Breast Cancer Subtypes: Comparative Study. Diagnostics 2020, 10, 994. [Google Scholar] [CrossRef] [PubMed]
- Schmitt, J.M. OCT Elastography: Imaging Microscopic Deformation and Strain of Tissue. Opt. Express 1998, 3, 199. [Google Scholar] [CrossRef] [Green Version]
- Zaitsev, V.Y.; Matveyev, A.L.; Matveev, L.A.; Sovetsky, A.A.; Hepburn, M.S.; Mowla, A.; Kennedy, B.F. Strain and Elasticity Imaging in Compression Optical Coherence Elastography: The Two-decade Perspective and Recent Advances. J. Biophotonics 2021, 14, e202000257. [Google Scholar] [CrossRef]
- Larin, K.V.; Sampson, D.D. Optical Coherence Elastography – OCT at Work in Tissue Biomechanics [Invited]. Biomed. Opt. Express 2017, 8, 1172. [Google Scholar] [CrossRef] [Green Version]
- Li, E.; Makita, S.; Azuma, S.; Miyazawa, A.; Yasuno, Y. Compression Optical Coherence Elastography with Two-Dimensional Displacement Measurement and Local Deformation Visualization. Opt. Lett. 2019, 44, 787. [Google Scholar] [CrossRef]
- Kennedy, K.M.; Zilkens, R.; Allen, W.M.; Foo, K.Y.; Fang, Q.; Chin, L.; Sanderson, R.W.; Anstie, J.; Wijesinghe, P.; Curatolo, A.; et al. Diagnostic Accuracy of Quantitative Micro-Elastography for Margin Assessment in Breast-Conserving Surgery. Cancer Res. 2020, 80, 1773–1783. [Google Scholar] [CrossRef] [Green Version]
- Gubarkova, E.V.; Sovetsky, A.A.; Zaitsev, V.Y.; Matveyev, A.L.; Vorontsov, D.A.; Sirotkina, M.A.; Matveev, L.A.; Plekhanov, A.A.; Pavlova, N.P.; Kuznetsov, S.S.; et al. OCT-Elastography-Based Optical Biopsy for Breast Cancer Delineation and Express Assessment of Morphological/Molecular Subtypes. Biomed. Opt. Express 2019, 10, 2244. [Google Scholar] [CrossRef]
- Allen, W.M.; Foo, K.Y.; Zilkens, R.; Kennedy, K.M.; Fang, Q.; Chin, L.; Dessauvagie, B.F.; Latham, B.; Saunders, C.M.; Kennedy, B.F. Clinical Feasibility of Optical Coherence Micro-Elastography for Imaging Tumor Margins in Breast-Conserving Surgery. Biomed. Opt. Express 2018, 9, 6331. [Google Scholar] [CrossRef]
- Sirotkina, M.A.; Gubarkova, E.V.; Plekhanov, A.A.; Sovetsky, A.A.; Elagin, V.V.; Matveyev, A.L.; Matveev, L.A.; Kuznetsov, S.S.; Zagaynova, E.V.; Gladkova, N.D.; et al. In Vivo Assessment of Functional and Morphological Alterations in Tumors under Treatment Using OCT-Angiography Combined with OCT-Elastography. Biomed. Opt. Express 2020, 11, 1365. [Google Scholar] [CrossRef]
- Plekhanov, A.A.; Sirotkina, M.A.; Sovetsky, A.A.; Gubarkova, E.V.; Kuznetsov, S.S.; Matveyev, A.L.; Matveev, L.A.; Zagaynova, E.V.; Gladkova, N.D.; Zaitsev, V.Y. Histological Validation of in Vivo Assessment of Cancer Tissue Inhomogeneity and Automated Morphological Segmentation Enabled by Optical Coherence Elastography. Sci. Rep. 2020, 10, 11781. [Google Scholar] [CrossRef]
- Nandy, S.; Salehi, H.S.; Wang, T.; Wang, X.; Sanders, M.; Kueck, A.; Brewer, M.; Zhu, Q. Correlating Optical Coherence Elastography Based Strain Measurements with Collagen Content of the Human Ovarian Tissue. Biomed. Opt. Express 2015, 6, 3806. [Google Scholar] [CrossRef]
- Persu, C.; Chapple, C.R.; Cauni, V.; Gutue, S.; Geavlete, P. Pelvic Organ Prolapse Quantification System (POP-Q)—A new era in pelvic prolapse staging. J. Med. Life 2011, 4, 4,75–81. [Google Scholar]
- Moiseev, A.; Ksenofontov, S.; Sirotkina, M.; Kiseleva, E.; Gorozhantseva, M.; Shakhova, N.; Matveev, L.; Zaitsev, V.; Matveyev, A.; Zagaynova, E.; et al. Optical Coherence Tomography-Based Angiography Device with Real-Time Angiography B-Scans Visualization and Hand-Held Probe for Everyday Clinical Use. J. Biophotonics 2018, 11, e201700292. [Google Scholar] [CrossRef]
- Gelikonov, V.M.; Romashov, V.N.; Shabanov, D.V.; Ksenofontov, S.Y.; Terpelov, D.A.; Shilyagin, P.A.; Gelikonov, G.V.; Vitkin, I.A. Cross-Polarization Optical Coherence Tomography with Active Maintenance of the Circular Polarization of a Sounding Wave in a Common Path System. Radiophys Quantum El 2018, 60, 897–911. [Google Scholar] [CrossRef]
- Sovetsky, A.A.; Matveyev, A.L.; Matveev, L.A.; Gubarkova, E.V.; Plekhanov, A.A.; Sirotkina, M.A.; Gladkova, N.D.; Zaitsev, V.Y. Full-Optical Method of Local Stress Standardization to Exclude Nonlinearity-Related Ambiguity of Elasticity Estimation in Compressional Optical Coherence Elastography. Laser Phys. Lett. 2020, 17, 065601. [Google Scholar] [CrossRef]
- Zaitsev, V.Y.; Matveyev, A.L.; Matveev, L.A.; Gelikonov, G.V.; Sovetsky, A.A.; Vitkin, A. Optimized Phase Gradient Measurements and Phase-Amplitude Interplay in Optical Coherence Elastography. J. Biomed. Opt. 2016, 21, 116005. [Google Scholar] [CrossRef]
- Zaitsev, V.Y.; Matveyev, A.L.; Matveev, L.A.; Gelikonov, G.V.; Gubarkova, E.V.; Gladkova, N.D.; Vitkin, A. Hybrid Method of Strain Estimation in Optical Coherence Elastography Using Combined Sub-Wavelength Phase Measurements and Supra-Pixel Displacement Tracking. J. Biophoton 2016, 9, 499–509. [Google Scholar] [CrossRef]
- Matveyev, A.L.; Matveev, L.A.; Sovetsky, A.A.; Gelikonov, G.V.; Moiseev, A.A.; Zaitsev, V.Y. Vector Method for Strain Estimation in Phase-Sensitive Optical Coherence Elastography. Laser Phys. Lett. 2018, 15, 065603. [Google Scholar] [CrossRef]
- Sovetsky, A.A.; Matveyev, A.L.; Matveev, L.A.; Shabanov, D.V.; Zaitsev, V.Y. Manually-Operated Compressional Optical Coherence Elastography with Effective Aperiodic Averaging: Demonstrations for Corneal and Cartilaginous Tissues. Laser Phys. Lett. 2018, 15, 085602. [Google Scholar] [CrossRef]
- Zaitsev, V.Y.; Ksenofontov, S.Y.; Sovetsky, A.A.; Matveyev, A.L.; Matveev, L.A.; Zykov, A.A.; Gelikonov, G.V. Real-Time Strain and Elasticity Imaging in Phase-Sensitive Optical Coherence Elastography Using a Computationally Efficient Realization of the Vector Method. Photonics 2021, 8, 527. [Google Scholar] [CrossRef]
- Zaitsev, V.Y.; Matveyev, A.L.; Matveev, L.A.; Gubarkova, E.V.; Sovetsky, A.A.; Sirotkina, M.A.; Gelikonov, G.V.; Zagaynova, E.V.; Gladkova, N.D.; Vitkin, A. Practical Obstacles and Their Mitigation Strategies in Compressional Optical Coherence Elastography of Biological Tissues. J. Innov. Opt. Health Sci. 2017, 10, 1742006. [Google Scholar] [CrossRef] [Green Version]
- Gubarkova, E.V.; Sovetsky, A.A.; Zaitsev, V.Y.; Matveev, L.A.; Matveyev, A.L.; Vorontsov, D.A.; Timofeeva, L.B.; Kiseleva, E.B.; Vorontsov, A.Y.; Kuznetsova, I.A.; et al. Comparison of Elastic Properties of Tissue Samples in Various Pathological States Using Optical Coherence Elastography. In Proceedings of the Saratov Fall Meeting 2018: Optical and Nano-Technologies for Biology and Medicine; Tuchin, V.V., Genina, E.A., Eds.; SPIE: Saratov, Russian Federation; p. 14.
- Sovetsky, A.A.; Matveyev, A.L.; Matveev, L.A.; Gelikonov, G.V.; Zaitsev, V.Y. Mapping Large Strains in Phase-Sensitive OCT: Key Role of Supra-Pixel Displacement Tracking in Incremental Strain Evaluation. J. Biomed. Photonics Eng. 2022, 8, 1–16. [Google Scholar] [CrossRef]
- Schindelin, J.; Arganda-Carreras, I.; Frise, E.; Kaynig, V.; Longair, M.; Pietzsch, T.; Preibisch, S.; Rueden, C.; Saalfeld, S.; Schmid, B.; et al. Fiji: An Open-Source Platform for Biological-Image Analysis. Nat. Methods 2012, 9, 676–682. [Google Scholar] [CrossRef] [Green Version]
- Ruifrok, A.C.; Katz, R.L.; Johnston, D.A. Comparison of Quantification of Histochemical Staining By Hue-Saturation-Intensity (HSI) Transformation and Color-Deconvolution. Appl. Immunohistochem. Mol. Morphol. 2003, 11, 85–91. [Google Scholar] [CrossRef]
- Otsu, N. A Threshold Selection Method from Gray-Level Histograms. IEEE Trans. Syst. Man Cybern. 1979, 9, 62–66. [Google Scholar] [CrossRef] [Green Version]
- Saito, T.; Toriwaki, J.-I. New Algorithms for Euclidean Distance Transformation of an N-Dimensional Digitized Picture with Applications. Pattern Recognit. 1994, 27, 1551–1565. [Google Scholar] [CrossRef]
- Hildebrand, T.; Rüegsegger, P. A New Method for the Model-independent Assessment of Thickness in Three-dimensional Images. J. Microsc. 1997, 185, 67–75. [Google Scholar] [CrossRef]
- Ushiki, T. Collagen Fibers, Reticular Fibers and Elastic Fibers. A Comprehensive Understanding from a Morphological Viewpoint. Arch. Histol. Cytol. 2002, 65, 109–126. [Google Scholar] [CrossRef] [Green Version]
- Egorov, V.; van Raalte, H.; Lucente, V. Quantifying Vaginal Tissue Elasticity under Normal and Prolapse Conditions by Tactile Imaging. Int. Urogynecol. J. 2012, 23, 459–466. [Google Scholar] [CrossRef] [Green Version]
- Li, C.; Guan, G.; Ling, Y.; Hsu, Y.-T.; Song, S.; Huang, J.T.-J.; Lang, S.; Wang, R.K.; Huang, Z.; Nabi, G. Detection and Characterisation of Biopsy Tissue Using Quantitative Optical Coherence Elastography (OCE) in Men with Suspected Prostate Cancer. Cancer Lett. 2015, 357, 121–128. [Google Scholar] [CrossRef]
- Deng, Z.-M.; Dai, F.-F.; Yuan, M.-Q.; Yang, D.-Y.; Zheng, Y.-J.; Cheng, Y.-X. Advances in Molecular Mechanisms of Pelvic Organ Prolapse (Review). Exp. Ther. Med. 2021, 22, 1009. [Google Scholar] [CrossRef]
- De Landsheere, L.; Munaut, C.; Nusgens, B.; Maillard, C.; Rubod, C.; Nisolle, M.; Cosson, M.; Foidart, J.-M. Histology of the Vaginal Wall in Women with Pelvic Organ Prolapse: A Literature Review. Int. Urogynecol. J. 2013, 24, 2011–2020. [Google Scholar] [CrossRef]
- Borges, L.F.; Gutierrez, P.S.; Marana, H.R.C.; Taboga, S.R. Picrosirius-Polarization Staining Method as an Efficient Histopathological Tool for Collagenolysis Detection in Vesical Prolapse Lesions. Micron 2007, 38, 580–583. [Google Scholar] [CrossRef]
- Lin, S.-Y.; Tee, Y.-T.; Ng, S.-C.; Chang, H.; Lin, P.; Chen, G.-D. Changes in the Extracellular Matrix in the Anterior Vagina of Women with or without Prolapse. Int. Urogynecol. J. 2007, 18, 43–48. [Google Scholar] [CrossRef]
- Kökçü, A.; Yanik, F.; Çetinkaya, M.; Alper, T.; Kandemir, B.; Malatyalioglu, E. Histopathological Evaluation of the Connective Tissue of the Vaginal Fascia and the Uterine Ligaments in Women with and without Pelvic Relaxation. Arch. Gynecol. Obstet. 2002, 266, 75–78. [Google Scholar] [CrossRef]
- Moalli, P.A.; Shand, S.H.; Zyczynski, H.M.; Gordy, S.C.; Meyn, L.A. Remodeling of Vaginal Connective Tissue in Patients With Prolapse. Obstet. Gynecol. 2005, 106, 953–963. [Google Scholar] [CrossRef]
- Ouchi, M.; Kato, K.; Gotoh, M.; Suzuki, S. Physical activity and pelvic floor muscle training in patients with pelvic organ prolapse: A pilot study. Int. Urogynecol. J. 2017, 28, 1807–1815. [Google Scholar] [CrossRef]
- Porta-Roda, O.; Vara-Paniagua, J.; Díaz-López, M.A.; Sobrado-Lozano, P.; Simó-González, M.; Díaz-Bellido, P.; Reula-Blasco, M.C.; Muñoz-Garrido, F. Effect of Vaginal Spheres and Pelvic Floor Muscle Training in Women with Urinary Incontinence: A Randomized, Controlled Trial: Vaginal Spheres in Urinary Incontinence. Neurourol. Urodynam. 2015, 34, 533–538. [Google Scholar] [CrossRef] [PubMed]
- Deng, M.; Ding, J.; Ai, F.; Zhu, L. Successful Use of the Gellhorn Pessary as a Second-Line Pessary in Women with Advanced Pelvic Organ Prolapse. Menopause 2017, 24, 1277–1281. [Google Scholar] [CrossRef] [PubMed]
- Friedman, T.; Eslick, G.D.; Dietz, H.P. Risk Factors for Prolapse Recurrence: Systematic Review and Meta-Analysis. Int. Urogynecol. J. 2018, 29, 13–21. [Google Scholar] [CrossRef] [PubMed]
- Zhang, L.; Yaron, J.R.; Tafoya, A.M.; Wallace, S.E.; Kilbourne, J.; Haydel, S.; Rege, K.; McFadden, G.; Lucas, A.R. A Virus-Derived Immune Modulating Serpin Accelerates Wound Closure with Improved Collagen Remodeling. JCM 2019, 8, 1626. [Google Scholar] [CrossRef] [Green Version]
- Belsare, A.D.; Mushrif, M.M.; Pangarkar, M.A.; Meshram, N. Classification of Breast Cancer Histopathology Images Using Texture Feature Analysis. In Proceedings of the TENCON 2015—2015 IEEE Region 10 Conference, Macao, 1–4 November 2015; IEEE: Piscataway, NJ, USA; pp. 1–5. [Google Scholar]
- Liu, Y.; Dong, Y.; Si, L.; Meng, R.; Dong, Y.; Ma, H. Comparison between Image Texture and Polarization Features in Histopathology. Biomed. Opt. Express 2021, 12, 1593. [Google Scholar] [CrossRef]
- Möckl, L.; Lamb, D.C.; Bräuchle, C. Super-Resolved Fluorescence Microscopy: Nobel Prize in Chemistry 2014 for Eric Betzig, Stefan Hell, and William E. Moerner. Angew. Chem. Int. Ed. 2014, 53, 13972–13977. [Google Scholar] [CrossRef]
- de Landsheere, L.; Brieu, M.; Blacher, S.; Munaut, C.; Nusgens, B.; Rubod, C.; Noel, A.; Foidart, J.-M.; Nisolle, M.; Cosson, M. Elastin Density: Link between Histological and Biomechanical Properties of Vaginal Tissue in Women with Pelvic Organ Prolapse? Int. Urogynecol. J. 2016, 27, 629–635. [Google Scholar] [CrossRef]


Disclaimer/Publisher’s Note: The statements, opinions and data contained in all publications are solely those of the individual author(s) and contributor(s) and not of MDPI and/or the editor(s). MDPI and/or the editor(s) disclaim responsibility for any injury to people or property resulting from any ideas, methods, instructions or products referred to in the content. |
© 2022 by the authors. Licensee MDPI, Basel, Switzerland. This article is an open access article distributed under the terms and conditions of the Creative Commons Attribution (CC BY) license (https://creativecommons.org/licenses/by/4.0/).
Share and Cite
Gubarkova, E.; Potapov, A.; Krupinova, D.; Shatilova, K.; Karabut, M.; Khlopkov, A.; Loginova, M.; Sovetsky, A.; Zaitsev, V.; Radenska-Lopovok, S.; et al. Compression Optical Coherence Elastography for Assessing Elasticity of the Vaginal Wall under Prolapse after Neodymium Laser Treatment. Photonics 2023, 10, 6. https://doi.org/10.3390/photonics10010006
Gubarkova E, Potapov A, Krupinova D, Shatilova K, Karabut M, Khlopkov A, Loginova M, Sovetsky A, Zaitsev V, Radenska-Lopovok S, et al. Compression Optical Coherence Elastography for Assessing Elasticity of the Vaginal Wall under Prolapse after Neodymium Laser Treatment. Photonics. 2023; 10(1):6. https://doi.org/10.3390/photonics10010006
Chicago/Turabian StyleGubarkova, Ekaterina, Arseniy Potapov, Darya Krupinova, Ksenia Shatilova, Maria Karabut, Andrey Khlopkov, Maria Loginova, Aleksander Sovetsky, Vladimir Zaitsev, Stefka Radenska-Lopovok, and et al. 2023. "Compression Optical Coherence Elastography for Assessing Elasticity of the Vaginal Wall under Prolapse after Neodymium Laser Treatment" Photonics 10, no. 1: 6. https://doi.org/10.3390/photonics10010006