Article

Hydrochemistry and Irrigation Quality of High-Altitude Lakes: A Case Study of the Ramaroshan Lake Complex, Nepal Himalayas

1
Central Department of Environmental Science, Institute of Science and Technology, Tribhuvan University, Kathmandu 44618, Nepal
2
Central Department of Zoology, Institute of Science and Technology, Tribhuvan University, Kathmandu 44618, Nepal
3
Aishwarya Multiple Campus, Tribhuvan University, Dhangadhi 10901, Nepal
4
Department of Psychology, Center for Global Field Study, and Washington National Primate Research Center, University of Washington, Seattle, WA 98195, USA
5
State Key Laboratory of Tibetan Plateau Earth System, Resources and Environment, Institute of Tibetan Plateau Research, Chinese Academy of Sciences, Beijing 100101, China
6
University of Chinese Academy of Sciences, Beijing 100049, China
7
Departments of Psychology, Global Health, and Anthropology, Center for Global Field Study, and Washington National Primate Research Center, University of Washington, Seattle, WA 98195, USA
*
Authors to whom correspondence should be addressed.
Limnol. Rev. 2024, 24(1), 30-52; https://doi.org/10.3390/limnolrev24010003
Submission received: 27 November 2023 / Revised: 29 December 2023 / Accepted: 3 January 2024 / Published: 8 January 2024

Abstract

:
The Ramaroshan Lake Complex (RLC) in Sudurpaschim Province, Nepal, is a Himalayan lake cluster that holds significant ecological, economic, religious, and esthetic importance. This study aimed to provide a comprehensive characterization of the hydrochemical properties of water within the RLC and assess its suitability for irrigation purposes. A total of 38 water samples were collected from seven different lakes of the complex. The physicochemical parameters and major ions were then analyzed. The water samples from the RLC were alkaline, and based on total hardness, they ranged from soft to moderately hard categories. The presence of major ions included the following: Ca2+ > Na+ > Mg2+ > K+ > Fe3+ > NH4+ and HCO3 > Cl > SO42− > NO3 > PO43−. The alkaline earth metals (Ca2+ and Mg2+) dominated the alkali metals (Na+ and K+) and weak acids (HCO3) dominated the strong acids (Cl and SO42−). The dominant hydrochemical facies of the lake water was a Ca-HCO3 type indicating a calcium carbonate type of lithology. Carbonate rock weathering was the most dominant process in influencing the hydrochemistry of the water. A high ratio of (Ca2++ Mg2+)/Tz+ and a lower ratio of (Na+ + K+)/Tz+ revealed the dominance of Ca2+ and Mg2+ resulting from carbonate weathering, with little contribution from silicate weathering. Different irrigation indices revealed the suitability of the RLC water for irrigation. The insights derived from this study are pivotal in safeguarding water quality and bolstering sustainability efforts. The study also furnishes foundational data crucial to an array of stakeholders including researchers and policymakers and significantly contributes to advancing water management strategies and fostering ecosystem conservation in the Himalayan freshwater lakes, particularly in the face of the overarching challenge posed by global climate change.

1. Introduction

Lakes represent the world’s major freshwater sources and play a crucial role in livelihoods and the economy including industries, agriculture, pisciculture, recreation, and energy production [1]. Despite having immense ecological, economic, and amenities value, surface water quality is being degraded owing to an increase in anthropogenic disturbance and rapid population growth [2]. Apart from human-based influences (e.g., agricultural activities, municipal sewage, industrial effluents, mining, fishing, deforestation, and other commercial activities), natural processes, such as the weathering of crustal materials, precipitation, leaching of organic matter and minerals from soil, atmospheric processes, and biological processes in the aquatic environment, greatly influence the quality of water [3,4].
Lakes are dynamic inland aquatic systems that are vulnerable to pollution and accumulate pollutants over time [5] due to their lower self-regulating capacity as compared to lotic systems [6]. Low-altitude lakes are susceptible to various anthropogenic activities, while high-altitude lakes have lower human interference [7]. Due to their remoteness and inaccessibility, high-altitude lakes are thought to have more pristine conditions. However, a number of studies have shown an increase in phosphate and nitrate concentrations in high-altitude lakes indicating the influence of anthropogenic activities [8]. Studies also have detected elevated metal concentrations which indicate the long-range transport of pollutants and the impact of climate change [7,9]. These findings not only highlight the influence of human-induced factors on these fragile freshwater ecosystems but also underscore the urgent need to address the impact of climate change. Studies in freshwater lakes and reservoirs in Nepal, such as Ghodaghodi, Beeshazari, and Jagadishpur, have identified anthropogenic activities, including agriculture runoff, domestic waste, and rampant urbanization in the vicinity of lake basins, as significant challenges in the water quality management [10]. The decline in water quality is one of the major growing environmental concerns. The declining water quality of these lakes represents serious implications for the people who rely on them for their day-to-day livelihoods. Therefore, understanding and monitoring the water quality of lakes is crucial for effective and sustainable water management.
The elevated concentrations of dissolved ions influence water quality. The major dissolved cations (Ca2+, Mg2+, Na+, K+) and anions (HCO3, CO3, SO42−, Cl, NO3) in water help to determine its suitability for drinking, irrigation, and other purposes and also to understand the natural mechanisms and anthropogenic activities impacting the lake [11]. Rock weathering, precipitation, and evapo-crystallizations are the three main natural mechanisms that are the source of ions and control the hydrochemistry of surface water [12]. Ca2+, Mg2+, and HCO3 found in water result primarily via the interaction of geospheric minerals with atmospheric CO2 [13]. K+ and Na+ are generally derived from the weathering of silicates and evaporites, while the sources of Cl and SO42– are primarily the evaporite dissolution [14].
Surface water is the primary source of water used in agriculture, and the quality of that water plays a crucial role in plant growth and productivity. The chemical composition of water determines its suitability for irrigation. Numerous irrigation water quality indices can be used to evaluate the quality of irrigation water, such as sodium adsorption ratio (SAR), sodium percentage (%Na), Kelly’s ratio (KR), permeability index (PI), magnesium hazard (MH), and cation ratio of soil structural stability (CROSS) [15]. In agro-based developing countries like Nepal, where the economy is heavily reliant on the agriculture sector, irrigation quality assessment of lakes can play a crucial role in meeting increasing water demands and promoting sustainable agriculture practices.
Lakes act as an ideal natural laboratory to study numerous hydrochemical processes [16]. Hydrogeochemical studies are important in limnology as they provide insights on chemical weathering, evaporation, atmospheric deposition, and anthropogenic processes [17]. Conventional methods (such as using major ions in graphical diagrams, ionic ratios, etc.) and modern methods (multivariate statistical techniques like principal component analysis, factor analysis, cluster analysis, and discriminant analysis) can be used together for the hydrochemical characterization and explanation of the process governing hydrochemistry [18]. In Nepal, studies of various lakes, such as Phewa Lake [19], Beeshazar Lake [20], Jhilmila Lake [21], Rara Lake [22], Rajarani Lake [23], Betana Lake [24], Ghodaghodi Lake [25], Betkot Lake [26], Begnas Lake [27], etc., have utilized multivariate statistical tools to explore hydrochemical processes, trace the source of pollutants, and monitor water qualities.
Limnochemical studies in Nepal have primarily been confined to low-altitude lakes, and there have been relatively few investigations of high-altitude lakes. Additionally, these studies are more prominent in the eastern and central regions compared to the western parts of the country [28]. This study was carried out in Ramaroshan Lake Complex (RLC), a complex of high-altitude lakes situated in the western part of Nepal. RLC is rich in scenic beauty with a distinctive natural landscape. It also has cultural significance, offers various ecological services, and stands out as a promising tourist destination site [29]. Like other high-altitude lakes of Nepal, RLC is facing excruciating pressure from both natural and human-induced sources in the context of severe climate change that is impacting the high-altitude freshwater bodies. The Department of Forests (2017) identified four lakes of the RLC as being in good ecological condition and the three other lakes as degrading. However, the in-depth analysis for such a declaration is missing [30]. Thus, this study focuses on hydrogeochemical processes, the analysis of physicochemical parameters, and the evaluation of the water quality of the RLC based on drinking and irrigation quality standards. By documenting the hydrochemical processes and lake health status, the findings of this research can be valuable for the sustainable development and effective management of water resources in the RLC, as well as other high-altitude lakes in the Himalayas. The insights gained from this study could contribute to a better understanding and conservation of these ecologically vital water bodies, ensuring their continued benefits for the surrounding communities and the environment.

2. Materials and Methods
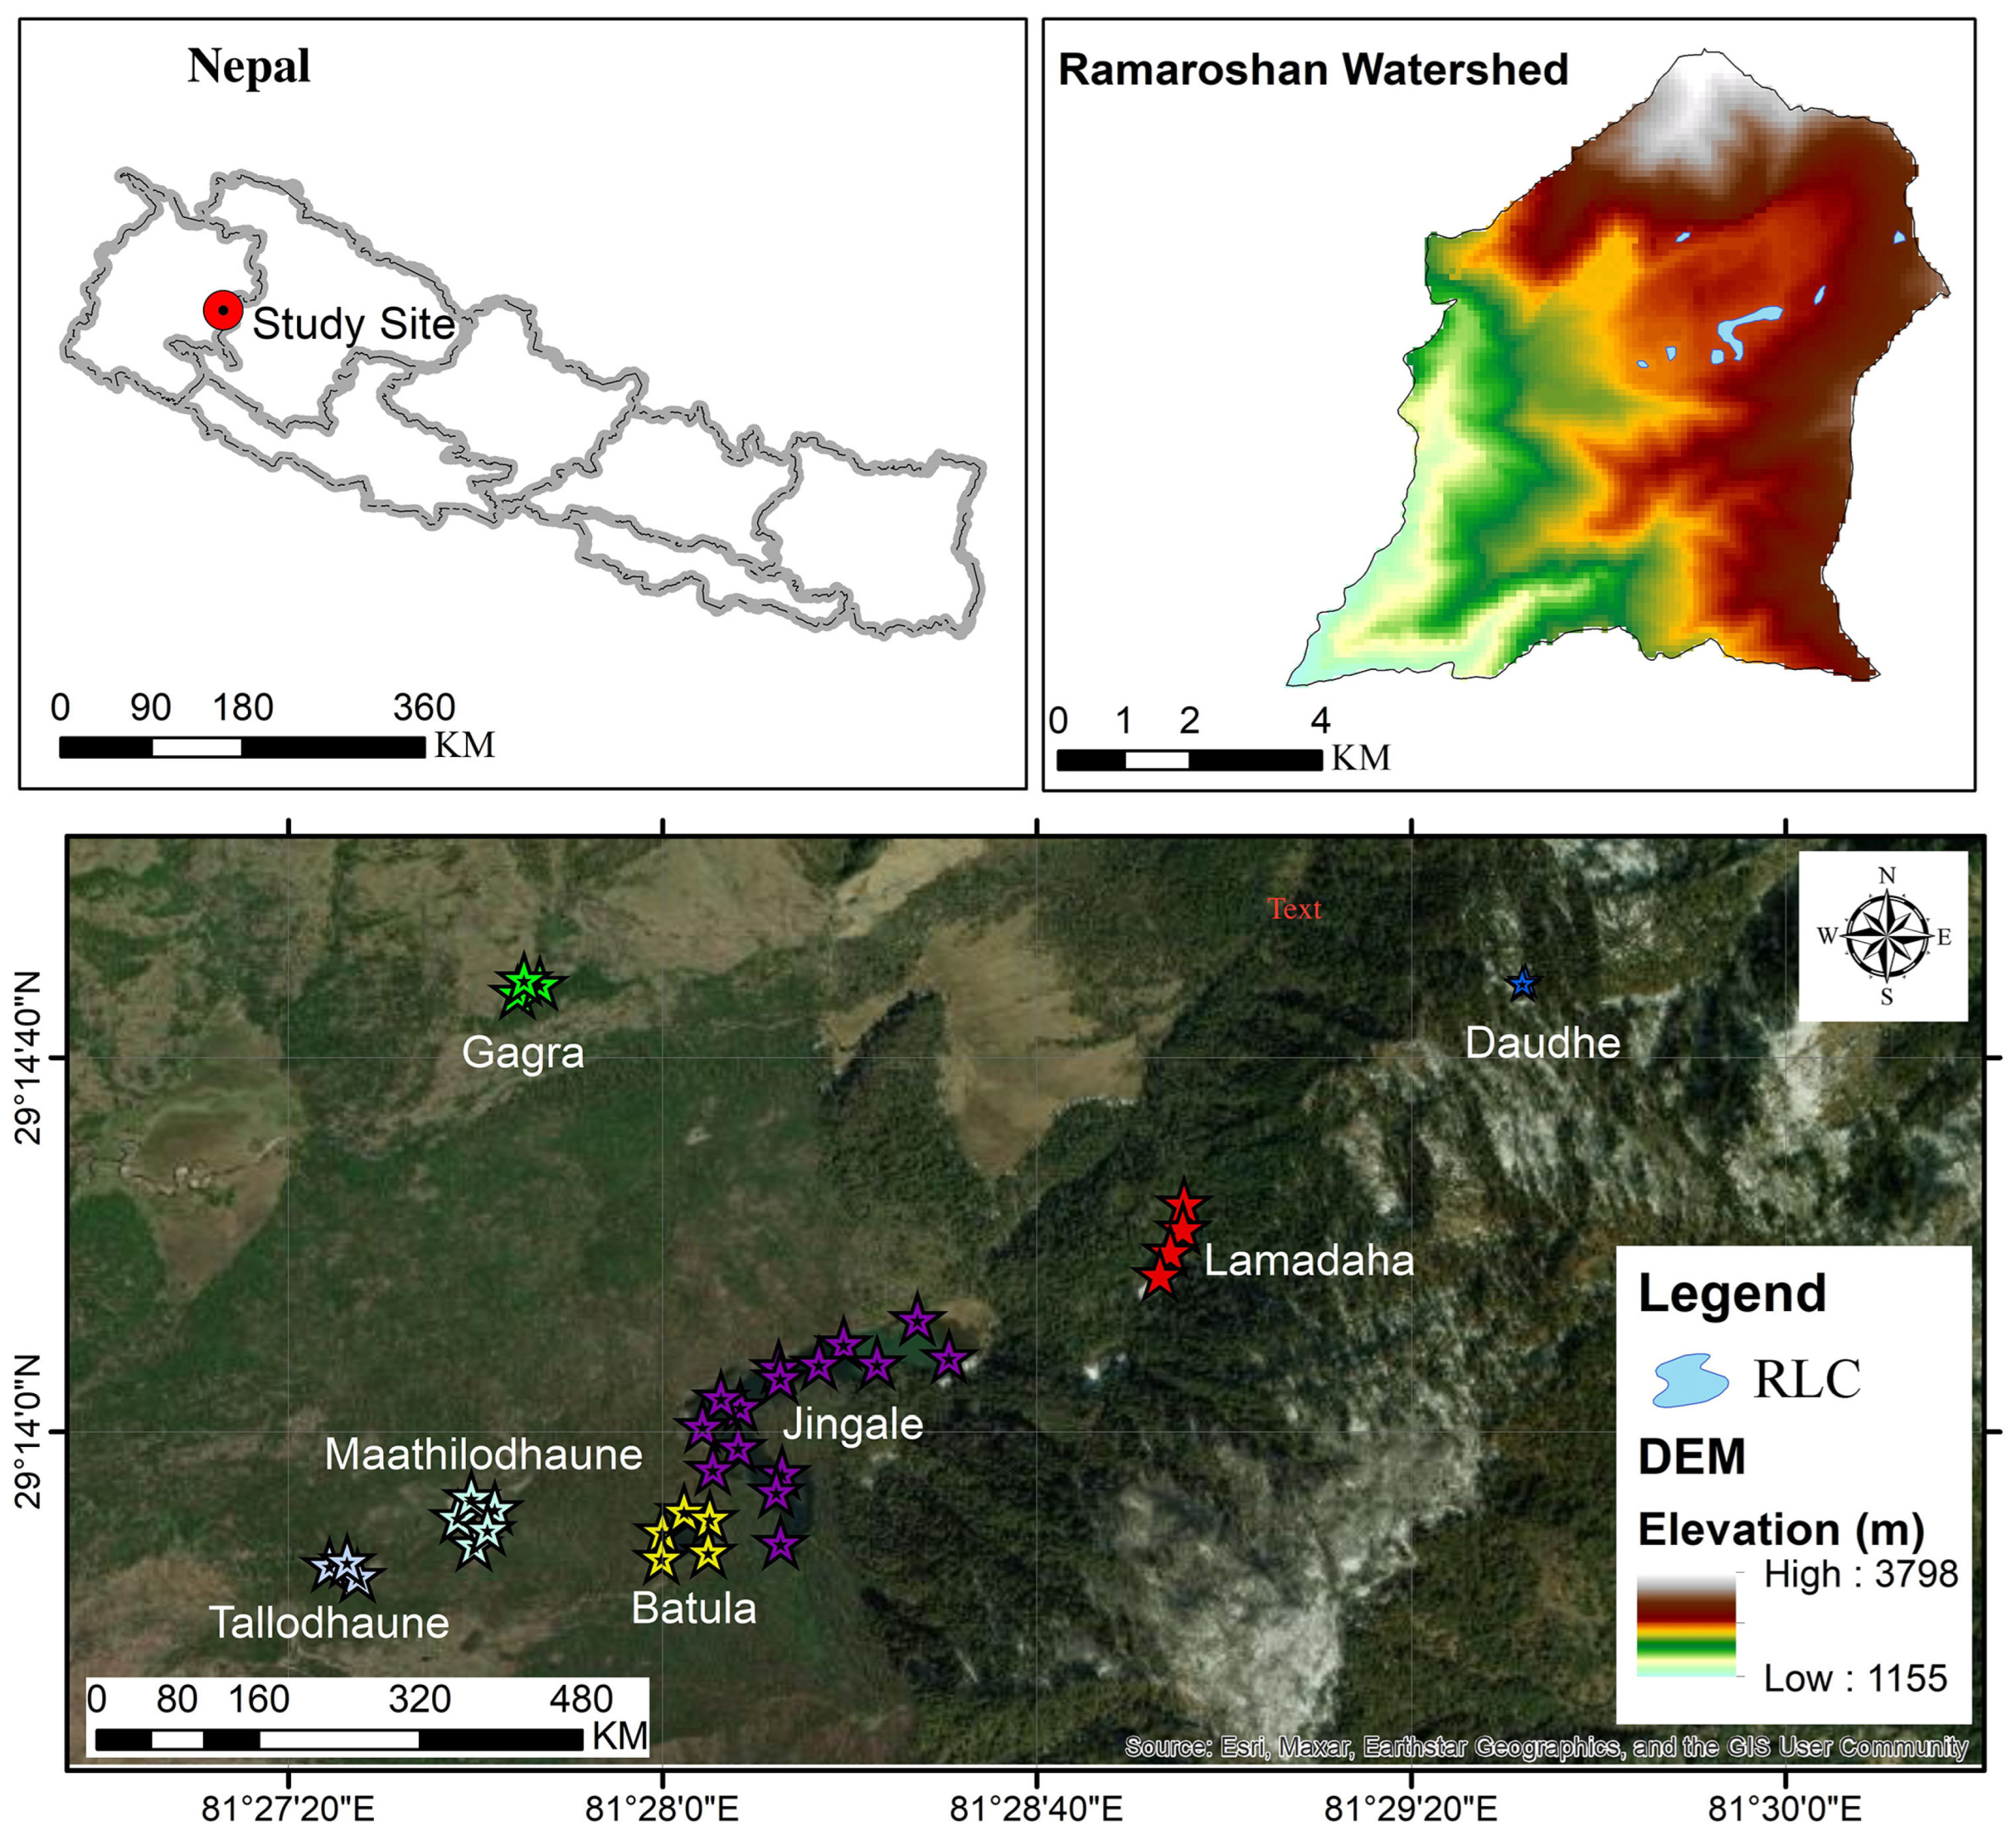
2.1. Study Area

The Ramaroshan Lake Complex (RLC) is situated at an elevation of 2050 m to 3792 m above mean sea level in the Ramaroshan Rural Municipality, Ward 5 of Achham District (Figure 1), Sudur Paschim Province, Nepal. The Ramaroshan area is known for its 12 lakes and 18 patans (lust grasslands) [31]. The lakes are interconnected with each other forming a complex with the Kailash Khola (the small river) as its major outlet [32]. The climatic conditions of the Ramaroshan area range from subtropical to cool temperate, with an annual average mean temperature of 30 °C (maximum) to 5 °C (minimum) and an average annual rainfall of 1891 mm/ year [30]. Jingale Lake, a C-shaped lake, is the largest and deepest lake of the RLC. Geologically, the RLC lies predominantly on Sallyanigad and Kalikot formations which consist of major rock types of granite, gneisses, limestone, and schist [33]. The soil of Tallodhaune and Mathilodhaune Lakes is gray-colored and has a loamy sand texture, while the soil of Jingale, Batula, and Lamadaha Lakes is dark-colored and has a clay loam texture [30]. The morphometric features of the lakes in this study are presented in Table 1.
The major surrounding vegetation of the lake complex comprises Rhododendron, Quercus, Taxus, and Pinus species, whereas the major aquatic plants found in the lake include Pyrus persia, Equisetum arvense, Nelumbo nucifera, and Rumex nepalensis [30]. Eight kinds of wetland-dependent birds have been recorded in the RLC, including 5 migratory species and 3 other species native to Nepal [32]. Eleven species of herpetofauna also have been identified in the area [31]. The RLC also provides habitat for a variety of different protected mammal species such as the Assamese macaque (Macaca assamensis), musk deer (Moschus chrysogaster), Himalayan goral (Naemorhedus goral), gray wolf (Canis lupus), Asiatic black bear (Ursus thibetanus), and leopard (Panthera pardus). The area is also inhabited by protected bird species such as the Impeyan pheasant (Lophophorus impejanus) [34].

2.2. Study Design

To achieve the research objectives, we collected both primary and secondary data. Primary data were obtained through fieldwork along with laboratory analysis. These data were subjected to various analytical methods including hydrochemical analysis, multivariate statistical analysis, and water quality analysis, followed by comprehensive interpretation (Figure 2). The secondary data were retrieved from a review of prior studies and used for the comparative analysis of the hydrochemistry of the RLC with other study sites.

2.3. Water Sampling and Laboratory Analysis

Water sampling was conducted from late September through early October in 2021. A total of 38 surficial water samples were collected from seven lakes in the RLC (15 samples from Jingale Lake; 5 samples each from Batula and Mathilodhaune Lakes; 4 samples from Lamadaha Lake; and 3 samples each from Tallodhaune, Daudhe, and Gagra Lakes) following a purposive sampling technique to ensure the representation of inlet, outlet, and land use change. The sample numbers varied depending upon the size of the lakes. The water samples were collected using 1 L HDPE bottles, after prerinsing them with lake water at the collection sites. The water samples were filtered using Whatman filter paper. The filtrate was divided into two parts: (1) for anion analysis, the filtrate was not buffered; (2) for cation analysis, the filtrate was preserved by acidification with nitric acid (HNO3) until a pH < 2 to avoid precipitation/adsorption [35]. The water samples were stored at around 4 °C for their eventual transfer to the Laboratory of the Central Department of Environmental Science, Tribhuvan University, Kirtipur, for further analysis.
At the sample site, physiochemical parameters such as temperature, pH, electrical conductivity (EC), and total dissolved solids (TDS) were detected using a HANNA multipurpose meter and dissolved oxygen using a DO meter. In the laboratory, alkalinity was analyzed by acid-base titration and free CO2 by phenolphthalein titration. Total hardness, Ca2+, and Mg2+ were analyzed using EDTA titration. Cl was determined by standard AgNO3 titration. Na+ and K+ were determined using a microprocessor flame photometer. Using a spectrophotometer, additional chemical parameters were determined as follows: ammonium (NH4+) was determined by the phenate method, nitrate (NO3) by the brucine method, phosphate (PO43−) by the stannous chloride method, sulphate (SO42−) by the conditioning reagent method, and iron (Fe3+) by the phenanthroline method. Samples were analyzed as per the standard methods of APHA [35]. Deionized water was used to prepare all the standard solutions. The precision of measurements was verified by measuring freshly prepared standards with known concentrations. The precision of the data acquired by analyzing cations and anions in the water of the RLC was better than ±5%.

2.4. Data Analysis

Data were analyzed using descriptive statistics, principal component analysis (PCA), and cluster analysis (CA) with Statistical Package for Social Sciences (SPSS version 26). Graphical diagrams were generated using Origin version 2019b and Grapher software version 16.2.354. Multivariate analysis was performed using CA and PCA techniques to find the intuitive similarity among the hydrochemical attributes and to describe the potential sources/factors that affect the water system. For the irrigation suitability assessment, the following irrigation indices were used.
  • Sodium percentage (Na%) = N a + + K + × 100 ( C a 2 + + M g 2 + + N a + + K + ) [36]
  • Sodium absorption ratio (SAR) = N a +   ( C a 2 + + M g 2 + ) / 2 [36]
  • Kelly’s ratio (KR) = N a + ( C a 2 + + M g 2 + ) [37]
  • Permeability index (PI) = N a + + H C O 3   × 100 C a 2 + + M g 2 + + N a + [38]
  • Magnesium hazard (MH) = M g 2 + × 100 ( C a 2 + + M g 2 + ) [39]
  • CROSS = N a + + 0.56 K + C a 2 + + 0.6 M g 2 + / 2 } [40]
Where all ionic concentrations are expressed in mEq/L.

3. Results and Discussion

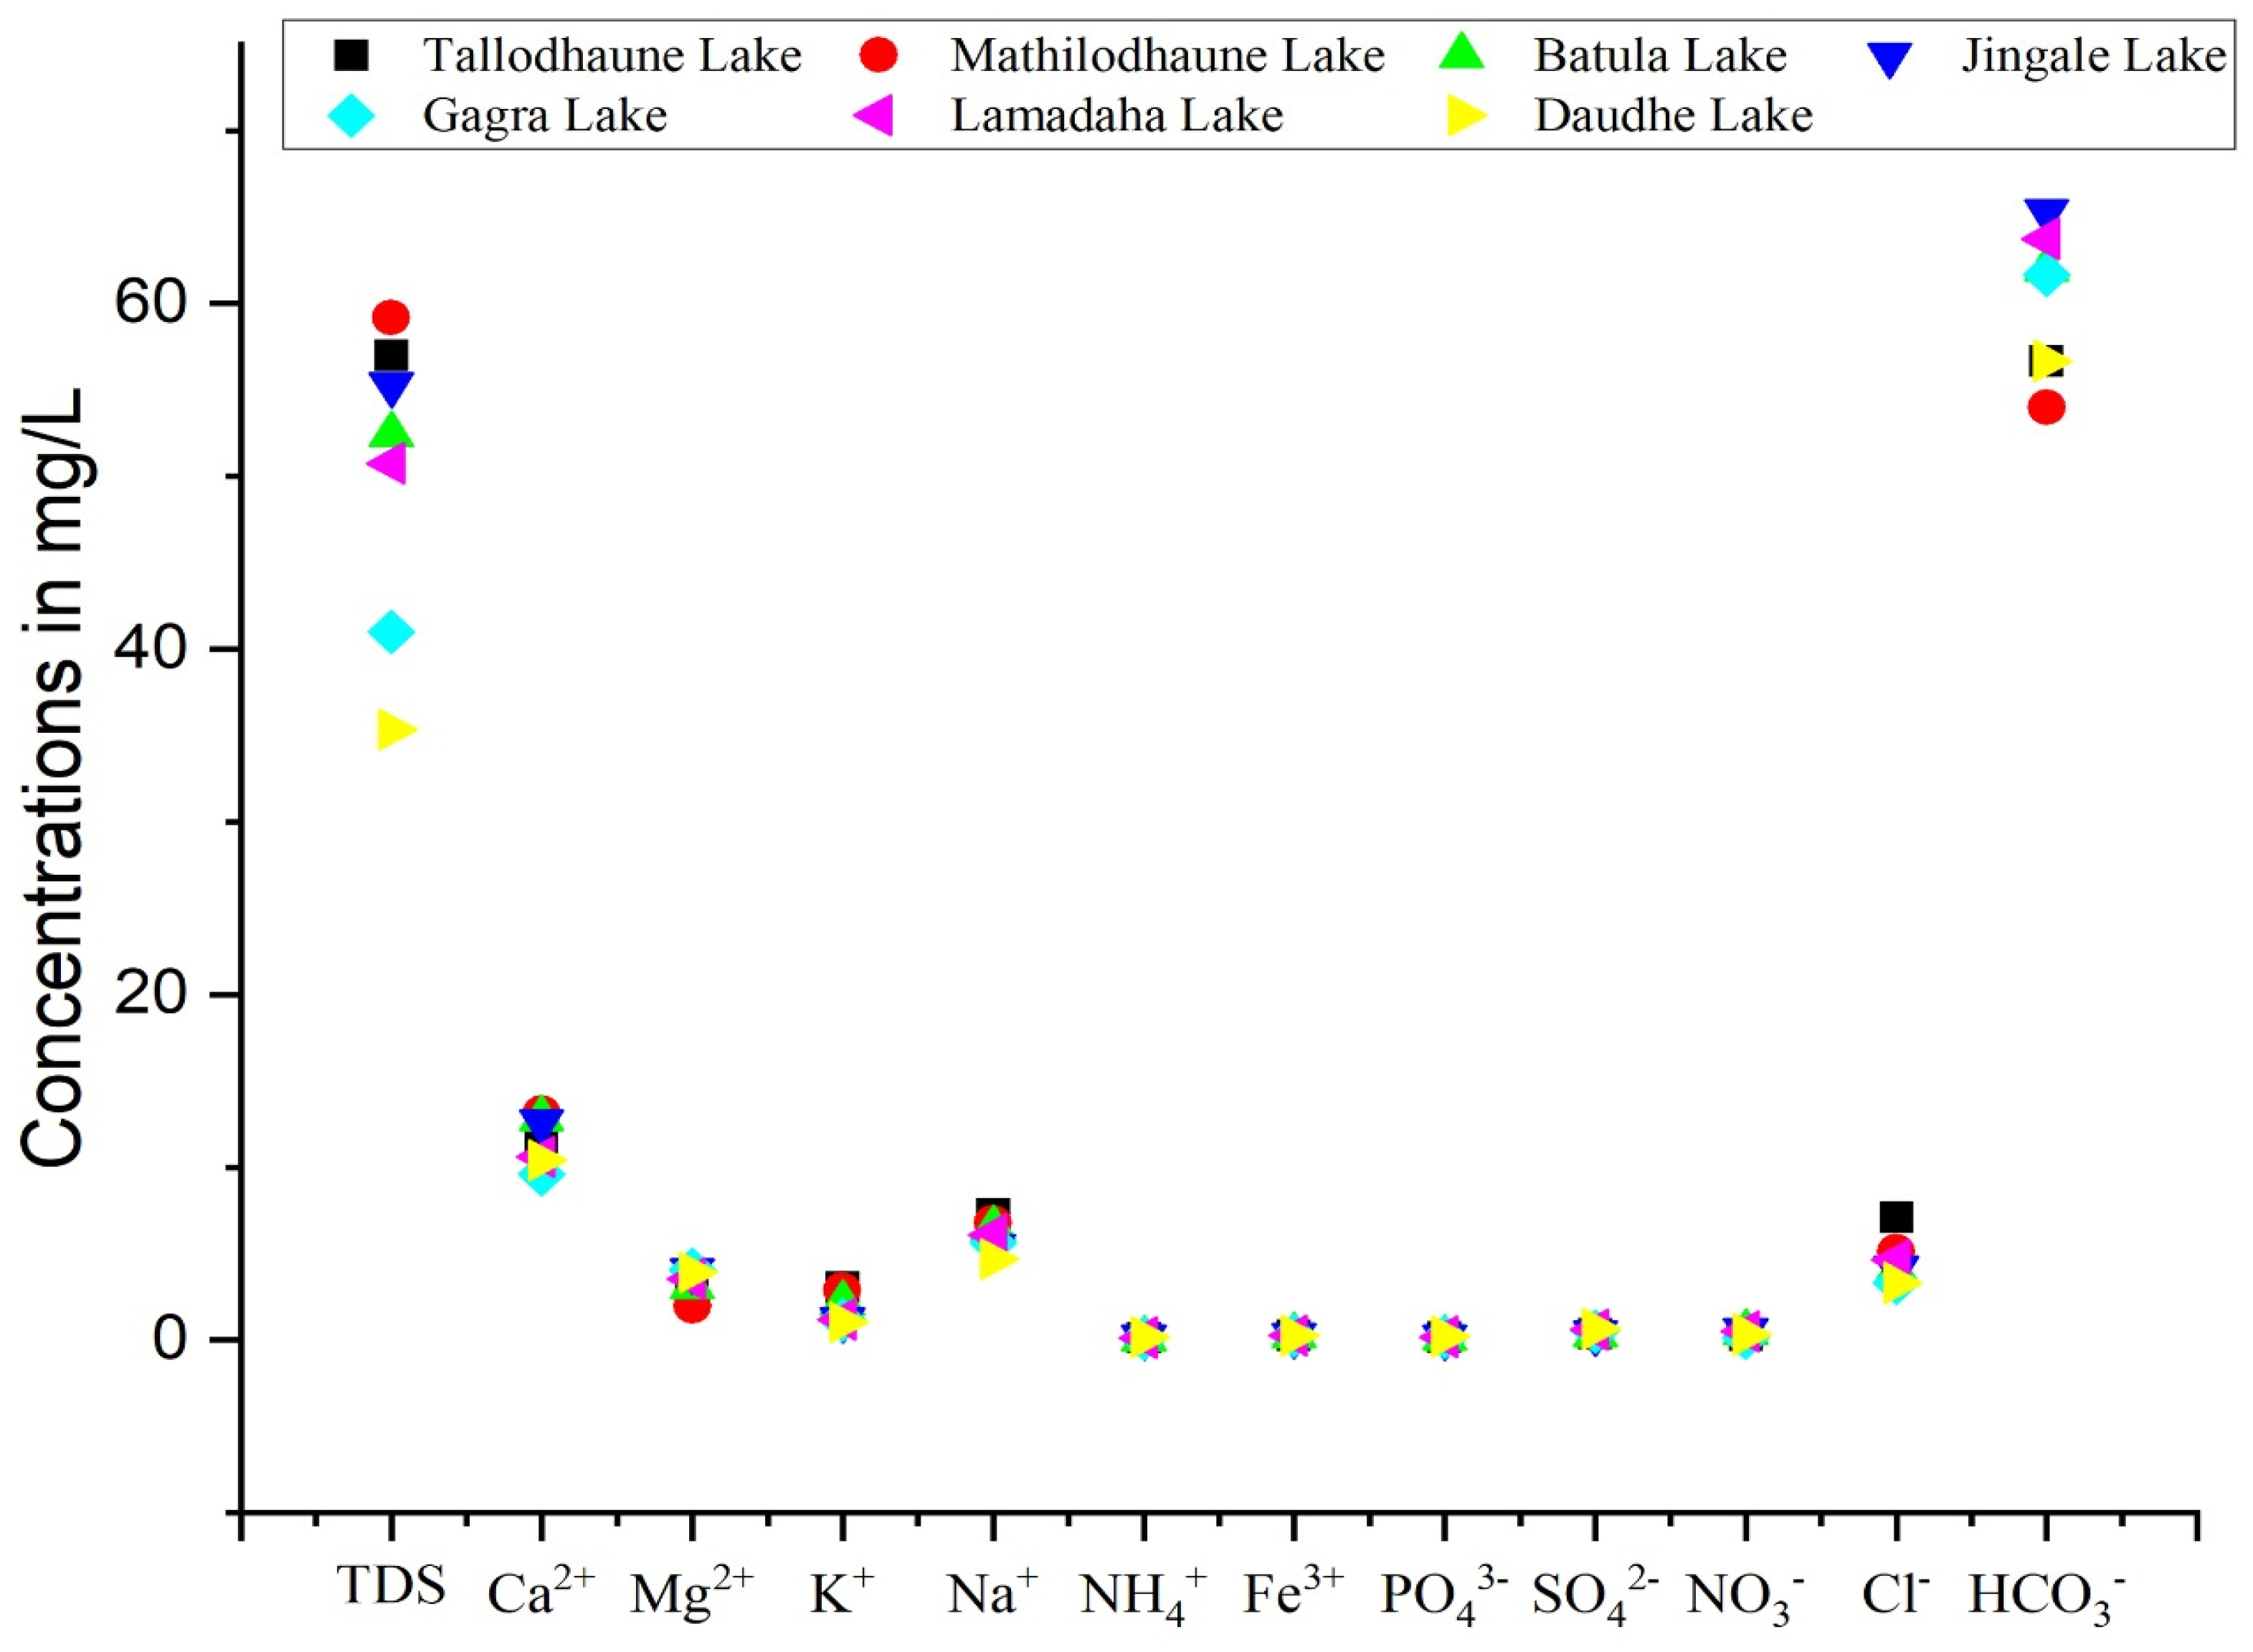
3.1. Physicochemical Characteristics of Lake Water

The temperature of the surface water in the Ramaroshan Lake Complex (RLC) ranged from 16.2 °C to 21.3 °C with a mean temperature of 18.8 °C (Table 2). Temperature is an important factor of water quality as it affects the physical, chemical, and biological processes in lake water [26]. The water samples from the RLC were moderately alkaline to alkaline in nature with a pH in the range of 7.6 to 9.2 with a mean of 8.76. Daudhe Lake followed by Gagra Lake had the highest pH levels compared to the other lakes. The high pH value can be attributed to the underlying carbonate-dominated lithology, including rainfall which might dilute the alkaline substances [41] or the utilization of the dissolved carbon dioxide for photosynthesis by macrophytes [42]. The average annual atmospheric precipitation in the region is reported to be 1891 mm/year, which could have a key role in diluting chemical compounds in the lake water, including alkaline substances which elevate the pH level. Some of the water samples exceeded the potability value as specified by the drinking water guideline of the WHO (i.e., pH: 6.5–8.5) [43] and aquaculture guideline value specified by the National Water Quality Guidelines for Aqua Culture (NWQGAC), Nepal (i.e., pH: 6.5–9) [44]. The reproduction, respiration, and other biological functions of aquatic life might be hampered by pH levels that are outside the range of these threshold values [16]. The observed turbidity values ranged from 0.29 to 4.45 NTU and were below the recommended WHO limit.
Electrical conductivity (EC) is an indirect measure of TDS which is influenced by ionic species concentration, volume, and its rate of movement [45]. The mean value of EC and TDS in the present study (100.03 ± 15.42 µS/cm and 52.39 ± 7.16 mg/L, respectively) suggests a low-mineralized freshwater that receives less inorganic and organic inputs. The mean concentration of TDS in the seven lakes (from least to greatest) was Daudhe, Gagra, Lamadaha, Batula, Jingale, Tallodhaune, and Mathilodhaune (Table 3). The lower TDS and EC values in the study sites may be attributed to rainfall dilution [42], slow rates of weathering [46], and the consumption of electrolytes and ions by aquatic plants [24].
The DO is one of the important components of an aquatic ecosystem. The variability in the DO values may be due to differences in temperature, respiration of biota, decomposition of organic matter, turbulence, and altitude [42], as well as light penetration [6]. Natural waters have DO values up to 14.6 mg/L when they are in equilibrium with the atmosphere [47]. A high value of DO reflects a higher self-purification capacity and thus indicates good water quality. The mean DO for the study site was 8 mg/L, which shows the quality of water is good. Likewise, free CO2 is another important factor for a healthy aquatic ecosystem, and it depends upon the photosynthesis and respiration of aquatic plants and animals. The average CO2 in the study site was 3.53 mg/L, which indicates low organic pollution and good water quality.
The relative abundance of cations in the RLC was in the order of Ca2+ > Na+ > Mg2+ > K+ > Fe3+ > NH4+. Ca2+ values ranged from 8.8 to 17.6 mg/L with a mean value of 12.02 mg/L, while the concentration of Mg2+ ranged from 0.98 to 7.32 mg/L with a mean value of 3.51 mg/L. Ca2+ and Mg2+ are primarily responsible for water hardness. Water can be classified into four categories based on its total hardness: soft water (<60 mg/L), moderately hard water (61–120 mg/L), hard water (121–180 mg/L), and very hard water (>180 mg/L) [48]. The total water hardness in this study was found to range from 36 to 73 mg/L, which translates to a hardness designation of soft to moderately hard water. Among the seven lakes studied, total hardness was found to be highest in Jingale Lake. The cause of hardness in water can be attributed to the weathering process, decaying phytoplankton, and the dissolution of concrete in the lake periphery and sidewalks [19], as well as bacterial action in soil in percolating water [49]. At higher altitudes, there is less collision of water and rocks, thus fewer cations gets dissolved in water, resulting in a lower hardness [50]. The Na+ and K+ concentrations in the lake water samples ranged from 4.3 to 7.5 mg/L (mean = 5.89 mg/L) and 0.80 to 3.50 mg/L (mean = 1.67 mg/L), respectively. The concentration of iron ranged from 0.24 to 0.27 mg/L with a mean value of 0.25 mg/L, which is below the potability value as specified by WHO (0.3 mg/L). The source of iron in water can be attributed to geogenic sources or the release of metal from the bottom of the sediment [27].
The relative abundance of anions in the RLC was in the order of HCO3 > Cl > SO42− > NO3 > PO43−. HCO3 was the dominant anion with a concentration ranging from 40 to 75 mg/L. The source of HCO3 in water can result from the dissolution of carbonate rock (e.g., limestone, dolomite, magnesites), organic decomposition, the interaction of CO2 from the atmosphere [51], and the process of photosynthesis [52]. The mean concentration of Cl in the study area was 4.41 mg/L. Sources of chloride in water can be natural, such as precipitation or rock–water interaction, or due to anthropogenic events such as agricultural activities, surface runoff, industrial effluent, and waste disposal [53]. Minerals like mica and apatite and liquid inclusions from igneous rocks also impart chloride in water [54]. Chloride-bearing minerals like sodatite and chlorapatite in granite/gneiss terrain were negligible, thus the input of chloride in the RLC water was likely due to the ion exchange of Na+ for Ca2+ and Mg2+ or from agricultural activities [55]. The mean concentration of sulphate was 0.48 mg/L. Sulfate ion concentrations in lakes are derived from the weathering of sulfide-bearing minerals and the mineralization of organic sulfur in humus found at the bottom of soil [56]. A high sulfate concentration is undesirable for human health as it causes a laxative effect [55]. Phosphorus is one of the key nutrients determining the productivity of a lake [50]. The mean phosphorus concentration at the RLC was 0.16 mg/L which is less than the WHO guideline (i.e., 1 mg/L) but slightly greater than the prescribed value by NWQGAC (<0.6 mg/L), which indicates the possibility of a nutrient enrichment in the water system that can lead to eutrophication and affect the aquatic ecosystem [57].
Likewise, excess nitrates in water can also cause eutrophication in lakes, which creates anaerobic conditions that affect the survival of aquatic organisms by depriving them of oxygen [47]. The concentration of NO3 in water samples ranged from 0.02 to 2.36 mg/L (mean = 0.44 mg/L) and were within the permissible range as specified by WHO. The NO3 concentration was relatively higher in Jingale Lake compared to the other lakes, which indicates a higher anthropogenic interference in lakes (Figure 3). However, higher values of NO3 in some of the sampling points can also be attributed to human and animal excreta through the process of microbial nitrification and phytoplankton activities [58].

3.2. Characterization of Hydrochemical Facies

A hydrochemical facies describes the dominant cations and anions that influence the hydrochemical characteristics of water. A Piper plot [59] was used for a hydrochemical characterization and to elucidate the status of major ions. A Piper plot consist of two trilinear diagrams, one for the cation and the other for the anion, which are combined to show a single point in a diamond-shaped field that reveals the dominant hydrochemical facies. Most of the water samples lie in the lower left corner of the cation ternary plot, which indicates calcium as the dominant cation (Figure 4a). In the anion plot, most of the samples lie near HCO3 indicating HCO3 as the dominant anion. The Piper plot shows the dominancy of the alkaline earth metals, Ca2+ and Mg2+, over alkali metals (Na+ and K+) and the dominancy of weak acid (HCO3) over strong acids (Cl and SO42−). The water samples fell under the Ca-HCO3 type in the central diamond field, indicating a carbonate-dominated lithology. An alternative to the Piper plot is a Durov diagram which consists of two ternary plots (a ternary plot on the left represents the cation, and a ternary plot at the top represents the anion) and a square in the middle that is a projection of the two ternary plots with the concentrations expressed in milliequivalent percentages [60]. In the extended Durov diagram, a pH plot is added to the bottom, and TDS is added to the right side of the plot. Similar to the Piper plot, the data plots in the Durov diagram show that all the water samples fall under the Ca-HCO3 type (Figure 4b).
A Stiff diagram was used to show the major ion composition in the water. According to the Stiff diagram (Figure 5), the order of cations (from greatest to least) for four of the lakes (Tallodhaune, Mathilodhaune, Lamadaha, and Gagra) was Ca2+, Na+ + K+, and Mg2+, while the three other lakes (Batula, Jingale, and Daudhe) had the order Ca2+, Mg2+, and Na+ + K+. The order of major anions for each lake was HCO3, Cl, and SO42−. The hydrochemical facies in the study region was the Ca-HCO3 type, as indicated by the fact that the dominating cation and anion were Ca2+ and HCO3, respectively.
Dangol et al. [61] also showed Ca-HCO3 was the dominant lithology for the RLC. The results, however, were in contrast with the findings of Chalaune et al. [29], who reported the dominance of a Ca-Mg-Cl mixed water type over that of Ca-HCO3 in the RLC. The present study was conducted during the late monsoon when the study sites were experiencing significant rainfall which might have resulted in the dilution of various chemical ions including HCO3 and thus resulted in the observed hydrochemical facies.

3.3. Major Sources and Controlling Factors of Hydrochemistry

Gibbs [12] suggested a relationship between TDS and Na+/(Na+ + Ca2+) or TDS and Cl/(Cl + HCO3), which reveals the relative importance of the three main natural processes that control the chemistry of surface water, namely, atmospheric precipitation, evaporation, and rock weathering. In the Gibbs plot (Figure 6), most of the water samples are located in the middle part (rock dominance zone), indicating that rock weathering is the primary factor dictating the ion chemistry of the RLC. Thus, based on the Gibbs plots, the TDS values in the lakes under study registered at less than 100 mg/L. Additionally, the molar ratios of Cl/(Cl + HCO3) and Na+/(Na+ + Ca2+) for all samples were below 0.5. These findings were consistent across all water samples which were predominantly situated in rock-dominated areas.
A mixing diagram, plotted using average ionic ratios, can be used to trace the sources of dissolved ions in a freshwater system and explain the hydrochemistry that controls them [15]. Different combinations of dissolved cations and anions in water are produced by the weathering of different parent rocks (carbonates, silicates, and evaporites). For example, the weathering of carbonates, silicates, and evaporites yields Ca2+ and Mg2+; the weathering of evaporites and silicates produces Na+ and K+; and HCO3 originates from carbonates and silicates, whereas the source of SO42− and Cl is from evaporites [17]. In the mixing diagram (Figure 7), the water samples fall between the carbonate and silicate dominance zone and are far from the evaporation dominance zone, which indicates that carbonate followed by silicate weathering are the main factors that govern the hydrogeochemical process. Generally, carbonates are more soluble than silicates (12–40 times), hence they are more likely to weather in natural conditions [13].
Additionally, ionic ratios can be used to explain the sources of ions in water and support the results from diagrams. Table 4 presents the ionic ratios of the physicochemical parameters of the lakes in the RLC.
The dominance of carbonate weathering over that of silicate is demonstrated by the high ratio of (Ca2+ + Mg2+)/Tz+ (0.73) and the comparatively low ratio of (Na+ + K+)/Tz+ (0.25). Furthermore, the ratio of (Ca2+ + Mg2+)/(Na+ + K+) was found to be 2.86, thus confirming the dominance of carbonate weathering. Additionally, Ca-HCO3 was the predominant hydrochemical facies in the lake, indicating the influence of carbonate weathering.
The dissolution of calcite and dolomite in the water is indicated by the ratio of calcium and magnesium ions. When the ratio of Ca2+ to Mg2+ is close to 1, the dissolution of dolomite occurs, while a higher ratio indicates the dissolution of calcite [62]. In this study, the higher ratio of Ca2+ to Mg2+ indicates the contribution is from calcite dissolution.
The Ca2+ + Mg2+ vs. Tz+ scatter plot (Figure 8a) for the lake water had a linear spread below the equiline 1:1, indicating that Ca2+ + Mg2+ was the primary contributor to the total cations. Additionally, in the scatter plot of Na+ + K+ vs. Tz+ (Figure 8b), most of the water samples were above the equiline 1:1, signifying a lesser contribution of Na+ and K+ to the total cations [19].
If the plots of (Ca2+ + Mg2+) to (HCO3 + SO42−) are below a 1:1 equiline, it suggests the effect of ion exchange as the dominant process, while plots above a 1:1 equiline suggest the effect of reverse ion exchange. Most of the water samples from the RLC were below the equiline 1:1 (Figure 8c), which indicates that Ca2+ + Mg2+ is slightly less compared to HCO3 + SO42− and ion exchange is the dominant process in controlling water chemistry [63].
A proton is needed for the chemical weathering of carbonate rocks. Carbonation and the oxidation of sulfides are the two main reactions that produce protons. The source of the proton can be determined using the C-ratio (HCO3/(HCO3 + SO42−). While a C-ratio close to 1 denotes weathering by carbonation reactions where protons are derived from atmospheric CO2, a C-ratio of less than 0.5 denotes coupled chemical reactions involving the weathering of carbonates with protons derived primarily from sulfide oxidation [13,64]. As demonstrated in Figure 8d, the C-ratio in the current study was very close to 1, indicating carbonation reaction and ambient CO2 dissolution and dissociation.

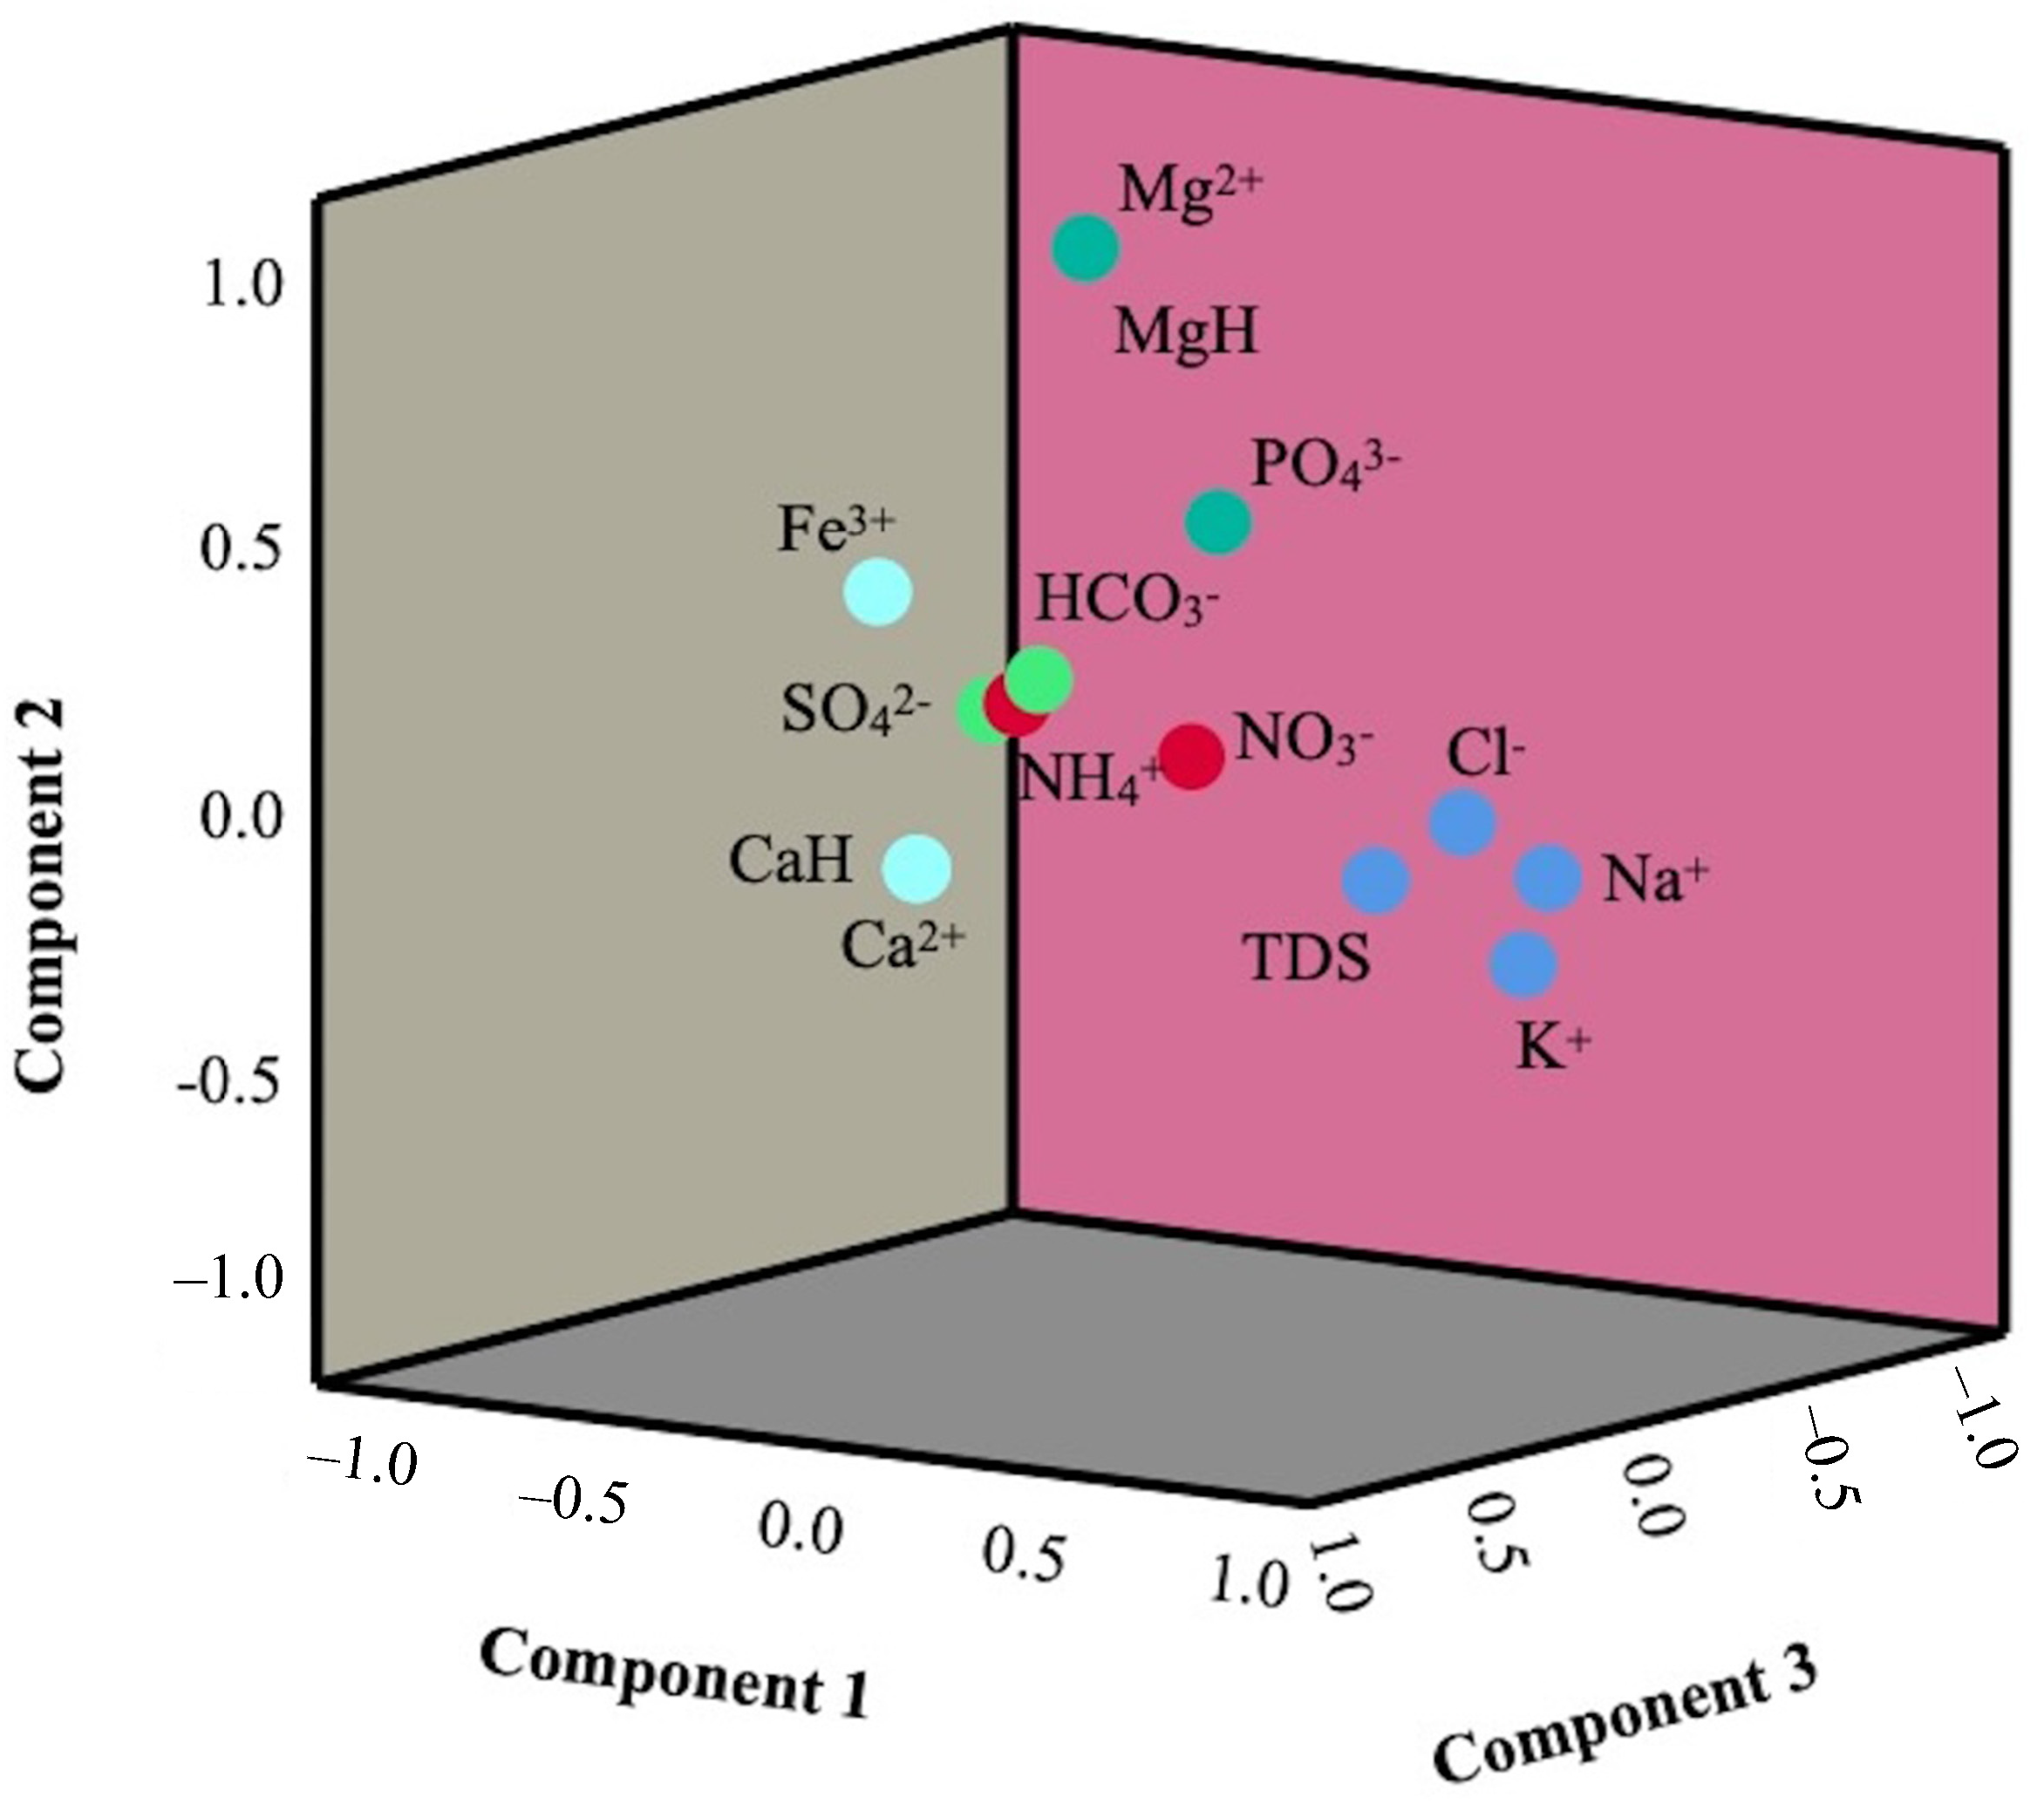
3.4. Association among Hydrochemical Attributes

A principal component analysis (PCA) is a statistical technique that reduces the dimensionality of datasets by transforming a large set of variables into a smaller one without losing the originality of real data [65]. To accomplish this, PCA uses a covariance matrix of actual data to derive eigenvectors and eigenvalues. The eigenvalues of principal components (PCs) 1, 2, 3, 4, and 5 were found to be 3.83, 2.75, 1.68, 1.53, and 1.04, respectively (Table 5). The five PCs explained about 77.55% of the total variance (Figure 9). PC1 accounted for 27.36% of the variance and was highly loaded on TDS, Cl, Na+, and K+. The association of these hydrochemical attributes indicates their sources from natural processes such as weathering along with evaporite dissolution [13]. PC2 was loaded with Mg2+, Mg hardness, and PO43−, which explained about 19.69% of the variance (Figure 9). The association of Mg2+ and PO43− signifies the formation of magnesium phosphate in water. Likewise, PC3 accounted for 12.04% of the variance and was loaded with Ca2+, Ca hardness, and Fe3+, the source of which might be attributed to a geogenic origin. NO3 and NH4+ showed a positive loading in PC4, which explained about 10.95% of the variance in the result. These findings indicate the common sources of these two parameters, which might result from anthropogenic activities. PC5 was positively loaded on HCO3 and negatively loaded with SO42−, which suggests that the source of these two parameters is different. The source of HCO3 might be from weathering reactions and the decomposition of organic matter [27], while the source of SO42− might be from the dissolution of sulfate minerals, the oxidation of sulfide minerals, or from anthropogenic activities [66].
A hierarchical cluster analysis (HCA) was applied to the datasets to find intuitive similarity relationships between sampling sites by means of the Wards method using a squared Euclidean distance. The major ions (Ca2+, Mg2+, Na+, K+, NH4+, HCO3, Cl, SO42−, NO3, and PO43−) were used to perform the cluster analysis. All 38 sampling sites were grouped into two main clusters with distance criteria from 0 to 10 which are illustrated in a dendrogram (Figure 10).
Gagra and Daudhe Lakes, which are located at higher elevations away from human settlements and are characterized by very low TDS, were grouped in the same cluster, whereas the other five lakes (Mathiolodhaune, Tallodhaune, Jingale, Batula, and Lamadaha), which were interconnected and close to human settlements with relatively high TDS, were grouped in the same cluster, which signifies the influence of similar geological processes and anthropogenic factors.

3.5. Comparative Analysis

The comparative assessment of the hydrochemical parameters of the seven lakes in the RLC with other selected lakes of the Nepal Himalayas is presented in the Table 6. The average pH of lakes in the RLC was 8.7, indicating an alkaline nature, whereas prior research on the RLC reported a slightly acidic nature with a mean pH of 6.9. The higher pH in this study is likely due to the impacts of intense precipitation to exposed rocks and soils and the weathering of carbonate minerals. Most of the lakes in the RLC exhibited a pH range between 7 and 9 (Table 6). The EC and TDS in the current study were 100 µS/cm and 52 mg/L, respectively, which is greater than noted in previous research in the RLC. In alkaline conditions (high pH), there is a higher concentration of alkaline ions, like carbonate, bicarbonate which leads to an increase in EC and TDS. Most of the Himalayan lakes had an EC value less than 300 µS/cm, which is comparable with this study (Table 6). EC values were lowest in Gosaikunda Lake and highest in Betkot Lake (Table 6). Among the cations, Ca2+ was the most dominant in all the lakes except for Rajarani Lake, where the lake water was reported to be dominated by Na+. The contrasting results for Rajarani Lake might be attributed to the weathering of silicate minerals and higher anthropogenic interference, including the addition of wastewater containing soapy solution [23]. The mean value of magnesium and potassium in the present study is comparable to many of the lakes in the region (Table 6).
For all the lakes, the anions followed an order of HCO3 > Cl > SO42−. The mean concentration of HCO3 in the present study was 61.58 mg/L. The mean HCO3 concentration was highest for Kupinde Lake and lowest for Gosaikunda Lake in previous studies. The lower HCO3 concentration indicates the lower buffering capacity of the lake and greater susceptibility to rapid pH changes in response to acid or alkaline inputs [20,67]. The mean Cl concentration in the present study was 4.41 mg/L, which is lower than the prior investigations of the RLC. This result may be attributed to precipitation which resulted in the dilution of chloride in the surface water. The mean chloride concentration was highest for the Gosaikunda Lake and was the lowest for Rara Lake. The SO42− concentration of the present study showed relatively low mean values and is comparable with many other Himalayan lakes (Table 6).
Table 6. Comparison of the major ions of the lakes in the Ramaroshan Lake Complex (RLC) with selected lakes from Nepal.
LakespHECTDSCa2+Mg2+Na+K+HCO3ClSO42−References
RLC8.76 ± 0.4100.03 ± 15.4252.39 ± 7.1612.02 ± 2.243.51 ± 1.385.89 ± 0.891.67 ± 0.7861.58 ± 9.454.41 ± 1.430.48 ± 0.14Present study
RLC6.9 ± 0.277.41 ± 36.7140.02 ± 19.026.76 ± 3.23.41 ± 1.555.6± 0.231.34 ± 0.7743.58 ± 23.9811.83 ± 3.911.04 ± 0.62[29]
Batula7.43 ± 0.1767.85 ± 31.7634.85 ± 16.610.28 ± 4.673.27 ± 1.465.5 ± 0.252.3 ± 0.6439.23 ±14.9212.12 ± 3.421.96 ± 3.29[62]
Rara 8.42 ± 0.3189.93 ± 5.394.75 ± 3.299.17 ± 2.675.89 ±3.650.35 ± 0.190.8 ± 0.5154.02 ± 23.40.10 ± 0.050.14 ± 0.05[8]
Gosaikunda7.0 ± 1.07511.66 ± 5.2497.17 ± 4.9813.47 ± 2.0551.30 ± 0.6540.45 ± 5.4350.28 ± 0.07117.49 ± 3.28420.5 ± 13.7813.94 ± 2.380[68]
Betkot7.77 ± 0.19337 ± 20.46168 ± 10.2815.80 ± 1.486.8 ± 0.984.89 ± 0.332.9 ± 0.4224.92 ± 2.565.31 ± 2.42-[26]
Kupinde8.16 ± 0.29136 ± 3.0468 ± 1.6727.97 ± 4.3311.23 ± 4.937.38 ± 0.363.47 ± 0.65157.71 ± 69.096.04 ± 1.340.64 ± 0.5[69]
Ghodaghodi8 ± 0.64142 ± 26.5277 ± 13.6916 ± 1.0342.4 ± 0.125.5 ± 1.482.1 ± 0.5449 ± 10.586.6 ± 1.514.8 ± 0.94[25]
Rajarani8.71 ± 0.4654.05 ± 6.8632.15 ± 6.575.56 ± 1.171.96 ± 1.248.09 ± 0.532.67 ± 0.0732.75 ± 4.4411.64 ± 1.91-[23]
Begnas7.89 ± 0.2669 ± 4.2640 ± 2.667.3 ± 0.272.24 ± 0.082.30 ± 0.310.72 ± 0.1217.88 ± 1.781.99 ± 0.482.57 ± 0.92[10]
Rupa9.06 ± 0.22110 ± 15.6864 ± 9.049.83 ± 1.293.58 ± 0.114.12 ± 1.361.00 ± 0.1737.60 ± 5.042.13 ± 2.022.4 ± 0.43[10]

3.6. Irrigation Quality Assessment

The irrigation water quality is influenced by the type and the concentrations of various dissolved ions and substances. To determine the suitability of the studied lake water for irrigation, various parameters, such as EC, sodium adsorption ratio (SAR), percent sodium (Na%), Kelly’s ratio (KR), permeability index (PI), magnesium hazard (MH), and cation ratio of soil structural stability (CROSS), were estimated. The average value of the calculated irrigation indices for each lake is presented in Table 7, and the classification of water samples based on the suitability of water is presented in Table 8.
EC is one of the critical parameters for analyzing water for irrigation purposes. When water with high EC values is used for irrigation, salts enter the root zone of the plant and increase the risk of salinity, water scarcity, toxicity, and other related issues [70]. An EC value < 250 is excellent, 250–750 is good, 750–2000 is permissible, 2000–3000 would be doubtful, and >3000 is unsuitable for irrigation. The EC values in the study area ranged from 59 to 116, thus all the water samples fall within the excellent category and thus are very suitable for irrigation purposes.
Sodium concentration is an essential factor when determining the suitability of water for irrigation. An elevated sodium level in irrigation water can cause the adsorption of Na+ onto the soil cation exchange sites, the destruction of the soil structure due to clay particle dispersion [70], and a reduction in soil permeability that leads to deflocculation, calcium deficiency, and the deterioration of cultivable land [71]. When assessing the suitability of water for irrigation purposes, the percentage of Na+ and SAR have been widely used [72]. Na% and SAR values can be classified into five major categories: <20 is excellent, 20–40 is good, 40–60 is permissible, 60–80 is doubtful, and >80 would be considered unsuitable. The values of Na% of the collected lake water samples ranged from 19.4 to 41.36 with a mean of 32.83. Based on Na%, 1 water sample fell within the excellent category, 33 samples were within the good category, and 4 samples were considered permissible. SAR values ranged from 1.40 to 2.68 with an average value of 2.13, thus indicating that the water is excellent for irrigation purposes. Additionally, a Wilcox diagram, which is based on EC and SAR values, showed that all the water samples fell within the C1S1 category (Figure 11). This indicates that the salinity hazard and sodium hazard are low, and the water is very suitable for irrigation purposes.
Table 8. Classification of water quality based on the suitability of water for irrigation purposes [55,73].
ParametersRangeClassNumber of Samples
EC<250Excellent38
250–750Good0
750–2000Permissible0
2000–3000Doubtful0
>3000Unsuitable0
Na%<20Excellent1
20–40Good33
40–60Permissible4
60–80Doubtful0
>80Unsuitable0
MR<50Suitable38
>50Unsuitable0
TH0–60Soft36
61–120Moderately hard2
121–180Hard0
>180Very hard0
SAR<20Excellent38
20–40Good0
40–60Permissible0
60–80Doubtful0
>80Unsuitable0
PI>75Class I3
25–75Class II35
<25Class III0
KR<1Suitable38
>1Unsuitable0
CROSS<10Excellent38
10–18Good0
18–26Permissible0
<26Unsuitable0
Assessing the concentration of Mg2+ in water is important as it makes the soil alkaline and reduces the availability of phosphorus, which results in low crop yield [73]. A MH value >50 is considered harmful and unsuitable for irrigation, while a value < 50 is safe and suitable for irrigation. In the present study, MH values ranged from 5.7 to 33.2 with an average of 22.57. Thus, all water samples are suitable for irrigation use.
The permeability Index is used to measure the ability of water to permeate the soil, which is influenced by sodium, magnesium, calcium, and bicarbonate contents in the soil [74]. Water can be categorized into three classes (Class I, Class II, and Class III) based on the permeability index value. Class I water has a maximum permeability of 75% or higher, making it excellent for irrigation. Class II water has a maximum permeability of 25–75% and is considered suitable for irrigation. Class III water has a maximum permeability of 25% making it unsuitable for irrigation [49,73]. In the current study, most of the samples (n = 35) fell into the Class II category of Donen’s chart, signifying the water is of good quality, while the three remaining samples fell within the Class I category, indicating the water is excellent for irrigation purposes.
The KR represents an important parameter for assessing water quality for irrigation and is obtained by calculating sodium against calcium and magnesium. A KR greater than one indicates that the water has an excess of sodium and is therefore unsuitable for irrigation. A KR < 1 indicates the suitability of water for irrigation. In this study, all the water samples had a KR < 1, signifying that the water is suitable for irrigation.
A CROSS is used as an index to determine structural stability of soil and reflects various flocculating properties of Ca2+ and Mg2+ and various dispersive properties of Na+ and K+ [40]. CROSS values can be classified into four major classes: excellent < 10, good 10–18, permissible 18–26, and unsuitable >26. In this study, all water samples had CROSS values < 10 (Table 7 and Table 8), signifying the water is excellent for irrigation use.

4. Conclusions

The hydrochemical analysis conducted on water sourced from the Ramaroshan Lake Complex (RLC) indicated that most parametric values align with the WHO’s specified standards for potable water. However, deviations were observed, specifically in the pH values of certain lakes. In this study, Ca2+ was the most dominant cation, while HCO3 was the most dominant anion. A Piper plot revealed that the dominant hydrochemical facies of the lake water was the Ca-HCO3 type, suggesting a calcium carbonate type of lithology in the study area. A Gibbs plot, principal component analysis, and mixing diagram all suggested that the most important process controlling hydrochemistry is rock weathering. A mixing diagram also demonstrated the dominance of carbonate weathering over silicate weathering, which was further confirmed by the high ratio of (Ca2+ + Mg2+)/(Na+ + K+). Tests of different irrigation indices confirmed that the water from the RLC is suitable for irrigation.
This study assessed the hydrochemical intricacies of high-altitude freshwater lakes, employing geochemical indices and multivariate statistical analysis. The findings hold significant relevance for local communities, policymakers, and academia, particularly within the broader context of global climate change and its impact on these lakes. A notable constraint of this research, however, lies in its dependence on a one-time water sampling focused on major hydrochemical variables. To improve reliability and advance understanding, it is recommended that future research endeavors involve long-term monitoring encompassing a broader spectrum of hydrochemical variables, including trace elements and microbial parameters, especially concerning the Himalayan Lakes.

Author Contributions

Conceptualization, L.K. and R.R.P.; methodology, B.T., C.R.B., P.S., L.P.U., C.B.S., J.P., N.P., P.K. and A.K.S.; software, B.T., R.R.P. and K.B.; validation, L.K., R.R.P. and P.K.; formal analysis, B.T., R.R.P. and C.B.S.; investigation, B.T.; resources, L.K., R.R.P. and C.R.B.; data curation, B.T., P.S. and K.B.; writing—original draft preparation, B.T.; writing—review and editing, L.K., R.R.P., A.K.S., P.K. and R.C.K.; visualization, B.T., L.K. and R.R.P.; supervision, L.K. and R.R.P.; funding acquisition, L.K. and C.R.B. All authors have read and agreed to the published version of the manuscript.

Funding

This research was financially supported by the Faculty Research Grant of the University Grant Commission Nepal (Grant No.: FRG 76/77 S&T-06 to Laxman Khanal and Chet Raj Bhatta). RCK and PK’s effort was supported in part by the National Institutes of Health (NIH) Office of Research Infrastructure Programs (ORIP) under award number P51OD010425 of the Washington National Primate Research Center, USA.

Data Availability Statement

The data used in the study will be made available upon request to the corresponding author.

Acknowledgments

We would like to thank the Department of Forests and Soil Conservation (Permission Number: 292-078/79) and the Ramaroshan Tourism Board for providing research permission in the Ramaroshan Wetland Complex. We are grateful to Indra Bahadur Rokaya for his valuable support during field works. We would like to thank the University Grant Commission Nepal for providing financial support to complete this study.

Conflicts of Interest

The authors declare no conflicts of interest.

References

  1. Saleem, M.; Jeelani, G.; Shah, R.A. Hydrogeochemistry of Dal Lake and the potential for present, future management by using facies, ionic ratios, and statistical analysis. Environ. Earth Sci. 2015, 74, 3301–3313. [Google Scholar] [CrossRef]
  2. Seth, R.; Mohan, M.; Singh, P.; Singh, R.; Dobhal, R.; Singh, K.P.; Gupta, S. Water quality evaluation of Himalayan rivers of Kumaun region, Uttarakhand, India. Appl. Water Sci. 2016, 6, 137–147. [Google Scholar] [CrossRef]
  3. Worako, A.W. Physicochemical and biological water quality assessment of Lake Hawassa for multiple designated water uses. J. Urban Environ. Eng. 2015, 9, 146–157. [Google Scholar] [CrossRef]
  4. Khatri, N.; Tyagi, S. Influences of natural and anthropogenic factors on surface and groundwater quality in rural and urban areas. Front. Life Sci. 2015, 8, 23–39. [Google Scholar] [CrossRef]
  5. Saini, R.; Swain, S.; Patra, A.; Khanday, G.; Gupta, H.; Purushothaman, P.; Chakrapani, G. Water chemistry of three Himalayan Lakes: Dal (Jammu & Kashmir), Khajjiar (Himachal Pradesh) and Nainital (Uttarakhand). Ann. Rainfall mm 2008, 655, 2300. [Google Scholar]
  6. Ahamad, F.; Sharma, A.K.; Tyagi, S.K. A Study on comparative assessment of water quality of Dal and Nigeen Lakes of Jammu and Kashmir, India. AgroEnvironmental Sustain. 2023, 1, 48–56. [Google Scholar] [CrossRef]
  7. Rupakheti, D.; Tripathee, L.; Kang, S.; Sharma, C.M.; Paudyal, R.; Sillanpää, M. Assessment of water quality and health risks for toxic trace elements in urban Phewa and remote Gosainkunda lakes, Nepal. Hum. Ecol. Risk Assess. Int. J. 2017, 23, 959–973. [Google Scholar] [CrossRef]
  8. Gurung, S.; Gurung, A.; Sharma, C.M.; Jüttner, I.; Tripathee, L.; Bajracharya, R.M.; Raut, N.; Pradhananga, P.; Sitaula, B.K.; Zhang, Y. Hydrochemistry of Lake Rara: A high mountain lake in western Nepal. Lakes Reserv. Res. Manag. 2018, 23, 87–97. [Google Scholar] [CrossRef]
  9. Sharma, C.M.; Sharma, S.; Bajracharya, R.M.; Gurung, S.; Jüttner, I.; Kang, S.; Zhang, Q.; Li, Q. First results on bathymetry and limnology of high-altitude lakes in the Gokyo Valley, Sagarmatha (Everest) National Park, Nepal. Limnology 2012, 13, 181–192. [Google Scholar] [CrossRef]
  10. Pant, R.R.; Bishwakarma, K.; Pal, K.B.; Thapa, L.B.; Shrestha, R.G.; Karuppannan, S.; Garu, L.; Bista, S.; Singh, V.B. Comparative analysis of hydrochemical variables of two Ramsar-listed lakes in Pokhara Valley, Nepal. Int. J. Energy Water Resour. 2023, 7, 1–13. [Google Scholar] [CrossRef]
  11. Gaury, P.K.; Meena, N.K.; Mahajan, A. Hydrochemistry and water quality of Rewalsar Lake of Lesser Himalaya, Himachal Pradesh, India. Environ. Monit. Assess. 2018, 190, 84. [Google Scholar] [CrossRef] [PubMed]
  12. Gibbs, R.J. Mechanisms controlling world water chemistry. Science 1970, 170, 1088–1090. [Google Scholar] [CrossRef] [PubMed]
  13. Pant, R.R.; Zhang, F.; Rehman, F.U.; Wang, G.; Ye, M.; Zeng, C.; Tang, H. Spatiotemporal variations of hydrogeochemistry and its controlling factors in the Gandaki River Basin, Central Himalaya Nepal. Sci. Total Environ. 2018, 622, 770–782. [Google Scholar] [CrossRef] [PubMed]
  14. Yao, Z.; Wang, R.; Liu, Z.; Wu, S.; Jiang, L. Spatial-temporal patterns of major ion chemistry and its controlling factors in the Manasarovar Basin, Tibet. J. Geogr. Sci. 2015, 25, 687–700. [Google Scholar] [CrossRef]
  15. Bishwakarma, K.; Wang, G.-X.; Zhang, F.; Adhikari, S.; Karki, K.; Ghimire, A. Hydrochemical characterization and irrigation suitability of the Ganges Brahmaputra River System: Review and assessment. J. Mt. Sci. 2022, 19, 388–402. [Google Scholar] [CrossRef] [PubMed]
  16. Mallick, J. Hydrogeochemical characteristics and assessment of water quality on the Al-Saad Lake, Abha Saudi Arabia. Appl. Water Sci. 2017, 7, 2869–2882. [Google Scholar] [CrossRef]
  17. Varol, M.; Gökot, B.; Bekleyen, A.; Şen, B. Geochemistry of the Tigris River basin, Turkey: Spatial and seasonal variations of major ion compositions and their controlling factors. Quat. Int. 2013, 304, 22–32. [Google Scholar] [CrossRef]
  18. Thomas, J.; Joseph, S.; Thrivikramji, K. Discriminant analysis for characterization of hydrochemistry of two mountain river basins of contrasting climates in the southern Western Ghats, India. Environ. Monit. Assess. 2015, 187, 365. [Google Scholar] [CrossRef]
  19. Khadka, U.R.; Ramanathan, A. Hydrogeochemical analysis of Phewa lake: A lesser Himalayan lake in the Pokhara Valley, Nepal. Environ. Nat. Resour. J. 2021, 19, 68–83. [Google Scholar] [CrossRef]
  20. Pant, R.R.; Chalaune, T.B.; Dangol, A.; Dhital, Y.P.; Sharma, M.L.; Pal, K.B.; Shah, S.T.H.; Shrestha, A.K.; Thapa, L.B. Hydrochemical assessment of the Beeshazar and associated lakes in Central Nepal. SN Appl. Sci. 2021, 3, 38. [Google Scholar] [CrossRef]
  21. Pal, K.B.; Bishwakarma, K.; Chalaune, T.B.; Upadhaya, D.; Joshi, T.R.; Thapa, L.B.; Sharma, M.L.; Joshi, S.; Pant, R.R. Hydrochemical assessment of Jhilmila Lake, Kanchanpur, Nepal. Sci. World 2021, 14, 124–131. [Google Scholar] [CrossRef]
  22. Kaphle, B.; Wang, J.-B.; Kai, J.-L.; Lyu, X.-M.; Paudayal, K.N.; Adhikari, S. Hydrochemistry of Rara Lake: A Ramsar lake from the southern slope of the central Himalayas, Nepal. J. Mt. Sci. 2021, 18, 141–158. [Google Scholar] [CrossRef]
  23. Adhikari, B.; Pant, R.R.; Baral, U.; Shrestha, S.; Neupane, S.; Khanal, B.; Acharya, A.; Bhattarai, H. Geochemical and multivariate assessment of water quality in the Rajarani Lake, Dhankuta, Nepal. J. Nepal Geol. Soc. 2020, 60, 37–49. [Google Scholar] [CrossRef]
  24. Pant, R.; Khanal, N.; Pal, K.; Thapa, L.; Galaju, R.; Chaudhari, S.; Basnet, B.; Dhami, N.; Duediev, K.; Bishwakarma, K. Hydrochemical characteristics and macrophytes in the Betana Lake, Eastern Nepal. J. Sustain. Agric. 2020, 3, 44–51. [Google Scholar]
  25. Pant, R.R.; Pal, K.B.; Bishwakarma, K.; Thapa, L.B.; Dangol, A.; Dawadi, B.; Poudel, P.; Bhattarai, B.; Joshi, T.R.; Bhatt, Y.R. Application of multivariate approaches to the hydro-chemical assessment of the Ghodaghodi lake, sudurpaschim province, Nepal. Nepal J. Sci. Technol. 2020, 19, 46–54. [Google Scholar] [CrossRef]
  26. Pant, R.R.; Dhakal, T.; Thapa, L.; Baral, U.; Dangol, A.; Chalaune, T.; Pal, K. Water quality assessment of the Betkot lake, Sudurpaschim Province, Nepal. N. Am. Acad. Res. 2019, 2, 36–62. [Google Scholar] [CrossRef]
  27. Khadka, U.R.; Ramanathan, A. Major ion composition and seasonal variation in the Lesser Himalayan lake: Case of Begnas Lake of the Pokhara Valley, Nepal. Arab. J. Geosci. 2013, 6, 4191–4206. [Google Scholar] [CrossRef]
  28. Bhatta, R.; Gurung, S.; Joshi, R.; Tuladhar, S.; Regmi, D.; Kafle, B.K.; Dahal, B.M.; Raut, N.; Kafle, K.R.; Kayastha, R.; et al. Spatio-temporal hydrochemistry of two selected Ramsar sites (Rara and Ghodaghodi) of west Nepal. Heliyon 2022, 8, e11243. [Google Scholar] [CrossRef]
  29. Chalaune, T.B.; Dangol, A.; Sharma, J.; Sharma, C.M. First results on physico-chemical status and bathymetry of lakes in Ramaroshan Wetland, Far-West Nepal. Nepal J. Environ. Sci. 2020, 8, 17–27. [Google Scholar] [CrossRef]
  30. DoF. Wetlands of Western Nepal. A Brief Profile of Selected Lakes; Department of Forests and Soil Conservation: Kathmandu, Nepal, 2017. [Google Scholar]
  31. Paudel, J.; Khanal, L.; Pandey, N.; Upadhyaya, L.P.; Sunar, C.B.; Thapa, B.; Bhatta, C.R.; Pant, R.R.; Kyes, R.C. Determinants of herpetofaunal diversity in a threatened wetland ecosystem: A case study of the Ramaroshan Wetland Complex, Western Nepal. Animals 2022, 13, 135. [Google Scholar] [CrossRef]
  32. Poudel, A.K.; Adhikari, D. Monitoring of wetland dependent birds in Ramaroshan Lake Complex of Achham, Nepal. Bird Conserv. Nepal Newsl. 2020, 12–14. [Google Scholar]
  33. Dahal, B.K.; Dahal, R.K. Landslide hazard map: Tool for optimization of low-cost mitigation. Geoenviron. Disasters 2017, 4, 8. [Google Scholar] [CrossRef]
  34. Karki, J.; Shrestha, K.; Khanal, B. Faunal diversity and related conservation issues at Badimalika region (Achham, Bajura, and Kalikot districts), Nepal. Wildlife 2003, 8, 14–22. [Google Scholar]
  35. APHA. Standard Methods for the Examination of Water and Wastewater; American Public Health Association: Washington, DC, USA, 2005; Volume 6. [Google Scholar]
  36. Richards, L.A. Diagnosis and Improvement of Saline and Alkali Soils; US Government Printing Office: Washington, DC, USA, 1954.
  37. Kelly, W. Permissible composition and concentration of irrigated waters. Proc. ASCF 1940, 66, 607. [Google Scholar]
  38. Doneen, L.D. Notes on Water Quality in Agriculture; Published as a Water Science and Engineering, Paper 4001; Department of Water Science and Engineering, University of California: Davis, CA, USA, 1964. [Google Scholar]
  39. Paliwal, K. Irrigation with Saline Water; Monogram No. 2 (New Series); IARI: New Delhi, India, 1972; p. 198. [Google Scholar]
  40. Rengasamy, P.; Marchuk, A. Cation ratio of soil structural stability (CROSS). Soil Res. 2011, 49, 280–285. [Google Scholar] [CrossRef]
  41. Sheikh, N.; Yeragi, S.G. Seasonal temperature changes and their influence on free carbondioxide, dissolved oxygen (DO) and pH in Tansa River of Thane District, Maharastra. Int. J. Aquat. Biol. 2003, 18, 73–75. [Google Scholar]
  42. Singh, H.; Singh, D.; Singh, S.K.; Shukla, D. Assessment of river water quality and ecological diversity through multivariate statistical techniques, and earth observation dataset of rivers Ghaghara and Gandak, India. Int. J. River Basin Manag. 2017, 15, 347–360. [Google Scholar] [CrossRef]
  43. WHO. Guidelines for Drinking-Water Quality; World Health Organization: Geneva, Switzerland, 2011; Volume 1. [Google Scholar]
  44. CBS. Environment Statistics of Nepal; Central Bureau of Statistics: Kathmandu, Nepal, 2019. [Google Scholar]
  45. Das, B.K.; Kaur, P. Major ion chemistry of Renuka Lake and weathering processes, Sirmaur District, Himachal Pradesh, India. Environ. Geol. 2001, 40, 908–917. [Google Scholar] [CrossRef]
  46. Patel, P.; Raju, N.J.; Reddy, B.S.R.; Suresh, U.; Gossel, W.; Wycisk, P. Geochemical processes and multivariate statistical analysis for the assessment of groundwater quality in the Swarnamukhi River basin, Andhra Pradesh, India. Environ. Earth Sci. 2016, 75, 611. [Google Scholar] [CrossRef]
  47. Shah, K.A.; Joshi, G.S. Evaluation of Water Quality Index for River Sabarmati, Gujrat, India. Appl. Water Sci. 2017, 7, 1349–1358. [Google Scholar] [CrossRef]
  48. McGowan, W. Water Processing: Residential, Commercial, Light-Industrial, 3rd ed.; Water Quality Association: Lisle, IL, USA, 2000. [Google Scholar]
  49. Nagaraju, A.; Suresh, S.; Killham, K.; Hudson-Edwards, K. Hydrogeochemistry of waters of mangampeta barite mining area, Cuddapah Basin, Andhra Pradesh, India. Turk. J. Eng. Environ. Sci. 2006, 30, 203–219. [Google Scholar]
  50. Sharma, R.C.; Kumar, R. Water quality of sacred glacial Lake Satopanth of Garhwal Himalaya, India. Appl. Water Sci. 2017, 7, 4757–4764. [Google Scholar] [CrossRef]
  51. Dinka, M.O.; Loiskandl, W.; Ndambuki, J.M. Hydrochemical characterization of various surface water and groundwater resources available in Matahara areas, Fantalle Woreda of Oromiya region. J. Hydrol. Reg. Stud. 2015, 3, 444–456. [Google Scholar] [CrossRef]
  52. Naveen, K.S.H.; Nair, B. Assessment of lake water quality in Gudiyattam region using multivariate statistical techniques. J. Environ. Treat. Tech. 2022, 10, 92–102. [Google Scholar]
  53. Meybeck, M. Atmospheric inputs and river transport of dissolved substances. In Proceedings of the Hamburg Symposium, Hamburg, Germany, 19 August 1983; IAHS: Hamburg, Germany, 1983; pp. 173–192. [Google Scholar]
  54. Das, B.D. Assessment of surface water quality of Chimdi Lake of Sunsari District, Nepal. Int. J. Nat. Resour. Ecol. Manag. 2017, 2, 20–23. [Google Scholar] [CrossRef]
  55. Srinivasamoorthy, K.; Gopinath, M.; Chidambaram, S.; Vasanthavigar, M.; Sarma, V. Hydrochemical characterization and quality appraisal of groundwater from Pungar sub basin, Tamilnadu, India. J. King Saud Univ.-Sci. 2014, 26, 37–52. [Google Scholar] [CrossRef]
  56. Bhat, N.A.; Jeelani, G.; Bhat, M.Y. Hydrogeochemical assessment of groundwater in karst environments, Bringi watershed, Kashmir Himalayas, India. Curr. Sci. 2014, 106, 1000–1007. [Google Scholar]
  57. Singh, R.; Kayastha, S.P.; Pandey, V.P. Water quality of Marshyangdi River, Nepal: An assessment using water quality index (WQI). J. Inst. Sci. Technol. 2021, 26, 13–21. [Google Scholar] [CrossRef]
  58. Amankwaa, G.; Yin, X.; Zhang, L.; Huang, W.; Cao, Y.; Ni, X. Hydrochemistry and multivariate statistical analysis of the quality of water from Lake Bosomtwe for agricultural and human consumption. J. Water Supply Res. Technol.—AQUA 2020, 69, 704–719. [Google Scholar] [CrossRef]
  59. Piper, A.M. A graphic procedure in geochemical interpretation of water analyses. Trans. Am. Geophys. Union 1944, 25, 914–923. [Google Scholar]
  60. Durov, S.A. Natural waters and graphic representation of their composition. Dokl. Akad. Nauk. SSSR 1948, 59, 87–90. [Google Scholar]
  61. Dangol, A.; Pant, R.R.; Chalaune, T.B.; Sharma, J.; Thapa, B.; Thapa, L.B.; Bishwakarma, K. Hydrochemical characterization of lentic and lotic environments of Ramaroshan area, Sudurpaschim Province, Nepal. Geogr. J. Nepal 2022, 15, 83–102. [Google Scholar] [CrossRef]
  62. Aksever, F. Hydrogeochemical Characterization and water quality assessments of springs in the Emirdag (Afyonkarahisar) basin, Turkey. Arab. J. Geosci. 2019, 12, 780. [Google Scholar] [CrossRef]
  63. Zhang, Y.; Xu, M.; Li, X.; Qi, J.; Zhang, Q.; Guo, J.; Yu, L.; Zhao, R. Hydrochemical characteristics and multivariate statistical analysis of natural water system: A case study in Kangding County, Southwestern China. Water 2018, 10, 80. [Google Scholar] [CrossRef]
  64. Brown, G.; Sharp, M.; Tranter, M. Subglacial chemical erosion: Seasonal variations in solute provenance, Haut Glacier d’Arolla, Valais, Switzerland. Ann. Glaciol. 1996, 22, 25–31. [Google Scholar] [CrossRef]
  65. Singh, V.B.; Ramanathan, A.; Mandal, A. Hydrogeochemistry of high-altitude lake: A case study of the Chandra Tal, Western Himalaya, India. Arab. J. Geosci. 2016, 9, 308. [Google Scholar] [CrossRef]
  66. Wang, H.; Zhang, Q. Research advances in identifying sulphate contamination source of water environment by using stable isotopes. Int. J. Environ. Res. Public Health 2019, 16, 1914. [Google Scholar] [CrossRef]
  67. Nimusiima, D.; Byamugisha, D.; Omara, T.; Ntambi, E. Physicochemical and microbial quality of water from the Ugandan stretch of the Kagera Transboundary River. Limnol. Rev. 2023, 23, 157–176. [Google Scholar] [CrossRef]
  68. Raut, R.; Sharma, S.; Bajracharya, R.M.; Sharma, C.M.; Gurung, S. Physico-chemical characterization of Gosainkunda Lake. Nepal J. Sci. Technol. 2012, 13, 107–114. [Google Scholar] [CrossRef]
  69. Sunar, C.B.; Khanal, L.; Pant, R.R.; Thapa, B.; Chand, B. Hydrochemistry of Kupinde Lake at the Lesser Himalaya in Karnali Province. J. Inst. Sci. Technol. 2023, 28, 57–69. [Google Scholar] [CrossRef]
  70. Hosseinifard, S.J.; Aminiyan, M.M. Hydrochemical characterisation of groundwater quality for drinking and agricultural purposes: A case study in Rafsanjan Plain, Iran. Water Qual. Expo. Health 2015, 7, 531–544. [Google Scholar] [CrossRef] [PubMed]
  71. Bishwakarma, K.; Pant, R.R.; Pal, K.B.; Ghimire, A.; Thapa, L.B.; Saud, P.; Joshi, S.; Panthi, K.P. Water quality and land use/cover changes in the Phewa Watershed, Gandaki Province, Nepal. Nepal J. Environ. Sci. 2019, 7, 31–39. [Google Scholar] [CrossRef]
  72. Wilcox, L.V. Classification and Use of Irrigation Water; US Department of Agriculture: Washington, DC, USA, 1955. [Google Scholar]
  73. Acharya, A.; Sharma, M.; Bishwakarma, K.; Dahal, P.; Kumar, S.; Chaudhari, A.; Neupane, S.; Pokhrel, B.; Pant, R. Chemical characteristics of the Karmanasha River water and its appropriateness for irrigational usage. J. Nepal Chem. Soc. 2020, 41, 94–102. [Google Scholar] [CrossRef]
  74. Giri, A.; Bharti, V.K.; Kalia, S.; Kumar, K.; Khansu, M. Hydrochemical and quality assessment of irrigation water at the trans-Himalayan high-altitude regions of Leh, Ladakh, India. Appl. Water Sci. 2022, 12, 197. [Google Scholar] [CrossRef]
Figure 1. Study area and sampling points in the seven lakes of the RLC.
Limnolrev 24 00003 g001
Figure 2. Schematic diagram of the study design.
Limnolrev 24 00003 g002
Figure 3. Scatter plot showing variation in the physicochemical parameters of the RLC.
Limnolrev 24 00003 g003
Figure 4. Hydrochemical facies based on (a) a Piper diagram and (b) a Durov diagram.
Limnolrev 24 00003 g004
Figure 5. Stiff diagrams for the seven lakes of the RLC.
Limnolrev 24 00003 g005
Figure 6. Gibbs plot showing the major processes controlling the surface water chemistry in the RLC (a) TDS versus Na+/(Na+ + Ca2+) (b) TDS versus Cl/(Cl + HCO3).
Limnolrev 24 00003 g006
Figure 7. Mixing diagram of the Na-normalized molar ratios of (a) Ca2+ versus HCO3 and (b) Ca2+ versus Mg2+ in the RLC.
Limnolrev 24 00003 g007
Figure 8. Scatter diagram of (a) Ca2+ + Mg2+ versus total cations (Tz+); (b) Na+ + K+ versus total cations (Tz+); (c) Ca2+ + Mg2+ versus HCO3 + SO42−; and (d) HCO3 versus HCO3 + SO42−.
Limnolrev 24 00003 g008
Figure 9. Principal component analysis of the hydrochemistry of the RLC.
Limnolrev 24 00003 g009
Figure 10. Cluster analysis of water samples based on the major ions at the sampling sites in the RLC. Red and pink colors indicate the cluster 1 and cluster 2, respectively.
Limnolrev 24 00003 g010
Figure 11. Wilcox diagram showing the irrigation suitability of water in the lakes of the RLC.
Limnolrev 24 00003 g011
Table 1. Morphometric features of the seven lakes studied in the RLC [30].
LakesGeographic CoordinatesAltitude (m asl)Core Area (ha)Mean Depth (m)Water Volume
(Peak Period, m3)
LatitudeLongitude
Tallodhaune29.2290° N 81.4571° E22990.553204.4
Mathilodhaune29.2304° N81.4610° E23161.633.6NA
Batula29.2293° N81.4663° E24063.282999
Jingale29.2320° N81.4684° E241021.51211,070.5
Gagra29.2463° N81.4622° E2470NANANA
Lamadaha29.2376° N81.4815° E25221.167945
Daudhe29.2466° N81.4921° E2852NANANA
Table 2. Descriptive statistics of the physicochemical parameters of the surface water of the lakes in the RLC.
ParametersUnitMinMaxMeanSDWHONWQGAC
pH 7.609.28.760.406.5–8.56.5–9
ECµS/cm59.00116.00100.0315.421500.00-
TDSmg/L35.0060.0052.397.161000.001000
Temperature°C16.2021.3018.881.43-
TurbidityNTU0.294.151.250.975.00-
DOmg/L7.30980.4655–9
CO2mg/L2.206.603.531.316.0<12
Clmg/L2.848.524.411.43250.00-
HCO3mg/L40.0075.0061.589.45600.0020–100
THmg/L36.0072.0044.427.91150.0020–100
CaHmg/L22.0044.0030.055.59--
MgHmg/L4.0030.0014.375.65--
Ca2+mg/L8.8017.6012.022.24100.00-
Mg2+mg/L0.987.323.511.3850.00-
Na+mg/L4.307.505.890.89200.00-
K+mg/L0.803.501.670.78100.00-
NO3mg/L0.022.360.440.4550.00<300
PO43−mg/L0.120.260.160.041<0.6
NH4mg/L0.070.240.130.040.5 -
SO42−mg/L0.180.720.480.14250.00-
Fe3+mg/L0.240.270.250.010.3<10
Table 3. Spatial variations in the physicochemical parameters of the RLC.
ParameterUnitsTallodhaune
Lake
Mathilodhaune
Lake
Batula
Lake
Jingale
Lake
Gagra
Lake
Lamadaha
Lake
Daudhe
Lake
pH 8.478.648.388.819.108.859.13
ECµS/cm111.00113.80102.60105.4077.0098.0060.67
TDSmg/L57.0059.2052.4055.3341.0050.7535.33
THmg/L42.6740.8044.8048.0040.6741.0042.00
CaHmg/L29.3332.8032.0031.6024.0026.5026.00
MgHmg/L13.338.0012.8016.4016.6714.5016.00
DOmg/L7.777.648.368.238.377.838.83
Ca2+mg/L11.7313.1212.8012.649.6010.6010.40
Mg2+mg/L3.251.953.124.004.073.543.90
K+mg/L3.032.882.121.191.171.181.03
Na+mg/L7.276.766.465.395.636.104.67
NH4+mg/L0.110.100.090.150.110.130.15
Clmg/L7.105.113.984.173.314.623.31
Fe3+mg/L0.250.250.250.250.250.260.24
NO3mg/L0.280.410.460.530.160.480.33
SO42−mg/L0.370.360.290.400.480.590.64
HCO3mg/L56.6754.0062.0065.3361.6763.7556.67
PO43−mg/L0.170.140.130.150.170.170.20
Table 4. Ionic ratios of the hydrochemical attributes of the RLC.
LakesCa2+/Mg2+(Ca2+ + Mg2+)/Tz+(Na+ + K+)/Tz+(Ca2+ + Mg2+)/(Na+ + K+)(Ca2+ + Mg2+)/(HCO3+ SO42−)C Ratio = (HCO3)/(HCO3 + SO42−)
Tallo Dhaune2.310.670.312.150.910.99
Mathilo Dhaune4.250.680.312.200.990.99
Batula2.880.710.272.660.990.99
Jingale2.440.760.223.670.990.99
Gagra1.420.730.252.940.990.99
Lamadaha1.860.720.262.790.990.99
Daude1.690.770.213.630.980.98
Table 5. Summary of the principal component analysis (PCA).
ParametersRotated Component Matrix (Components)
12345
TDS0.689−0.1030.2980.2360.380
Cl0.720−0.0250.0660.315−0.255
HCO3−0.1940.1580.1150.2350.789
CaH0.126−0.0420.9620.0540.108
MgH−0.1490.9610.0300.0450.061
Ca2+ 0.126−0.0420.9620.0540.108
Mg2+−0.1490.9610.0300.0450.061
K+0.831−0.2850.029−0.282−0.029
Na+0.812−0.140−0.076−0.2970.022
NO30.1340.0440.0950.8470.131
PO43−−0.0320.421−0.2270.319−0.374
NH4+−0.2800.0970.0620.794−0.055
SO42−−0.4800.036−0.1370.378−0.615
Fe3+−0.2890.3670.4930.0540.054
Eigenvalue3.8322.7571.6861.5341.049
Variance27.36919.69512.04010.9587.493
Cumulative variance27.36947.06459.10470.06277.555
Table 7. Summary of irrigation parameters for the lakes of the RLC.
ECNa%SARMHKRPICROSS
Tallodhaune111.0040.712.6521.560.4966.413.43
Mathiolodhaune113.8039.062.4612.960.4564.813.14
Batula102.6035.272.3119.890.4164.412.85
Jingale105.4028.771.8923.640.3462.142.24
Gagra77.0033.242.1629.830.4169.712.57
Lamadaha98.0034.222.3225.670.4470.032.71
Daude60.6728.541.7527.430.3364.512.08
Disclaimer/Publisher’s Note: The statements, opinions and data contained in all publications are solely those of the individual author(s) and contributor(s) and not of MDPI and/or the editor(s). MDPI and/or the editor(s) disclaim responsibility for any injury to people or property resulting from any ideas, methods, instructions or products referred to in the content.

