Article

Physicochemical and Microbial Quality of Water from the Ugandan Stretch of the Kagera Transboundary River

1
Department of Chemistry, Faculty of Science, Mbarara University of Science and Technology, Mbarara P.O. Box 1410, Uganda
2
Department of Chemistry and Biochemistry, School of Sciences and Aerospace Studies, Moi University, Eldoret P.O. Box 3900, Kenya
3
Department of Chemistry, College of Natural Sciences (CoNAS), Makerere University, Kampala P.O. Box 7062, Uganda
*
Author to whom correspondence should be addressed.
Current Address: Institute of Chemistry of Renewable Resources, Department of Chemistry, University of Natural Resources and Life Sciences, Vienna (BOKU), Konrad-Lorenz-Straße 24, A-3430 Tulln an der Donau, Austria.
Limnol. Rev. 2023, 23(3), 157-176; https://doi.org/10.3390/limnolrev23030010
Submission received: 4 September 2023 / Revised: 16 October 2023 / Accepted: 2 November 2023 / Published: 3 November 2023

Abstract

:
Increasing global pollution of water resources undermines the efforts invested in the realisation of Sustainable Development Goals. In developing countries, for example, water pollution is exacerbated by poor regulatory structures and improper waste disposal. This study, for the first time, investigated the physicochemical and microbial parameters of surface water from the Ugandan stretch of the Kagera transboundary river. Surface water (n = 135) from downstream, midstream and upstream of the river was sampled between February 2021 and June 2021, and analysed following standard methods for the examination of water and wastewater. Further, the samples were analysed using flame atomic absorption spectroscopy for the presence of heavy metals: nickel, lead, chromium, cadmium and copper. The obtained results showed that turbidity (24.77 ± 5.5–43.99 ± 6.87 mg/L), colour (118 ± 8.90–145.2 ± 30.58 Pt-co units), Escherichia coli (4.96 ± 7.01 CFU/100 mL), lead (23.0 ± 11.0–43.0 ± 12.0 µg/L) and cadmium (3.3 ± 1.0–10.1 ± 10.0 µg/L) were at levels that surpassed their permissible limits as per World Health Organization guidelines for potable water. These results are lower than previously reported for the Rwandese stretch of this river, but still present potential health risks to the population whose livelihoods depend on the river. Measures should therefore be instituted by the East African Community member states to mitigate riverine pollution and ensure sustainable use of the Kagera transboundary river.

1. Introduction

The centrality of water to life and the realisation of sustainable development cannot be underexamined [1,2]. Thus, access to clean and safe drinking water is now listed as a human right [3], because sustainable development is envisaged to be a balance among social and economic development as well as environmental protection [4]. As such, the recognition of water as a fuel for economic growth led to its prioritisation into Sustainable Development Goal 6 (i.e., clean water and sanitation for all) [5,6]. However, the issue of water security and scarcity has remained in the global spotlight, despite water being an otherwise ubiquitous and borderless resource on planet Earth [1,7]. Contamination of water resources by inorganic, legacy and emerging organic pollutants undermines the efforts invested in the realisation of the 2030 United Nation’s Sustainable Development Goals [6]. In developing countries, for example, water pollution has exacerbated water insecurity and scarcity by making the available water unsuitable for different end uses, widening the transmission window of waterborne pathogens and nutrient–climate synergised eutrophication of freshwater ecosystems [8].
According to the Sustainable Development Goal 6 Synthesis Report on Water and Sanitation released in 2023 [9], the world is apparently “off track”. This is especially worse in the developing countries of Africa, due to possession of more than 70 transboundary (lentic) water basins and resources [9]. Examples of such African water resources include Lake Chad (shared by Chad and Nigeria), Lake Victoria (shared among Uganda, Kenya and Tanzania), Lake Tanganyika (shared by Tanzania, the Democratic Republic of the Congo, Burundi and Zambia), Lake Kivu (shared by the Democratic Republic of the Congo and Rwanda), Lake Edward (shared by the Democratic Republic of the Congo and Uganda), Lake Malawi (shared by Malawi, Mozambique and Tanzania) and the River Nile (shared by Uganda, Egypt, Ethiopia, Sudan and South Sudan) [10].
Of the lacustrine African water resources, Lake Victoria (L. Victoria) is the largest lentic freshwater resource, which doubles as the source of the longest river (the Nile River) on the continent [11]. The lake has been severely polluted, and this has quickly deteriorated its water quality, lowered fish catches and diminished its biodiversity [12]. This is mainly due to increasing anthropogenic pressure from its riparian communities, as well as unregulated pollution of its influent rivers [13].
The Kagera River (otherwise known as the Akagera River or Alexandra Nile) is one of the rivers that discharges its water into L. Victoria after draining the East African Community countries of Burundi, Rwanda, Tanzania and Uganda [14]. Whereas the pollution status and water quality of L. Victoria have been extensively investigated, there is limited information on the actual sources of contaminants, particularly regarding the contribution of the over twenty-three transboundary and lentic influent rivers such as Nzoia and Kagera [15,16]. Thus, this study considered the Kagera River, the largest of L. Victoria’s influent rivers, because it is the most remote headstream of the Nile River that flows northwards into the Mediterranean sea [14].
The objective of this study was to assess the physicochemical and microbial parameters of surface water from the Ugandan stretch of the Kagera transboundary river. The implications of the findings in comparison with the drinking water guidelines provided by the World Health Organization (WHO) are further discussed.

2. Materials and Methods
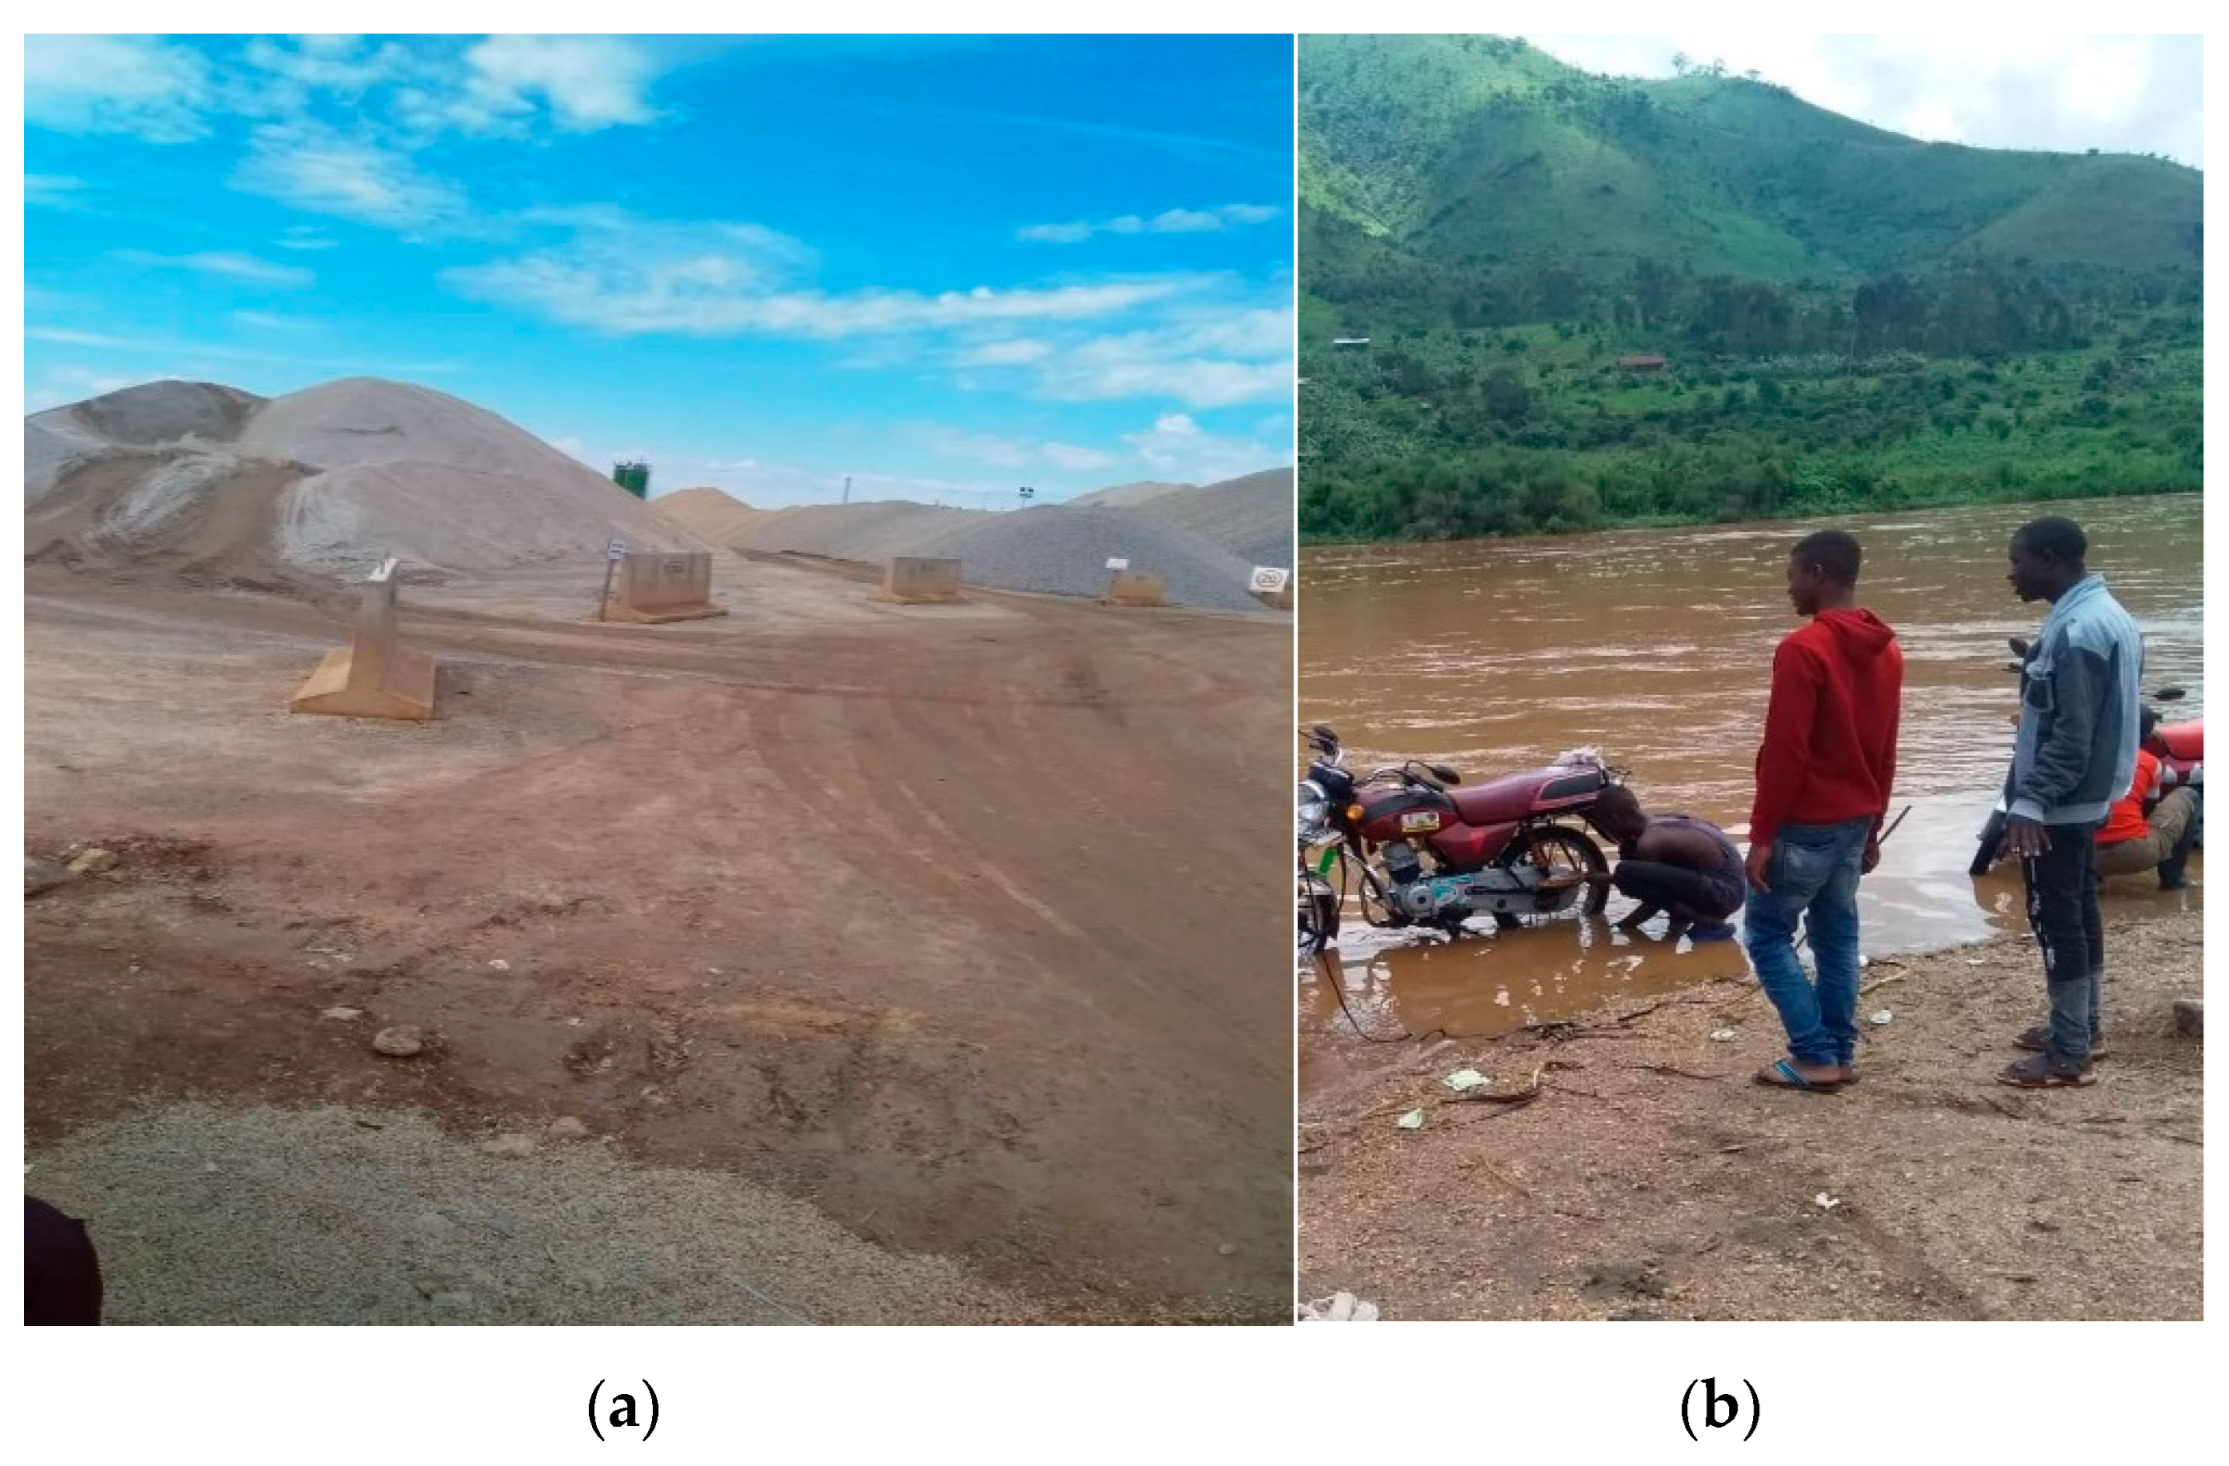
2.1. Study Area

This study was conducted on the Kagera River, focusing on its surface water for a section that flows through Kikagati, Isingiro District, Uganda (Figure 1). The Kagera River is an East African Community river which forms part of the upper headwaters of the Nile River and therefore the longest transboundary river in the region with 785 km long headstreams: Akanyaru and Nyabarongo Rivers in Rwanda and the Ruvubu River in Burundi [17,18]. The river begins its journey from the Burundian Lake Rweru and continues eastwards along the country’s borders with Rwanda and Tanzania until its confluence with the Ruvubu River; i.e., water in this river comes from the Ruvubu River of Burundi and Nyabarongo River of Rwanda, which pours into Lake Rweru and eventually into Lake Victoria [19,20,21].
The choice of Kikagati as a research area for this study was related to its strategic position for urban and population growth. In addition, the area has a 16-megawatt hydropower plant on the Kagera River (Kikagati/Murongo Hydropower Project), South Western Uganda [22] (Figure 2). This is the first cross-border Independent Power Producer project between Uganda and Tanzania, aimed at enhancing the economic development of both countries and integration of the East African Power Pool [23].
The study, therefore, considered this stretch because it has a high potential to influence water quality and human livelihoods. The study sites were selected along the river with consideration of some of the streams that feed it in the neighbourhood as well as those which experience intense human activities and could influence the river’s water quality. Some of the noticeable anthropogenic activities in the area included construction of the Kikagati/Murongo hydropower dam, washing of motorcycles and vehicles (Figure 2), brick making, agriculture, tin and gold mining, and stone quarrying (at the Nshungyenzi cave) [24].

2.2. Collection and Preparation of Samples

Water samples were collected from three different points identified by geographical coordinates as: (i) upstream (−1.06507 N 30.61074 E), about 4 km before the Kagera River enters Kikagati; (ii) midstream (site 2), the river area within the town council (−1.02230 N 30.69245 E); and (iii) downstream (site 3; −0.99581 N 30.75023 E), about 4 km from the Kikagati (Figure 1). Upstream and downstream were chosen as places with less anthropogenic activity (controls). The midstream is where the hydropower plant and other human activities are most intense. Monthly composite samples from each site, upstream, midstream and downstream, were collected in triplicate in the morning, afternoon and evening for five months (February 2021 to June 2021). A total of one hundred and thirty-five (135) water samples were collected from the three sampling sites (n = 9 samples per site per month). Each sample bottle was washed with concentrated nitric acid (5 mL), rinsed with deionised water (100 mL) and with the river water sample before the final sample was collected. The collected samples were labelled, placed in a cooler box and transported for laboratory analysis.

2.3. Measurement of Physicochemical Parameters of Water Samples

2.3.1. Temperature, Total Dissolved Solids, pH, Conductivity and Colour

The pH, temperature and total dissolved solids (TDS) were measured onsite (in situ) using a waterproof HI 98129-HI 98130 pH/TDS/temperature/conductivity meter (Hanna Instruments Inc., Woonsocket, RI, USA). The true colour of the 0.45 µm membrane-filtered water samples was determined spectrophotometrically on a Jenway 6705 UV/Vis spectrophotometer (Bibby Scientific Ltd., Staffordshire, UK) following the manufacturer’s instructions.

2.3.2. Dissolved Oxygen and Biochemical Oxygen Demand

Measured 300 mL water samples were transferred into four biological oxygen demand (BOD5) bottles. Initial dissolved oxygen (DO) concentration was determined immediately in two of the bottles using a simple DO meter (TES 1600 model), and then the remaining two bottles were incubated in a BOD5 incubator at room temperature for five days and the oxygen concentration was determined in triplicate. A blank sample of deionised water was also prepared following the same procedure. The BOD5 was calculated using Equation (1) as per APHA [25].
BOD 5   = D 1 D 2 P
where Dl = initial dissolved oxygen value after preparation, D2 = dissolved oxygen value after five days of incubation and P is the dilution factor.

2.3.3. Total Alkalinity and Hardness

The double indicator method was used for total alkalinity determination [25]. For hardness, ethylenediaminetetraacetic acid (EDTA) titration was used to determine total, calcium and magnesium hardness [25]. Briefly, 2 mL of ammonia buffer solution (16.9 g, NH4Cl and 143 mL, NH4OH) was added to water samples (25 mL) and the resultant solutions were titrated in triplicate against 0.01 M EDTA solution using Eriochrome black T. The end point of titration was indicated by a sharp colour change from wine red to blue. Total hardness as calcium carbonate (mg/L) was calculated using Equation (2).
Total   hardness   ( mg / L ) = V × M × 100,000 v
where V = volume of EDTA used, M = molarity of EDTA and v = volume of sample used.
For magnesium, the titration was performed using pH 10 borax buffer. Eriochrome black T indicator (two drops) was added and the mixture was heated for 5 min. The resultant solution was then titrated against a standard solution of 0.01 M EDTA until a permanent blue colour was obtained and the amount of EDTA required to reach the end point was recorded. The titre values were used to compute the concentration of magnesium in the water samples using Equation (3). Calcium hardness was taken as the value obtained from subtraction of magnesium hardness from total hardness [26].
Magnesium   hardness   ( as   MgCO 3 ) ,   mg / L = V × M × 24305 v
where S = volume of water sample used.

2.3.4. Chlorides

Chloride content was determined by titrating 50 mL of the sample with 0.0141 M silver nitrate solution in the presence of 5% potassium chromate indicator. The end point of the titration was indicated by the appearance of a reddish-brown colour of silver chromate [25]. A blank sample using deionised water was also prepared and treated the same way. The concentration of chlorides was established using Equation (4).
Chlorides   ( mg / L ) = A B × M × 35,450 S
where A = volume of titrant used, S = volume of sample used, B = volume of titrant used for the blank and M = molality of the silver nitrate solution.

2.3.5. Total Phosphorous

Total phosphorous content was determined by digesting the sample more rigorously with a mixture of concentrated sulphuric acid and nitric acid following the vanadomolybdophosphoric acid method [25]. To 100 mL of the sample in a conical flask, nitric and sulphuric acids (2 M, 2 mL each), ammonium molybdate (0.052 M, 5 mL) and ascorbic acid (0.15 M, 2 mL) were added. The absorbance of the blue-coloured solution was measured at 650 nm on a UV/Vis spectrophotometer using deionised water to prepare the blank. Concentrations were determined from a calibration curve of a standard potassium hydrogen phosphate solution [25].

2.3.6. Nitrates

To 25 mL of the water samples, sulphuric acid (0.5%, 2 mL), hydrochloric acid (2 M, 2 mL), methyl anthranilate (0.5%, 2 mL) and sodium hydroxide (2 M, 2 mL) were added and mixed for 10 min until an azo red dye was formed. Thereafter, it was poured into a cuvette and its absorbance read on a spectrophotometer at 540 nm. The blank sample consisting of deionised water was treated the same way. The nitrate concentration in mg/L was obtained from a calibration curve obtained using lead nitrate solution of different concentrations and absorbance [25].

2.3.7. Sulphates

The sulphate in the water sample was determined following the turbidity method detailed elsewhere [27]. A water sample (25 mL) was measured and added to an Erlenmeyer flask. A conditioning reagent (50 mL of glycerol, 30 mL of 2 M of concentrated hydrochloric acid, 100 mL of 95% ethanol and 75 g of sodium chloride) was added. These were mixed for 3 min, and after 10 min, the absorbance was determined on a spectrophotometer at 420 nm with distilled water as a blank. Sulphate concentration in mg/L was obtained from the calibration curve of sodium sulphate concentration (10 to 50 mg/L) plotted against absorbance [25].

2.4. Heavy Metal Analysis

Water samples were filtered through Whatman filter papers (0.45 μm) to remove suspended solids. They were then digested with a mixture of nitric and hydrochloric acids (1:3) as per the method. After that, the concentration of heavy metals, lead (Pb), cadmium (Cd), chromium (Cr), copper (Cu) and nickel (Ni), were quantified using a flame atomic absorption spectrophotometer (model 240AA; Agilent Technologies, Santa Clara, CA, USA) at the respective wavelengths (Ni = 232 nm, Pb = 283.3 nm, Cr = 357.9 nm, Cd = 228.8 nm and Cu = 324.8 nm). The actual heavy metal concentrations were determined from calibration curves constructed from diluted working standards of 1000 ppm stock solutions of nitrate and chloride salts of the metals.

2.5. Microbial Quality of the Water Samples

Bacteriological analysis of the samples for Escherichia coli (E. coli) used the multiple-tube fermentation test (most probable number) according to APHA [25]. Briefly, water samples (10 mL) in labelled lactose broth tubes were carefully mixed and thereafter incubated anaerobically at 35 °C for 24 h. All the tubes were examined for the production of acids (observance of a yellow colour) and gas after 24 h of incubation. Production of acid and gas (appearance of a bubble large enough to fill the concavity at the top of the tubes) after 24 h of incubation indicated a positive presumptive test for E. coli-form bacteria [25]. The most probable number (MPN) index was determined by comparing the pattern of positive results (the number of tubes showing growth at each dilution) with statistical tables.

2.6. Analytical Quality Assurance and Quality Control

All reagents used in this investigation were of high analytical purity. All experiments were performed in triplicate. For heavy metal analyses, linearity of the calibration curves was checked, and these were within acceptable limits (R2 > 0.995 in all cases). Further, the quality of instrumental results was guaranteed through analysis of procedural blanks and spiked samples, whose recoveries (range: 97.9% to 101.5%) were analytically considered acceptable. Relative standard deviations of the experiments (analytical precision) ranged between 3.7% and 4.9%.

2.7. Statistical Analysis of Results

Microsoft Excel 2019 (Microsoft Corporation, USA) and SPSS (version 26, IBM Inc., Chicago, IL, USA) were used to analyse data. Mean variance and standard deviation were used to assess the spread of the data. One-way analysis of variance (ANOVA) was used to test significance in parameters across the sampling sites, and Pearson correlation coefficient (r) was calculated to test for the association of water parameters among sampling sites. Then, mean values of the measured parameters for the water samples were compared with WHO guidelines for drinking water [28]. Differences in the mean values were considered significant if the calculated p-values were <0.05, not <0.01.

3. Results and Discussion

3.1. Spatial Variations in the Physicochemical and Microbiological Quality of Surface Water from the Kagera River

The parameters of water sampled from the different sluices along the Kagera River are summarised in Table 1.

3.1.1. pH

The hydrogen potential (pH) of a solution is a measure of its acidity or alkalinity. In this study, the pH was 5.00–6.22 upstream, 5.10–6.53 midstream and 5.02–6.44 downstream. In all the three sampling sites, the mean pH values were slightly below the recommended range of 6.5 to 8.5 [28,29]. This indicated that water from the Kagera River is slightly acidic, probably due to some discharge of waste along the stream. The lower pH (5.80 ± 0.49) recorded upstream could probably be due to saturation of carbon dioxide in water due to photosynthesis of aquatic plants along the river before Kikagati town council [30]. Carbon dioxide forms a weak acid when dissolved in water. However, it affects the pH of water bodies. Besides this, the acidic pH could be due to microbiological degradation of organic waste into the Kagera River water. Statistically, the pH of the Kagera River water showed no significant differences among the three sampling sites (p > 0.05) but it was positively correlated with temperature and total alkalinity (r = 0.823 and 0.696, respectively; Table 2). The strong positive correlation of pH with temperature is due to the fact that an increase in temperature increases the dissociation and mobility of ions responsible for pH change: i.e., endothermic autoionisation of water [31,32].
In a similar case to this study, Mukisa et al. [33] reported the lowest pH value of the River Mubuku of 5.87 and attributed it to microbiological activities on waste which in turn release carbon dioxide into water, hence decreasing its pH. Studies carried out on the River Rwizi showed pH ranging from 5.9 to 6.9, and this was attributed to the hydrolysis of cations, acidic gases dissolved in water and decomposition of organic matter in the river water [34]. Lema and Mwegoha [35] and Sikuku [36] reported higher pH values of 7.75–8.82 for the Kanoni River (Tanzania) and 7.32 to 8.24 for Kenyan rivers: Hippo Point, Kisat, Mbogo, Nzoia, Nyando, Woroya and Yala. The pH values obtained in the Kagera River in this study are lower than the 7.96–8.22, 6.2–8.0, 6.6–7.5, 5.85–7.60 and 8.05–8.30 reported for water from the Nyabugogo and Nyabarongo rivers, Rwanda [37]; Mohokare River (Lesotho) [38]; and the River Aturukuku [39], River Nyamugasani [40] and River Rwimi of Uganda [33,40], but comparable to 5.60–7.40 and 5.58–6.80 for the River Nyamwamba and River Mubuku of Uganda [33,41].

3.1.2. Electrical Conductivity

The EC of water is a measure of electric current flowing through a solution of water due to ions in it. It is related to the concentrations of total dissolved solids (TDSs) or salts in a specific water body as well as the water’s temperature. This property, termed conductivity, is a useful tool to assess the purity of water, and its permissible limit lies in the range of 750–1000 µS/cm [28]. In this study, the EC ranged between 125.67 and 142.50 μS/cm (mean: 133.38 ± 7.87 μS/cm) upstream, 136.77 and 157.00 μS/cm (mean: 144.91 ± 7.42 μS/cm) midstream, and 127.22 and 148.44 μS/cm (mean: 135.11 ± 8.43 μS/cm) downstream. At all the three sluices, mean values slightly increased down the river, and this could be due to an increase of soluble ions along the stream. However, the values were within the recommended range of 10 to 1500 μS/cm within the sampling time frame [42]. There was no significant difference in the EC of Kagera River water among the three sampling sites (p > 0.05), but EC showed a strong positive correlation with total hardness (r = 0.631), lead content (r = 0.708) and dissolved oxygen (r = 0.658). This significant positive correlation of EC and total alkalinity is attributed to ions (CO32−, OH) that cause conductivity. However, EC was slightly higher midstream when compared to other sampling sites, probably due to the presence of ions coming from the discharge of waste and runoff from artisanal mining areas and the Kikagati/Murongo hydropower dam construction. An EC change affects aquatic life, and this requires an osmoregulation process to maintain water ions and active transport in their bodies.
In Nigeria, Butu et al. [43] found the EC of the River Rido to range from 79 to 146.3 µS/cm [43], which is close to the values obtained in this study. The values obtained in this study are slightly higher than 80.44, 63.15 and 12–119, 43–103 and 99.91 µS/cm for water in Ugandan rivers, Lhubiriha, Mobuku, Rwimi and Nyamwamba, but lower than 460.51, 946.08, 118.57, 81–220 and 140.82 µS/cm in the River Lubigi, River Nyamugasani, River Sio, River Rwimi and River Victoria Nile reported by Bwire et al. [44] and Busulwa and Bailey [40]. Turinayo [45] reported an EC of 108–1524 µS/cm for water from the River Musamya in Uganda. In the Nyabugogo and Nyabarongo rivers in Rwanda, an EC of 74.3–102.0 was reported [37]. In several Kenyan rivers (Hippo Point, Kisat, Mbogo, Nzoia, Nyando, Woroya and Yala), Sikuku [36] found EC to have values ranging from 0.08 µS/cm to as high as >200 µS/cm. Another investigation in Mohokare River water (Lesotho) [38] reported an EC of 2000–3800 µS/cm, which is far higher than obtained in this study. In Tanzania, very high values of EC (47.0–23,000 µS/cm) were reported in Imeta, Ngerengere-Morogoro, Mirongo and Msimbazi rivers [46]. A high EC of water samples indicates the presence of a higher content of different salts and organic and inorganic materials such as alkalis, chlorides, sulphides and carbonates. As a measure of water quality, significant changes in EC are indicators of discharges or some other source of pollution entering the river.

3.1.3. Temperature

Temperature affects the physical, chemical and microbiological processes in water bodies. It is an essential parameter used to evaluate the quality of drinking water. In addition to the aforementioned, high temperatures may alter the colour and taste of water or encourage the growth of microorganisms [47,48,49]. For this study, temperatures span from 22.27 °C to 23.59 °C with a mean value of 23.38 ± 0.53 °C upstream, 23.20 °C to 23.62 °C (mean: 23.43 ± 0.18 °C) midstream and 22.88 °C to 23.65 °C (mean: 23.41 ± 0.31 °C) downstream. Though there are no WHO permissible levels for temperature of potable water [28], cold water is more palatable than warm water [28]. For this study, temperature did not significantly differ between the sampling sites but it was strongly positively correlated with pH (r = 0.823). This may be because an increase in temperature increases solubility of salts, which causes pH variation. The high temperatures could be due to velocity of water down the stream, waste discharge and altitude of the area, among other factors. The solubility of oxygen reduces in warm water compared with cold water. Aquatic lives need a specific range of temperature to live in, and for production purposes the mean value (23.43 ± 0.18 °C) obtained from this study was fit for aquatic life [33,50].

3.1.4. Colour

Colour is a primary water quality concern for aesthetic reasons [47]. Coloured water can be interpreted as unfit to drink, even though it may be safe. Colour of water in this study ranged from 104.67 to 129 Pt-co units (mean: 118.00 ± 8.90 Pt-co units upstream; 114.44 to 194.33 Pt-co units (mean: 145 ± 30.58 Pt-co units) midstream; and 109.44 to 137.33 Pt-co units (mean: 122.51 ± 10.68 Pt-co units) downstream. Colour did not significantly differ (p > 0.05) among the sampling sites but it was positively correlated with nickel content (r = 0.684), TDS (r = 0.590), chloride content (r = 0.670), Mg2+ ions (r = 0.852) and turbidity (r = 0.690) and was negatively correlated with total hardness (r = −0.828). Nickel compounds are coloured, so this could have contributed to the strong positive colour correlation and similar increase in turbidity and colour. At all the sampling sites, the mean values of colour were above the recommended value of 15 Pt-co units [28,29]. The slight increase observed in colour values from upstream to downstream of the river stretch could be due to decomposition of organic matter, weathering of rocks and turbidity changes. Highly coloured water affects light penetration, thus affecting photosynthesis of aquatic plants which in turn affects the ecosystem.

3.1.5. Total Dissolved Solids and Turbidity

TDS is a measure of the dissolved inorganic and organic materials in water. It affects the taste of drinking water if the concentrations exceed 2000 mg/L [28,42]. In the current study, TDS ranged from 51.33 to 70.22 mg/L (mean: 61.27 ± 6.96 mg/L) upstream, 60.33 to 76.66 mg/L (mean: 69.46 ± 6.02 mg/L) midstream and 5.11 to 72.89 mg/L (mean: 62.08 ± 8.01 mg/L) downstream. Statistically, TDS did not differ significantly among sites (p > 0.05) but it was positively correlated with total hardness (r = 0.525), nitrates (r = 0.626), colour (r = 0.590) and sulphates (r = 0.620). It was also negatively correlated with nickel (r = −0.582) and total alkalinity (r = −0.519) (Table 2). Nitrates and sulphate ions are some of the examples of dissolved ions in the Kagera River water, and this brings a positive correlation with TDS. There was a slight increase in TDS along the river downstream due to waste discharge, increase in temperature in the dry season and non-point sources [50]. However, all the TDSs measured were within the recommended range of 1000 mg/L [28]. High TDS tends to reduce the aesthetic quality of water, interferes with washing operations and can be corrosive to plumbing fixtures [51]. Studies carried out on the River Mubuku and River Nyamwamba of Uganda [41] and River Jamuna, Bangladesh by Uddin et al. (2014) found very high TDS values (1937–6580, 1344.0 and 106–131 mg/L, respectively) compared to those found in this study. There was a slight increase in TDS downstream, probably due to the decay of organic matter, urban runoff and silting from the Kikagati/Murongo dam construction.
On the other hand, turbidity is due to presence of dissolved and suspended matter such as salts, clay, silt, sediments, organic and inorganic matter, plankton and other microscopic organisms in water. Turbidity in this study was from 19.76 to 32 NTU (mean: 24.77 ± 5.59 NTU) upstream, 37.11 to 47.71 NTU (mean: 43 ± 1.09 NTU) midstream and 24.53 to 36.76 NTU (mean: 31.11 ± 0.93 NTU) downstream. There were significant differences in the turbidity readings from the three sampling sites (p< 0.05). This could probably be due to discharge of waste along the Kagera River downstream. Further, turbidity was positively correlated with nickel content (r = 0.696) and E. coli counts (r = 0.654). This positive significance in turbidity was attributed to runoff from the town council, agricultural fields, discharge of untreated sewage and chemical weathering of underlying rocks beneath the river. At all the three sampling sites, the mean values of turbidity were above the recommended value of 5 NTU [28]. Significantly high turbidity values affect feeding mechanisms in aquatic life and reduce the rate of photosynthesis in aquatic plants, and this may result in destruction of the ecosystem of the Kagera River. The turbidity values obtained in this study are higher than the 5.0–6.99 and 4.00 reported in water from the River Nyamwamba and River Mubuku, Uganda [41].

3.1.6. Dissolved Oxygen and Biochemical Oxygen Demand

Dissolved oxygen values in this study were 4.33 to 5.96 mg/L (mean: 5.26 ± 0.64 mg/L) upstream, 3.28–4.58 mg/L (mean: 3.85 ± 0.47 mg/L) midstream and 3.99 to 5.08 mg/L (mean: 4.55 ± 0.48 mg/L) downstream (Table 1). The values of DO obtained in the upstream and downstream samples were within the recommended WHO range of 10–12 mg/L [28]. Dissolved oxygen differed significantly among the sampling sites (p < 0.05), and it was negatively correlated with some parameters like BOD5 (r = −0.670), total hardness (r = −0.531) and sulphates (r = −0.543). Upstream, DO was slightly high, probably due to more aquatic plant life around the area. Depletion of oxygen in a water resource could be due to aeration oxidation of discharged organic matter from urban and heavily populated areas, and this creates a negative correlation since increases in organic matter content in rivers leads to low oxygen levels.
The BOD5 results for the Kagera River were from 0.67 to 1.09 mg/L (0.95 ± 0.17 mg/L) upstream, 1.94 to 2.47 mg/L (mean: 2.10 ± 0.29 mg/L) midstream and 1.93 to 1.49 mg/L (mean: 1.74 ± 0.17 mg/L) downstream. At the three sites, mean BOD5 values were below the recommended value of <5 mg/L for drinking water. The values differed significantly among the sampling sites (p < 0.05), suggesting that there was decomposition of organic matter along the studied stretch of the Kagera River. It was positively correlated with calcium (r = 0.793), sulphates (r = 0.853) and turbidity (r = 0.635) but negatively correlated with DO (r = −0.670). Negative correlation of DO with BOD5 indicates that more oxygen is depleted by aerobic microorganisms to decompose organic matter deposited along the river [52]. Positive correlation of BOD5 with sulphates could be due to oxidation of sulphur compounds by bacteria, which in turn may increase sulphates in surface water [53].

3.1.7. Total Alkalinity

Alkalinity is the measure of water’s buffering capacity or its ability to resist changes in pH upon the addition of acids or bases. Alkalinity of natural waters is due to the presence of carbonates (CO32−), bicarbonates (HCO3) and hydroxyl ions (OH). Total alkalinity in this study was 15.1–60.22 mg/L (mean: 32.54 ± 18.86 mg/L) upstream, 17.67–69.11 mg/L (mean: 43.69 ± 23.26 mg/L) midstream and 18.68 to 51.56 mg/L (mean: 32.95 ± 15.44 mg/L) downstream. The slight increase in alkalinity could be due to dissolution of soluble ions along the river due to low pH. At the three sampling sites, the mean values obtained for total alkalinity were below the recommended value of 200 mg/L [28]. There was no significant difference in total alkalinity among the sampling sites (p > 0.05). A strong positive correlation was observed with pH (r = 0.696) but it was negatively correlated with TDS (r = −0.519). The observed positive correlation with pH could be due to the fact that the buffering capacity of the river is caused by changes in the pH of the river system [54]. Previous studies on water from the River Rwizi found total alkalinity (22 and 86 mg/L) within the permissible range as being like that of the Kagera River [34]. High values of alkalinity in drinking water lower stomach pH and cause gastrointestinal disorders, skin irritations and corrosion of piping systems [42]. Thus, water from the River Kagera should always be monitored in order to avoid such effects in future.

3.1.8. Total, Calcium and Magnesium Hardness

Water hardness is a measure of divalent cations (Ca2+ and Mg2+) present in water [55]. Water can be classified as hard or soft; water with more than 300 mg/L of hardness is generally considered to be hard, while more than 150 mg/L of hardness is noticed by most people, and water with less than 75 mg/L is considered to be soft. Water with hardness exceeding 200 mg/L is considered poor whereas that with hardness greater than 500 mg/L is unacceptable for domestic purposes [55]. Highly hard water is chemically rich in dissolved minerals, especially calcium and magnesium ions, which for aesthetic reasons may have an unpleasant taste [56].
Total hardness in this study ranged from 29.78 to 44.73 mg/L (mean: 40.32 ± 8.84 mg/L) upstream, 42.22 to 71.0 mg/L (mean: 53.25 ± 10.64 mg/L) midstream and 31.89 to 54.67 mg/L (mean: 44.23 ± 9.74 mg/L) downstream. There were no significant differences in total hardness values among the sampling sites (p > 0.05) but a strong positive correlation was observed with Mg2+ (r = 0.982), Ca2+ (r = 0.733), chlorides (r = 0.675), EC (r = 0.631) and TDS (r = 0.525) and a negative correlation was observed with DO (r = −0.531). The significant positive correlation of Ca2+, Mg2+ and total hardness is because both ions cause total hardness in water bodies and so an increase in their concentrations leads to an increase in total hardness and vice versa. Along the Kagera River stretch considered in this study, there was an increase in total hardness due to the discharge of waste, runoff from artisanal mines, and soil from the Kikagati/Murongo hydropower dam construction. All the mean values obtained from this study were below the recommended value of 200 mg/L [28] and were comparable to the 44–55 mg/L [57] and 50 and 100 mg/L [34] of CaCO3 in the River Rwizi. Higher results of total hardness were reported in drinking water from Arba Minch Town in Ethiopia, in the range between 119.20 and 135.11 mg/L for CaCO3 [50].
Both low and high values of hardness may be harmful to the human body. Low levels of hardness may activate colon carcinogens or trigger rectal cancer and cardiovascular diseases [58,59] because calcium and magnesium ions are capable of binding bile acids and fatty acids, thus affecting the creation of colon mucosa [60]. Higher hardness values may lead to the development of kidney stones and dermal diseases [61]. In addition to these health risks, hard water is a nuisance as it causes mineral buildup on fixtures (hence corrosion) and poor soap or detergent performance due to scum formation.
Mg2+ ions contribute to total hardness when they exist in water as either magnesium hydrogen carbonate or magnesium sulphate. This is supported by a strong positive correlation between total hardness and Mg2+ concentration (r = 0.982) in water samples obtained from the Kagera River. Mg2+ ions in this study ranged between 24.66 and 62.34 mg/L (mean: 34.19 ± 7.55, 43.97 ± 10.45 and 35.88 ± 8.56 mg/L for upstream, midstream and downstream samples, respectively). Excess intake of Mg2+ leads to laxative effects, kidney stones, hypertension, death and cerebral vascular mortality [42]. On the other hand, Ca2+ ions cause total hardness when present as calcium hydrogen carbonate or calcium sulphate. In this study, the concentration of Ca2+ ions spans between 5.12 and 10.89 mg/L (mean: 6.36 ± 1.17, 9.54 ± 2.17 and 8.38 ± 2.12 mg/L upstream, midstream and downstream, respectively). All the mean values obtained in this study did not surpass the recommended limit of 150 mg/L for drinking water [28]. Excess intake of Ca2+ ions (hypercalcemia) may lead to reduced absorption of minerals in the intestines, retardation in growth and reproductive failure [28].

3.1.9. Nutrients (Nitrates and Phosphorous)

Nitrates in this study ranged from 0.14 to 0.25 mg/L (mean: 0.20 ± 0.05 mg/L) upstream, 0.215 to 0.532 mg/L (mean: 0.36 ± 0.12 mg/L) midstream and 0.159 to 0.42 mg/L (mean: 0.29 ± 0.09 mg/L) downstream. Along the river, there was an increase in nitrate concentrations, probably due to runoff from agricultural fields, and all the mean values obtained from this study were below the recommended value of 45 mg/L [28]. Hence, there is no harm to the end users of Kagera River water due to low levels of nitrates obtained from the study. Statistically, there was no significant difference (p > 0.05) in the nitrate concentrations among the three sampling sites but a moderate positive correlation was noted with total hardness (r = 0.607), turbidity (r = 0.645), colour (r = 0.684), Ni2+ (r = 0.603), Mg2+ (0.642), sulphate (r = 0.625) and TDS (r = 0.626). The strong positive correlation of nitrates with Ni2+ and TDS could be a result of soluble nickel nitrate compounds and TDS as one of the dissolved particles in water from the Kagera River, respectively. Also, low levels of nitrates like those of the Kagera River were reported for water from the River Rwizi, with nitrate concentrations ranging from 0.119 to 0.577 mg/L, and this was attributed to anthropogenic activities [57].
Phosphorous is an essential nutrient for aquatic plant growth like algae, but when there is much accumulation of it in water bodies, it causes eutrophication. In the form of phosphates, phosphorous occurs naturally in rocks and other mineral deposits which are gradually released into waters as runoff from agricultural activities, laundry activities and through chemical weathering of rocks [32]. Phosphorous in this study ranged from 0.144 to 0.263 mg/L (mean: 0.205 ± 0.45 mg/L) upstream, 0.152 to 1.99 mg/L (mean: 0.53 ± 0.79 mg/L) midstream and 0.096 to 1.01 mg/L (mean: 0.30 ± 0.39 mg/L) downstream. There was an increase in the mean concentration of phosphorous downstream, which could have resulted from anthropogenic activities [62], but all values were below the recommended value of 2.2 mg/L [28]. There were no significant differences (p > 0.05) in the phosphorous concentrations, but they strongly correlated with E. coli (r = 0.862) count (Table 2). This significant positive correlation is due to fact that phosphorous (as phosphates) favours the cultivability of E. coli [63].

3.1.10. Chlorides and Sulphates Content

Chlorides quantified in this study ranged from 7.48 to 10.32 mg/L (mean: 8.79 ± 1.29 mg/L) upstream, 8.94 to 13.10 mg/L (mean: 11.19 ± 1.69 mg/L) midstream and 6.39 to 12.33 mg/L (mean: 9.47 ± 2.53 mg/L) downstream. At the three sites, there was an increase in chloride concentration downstream and all mean values obtained were below the recommended value of 250 mg/L [28]. Chloride concentration was not significantly different for the three sampling sites (p > 0.05). Chloride was strongly and positively correlated with TDS (r = 0.769), total hardness (r = 0.675), nitrates (r = 0.582), colour (r = 0.670), Mg2+ (r = 0.648) and Ca2+ (r = 0.525). The significant positive correlation of chloride with Mg2+ and total hardness could be due to soluble compounds of magnesium in the river. High concentrations of chloride ions in drinking water cause bad taste, skin irritations and burns, asthmatic attacks in children and increased risk of blood cancer [28].
Sulphate occurs naturally in mineral deposits of pyrite, magnesium sulphate, calcium and barium sulphates. Sulphate in water bodies is a result of oxidation of sulphate ores and from anthropogenic activities [64]. The levels quantified in the Kagera River span from 1.23 to 1.69 mg/L (mean: 1.41 ± 0.17 mg/L) upstream, 3.10 to 5.75 mg/L (mean: 4.41 ± 1.09 mg/L) midstream and 1.98 to 4.26 mg/L (mean: 3.31 ± 0.93 mg/L) downstream. At the three sites, there was an increase in the mean values of sulphates due to runoff from the urban centre, the mining area, agricultural land and around the Kikagati/Murongo dam construction site. However, all the mean sulphate values obtained were below the recommended value of 250 mg/L [28]. Sulphate concentration differed significantly among the sampling sites (p < 0.05) and showed positive correlation with copper (r = 0.685), turbidity (r = 0.707), nitrates (r = 0.625), chlorides (r = 0.635), BOD5 (r = 0.853), DO (r = 0.543) and TDS (r = 0.620). The significant positive correlation of sulphates with copper or chromium is a result of their soluble salts, probably dissolved in the river. Oxidation of sulphates by aerobic microorganisms could also bring positive correlation with turbidity and BOD5. A study conducted on the River Rwizi reported a concentration of sulphates ranging between 12 and 14.67 mg/L, which is slightly higher than that obtained in this study [34]. Another study in the Nyabarongo and Nyabugogo rivers, Rwanda found phosphates at concentrations of 0.270–0.86 mg/L [37], which are lower than in this study. High concentrations of sulphates in water may lead to corrosion of water pipes, dehydration from diarrhoea effects and an unpleasant taste if they are above the recommended limit of 250 mg/L [28].

3.1.11. Microbial Profile of the Samples

E. coli is a group of bacteria commonly found in the intestines of warm-blooded animals, but its detection in fresh water indicates the presence of pathogens (disease-causing organisms) [65]. The recorded E. coli counts (14.83 CFU/100 mL and 10 CFU/100 mL) were present in midstream water samples taken in February 2021 and May 2021, with a mean value of 4.96 ± 7.01 CFU/100 mL. These counts surpassed the recommended value of 0 CFU/100 mL for E. coli in drinking water [42]. This could be due to open defecation and discharge of waste including faeces from pin latrines, which are a few metres from the river banks [66]. Our previous study in the Mpanga River (Uganda) indicated that it had very high E. coli counts (0.4–30 CFU/100 mL) which were attributed to effluent discharge from the Kabundaire abattoir of the Fort Portal tourism city [65].
The E. coli counts recorded positively correlated with phosphates (r = 0.862), turbidity (r = 0.654) and colour (r = 0.605). A strong positive correlation of E. coli with phosphates was attributed to an increase in phosphate levels from farm lands by erosion, among other sources. In addition, phosphorous (phosphates) support the growth of E. coli [67]. The absence of E. coli in samples downstream and in other months of the study could probably have been due to its short life span of 5–10 days [68].
Taken together, most of the parameters exhibited the highest values in samples taken from midstream of the river. This is because this stretch of the river has the highest level of anthropogenic activity such as construction of the Kikagati/Murongo hydropower dam, washing of motorcycles and vehicles (Figure 2), brick making, agriculture, tin and gold mining, and stone quarrying [24,69,70,71,72].

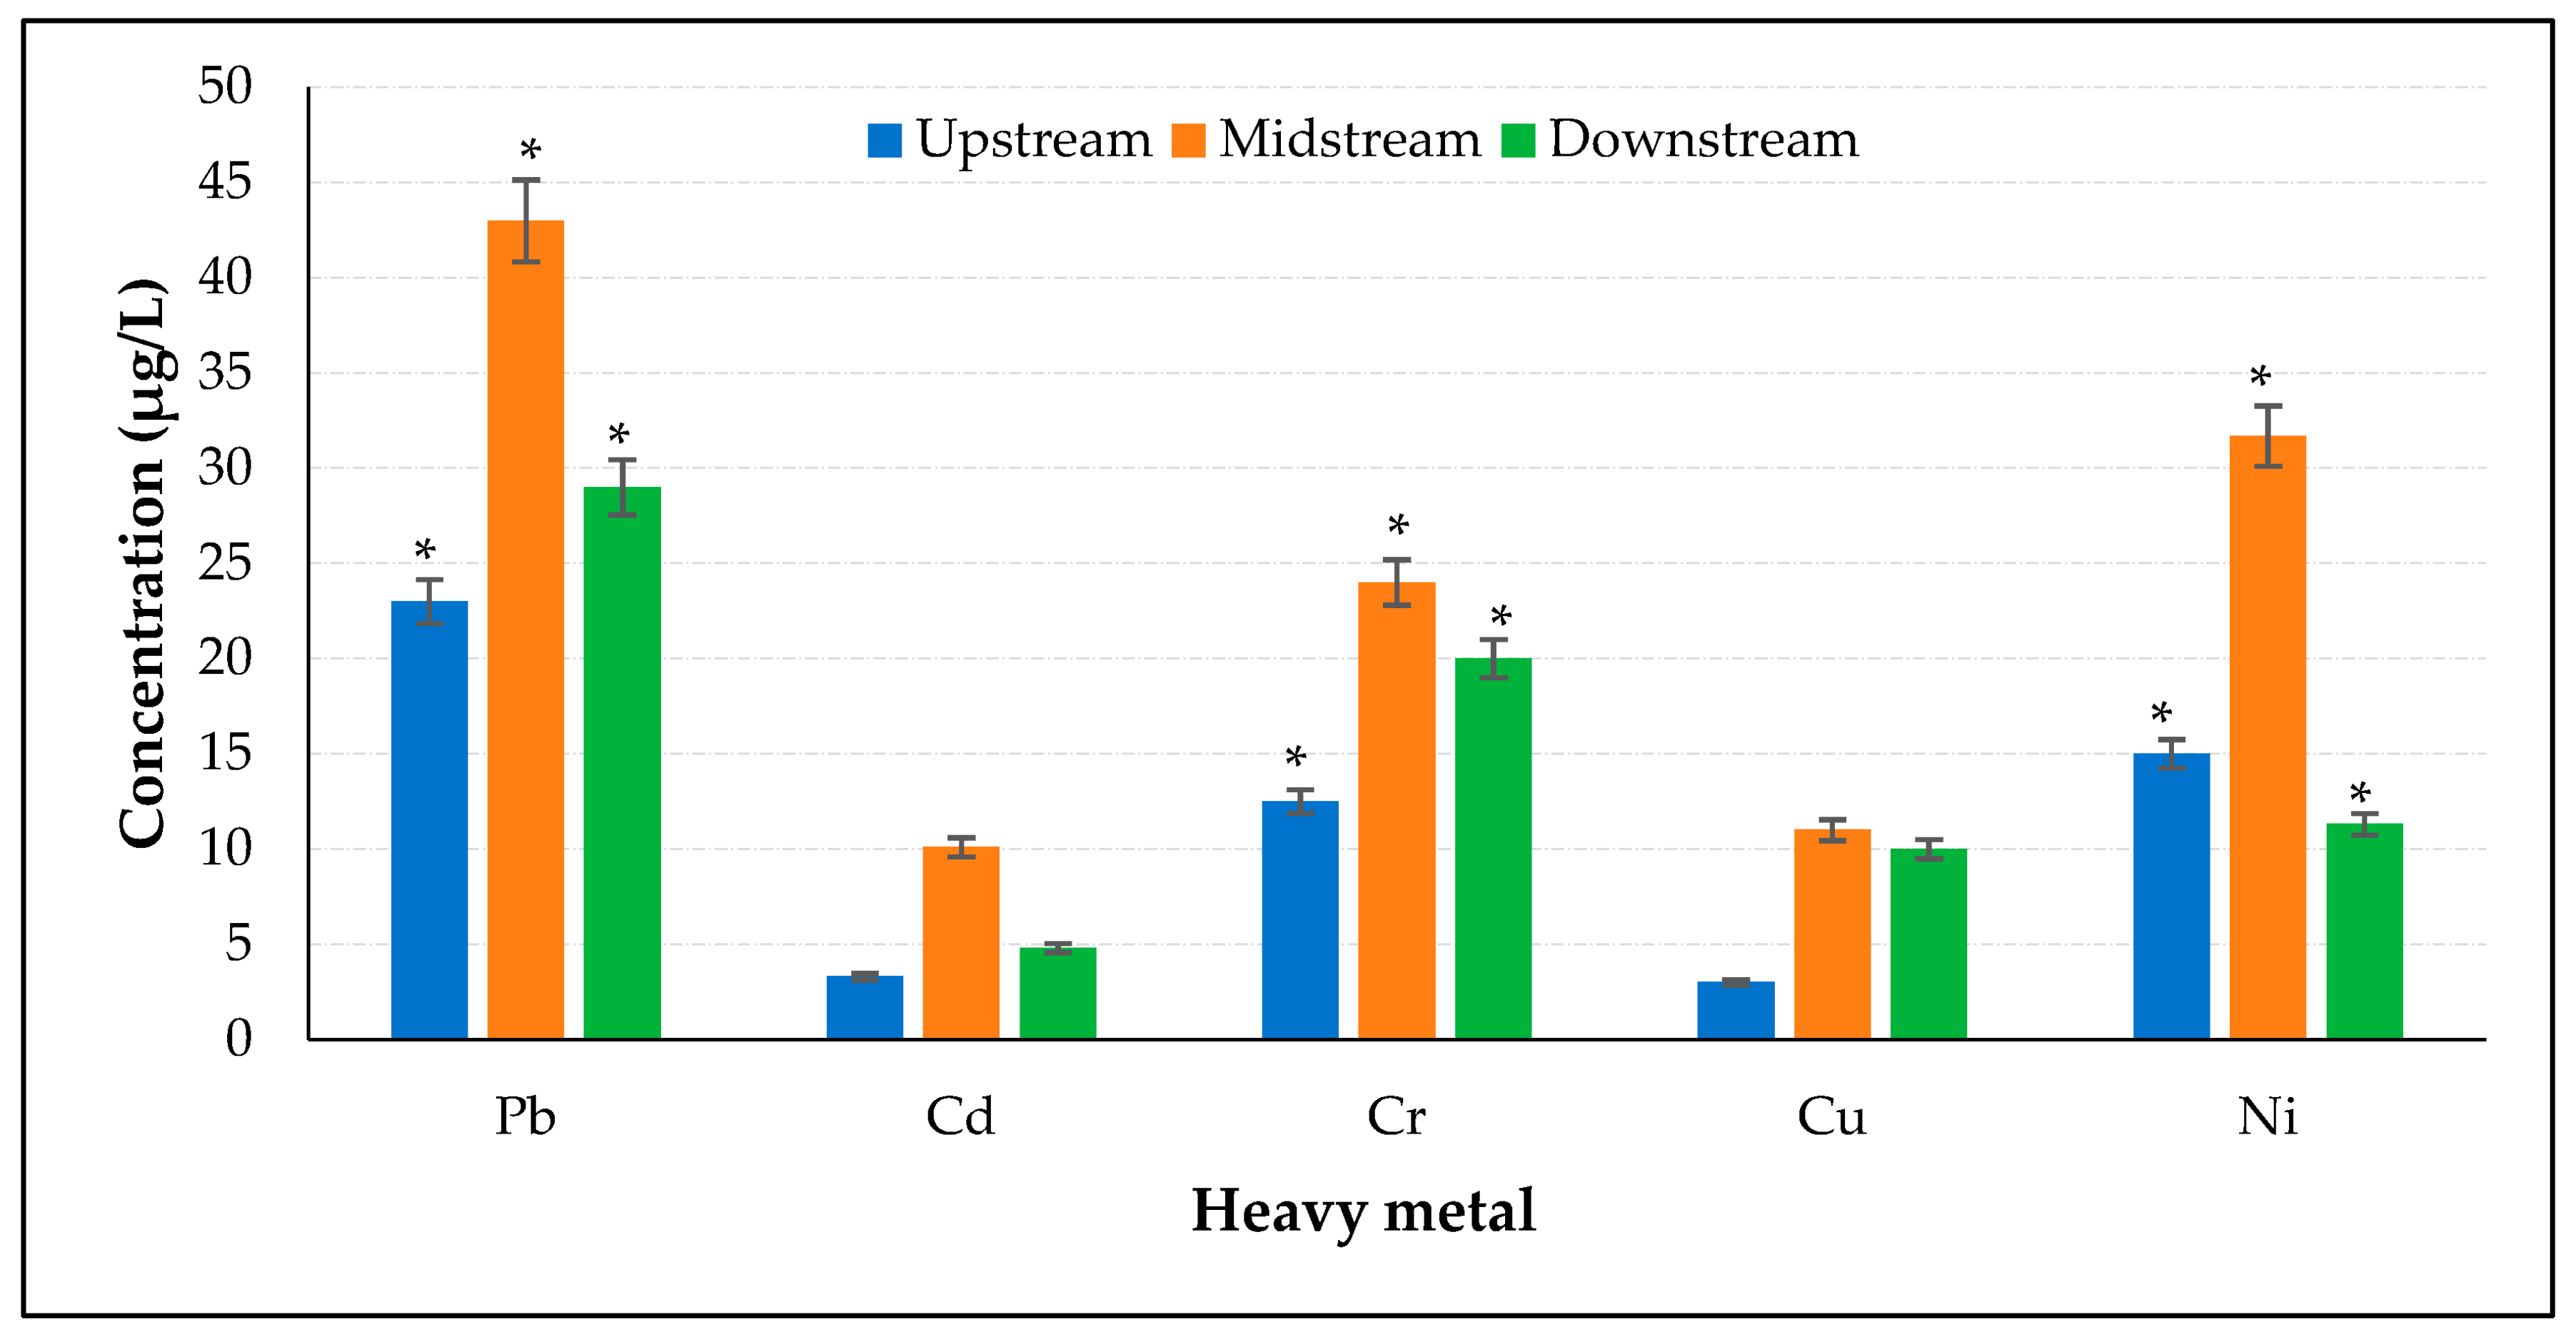
3.2. Spatial Variations in the Heavy Metal Content of the Surface Water Samples

3.2.1. Lead

Lead is a naturally occurring potentially toxic metal and a component of many metal alloys, car batteries and domestic appliances. In this study, Pb ranged from 20.0 to 30.0 µg/L (mean value: 23.0 ± 11.0 µg/L) upstream, 29.0 to 60.0 µg/L (mean: 43.0 ± 12.0 µg/L) midstream and 2.0 to 47.0 µg/L (mean: 29.0 ± 4.0 µg/L) downstream (Figure 3). Along the river, there was an increase in the mean values of Pb due to runoff from the urban centre, agricultural fields, the Kikagati/Murongo hydropower dam construction area, erosion around the tin mines and oil leakages from vehicles [73]. All the mean Pb concentration values obtained were above the provisional value of 10 µg/L [28]. There was a significant difference in Pb concentrations among the three sampling sites (p < 0.05). It also had a positive correlation with EC (r = 0.708), DO (r = 0.629) and E. coli count (r = 0.616). Of these, the positive correlation of Pb concentration with EC may be due to the presence of soluble inorganic compounds in the river water, which increases conductivity.
Higher Pb concentrations similar to those of the Kagera River have been reported in the River Rwizi, Uganda [33,57]; River Nyamwamba (Uganda); Mpazi River, Nyabarongo and Nyabugogo rivers, Rwanda [37,74]; Dzindi, Madanzhe and Mvudi rivers, South Africa [75]; and Marimba River, Zimbabwe [76] (Table 3). The occurrence of Pb in rivers at elevated levels may be due to the use of leaded gasoline and lead-based paints, as well as the dumping of used lead acid accumulators [77,78,79]. In the study area where there is tin mining, Pb is known to be associated with tin (cassiterite) in quartz-mica veins in contact with granitic bodies intruded into shales [69,70,71,72].

3.2.2. Cadmium

In this study, Cd concentration varied from 2.1 to 4.0 µg/L (mean: 3.3 ± 1.0 µg/L) upstream, 3.1 to 29 µg/L (mean: 10.1 ± 11.0 µg/L) midstream and 2.0 to 9.0 µg/L (mean: 4.8 ± 2.0 µg/L) downstream. Along the river, there was increasing Cd concentration downstream, probably due to runoff from the urban centres, disposed nickel–cadmium batteries, erosion from mines, agricultural farms, Kikagati/Murongo hydropower dam construction in the region, or oil leakages from vehicles. There were no significant differences in the concentration of Cd among the sampling sites (p > 0.05). All the mean values were above the WHO recommended value of 3.0 µg/L [28]. In contrast, the levels of Cd we found in this study were lower than indicated in previous studies (Table 3). Exposure to Cd may result in dysregulation of calcium metabolism, hypercalciuria, stomach irritations, diarrhoea and kidney stones [91].

3.2.3. Chromium

The concentration of Cr ranged from BDL to 13.0 µg/L (mean: 12.5 ± 1.0 µg/L) upstream, 18.0 to 28.0 µg/L (mean: 24.0 ± 4.0 µg/L) midstream and BDL to 35.0 µg/L (mean: 20.0 ± 9.0 µg/L) downstream. Along the selected stretches of the river studied, there was an increase in mean values of Cr due to runoff from chromium metal waste, erosion around tin mines and metal pieces from the Kikagati/Murongo dam construction areas. All values for the concentration of Cr were below the recommended value of 50 µg/L [28]. The concentration of Cr differed significantly among the sampling sites (p < 0.05). Compared to previous studies, the levels of Cr in the Kagera River were lower than reported in some Ugandan rivers and those in other parts of the world (Table 3).

3.2.4. Copper

Copper is a naturally occurring essential nutrient but becomes a drinking-water contaminant if it appears in high concentration beyond the recommended limit of 2000 µg/L [28]. In the present study, Cu ranged from BDL to 3.0 µg/L upstream, BDL to 180 µg/L midstream and BDL to 150 µg/L downstream. Along the river stretch from upstream, there was an increase in the mean values of Cu, probably due to runoff from urban centres, erosion around tin mines and metal pieces from the Kikagati/Murongo dam construction region. However, there was no significant difference of Cu concentrations among the sampling sites (p > 0.05) and these were well below the recommended levels of Cu by the WHO [28]. On the other hand, there were strong positive corrections between Cu and sulphates (r = 0.685) as well as nitrates (r = 0.543) (Table 2). These significant positive correlations could attest to the existence of soluble salts of Cu as sulphates or nitrates in the Kagera River.
Studies conducted on rivers on the African continent and elsewhere have reported Cu at concentrations that are comparable to this study (Table 3). High-level intake of Cu could cause yellowing of the skin, low blood pressure, vomiting, Cu poisoning as well as neurological disorders [92,93].

3.2.5. Nickel

Nickel concentrations ranged from 6.3 to 21.0 µg/L (mean: 150 ± 5.0 µg/L) upstream, 190 to 640 µg/L (mean: 31.7 ± 10.0 µg/L) midstream and 4.5 to 19.0 µg/L (mean: 0.0113 ± 0.005 mg/L) downstream. All these concentrations were below the recommended value of 0.04 mg/L for Ni suggested by the WHO [28]. The concentration of Ni differed significantly among the sampling sites (p < 0.05), and it was strongly correlated with nitrates (r = 0.603), colour (r = 0.787) and turbidity (r = 0.696), as shown in Table 2. This strong correlation of nickel with colour and turbidity is attributed to the fact that most nickel compounds are coloured (greyish to blue, violet, or even black, depending on the salt concentration).
Food is the main source of Ni exposure in a non-smoking and non-occupationally exposed population. In water, the main source of Ni is from weathering, dissolution and atmospheric evaporation of nickel-rich rocks and soils [94]. The results obtained in our study were comparable to the Bolong and Rongna rivers (China) [85] and Tisa River (Romania) [89] but lower than reported in the River Nyamwamba (Uganda) [81], Marimba River (Zimbabwe) [76] and Turag River (Bangladesh) [87].

4. Conclusions

This study, for the first time, investigated the physicochemical and microbial parameters of surface water from the Ugandan stretch of the Kagera transboundary river. We found that some of the physiochemical and microbial parameters of the water samples (turbidity, colour, E. coli count, Pb and Cd) were at levels that surpassed their permissible limits as per WHO guidelines for drinking water but are lower than previously reported on the Rwandese stretch of this river. These results suggests that there are potential public health risks that could arise from both direct intake and dermal contact with water from this stretch of the Kagera River. We recommend that measures should be instituted by the East African Community member states to mitigate the pollution of this transboundary water resource as well as strive for its sustainable use for regional development.

Author Contributions

Conceptualisation, D.N., D.B. and E.N.; methodology, D.N., D.B., T.O. and E.N.; software, D.N. and T.O.; validation, T.O. and E.N.; formal analysis, T.O.; investigation, D.N.; resources, D.N.; data curation, D.N. and T.O.; writing—original draft preparation, D.N. and T.O.; writing—review and editing, D.N., D.B. and E.N.; visualisation, T.O.; supervision, D.B. and E.N. All authors have read and agreed to the published version of the manuscript.

Funding

This research received no external funding.

Data Availability Statement

Data supporting the conclusions of this study are available on request from the authors.

Conflicts of Interest

The authors declare no conflict of interest.

References

  1. Mugagga, F.; Nabaasa, B.B. The centrality of water resources to the realization of Sustainable Development Goals (SDG). A review of potentials and constraints on the African continent. Int. Soil Water Conserv. Res. 2016, 4, 215–223. [Google Scholar]
  2. International Science Council. UN 2023 Water Conference: ISC Policy Brief. 2023. Available online: https://council.science/wp-content/uploads/2020/06/ISC-Water-Policy-Brief.pdf (accessed on 16 October 2023).
  3. Fantini, E. An introduction to the human right to water: Law, politics, and beyond. WIREs Water 2020, 7, e1405. [Google Scholar] [CrossRef]
  4. Ogryzek, M. The Sustainable Development Paradigm. Geomat. Environ. Eng. 2023, 17, 5–18. [Google Scholar] [CrossRef]
  5. Boretti, A.; Rosa, L. Reassessing the projections of the World Water Development Report. npj Clean Water 2019, 2, 15. [Google Scholar] [CrossRef]
  6. Li, J.; Yang, J.; Liu, M.; Ma, Z.; Fang, W.; Bi, J. Quality matters: Pollution exacerbates water scarcity and sectoral output risks in China. Water Res. 2022, 224, 119059. [Google Scholar] [CrossRef]
  7. Marcal, J.; Antizar-Ladislao, B.; Hofman, J. Addressing Water Security: An Overview. Sustainability 2021, 13, 13702. [Google Scholar] [CrossRef]
  8. Lürling, M.; Mucci, M. Mitigating eutrophication nuisance: In-lake measures are becoming inevitable in eutrophic waters in the Netherlands. Hydrobiologia 2020, 847, 4447–4467. [Google Scholar] [CrossRef]
  9. UN Water. Blueprint for Acceleration: Sustainable Development Goal 6 Synthesis Report on Water and Sanitation 2023. Available online: https://www.unwater.org/sites/default/files/2023-08/UN-Water_SDG6_SynthesisReport_2023.pdf (accessed on 16 October 2023).
  10. IUCN. Navigating Transboundary Waters in Eastern and Southern Africa. 2023. Available online: https://www.iucn.org/story/202306/navigating-transboundary-waters-eastern-and-southern-africa (accessed on 16 October 2023).
  11. Springuel, I.; Ali, O. The River Nile basin. In The World’s Largest Wetlands: Ecology and Conservation; Fraser, L., Keddy, P., Eds.; Cambridge University Press: Cambridge, UK, 2005; pp. 347–392. [Google Scholar]
  12. Semyalo, R. Deterioration of Lake Victoria: The Price of Inaction. 2021. Available online: https://ideas4development.org/en/lake-victoria-ecosystem/ (accessed on 16 October 2023).
  13. Okechi, J.K.; Peoples, N.; Nyamweya, C.S.; Glaser, S.; Kaufman, L. The ecological health of Lake Victoria (Kenya) in the face of growing cage aquaculture. Conserv. Sci. Pract. 2022, 4, e12826. [Google Scholar] [CrossRef]
  14. Bosnjakovic, B. UN/ECE Strategies for Protecting the Environment with Respect to International Watercourses. The Helsinki and Espoo Conventions. 2001, pp. 47–50. Available online: https://unece.org/DAM/env/water/cwc/legal/UNECEstrategies_bosnjakovic.pdf (accessed on 16 October 2023).
  15. Nshimiyimana, F.; Nhapi, I.; Wali, U.G.; Nsengimana, H.; Banadda, N.; Nansubuga, I.; Kansiime, F. Assessment of Heavy Metal Pollution in a Trans-Boundary River: The Case of the Akagera River. Int. J. Math. Comput. 2010, 9, 10. [Google Scholar]
  16. Wali, U.G.; Nhapi, I.; Ngombwa, A.; Banadda, N.; Nsengimana, H.; Kimwaga, R.J.; Nansubuga, I. Modelling of Nonpoint Source Pollution in Akagera Transboundary River in Rwanda. Open Environ. Eng. J. 2011, 4, 124–132. [Google Scholar] [CrossRef]
  17. Munyaneza, O.; Ndayisaba, C.; Wali, U.G.; Mulungu, D.M.M.; Dulo, S.O. Integrated Flood and Drought Management for Sustainable Development in the Kagera River Basin. Nile Basin Water Sci. Eng. J. 2011, 4, 60–70. [Google Scholar]
  18. Stanley, H.M. Through the Dark Continent; G. Newnes: London, UK, 1899; 566p. [Google Scholar]
  19. Nteziyaremye, P.; Omara, T. Bioaccumulation of priority trace metals in edible muscles of West African lungfish (Protopterus annectens Owen, 1839) from Nyabarongo River, Rwanda. Cogent Environ. Sci. 2020, 6, 1779557. [Google Scholar] [CrossRef]
  20. Demhardt, I.J. German contributions to the cartography of South West and East Africa from Mid-19th Century to World War I. In Proceedings of the 21st International Cartographic Conference (ICC), Durban, South Africa, 10–16 August 2003; Available online: https://icaci.org/files/documents/ICC_proceedings/ICC2003/Papers/110.pdf (accessed on 15 October 2023).
  21. Mbabazi, J.; Kwetegyeka, J.; Ntale, M.; Wasswa, J. Ineffectiveness of Nakivubo wetland in filtering out heavy metals from untreated Kampala urban effluent prior to discharge into Lake Victoria, Uganda. Afr. J. Agric. Res. 2010, 5, 3431–3439. [Google Scholar]
  22. Bungane, B. Uganda: $270m Approved for Kikagati Hydropower Plant. 2019. Available online: https://www.esi-africa.com/industry-sectors/generation/uganda-27m-approved-for-kikagati-hydropower-plant/ (accessed on 17 May 2023).
  23. FMO. Kikagati Power Company Ltd. 2017. Available online: https://www.fmo.nl/project-detail/52073 (accessed on 14 October 2023).
  24. Kushaba, A. Isingiro Historical Cave in RuinsIsingiro Historical Cave in Ruins. Available online: https://ugandaradionetwork.net/story/isingiro-historical-cave-in-ruins-?districtId=545 (accessed on 28 September 2023).
  25. APHA. Standard Methods for the Examination of Water and Waste Water, 22nd ed.; American Public Health Association: Washington, DC, USA; American Water Works Association: Denver, CO, USA; Water Environment Federation: Alexandria, VA, USA, 2012. [Google Scholar]
  26. Kanadhia, K.C.; Ramavataram, D.V.; Nilakhe, S.P.; Patel, S. A study of water hardness and the prevalence of hypomagnesaemia and hypocalcaemia in healthy subjects of Surat district (Gujarat). Magnes. Res. 2014, 27, 165–174. [Google Scholar] [CrossRef]
  27. Thangiah, A.S. Spectrophotometric determination of sulphate and nitrate in drinking water at Asia-Pacific International University Campus, Muak Lek, Thailand. Rasayan J. Chem. 2019, 12, 1503–1508. [Google Scholar] [CrossRef]
  28. WHO. Guidelines for Drinking-Water Quality, 4th ed.; Incorporating the 1st Addendum; World Health Organization: Geneva, Switzerland, 2017. [Google Scholar]
  29. UNBS. US EAS 12:2014. Potable Water—Specification. Available online: https://webstore.unbs.go.ug/store.php?src=10&preview (accessed on 17 May 2023).
  30. Hussner, A.; Mettler-Altmann, T.; Weber, A.P.M.; Sand-Jensen, K. Acclimation of photosynthesis to supersaturated CO2 in aquatic plant bicarbonate users. Freshw. Biol. 2016, 61, 1720–1732. [Google Scholar] [CrossRef]
  31. Yartsev, A. Neutrality and the Influence of Temperature and Pressure on pH. 2015. Available online: https://derangedphysiology.com/main/cicm-primary-exam/required-reading/acid-base-physiology/Chapter%20114/neutrality-and-influence-temperature-and-pressure-ph (accessed on 17 May 2023).
  32. Matta, G. A study on physico-chemical Characteristics to assess the pollution status of river Ganga in Uttarakhand. J. Health Pop. Nutr. 2014, 7, 210–217. [Google Scholar]
  33. Mukisa, W.; Yatuha, J.; Andama, M.; Aventino, K. Heavy metal pollution in the main rivers of Rwenzori region, Kasese district South-western Uganda. Octa J. Environ. Res. 2020, 8, 078–090. [Google Scholar]
  34. Walter, O.; Wasswa, J.; Nakiguli, C.K.; Ntambi, E. Spatial Variation in Physicochemical Surface Water Quality in River Rwizi, Western Uganda. J. Water Res. Protect. 2019, 4, 1427–1440. [Google Scholar] [CrossRef]
  35. Lema, M.W.J.; Mwegoha, W.J.S. Assessment of surface water quality near municipal Solid Waste dumping facility in Bukoba, Kagera Region, Tanzania. Environ. Qual. Manag. 2023, 32, 293–300. [Google Scholar] [CrossRef]
  36. Sikuku, M. Association of Heavy Metal Tolerance with Multiple Antibiotic Resistance in Bacteria Isolated from Wetlands of Lake Victoria Basin Kenya. Master’sThesis, Kenyatta University, Nairobi, Kenya, 2010. [Google Scholar]
  37. Omara, T.; Nteziyaremye, P.; Akaganyira, S.; Opio, D.W.; Karanja, L.N.; Nyangena, D.M.; Kiptui, B.J.; Ogwang, R.; Epiaka, S.M.; Jepchirchir, A.; et al. Physicochemical quality of water and health risks associated with consumption of African lung fish (Protopterus annectens) from Nyabarongo and Nyabugogo rivers, Rwanda. BMC Res. Notes 2020, 13, 66. [Google Scholar] [CrossRef]
  38. Chatanga, P.; Ntuli, V.; Mugomeri, E.; Keketsi, T.; Chikowore, N.V.T. Situational analysis of physico-chemical, biochemical and microbiological quality of water along Mohokare River, Lesotho. Egypt. J. Aquat. Res. 2019, 45, 45–51. [Google Scholar] [CrossRef]
  39. Ochieng, H.; Dong, R.O.; Okot-Okumu, J. Comparison of temperate and tropical versions of Biological Monitoring Working Party (BMWP) index for assessing water quality of River Aturukuku in Eastern Uganda. Glob. Ecol. Conserv. 2020, 23, e01183. [Google Scholar] [CrossRef]
  40. Busulwa, H.S.; Bailey, R.G. Aspects of the physico-chemical environment of the Rwenzori rivers, Uganda. Afr. J. Ecol. 2004, 42, 87–92. [Google Scholar] [CrossRef]
  41. Masereka, J.; Byamugisha, D.; Adaku, C. Physicochemical Quality and Health Risks Associated with Use of Water from Nyamwamba River, Kasese, Western Uganda. Asian J. Appl. Chem. Res. 2022, 12, 19–33. [Google Scholar] [CrossRef]
  42. WHO. Guidelines for Drinking-Water Quality, 3rd ed.; Volume 1—Recommendations Incorporating the First and Second Addenda; WHO: Geneva, Switzerland, 2008; Available online: https://www.who.int/publications/i/item/9789241547611 (accessed on 13 October 2023).
  43. Butu, A.W.; Emeribe, C.N.; Muoka, I.O.; Emeribe, O.F.; Ogbomida, E.T. Downstream Effects of Industrial Effluents Discharge on Some Physicochemical Parameters and Water Quality Index of River Rido, Kaduna State, Nigeria. Trop. Aqua. Soil Pollut. 2022, 2, 90–108. [Google Scholar] [CrossRef]
  44. Bwire, G.; Sack, D.A.; Kagirita, A.; Obala, T.; Debes, A.K.; Ram, M.; Komakech, H.; George, C.M.; Orach, C.G. The quality of drinking and domestic water from the surface water sources (lakes, rivers, irrigation canals and ponds) and springs in cholera prone communities of Uganda: An analysis of vital physicochemical parameters. BMC Public Health 2020, 20, 1128. [Google Scholar] [CrossRef]
  45. Turinayo, Y.K. Physicochemical Properties of Sugar Industry and Molasses Based Distillery Effluent and its Effect on Water Quality of River Musamya in Uganda. Int. J. Environ. Agric. Biotechnol. 2017, 2, 1064–1069. [Google Scholar] [CrossRef]
  46. Chen, S.S.; Kimirei, I.A.; Yu, C.; Shen, Q.; Gao, Q. Assessment of urban river water pollution with urbanization in East Africa. Environ. Sci. Pollut. Res. Int. 2022, 29, 40812–40825. [Google Scholar] [CrossRef]
  47. Nkurunziza, G.; Omara, T.; Nakiguli, C.K.; Mukasa, P.; Byamugisha, D.; Ntambi, E. Physicochemical Quality of Water from Chuho Springs, Kisoro District, Uganda. Fr.-Ukr. J. Chem. 2021, 09, 12–26. [Google Scholar] [CrossRef]
  48. Olajire, A.A.; Imeokparia, F.E. Water Quality Assessment of Osun River: Studies on Inorganic Nutrients. Environ. Monit. Assess. 2001, 69, 17–22. [Google Scholar] [CrossRef]
  49. Palamuleni, L.; Akoth, M. Physico-Chemical and Microbial Analysis of Selected Borehole Water in Mahikeng, South Africa. Int. J. Environ. Res. Public Health 2015, 12, 8619–8630. [Google Scholar] [CrossRef]
  50. Reda, A.H. Physico-Chemical Analysis of Drinking Water Quality of Arbaminch Town. J. Environ. Anal. Toxicol. 2016, 6, 356. [Google Scholar]
  51. Opolot, M.; Omara, T.; Adaku, C.; Ntambi, E. Spatio-temporal Variations and Potential Health Risks of Heavy Metals in Water from River Manafwa, Uganda. Lett. Appl. NanoBioSci. 2024, 13, 23. [Google Scholar]
  52. Amare, G.; Dobo, B.; Haile, E. The Effect of Wet Coffee Processing Plant Effluent on Physicochemical and Bacteriological Quality of Receiving Rivers Used by Local Community: Case of Aroresa District, Sidama, Ethiopia. Environ. Health Insights 2023, 17, 11786302231165186. [Google Scholar] [CrossRef]
  53. Bhateria, R.; Jain, D. Water quality assessment of lake water: A review. Sustain. Water Resour. Manag. 2016, 2, 161–173. [Google Scholar] [CrossRef]
  54. Saalidong, B.M.; Aram, S.A.; Otu, S.; Lartey, P.O. Examining the dynamics of the relationship between water pH and other water quality parameters in ground and surface water systems. PLoS ONE 2022, 17, e0262117. [Google Scholar] [CrossRef]
  55. Omer, N.H. Water Quality Parameters. In Water Quality—Science, Assessments and Policy; IntechOpen: London, UK, 2019. [Google Scholar] [CrossRef]
  56. Water Stewardship Information Series. 2007. Hardness in Groundwater. Available online: https://www.rdn.bc.ca/cms/wpattachments/wpID2284atID3802.pdf (accessed on 16 October 2023).
  57. Egor, M.; Mbabazi, J.; Ntale, M. Heavy metal and nutrient loading of River Rwizi by effluents from Mbarara Municipality, Western Uganda. Int. J. Chem. Mater. Res. 2014, 2, 36–47. [Google Scholar]
  58. Crawford, M.D. Hardness of drinking-water and cardiovascular disease. Proc. Nutr. Soc. 1972, 31, 347–353. [Google Scholar] [CrossRef]
  59. Bernardi, D.; Dini, F.L.; Azzarelli, A.; Giaconi, A.; Volterrani, C.; Lunardi, M. Sudden cardiac death rate in an area characterized by high incidence of coronary artery disease and low hardness of drinking water. Angiology 1995, 46, 145–149. [Google Scholar] [CrossRef]
  60. Di Vincenzo, F.; Puca, P.; Lopetuso, L.R.; Petito, V.; Masi, L.; Bartocci, B.; Murgiano, M.; De Felice, M.; Petronio, L.; Gasbarrini, A.; et al. Bile Acid-Related Regulation of Mucosal Inflammation and Intestinal Motility: From Pathogenesis to Therapeutic Application in IBD and Microscopic Colitis. Nutrients 2022, 14, 2664. [Google Scholar] [CrossRef]
  61. WHO. Hardness in Drinking-Water: Background Document for Development of WHO Guidelines for Drinking-Water Quality; World Health Organization: Geneva, Switzerland, 2010. [Google Scholar]
  62. Kabenge, M.; Wang, H.; Li, F. Urban eutrophication and its spurring conditions in the Murchison Bay of Lake Victoria. Environ. Sci. Pollut. Res. Int. 2016, 23, 234–241. [Google Scholar] [CrossRef]
  63. Marzan, L.W.; Shimizu, K. Metabolic regulation of Escherichia coli and its phoB and phoR genes knockout mutants under phosphate and nitrogen limitations as well as at acidic condition. Microb. Cell Factories 2011, 10, 39. [Google Scholar] [CrossRef] [PubMed]
  64. Ahmad, A. Effects of Wastewater Discharge on Fresh Water Quality in Dar es Salaam: A Case of Msimbazi River. Master’s Dissertation, The Open University of Tanzania, Dar es Salaam, Tanzania, 2015. [Google Scholar]
  65. Businge, F.; Kagoya, S.; Omara, T.; Angiro, C. Pollution of Mpanga River by Kabundaire Abattoir Effluents, Fort Portal Tourism City, Uganda. Asian J. Fish. Aquat. Res. 2021, 11, 34–43. [Google Scholar] [CrossRef]
  66. Angiro, C.; Abila, P.P.; Omara, T. Effects of industrial effluents on the quality of water in Namanve stream, Kampala Industrial and Business Park, Uganda. BMC Res. Notes 2020, 13, 220. [Google Scholar] [CrossRef] [PubMed]
  67. Juhna, T.; Birzniece, D.; Rubulis, J. Effect of Phosphorus on survival of Escherichia coli in drinking water biofilms. Appl. Environ. Microbiol. 2007, 73, 3755–3758. [Google Scholar] [CrossRef]
  68. WHO. E. coli . 2018. Available online: https://www.who.int/news-room/fact-sheets/detail/e-coli (accessed on 16 October 2023).
  69. Uganda Investment Authority. Mineral Sector Profile. Available online: https://www.ugandainvest.go.ug/uia/images/Download_Center/SECTOR_PROFILE/Mining_Sector_Profile.pdf (accessed on 28 September 2023).
  70. Nalubwama, B. New Road Opens Up Kikagati’s Tin to the Outside World. Available online: https://sunrise.ug/news/201909/new-road-opens-up-kikagatis-tin-to-the-outside-world.html (accessed on 28 September 2023).
  71. Turyahabwa, S.; Jurua, E.; Oriada, R.; Mugaiga, A.; Ben Enjiku, D.D. Determination of natural radioactivity levels due to mine tailings from selected mines in Southwestern Uganda. J. Environ. Earth Sci. 2016, 6, 154–163. [Google Scholar]
  72. Ahabwe, C. Gender Effect on Banana Production in Kikagati subcounty Isingiro district. Bachelor’s Thesis, Makerere University, Kampala, Uganda, 2021. [Google Scholar]
  73. Badr, A.M.; Mahana, N.A.; Eissa, A. Assessment of Heavy Metal Levels in Water and Their Toxicity in Some Tissues of Nile Tilapia (Oreochromis niloticus) in River Nile Basin at Greater Cairo, Egypt. Glob. Vet. 2014, 13, 432–443. [Google Scholar]
  74. Nhapi, I.; Wali, U.G.; Uwonkunda, B.K.; Nsengimana, H.; Banadda, N.; Kimwaga, R. Assessment of water pollution levels in the Nyabugogo catchment, Rwanda. Open Environ. Eng. J. 2011, 4, 40–53. [Google Scholar] [CrossRef]
  75. Mvungi, A.; Hranova, R.K.; Love, D. Impact of home industries on water quality in a tributary of the Marimba River, Harare: Implications for urban water management. Phys. Chem. Earth 2003, 28, 1131–1137. [Google Scholar] [CrossRef]
  76. Okonkwo, J.O.; Mothiba, M. Physico-chemical characteristics and pollution levels of heavy metals in the rivers in Thohoyandou, South Africa. J. Hydrol. 2005, 308, 122–127. [Google Scholar] [CrossRef]
  77. Omara, T.; Ogwang, R.; Ndyamuhaki, S.; Kagoya, S.; Kigenyi, E.; Musau, B.; Adupa, E. Spectroscopic analysis of selected priority trace metals in the extant East African gilled lungfish (Protopterus amphibius) in Lira municipal lagoon and its edibility health risk. Sci. J. Anal. Chem. 2018, 6, 38–45. [Google Scholar] [CrossRef]
  78. Huang, X.; Luo, D.; Zhao, D.; Li, N.; Xiao, T.; Liu, J.; Wei, L.; Liu, Y.; Liu, L.; Liu, G. Distribution, Source and Risk Assessment of Heavy Metal(oid)s in Water, Sediments, and Corbicula Fluminea of Xijiang River, China. Int. J. Environ. Res. Public Health 2019, 16, 1823. [Google Scholar] [CrossRef]
  79. Algül, F.; Beyhan, M. Concentrations and sources of heavy metals in shallow sediments in Lake Bafa, Turkey. Sci. Rep. 2020, 10, 11782. [Google Scholar] [CrossRef] [PubMed]
  80. Onen, P.; Akemkwene, R.; Nakiguli, C.K.; Nimusiima, D.; Ruma, D.H.; Khanakwa, A.V.; Angiro, C.; Bamanya, G.; Opio, B.; Gonzaga, A.; et al. Health Risks from Intake and Contact with Toxic Metal-Contaminated Water from Pager River, Uganda. J. Xenobiot. 2023, 13, 544–559. [Google Scholar] [CrossRef] [PubMed]
  81. Mwesigye, A.R.; Tumwebaze, S.B. Water contamination with heavy metals and trace elements from Kilembe copper mine and tailing sites in Western Uganda; implications for domestic water quality. Chemosphere 2017, 169, 281–287. [Google Scholar]
  82. Amadi, E.K. Nutrient loads and heavy metals assessment along Sosiani River, Kenya. Chem. Mater. Res. 2013, 3, 14–20. [Google Scholar]
  83. Kihampa, C.; Wenaty, A. Impact of mining and farming activities on water and sediment quality of the Mara river basin, Tanzania. Res. J. Chem. Sci. 2013, 3, 15–24. [Google Scholar]
  84. Afzaal, M.; Hameed, S.; Liaqat, I.; Khan, A.A.A.; Manan, H.A.; Shahid, R.; Altaf, M. Heavy metals contamination in water, sediments and fish of freshwater ecosystems in Pakistan. Water Pract. Technol. 2022, 17, 253–1272. [Google Scholar] [CrossRef]
  85. Luo, Y.; Rao, J.; Jia, Q. Heavy metal pollution and environmental risks in the water of Rongna River caused by natural AMD around Tiegelongnan copper deposit, Northern Tibet, China. PLoS ONE 2022, 17, e0266700. [Google Scholar] [CrossRef]
  86. Gupta, V.; Kumar, D.; Dwivedi, A.; Vishwakarma, U.; Malik, D.S.; Paroha, S.; Mohan, N.; Gupta, N. Heavy metal contamination in river water, sediment, groundwater and human blood, from Kanpur, Uttar Pradesh, India. Environ. Geochem. Health 2023, 45, 1807–1818. [Google Scholar] [CrossRef]
  87. Ahmed, K.S.; Rahman, A.K.M.L.; Sarkar, M.; Islam, J.B.; Jahan, I.A.; Moniruzzaman, M.; Saha, B.; Bhoumi, N.C. Assessment on the level of contamination of Turag river at Tongi area in Dhaka. Bangladesh J. Sci. Ind. Res. 2016, 51, 193–202. [Google Scholar] [CrossRef]
  88. Leventeli, Y.; Yalcin, F. Data analysis of heavy metal content in riverwater: Multivariate statistical analysis and inequality expressions. J. Inequal. Appl. 2021, 2021, 14. [Google Scholar] [CrossRef]
  89. Dippong, T.; Mihali, C.; Marian, M.; Rosca, O.M.; Resz, M.-A. Correlations between chemical, hydrological and biotic factors in rivers from the protected area of Tisa Superioară, Romania. Process Saf. Environ. Protect. 2023, 176, 40–55. [Google Scholar] [CrossRef]
  90. Mokarram, M.; Saber, A.; Sheykhi, V. Effects of heavy metal contamination on river water quality due to release of industrial effluents. J. Clean. Prod. 2020, 277, 123380. [Google Scholar] [CrossRef]
  91. Idrees, N.; Tabassum, B.; Abd Allah, E.F.; Hashem, A.; Sarah, R.; Hashim, M. Groundwater contamination with cadmium concentrations in some West U.P. Regions, India. Saudi J. Biol. Sci. 2018, 25, 1365–1368. [Google Scholar] [CrossRef]
  92. Lung, S.; Li, H.; Bondy, S.C.; Campbell, A. Low concentrations of copper in drinking water increase AP-1 binding in the brain. Toxicol. Ind. Health 2015, 13, 1178–1184. [Google Scholar] [CrossRef]
  93. Bashir, F.; Irfan, M.; Ahmad, T.; Iqbal, J.; Butt, M.T.; Sadef, Y.; Umbreen, M.; Shaikh, I.A.; Moniruzzaman, M. Efficient utilization of low cost agro materials for incorporation of copper nanoparticles to scrutinize their antibacterial properties in drinking water. Environ. Technol. Innov. 2021, 21, 101228. [Google Scholar] [CrossRef]
  94. Begum, W.; Rai, S.; Banerjee, S.; Bhattacharjee, S.; Mondal, M.H.; Bhattarai, A.; Saha, B. A comprehensive review on the sources, essentiality and toxicological profile of nickel. RSC Adv. 2022, 12, 9139–9153. [Google Scholar] [CrossRef]
Figure 1. Map of Uganda showing location of Isingiro District, Kikagati and the sampling sites on Kagera transboundary river.
Limnolrev 23 00010 g001
Figure 2. Anthropogenic activities identified along the Ugandan stretch of Kagera River. (a) Stockpile of construction materials for the Kikagati/Murongo hydropower dam, and (b) washing of motorcycles. Photos taken by Daniel Nimusiima.
Limnolrev 23 00010 g002
Figure 3. Heavy metal content (µg/L) of water from the Ugandan stretch of the Kagera transboundary river. Concentrations are means of triplicate analyses. * Statistically significant differences (p < 0.05) in the concentration of the metal among the sampled sites along Kagera River.
Limnolrev 23 00010 g003
Table 1. Physicochemical profile of water samples from Kagera River from three sampling sites for five months (February 2021 to June 2021; n = 135).
ParameterUpstreamMidstreamDownstreamWHO Guidelines [28]p-Value
pH5.80 ± 0.496.01 ± 0.546.00 ± 0.566.5–8.5 0.7876
Electrical conductivity (µS/cm)133.38 ± 7.87144.91 ± 7.42135.11 ± 8.4315000.0853
Temperature (°C)23.38 ± 0.5323.43 ±0.1823.41 ± 0.310.5822
Colour (Pt-co units)118.00 ± 8.9145.2 ± 30.58122.51 ± 10.68150.0979
Total dissolved solids (mg/L)61.27 ± 6.9669.46 ± 6.0262.08 ± 8.0110000.1714
Turbidity (NTU)24.77 ± 5.5943.99 ± 6.8731.11 ± 4.9150.0007 *
Dissolved oxygen (mg/L)5.26 ± 0.643.85 ± 0.474.55 ± 0.4840.0048 *
Biochemical oxygen demand (mg/L)0.95 ± 0.172.10 ± 0.291.74 ± 0.1750.0000 *
Alkalinity (mg/L)32.54 ± 18.8643.69 ± 23.2632.95 ± 15.442000.6008
Chlorides (mg/L)8.79 ± 1.2911.19 ± 1.699.47 ± 2.532500.1646
Total hardness (mg/L)40.32 ± 8.8453.25 ± 10.6444.23 ± 9.745000.1423
Calcium (mg/L)6.36 ± 1.179.54 ± 2.178.38 ± 2.121500.0577
Magnesium (mg/L)34.19 ± 7.5543.97 ±10. 4535.88 ± 8.562500.2221
Nitrates (mg/L)0.200 ± 0.050.36 ± 0.120.29 ± 0.09450.0658
Total phosphorous (mg/L) 0.205 ± 0.450.53 ± 0.790.30 ± 0.392.20.3800
Sulphates (mg/L)1.41 ± 0.170.41 ± 1.093.31 ± 0.932500.0004 *
Note: Results are presented as means ± standard deviation of sextuplicates. — = No established permissible levels. * Statistically significant at p < 0.05 and p < 0.01. Uganda uses the WHO guidelines for drinking water.
Table 2. Pearson correlation coefficient (r) of water quality parameters measured along the Ugandan stretch of Kagera River.
ParameterpHECTDS DO BOD5ChloridesTHMgNitrates TPColour Sulphates TurbidityE. coliPb CuNi
pH1
EC0.381
Temperature0.823 **0.087
DO0.231−0.658 **−0.2381
BOD50.2060.5060.337−0.670 **1
Alkalinity0.696 **0.412−0.519 *−0.090.349
TH−0.1690.631 *0.525 *0.531 *0.4860.675 **1
Ca0.0710.634 *0.356−0.5130.793 **0.525 *0.733 **
Mg−0.1990.555 *0.536 *−0.4720.3590.648 **0.982 **1
Nitrates−0.1870.0650.847 *−0.4350.526 *0.582 *0.607 *0.642 *1
Colour−0.1330.4660.590 *−0.5010.3340.670 **0.828 **0.852 **0.684 **0.2651
Sulphates0.1150.1730.620 *0.543 *0.853 **0.635 *0.4730.4020.625 *0.1910.4571
Turbidity00.3110.4910.561 *0.635 *0.555 *0.4320.4060.645 **0.4950.690 **0.707 **1
E. coli0.0920.613 *0.138−0.4080.3960.3130.4860.4480.2010.862 **0.605 *0.2320.654 **1
Pb−0.0920.0708 **−0.042−0.629 *0.3360.2710.3740.3410.1930.4850.420.1340.4680.616 *1
Cd−0.4280.1970.198−0.4520.2610.3760.0950.0540.3240.0370.2010.2180.3960.0360.592
Cu−0.154−0.2170.343−0.2160.524 *0.3860.0280.0210.543 *0.1680.0340.685 **0.398−0.23−0.0551
Ni0.1280.2240.582 *−0.3150.2380.3980.516 *0.581 *0.603 *0.3170.787 **0.4420.696 **0.592 *0.2850.0121
Note: * Correlation is significant at the 0.05 level (2-tailed). ** Also significant at the 0.01 level (2-tailed). TH = total hardness, TP = total phosphorous.
Table 3. Comparison of concentration (µg/L) of toxic metals in water from Kagera River with previous studies.
River (Country)PbCdCrCuNiReferences
Kagera River (Uganda)20.0–60.02.1–10.1BDL–35.0BDL–80.011.3–31.7This study
Pager River (Uganda)296–576278–524[80]
Kagera River and tributaries (Rwanda)45.0965.015.0[15]
River Nyamwamba (Uganda)400–821050–1400790–13,470210–10,740[41]
270–4001900–61,000670–12,000[81]
470740[33]
River Mubuku (Uganda)5325
River Rwimi (Uganda)6710
River Manafwa (Uganda)20–10010–203–113–601.5–9.5[51]
Nyabarongo River (Rwanda)500–750BDL–106BDL–60BDL–240[19,37]
Nyabugogo River (Rwanda)590BDL150290[37]
Sosiani River (Kenya)20–18903.0–501–275[82]
Mara River (Tanzania)10–710BDL–110BDL–310BDL–20[83]
Marimba River (Zimbabwe)213–544130–140210–330[76]
Dzindi, Madanzhe and Mvudi rivers (South Africa)10.5–20.11.6–9.32–3[75]
River Kabul (Pakistan)337–810150–380157–480368–2120[84]
Bolong River (China)0.34–0.640.11–0.541.74–3.085.42–7.3710.7–18.2[85]
Rongna River (China)0.49–2.410.12–0.641.56–6.371.89–8067.45–60.1
River Ganga (India)37–16310–5919–72532–125[86]
Turag River (Bangladesh)6.8–17.033.9–633.414.8–170.3128.2–620.7[87]
Akcay River (Turkey)BDL–0.363.63–12.44BDL–6.3410.17–90.42[88]
Tisa River (Romania)1.6–5.140.11–2.061.38–593.07–18.92.9–31[89]
Kor River (Iran)200–17,360740–55,50080–22,7101100–25,280[90]
Note: BDL = below method detection limit; – = not determined.
Disclaimer/Publisher’s Note: The statements, opinions and data contained in all publications are solely those of the individual author(s) and contributor(s) and not of MDPI and/or the editor(s). MDPI and/or the editor(s) disclaim responsibility for any injury to people or property resulting from any ideas, methods, instructions or products referred to in the content.

