
Impact of Infective Immigrants on COVID-19 Dynamics

 , , ,
, , ,  and
and 
Abstract
:1. Introduction
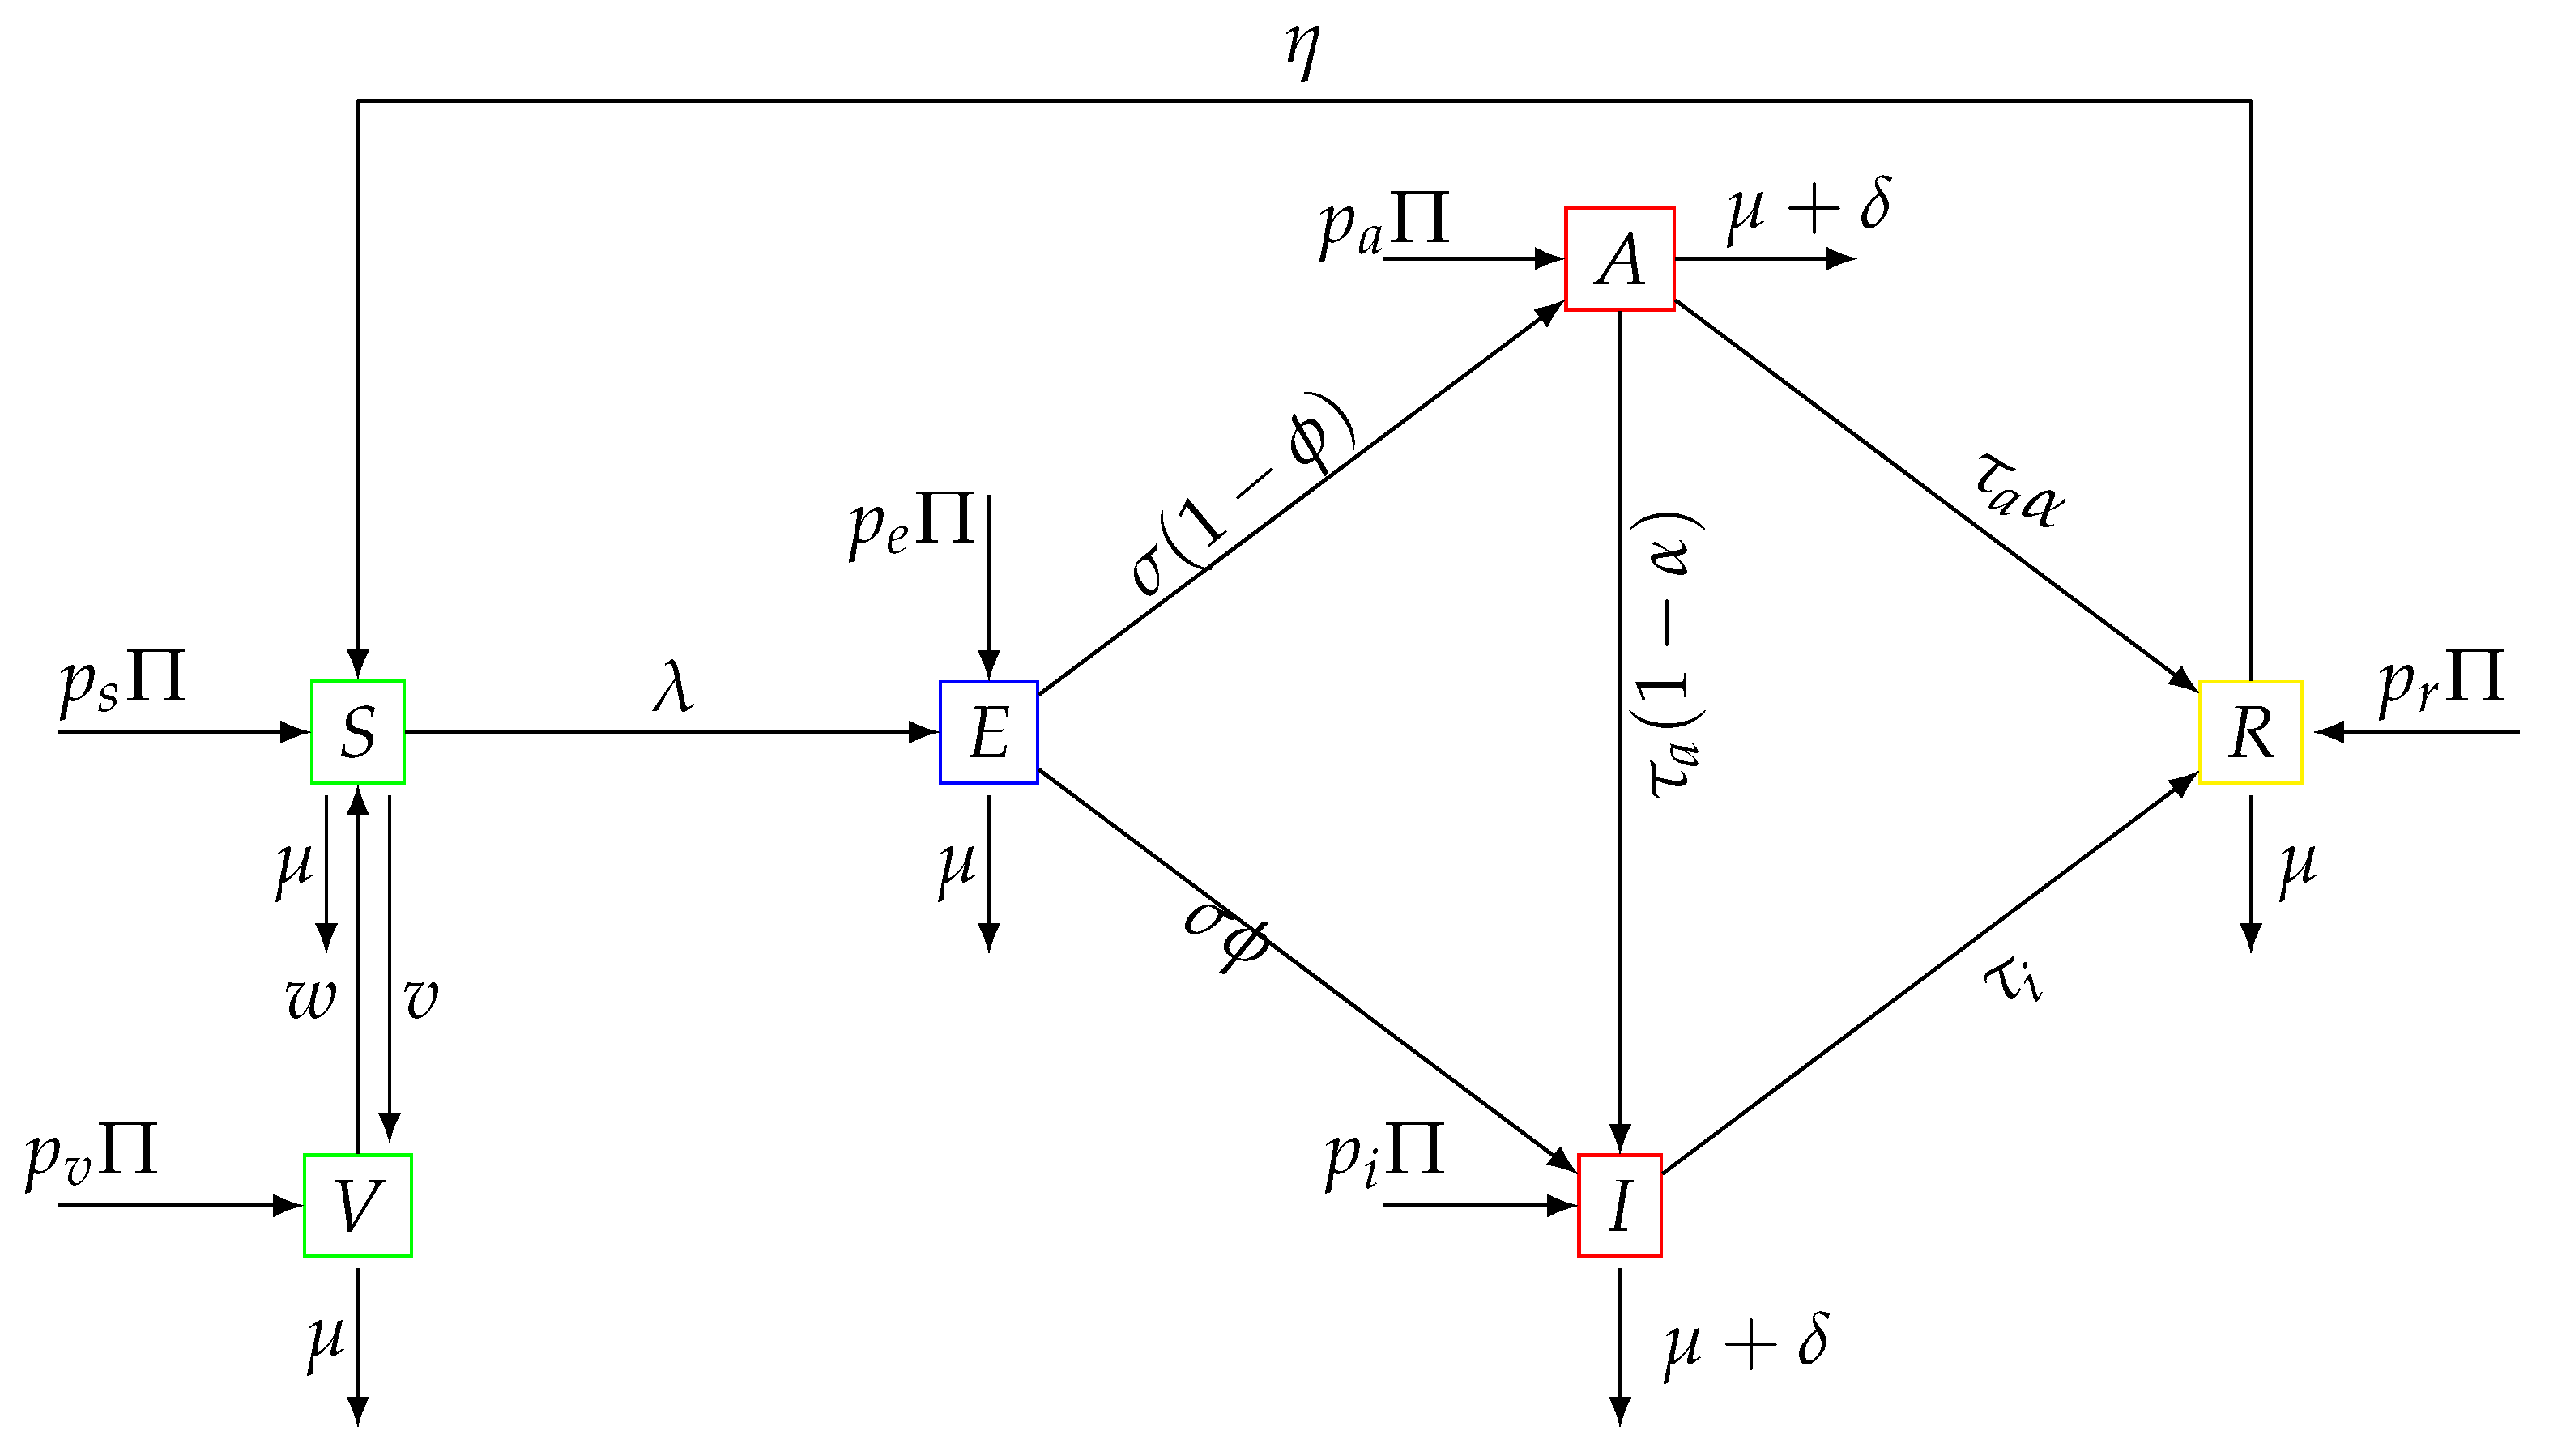
2. The Model
3. Model Analysis
4. Numerical Simulations
4.1. Base Scenarios with Lower Transmissibility of the SARS-CoV-2
4.2. Scenario with Higher Transmissibility of the SARS-CoV-2
4.3. Further Sensitivity Analysis
5. Conclusions
Author Contributions
Funding
Data Availability Statement
Acknowledgments
Conflicts of Interest
Abbreviations
| COVID-19 | Coronavirus disease of 2019 |
References
- Shattock, A.J.; Le Rutte, E.A.; Dünner, R.P.; Sen, S.; Kelly, S.L.; Chitnis, N.; Penny, M.A. Impact of vaccination and non-pharmaceutical interventions on SARS-CoV-2 dynamics in Switzerland. medRxiv 2021, 38, 100535. [Google Scholar] [CrossRef] [PubMed]
- Gatyeni, S.P.; Chirove, F.; Chukwu, C.W.; Nyabadza, F.F. Application of Optimal Control to Long Term Dynamics of COVID-19 Disease in South Africa. medRxiv 2021. [Google Scholar] [CrossRef]
- Russell, T.W.; Wu, J.T.; Clifford, S.; Edmunds, W.J.; Kucharski, A.J. Effect of internationally imported cases on internal spread of COVID-19: A mathematical modelling study. Lancet Public Health 2021, 6, e12–e20. [Google Scholar] [CrossRef]
- Ahmed, M.Y.; Sarkodie, S.A. How COVID-19 pandemic may hamper sustainable economic development. J. Public Aff. 2021, e2675. [Google Scholar] [CrossRef] [PubMed]
- Li, R.; Pei, S.; Chen, B.; Song, Y.; Zhang, T.; Yang, W.; Shaman, J. Substantial undocumented infection facilitates the rapid dissemination of novel coronavirus (SARS-CoV-2). Science 2020, 368, 489–493. [Google Scholar] [CrossRef] [PubMed] [Green Version]
- Tchoumi, S.Y.; Diagne, M.L.; Rwezaura, H.; Tchuenche, J.M. Malaria and COVID-19 co-dynamics: A mathematical model and optimal control. Appl. Math. Model. 2021, 99, 294–327. [Google Scholar] [CrossRef]
- Omame, A.; Rwezaura, H.; Diagne, M.L.; Inyama, S.C.; Tchuenche, J.M. COVID-19 and dengue co-infection in Brazil: Optimal control and cost effectiveness analysis. Eur. Phys. J. Plus 2021, 136, 1090. [Google Scholar] [CrossRef]
- Gonzalez-Parra, G.C.; Martínez-Rodríguez, D.; Villanueva-Micó, R.J. Impact of a new SARS-CoV-2 variant on the population: A mathematical modeling approach. Math. Comput. Appl. 2021, 26, 25. [Google Scholar] [CrossRef]
- Martínez-Rodríguez, D.; Gonzalez-Parra, G.C.; Villanueva-Micó, R.J. Analysis of key factors of a SARS-CoV-2 vaccination program: A mathematical modeling approach. Epidemiologia 2021, 2, 140–161. [Google Scholar] [CrossRef]
- Huang, Q.; Kang, Y.S. Mathematical modeling of COVID-19 control and prevention based on immigration population data in China: Model development and validation. JMIR Public Health Surveill. 2021, 6, e18638. [Google Scholar] [CrossRef]
- Tripathi, A.; Naresh, R.; Tchuenche, J.M.; Sharma, D. Modeling the spread Of HIV/AIDS with infective immigrants and time delay. Int. J. Nonlinear Sci. 2013, 16, 313–322. [Google Scholar]
- Almarashi, R.; McCluskey, C.C. The effect of immigration of infectives on disease-free equilibria. J. Math. Biol. 2019, 79, 1015–1028. [Google Scholar] [CrossRef] [PubMed]
- Tumwiine, J.; Mugisha, J.Y.T.; Luboobi, L.S. A host-vector model for malaria with infective immigrants. J. Math. Anal. Appl. 2010, 361, 139–149. [Google Scholar] [CrossRef] [Green Version]
- Bhadauria, A.A.; Pathak, R.; Chaudhary, M. A SIQ mathematical model on COVID-19 investigating the lockdown effect. Inf. Dis. Model. 2021, 6, 244–257. [Google Scholar] [CrossRef]
- Chen, H.; Zou, L. How to control the immigration of infectious individuals for a region? Nonl. Anal. Real World Appl. 2019, 45, 491–505. [Google Scholar] [CrossRef]
- Brauer, F.; van den Driessche, P. Models for transmission of disease with immigration of infectives. Math. Biosci. 2001, 171, 143–154. [Google Scholar] [CrossRef]
- Franceschetti, A.; Pugliese, A. Threshold behaviour of a SIR epidemic model with age structure and immigration. J. Math. Biol. 2008, 57, 1–27. [Google Scholar] [CrossRef] [Green Version]
- McCluskey, C.C. Global stability for an SEI model of infectious disease with age structure and immigration of infected. Math. Biosci. Eng. 2016, 13, 381–400. [Google Scholar] [CrossRef]
- Henshaw, S.; McCluskey, C.C. Global stability of a vaccination model with immigration. Elect. J. Diff. Equ. 2015, 92, 1–10. [Google Scholar]
- Tang, B.; Wang, X.; Li, Q.; Bragazzi, N.; Tang, S.; Xiao, Y.; Wu, J. Estimation of the transmission risk of the 2019-nCoV and its implication for public health interventions. J. Clin. Med. 2020, 9, 462. [Google Scholar] [CrossRef] [Green Version]
- Adewole, M.O.; Onifade, A.A.; Abdullah, F.A.; Kasali, F.; Ismail, A.I.M. Modeling the Dynamics of COVID-19 in Nigeria. Int. J. Appl. Comput. Math. 2021, 7, 67. [Google Scholar] [CrossRef] [PubMed]
- Babaei, A.; Jafari, H.; Banihashemi, S.; Ahmadi, M. Mathematical analysis of a stochastic model for spread of Coronavirus. Chaos Solitons Fractals 2021, 145, 110788. [Google Scholar] [CrossRef] [PubMed]
- Shakhany, M.Q.; Salimifard, K. Predicting the dynamical behavior of COVID-19 epidemic and the effect of control strategies. Chaos Solitons Fractals 2021, 146, 110823. [Google Scholar] [CrossRef] [PubMed]
- Buonomo, B. Analysis of a malaria model with mosquito host choice and bed-net control. Int. J. Biomath. 2005, 8, 1550077. [Google Scholar] [CrossRef] [Green Version]
- Agusto, F.B. Optimal isolation control strategies and cost-effectiveness analysis of a two-strain avian influenza model. Biosystems 2013, 113, 155–164. [Google Scholar] [CrossRef]
- Diagne, M.L.; Rwezaura, H.; Tchoumi, S.Y.; Tchuenche, J.M. A Mathematical Model of COVID-19 with Vaccination and Treatment. Comput. Math. Methods Med. 2021, 2021, 1250129. [Google Scholar] [CrossRef]
- Guo, H.; Li, M.Y. Impacts of migration and immigration on disease transmission dynamics in heterogeneous populations. Discret. Cont. Dyn. Syst. B 2012, 17, 2413–2430. [Google Scholar] [CrossRef]
- van den Driessche, P.; Watmough, J. Reproduction numbers and sub-threshold endemic equilibria for compartmental models of disease transmission. Math. Biosci. 2002, 180, 29–48. [Google Scholar] [CrossRef]
- Khajanchi, S.; Sovan, B.; Tapan, K.R. Mathematical analysis of the global dynamics of a HTLV-I infection model, considering the role of cytotoxic T-lymphocytes. Math. Comput. Simul. 2021, 180, 354–378. [Google Scholar] [CrossRef]
- Ganasegeran, K.; Ch’ng, A.S.H.; Looi, I. What is the estimated COVID-19 reproduction number and the proportion of the population that needs to be immunized to achieve herd immunity in Malaysia? A mathematical epidemiology synthesis. COVID 2021, 1, 13–19. [Google Scholar] [CrossRef]
- Rwezaura, H.; Tchoumi, S.Y.; Tchuenche, J.M. Impact of environmental transmission and contact rates on COVID-19 dynamics: A simulation study. Inform. Med. Unlocked 2021, 27, 100807. [Google Scholar] [CrossRef] [PubMed]
- González-Parra, G.C.; Abraham, J.A. Qualitative analysis of a mathematical model with presymptomatic individuals and two SARS-CoV-2 variants. Comput. Appl. Math. 2021, 40, 1–25. [Google Scholar] [CrossRef]
- González-Parra, G.C.; Abraham, J.A. Nonlinear dynamics of the introduction of a new SARS-CoV-2 variant with different infectiousness. Mathematics 2021, 9, 1564. [Google Scholar] [CrossRef]
- Moghadas, S.M.; Vilches, T.N.; Zhang, K.; Nourbakhsh, S.; Sah, P.; Fitzpatrick, M.C.; Galvani, A.P. Evaluation of COVID-19 vaccination strategies with a delayed second dose. PLoS Biol. 2021, 19, e3001211. [Google Scholar] [CrossRef]
- Alvarez, M.M.; Bravo-González, S.; Trujillo-de Santiago, G. Modeling vaccination strategies in an Excel spreadsheet: Increasing the rate of vaccination is more effective than increasing the vaccination coverage for containing COVID-19. PLoS ONE 2021, 16, e0254430. [Google Scholar] [CrossRef]
- Gonzalez-Parra, G. Analysis of delayed vaccination regimens: A mathematical modeling approach. Epidemiologia 2021, 2, 271–293. [Google Scholar] [CrossRef]
- Mugisha, J.Y.T.; Ssebuliba, J.; Nakakawa, J.N.; Kikawa, C.R.; Ssematimba, A. Mathematical modeling of COVID-19 transmission dynamics in Uganda: Implications of complacency and early easing of lockdown. PLoS ONE 2021, 16, e0247456. [Google Scholar] [CrossRef]
- Tchoumi, S.; Rwezaula, H.; Tchuenche, J.M. Dynamic of a Two-Strain COVID-19 Model with Vaccination. Available online: https://www.authorea.com/doi/full/10.22541/au.163500462.24575457 (accessed on 1 January 2022).


| Parameter | Description | Value | Unity | Reference |
|---|---|---|---|---|
| Recruitment rate | day | Assumed | ||
| Effective contact rate | day | Assumed | ||
| v | Vaccination rate | day | Assumed | |
| w | Vaccine waning rate | day | Assumed | |
| Exit rate from the exposed class | day | [20] | ||
| Prop. of asymptomatic who recover naturally | day | [20] | ||
| Recruitment prop. into the S, V, E, I, R and A | variable | percentage | ||
| Prop. of exposed who become infected | day | [21] | ||
| Natural recovery rate of asymptomatic | day | [21,22] | ||
| Recovery rate of symptomatic | day | [22] | ||
| Rate at which recovered ind. become suscep. | day | [23] | ||
| Reduction in transmission from asymptomatic | 1 | [21] | ||
| Natural mortality rate | day | [24,25,26] | ||
| Disease-induced death rate | day | Assumed | ||
| Variables | Description | Initial Value at | ||
| S | Susceptible | 309,974,354 | ||
| V | Vaccinated | 0 | ||
| E | Exposed | 1,788,800 | ||
| A | Asymptomatic | 1,204,000 | ||
| I | Infected | 1,204,000 | ||
| R | Recovered | 16,462,937 | ||
| N | Total population | 330,705,643 |
| Immigration | Vaccination | Infected | Asymptomatic | Deaths |
|---|---|---|---|---|
| No | No | 5.372 | 1.666 | 9.731 |
| No | Yes | 3.393 | 1.036 | 6.392 |
| Yes | No | 6.194 | 1.949 | 1.115 |
| Yes | Yes | 3.991 | 1.247 | 7.440 |
| Immigration | Vaccination | Infected | Asymptomatic | Deaths |
|---|---|---|---|---|
| No | No | 4.467 | 1.407 | 8.003 |
| No | Yes | 3.669 | 1.154 | 6.621 |
| Yes | No | 4.518 | 1.425 | 8.090 |
| Yes | Yes | 3.719 | 1.172 | 6.709 |
Publisher’s Note: MDPI stays neutral with regard to jurisdictional claims in published maps and institutional affiliations. |
© 2022 by the authors. Licensee MDPI, Basel, Switzerland. This article is an open access article distributed under the terms and conditions of the Creative Commons Attribution (CC BY) license (https://creativecommons.org/licenses/by/4.0/).
Share and Cite
Tchoumi, S.Y.; Rwezaura, H.; Diagne, M.L.; González-Parra, G.; Tchuenche, J. Impact of Infective Immigrants on COVID-19 Dynamics. Math. Comput. Appl. 2022, 27, 11. https://doi.org/10.3390/mca27010011
Tchoumi SY, Rwezaura H, Diagne ML, González-Parra G, Tchuenche J. Impact of Infective Immigrants on COVID-19 Dynamics. Mathematical and Computational Applications. 2022; 27(1):11. https://doi.org/10.3390/mca27010011
Chicago/Turabian StyleTchoumi, Stéphane Yanick, Herieth Rwezaura, Mamadou Lamine Diagne, Gilberto González-Parra, and Jean Tchuenche. 2022. "Impact of Infective Immigrants on COVID-19 Dynamics" Mathematical and Computational Applications 27, no. 1: 11. https://doi.org/10.3390/mca27010011