Article

A Validated UPLC-MS/MS Method for Rapid Quantification of Umifenovir in Plasma Samples and Its Greenness Assessment

1
Department of Pharmaceutical Chemistry, College of Pharmacy, King Saud University, Riyadh 11451, Saudi Arabia
2
Department of Pharmacology and Toxicology, College of Pharmacy, King Saud University, Riyadh 11451, Saudi Arabia
3
Department of Pharmaceutics, College of Pharmacy, King Saud University, Riyadh 11451, Saudi Arabia
4
Department of Pharmaceutics, College of Pharmacy, Prince Sattam Bin Abdulaziz University, Alkharj 11942, Saudi Arabia
*
Author to whom correspondence should be addressed.
Separations 2023, 10(7), 379; https://doi.org/10.3390/separations10070379
Submission received: 31 May 2023 / Revised: 19 June 2023 / Accepted: 23 June 2023 / Published: 27 June 2023

Abstract

:
Umifenovir is one of the most often prescribed antiviral medications for the prevention and treatment of COVID-19 and other viral infections. Herein, a UPLC-MS/MS method is developed through using ibrutinib as an internal standard (IS) for quantifying umifenovir in plasma samples. Both umifenovir and the IS were analytically separated on an Acquity BEH C18 column with a total run time of only 2.5 min. At a flow rate of 0.3 mLmin−1, acetonitrile:15 mM ammonium acetate (80:20) was employed as the mobile phase composition. Electrospray ionization in positive mode was used for ionization of the samples. Detection and quantification were performed in multiple reaction monitoring mode with parent-to-daughter ionization of 477.05 → 279.02 and 441.16 → 84.4 for umifenovir and the IS, respectively. The method was validated through following international guidelines for bioanalytical method validation, and all parameters were within the acceptable limits. Moreover, the eco-scale method using AGREE software was used for the evaluation of greenness, and results showed that the method is very environmentally friendly. The validated assay was successfully employed in the bioavailability assessment of a newly developed formulation of kneaded ternary umifenovir/β-cyclodextrin with 1% poloxamer 188 (KDB).

1. Introduction

Umifenovir is an indole-derivative antiviral molecule, initially approved for the prophylactic treatment of infections caused by influenza A and B and other respiratory viral infections [1]. Its antiviral activity has been also reported against other viruses, e.g., Ebola, Zakia, rhino virus, chikungunya, hepatitis B and C and adenovirus in various in vitro and in vivo studies [2,3,4,5]. It is effective against both enveloped and non-enveloped RNA and DNA viruses, including “severe acute respiratory syndrome coronavirus (SARS-CoV)” and “Middle East respiratory syndrome coronavirus (MERS-CoV)” [1,6]. Since SARS-CoV-2 (commonly known as COVID-19) is about 78% homologous to SARS-CoV and 58% homologous to MERS, a significant increase in research publications focusing on umifenovir has been reported after it was declared a global pandemic on 11 February 2020 [7]. Its antiviral activity against COVID-19 infection has been demonstrated in various in vitro and in vivo studies [8]. Moreover, in clinical trials, umifenovir has been found to accelerate fever recovery and virus clearance of respiratory specimens without any major side effects [9,10]. Therefore, umifenovir is recommended as a potential medication against COVID-19 in the “fifth edition of the China Guidelines for the Diagnosis and Treatment Plan of Novel Coronavirus (2019-nCoV) Infection (Trial Version 5)” issued by the National Health Commission of China [11]. Umifenovir monotherapy, or in combination with other antiviral drugs, is suggested and being used as a potential strategy for the prophylaxis/therapeutic management of COVID-19 infection [12,13]. In addition, umifenovir and its transformation products have been detected up to 1.3 mg kg−1 and 1 μg L−1 in biological sludge and municipal wastewater, respectively, which further proves the high consumption of this drug during the COVID-19 pandemic [14].
Umifenovir is hydrophobic in nature and has poor bioavailability with 40% in humans and only 18.8% in rats [15,16]. In the literature, population-based differences in the excretion of umifenovir have been observed, which highlights the need for a reliable and high-throughput method for its quantitation in biological samples. A thorough literature survey revealed a wide range of analytical procedures, e.g., HPLC-UV detection in rats [16] and human [17] plasma and LC-MS/MS based assays in human plasma samples [18,19] for the determination of umifenovir. The previously reported HPLC method in human plasma [17] exhibited poor sensitivity. Although the sensitivity was improved using the LC-MS/MS method [18,19], the extraction solvents used for sample preparation were tertiary butyl methyl ether (TBME) [17,18] and diethyl ether [19], which are not more environmentally friendly and are hazardous to nature. In one HPLC-UV method, surfactant (Triton X-114)-based sample preparation was used [17], but its sensitivity was very poor (LOQ 80 ngmL−1) and cannot be suitable for a better pharmacokinetic profile. Moreover, the runtime of all reported assays was in the range of 6–25 min, which results in the consumption of more solvent in the mobile phase and cannot be considered a rapid, high-throughput and green method. Therefore, this study was designed to develop a reliable, rapid, efficient and green analytical approach based on the UPLC-MS/MS method for quantifying umifenovir in plasma samples. The developed assay was validated and successfully used for the bioavailability enhancement study of a novel formulation of umifenovir in experimental rats.
In the last few years, the green analytical chemistry (GAC) concept has emerged as a great scientific interest with the intent of reducing or removing harmful chemicals, reducing energy consumption and minimizing waste production during analytical procedures [20,21,22,23,24]. In order to cope with this issue, numerous metric approaches, e.g., “Analytical Eco-Scale (AES), Red-Green-Blue (RGB), Green Analytical Procedures Index (GAPI), National Environmental Methods Index (NEMI) and Analytical Greenness Metric Approach (AGREE)” have been implemented for the greenness evaluation of various analytical assays [25,26,27,28,29]. Of those, NEMI, RGB, AES, and GAPI are based on a limited number of principles of GAC, whereas “AGREE”, which is a better predictor of the greenness (based on the score of covering all 12 principles of GAC), was used for the greenness assessment.

2. Materials and Methods

The working standards of umifenovir and ibrutinib (used as internal standard; IS) were obtained from “Beijing Mesochem Technology Co. Ltd. Beijing, China”. HPLC grading ethyl acetate, ethanol and acetonitrile were procured from “Fisher Scientific Limited, Leicestershire, UK”. Dimethyl sulphoxide (DMSO) and ammonium acetate (both AR grade) were from “Loba Chemie Pvt. Ltd. Mumbai, India”. All aqueous solution preparation was performed using highly pure deionized water whose source was “Milli-QR Gradient A10R, Millipore, Mosheim Cedex, France”.

2.1. Stock Solution, Calibration Standard (CS) and Quality Control (QC) Sample Preparation

The umifenovir and IS standards were accurately weighted and dissolved in ethanol and DMSO, respectively, to achieve 1 mg mL−1 stock solution. The stock solution of umifenovir was further diluted serially using acetonitrile solvent to achieve eight working CSs of 13.23–6250 ng mL−1. An appropriate amount of these working solutions was further serially spiked into blank plasma samples to achieve plasma CSs of 1.32, 3.78, 12.60, 42.0, 105, 262.5, 437.5 and 625 ng mL−1. A similar procedure was adapted in preparation of three QCs samples at 4, 110 and 550 ng mL−1 concentration; these are named the LQC, MQC and HQC samples, respectively. The IS working solution of 250 ng mL−1 was also prepared through diluting its stock solution in acetonitrile solvent. The prepared stock, working aqueous solutions were placed in a pharmaceutical refrigerator maintained at 4 ± 2 °C. The CS and QC samples, which were spiked in plasma, were placed in a deep refrigerator at 80 ± 5 °C.

2.2. UPLC-MS/MS and Chromatographic Conditions

The method development was performed on a UPLC-MS/MS system comprising of an ACQUITY triple quadrupole detector (TQD) coupled with an “ACQUITY UPLC (H-class) system” (Waters Corporation, Milford, MA, USA). Umifenovir and the IS were separated using the “ACQUITY UPLC BEH C18 column (2.1 × 100; 1.7 m)” with a mobile phase consisting of 15 mM ammonium acetate and acetonitrile in an 80:20 (v/v) ratio and pumped at 0.3 mLmin−1. Temperatures for the column oven and auto-sampler were set at 40 °C and 10 °C, respectively. The total time for one sample injection was only 2.5 min. Electrospray ionization in positive mode was employed for sample ionization, while sample detection and quantification were carried out in multiple reaction monitoring mode. Parent-to-daughter ionization of 477.05 → 279.02 and 441.16 → 84.4 were used for umifenovir and the IS, respectively. The source and desolvation temperature of the sample ionization chamber were fixed to 150 °C and 350 °C, respectively. The optimal nitrogen and argon gas flow rates for desolvation and collision, respectively, were 600 Lh−1 and 0.13 mLmin−1. The cone voltage and collision energy for umifenovir and IS were 30 V and 48 eV and 36 V and 40 eV, respectively, while the capillary voltage was tuned to 0.5 kV. MassLynks and Target-Lynks (version 4.1) software handled the sample acquisition and data processing, respectively.

2.3. Sample Preparation

A plasma sample aliquot of 150 µL was transferred to a 2 mL capacity Eppendorf tube. Then, 15 µL of IS working solution (250 ng mL−1) was spiked into each sample and mixed appropriately through vortexing. After that, 1 mL of ethyl acetate was added to each sample tube, gently vortexed and transferred to cold centrifugation at 4500× g for 10 min. After centrifugation, the top organic layer was carefully transferred to a 1.5 mL Eppendorf tube and placed in a sample concentrator for drying. The leftover residue of the dried sample was reconstituted using neat acetonitrile and 5 µL was injected into the UPLC-MS/MS apparatus for analysis.

2.4. Method Validation

The validation process allows the verification of whether a method is suitable to be used for routine quantitative analysis of the target analyte. The developed assay was validated following “USFDA Guideline for Bioanalytical Method Validation” [30] through evaluating parameters including sensitivity, selectivity, precision, recovery, accuracy, matrix effects, recovery and stability.

2.4.1. Selectivity and Sensitivity

The method selectivity was evaluated to rule out interference from endogenous substances in matrices. It was performed through comparing the analytical signal response of blank plasma with plasma samples spiked at a lower limit of quantification (LLOQ) concentration level. The proposed sample extraction process was used to prepare and analyze six samples of blank plasma (obtained from several animals) and LLOQ spiked plasma. The method can be considered selective if the response of blank plasma samples is ≤20% of the LLOQ samples. The LLOQ (sensitivity), which implies the lowest concentration of analytes in rat plasma, was measured through determining the signal-to-noise (S/N) ratio and its accuracy and precision. For assay acceptance, the S/N should be ≥10, and the deviation from accuracy and precision should be ≤20%.

2.4.2. Assay Linearity and Sensitivity

The linearity of the developed assay was determined via plotting the calibration curve (CC) of eight different CS samples (1.32–625 ng mL−1) in plasma. After UPLC-MS/MS analysis, three consecutive CCs were plotted using the area ratio of analyte/IS versus the nominal concentration of umifenovir.
The CCs were expressed as
y = ax + b,
where y = mean of the peak area ratios of the analyte/IS, a = slope, b = y-intercept and x = analyte concentration.
The best fitting of the CCs was determined using weighing factor optimization of 1/x, 1/x2 and none. The back-calculated concentration for at least 75% of CSs should be within a ±15% deviation of the nominal concentration to accept the analytical run except for LLOQ (±20%). Moreover, the correlation coefficient (r2) needs to be ≥995 for linear curve acceptance.

2.4.3. Accuracy and Precision

The precision and accuracy of the developed assay were determined via evaluation of LLOQ (1.32 ng mL−1) and all three QC levels (4.0, 110 and 550 ng mL−1) in five replicate concentrations for each validation batch. Precision was determined through measuring relative standard deviation (RSD, %), whereas the accuracy was determined via the percent deviation in the concentration as compared to a nominal value. While the inter-day accuracy and precision were determined through analyzing samples on three distinct days, the intra-day precision and accuracy were determined through analyzing samples on the same day. For this assay to be accepted, the precision and accuracy findings must be within the bounds of ≤15% and ±15%, respectively, for each of the three QC concentrations (excluding LLOQ, which falls within the limits of ≤20% and ±20%, respectively).

2.4.4. Extraction Recovery (ER) and Matrix Effects (ME)

The percentage of ER (% ER) and the percentage of ME (%ME) of the developed method were determined at 4.0 (LOQ), 110 (MQC) and 550 ng mL−1 (HQC) concentration levels through spiking five replicates into blank plasma samples. The % ER was determined through comparing the peak response of QC samples analyzed via spiking the analyte and IS in blank samples before extraction (pre-extraction) with the response of QC samples spiked after extraction (post-extraction). The % ME, which represents the ion suppression/ion enhancement effects of endogenous and coeluting substances in a matrix, was determined using the pre-column (quantitative method) infusion method. It was evaluated through comparing the mean peak response of the analyte and IS spiked in a blank plasma sample after extraction with the response of the analyte and IS spiked in aqueous samples. For developed method acceptance, the %ME the of the proposed method should be within ±15%.

2.4.5. Stability and Dilution Integrity

The stability of the analyte (umifenovir) in plasma samples was determined at LQC and HQC concentration in order to ensure the reliability of the proposed method in different storage conditions. It was determined in five replicates at different anticipated storage conditions (short-term, freeze–thaw, autosampler and long-term). In short-term stability studies, the QC samples was analyzed by means of keeping them at benchtop in the laboratory for 8 h at ambient temperature before sample preparation. To assess its freeze–thaw stability, the sample underwent three cycles of freezing at −80 °C and thawing at room temperature before processing. The stability of processed samples in the auto-sampler was ascertained through storing the prepared sample in the instrument auto-sampler for 24 h at 10 °C before analysis. The long-term stability was assessed via placing the spiked plasma sample in a deep freezer for three months at − 80 °C prior to analysis. To assure stability, all QC samples were evaluated against CC plots which were obtained through freshly spiking the CS concentration; the results should be limited to within ±15% of the nominal values.
A dilution integrity study was performed to ensure the integrity of those samples which need to be diluted before analysis. For this, the highest CS sample was diluted 2 and 4 times with blank plasma. The samples diluted with plasma were analysed, and their result should be within ±15% of the result of actual concentration for acceptance of the method’s integrity.

3. Results and Discussion

3.1. Method Development

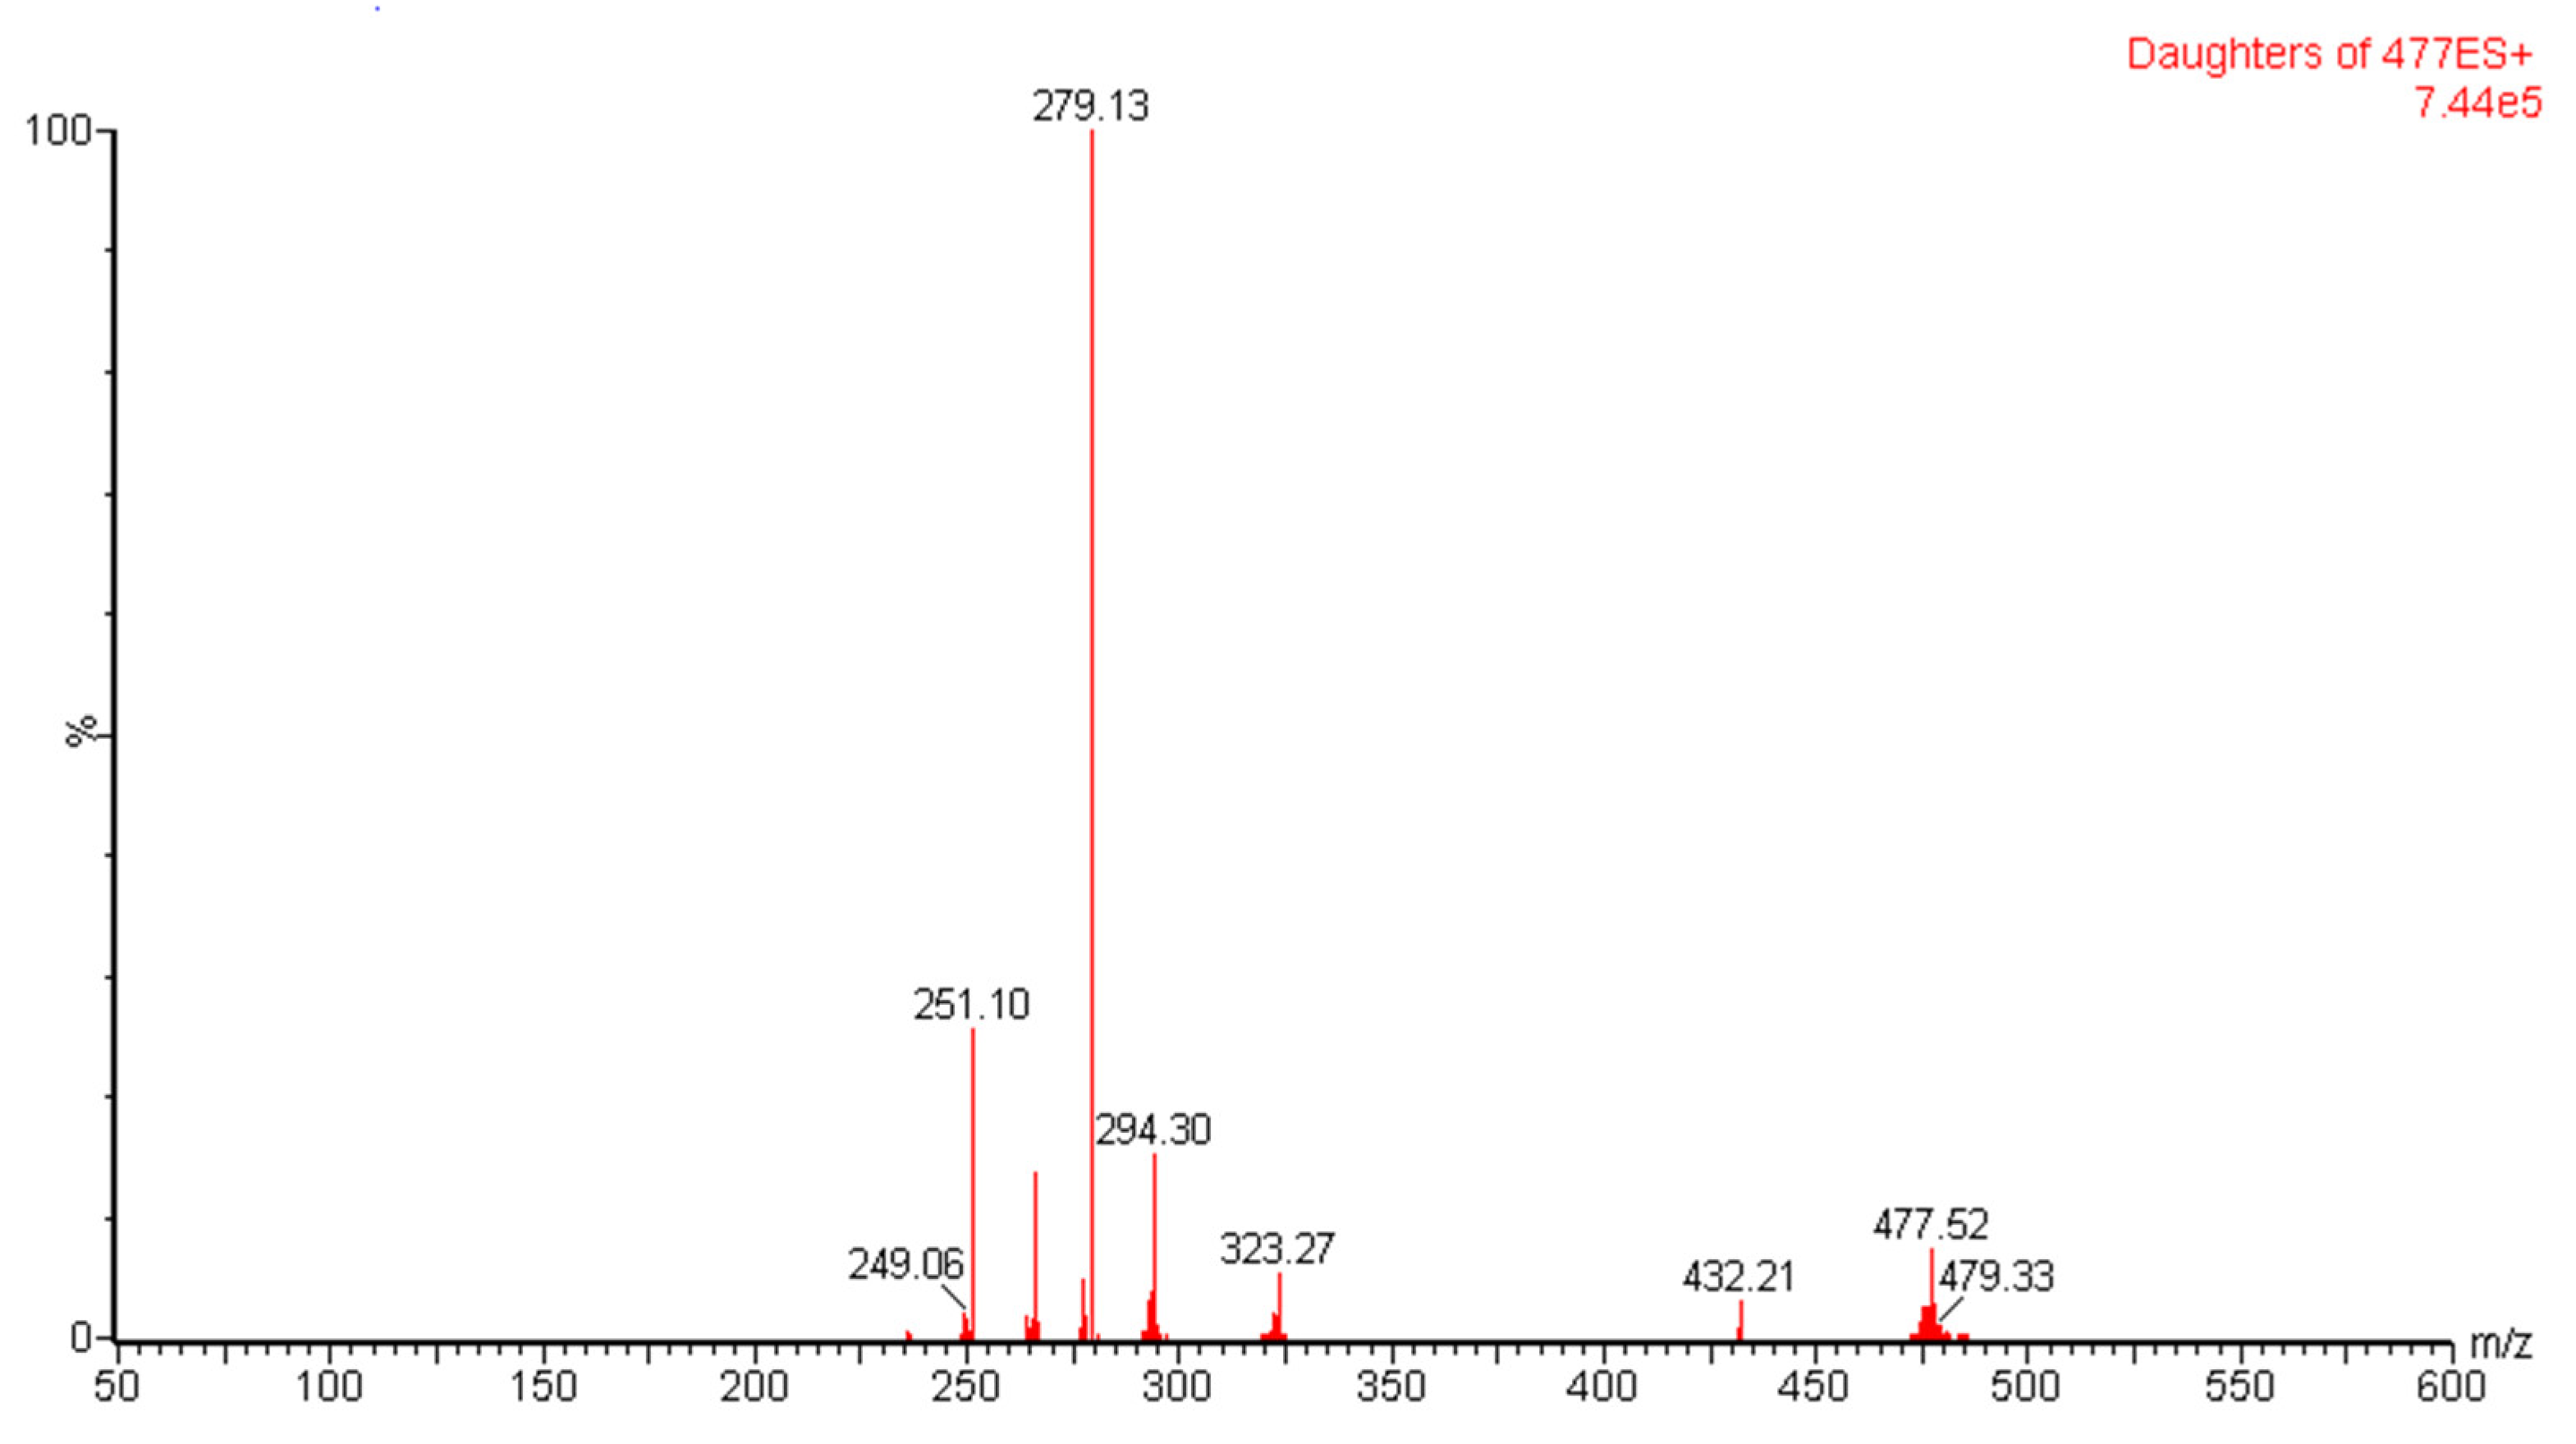
3.1.1. Optimization of Mass Spectroscopy Conditions

During method development, sample tuning was performed using IntelliStart software (version 4.1) to optimize the best possible ionization process of the analyte and IS. A 500 ng mL−1 aqueous solution of umifenovir was directly infused to the TQD detector from the sample infusion inlet system. The method procedure was operated in both positive and negative modes of ionization. The result confirmed that umifenovir is more sensitive in positive mode, which produced the most abundant parent ion peak at m/z [M+H]+ of 477.05. The parent ion produced four daughter ions [M+H]+ at m/z of 251.10, 279.13, 294.30 and 323.27 after fragmentation with argon gas. Among the daughter ions, the [M+H]+ at m/z of 279.13 was most abundant and was selected for MRM transition at 477.05 → 279.13. (Figure 1). Further, IS tuning was also performed using the optimized tuning method of the analyte to produce the maximum intensity of precursor to product ionization.

3.1.2. Optimization of Chromatographic Conditions

Optimization of liquid chromatographic separation was performed with attention to achieving best possible separation of the target analyte and IS in the shortest possible runtime with high sensitivity. Parameters such as selection of mobile phase, composition and flow rate, injection volume of processed samples, column, etc. were systemically optimized. For the selection of the mobile phase, methanol and acetonitrile were tested as organic modifiers in a variety of ratios with buffers made of ammonium acetate, ammonium formate or/and acidic additives with variable strengths such as formic acid and acetic acid. It was apparent that the best sensitivity and peak shape were produced using acetonitrile as the mobile phase in conjunction with 15 mM ammonium acetate (80:20 v/v). Moreover, the flow rate was optimized between 0.20 to 0.35 mL of flow rate in isocratic mode, and it was observed that a flow rate of 0.30 mLmin−1 was best for peak elution with resolution from the matrix pattern of the analyte and IS. During column selection, Acquity BEH and CSH columns were tried with two different length sizes of 150 and 100 mm, having a common diameter (2.1 mm) and particle size (1.7 μm). Of these, the Acquity BEH column of 2.1 × 100 and 1.7 μm produced a well-retained peak and a better elution of analyte and IS in a reasonably short run time (2.5 min/run) with an injection volume of 5 μL compared to other columns. Peak tailing of both analyte and IS with high retention time were observed with the Acquity BEH column of 2.1 × 150 mm size (Figure S1), whereas peak splitting of the analyte with a high-noise IS peak were observed with the Acquity CSH column (Figure S2) of 2.1 × 100 mm size during optimization.

3.1.3. Optimization of Sample Preparation Method

The main objective of optimizing the sample preparation method is to achieve high recovery and low matrix effects of the method and more selectivity. Initially, the analyte and IS were extracted from plasma samples via the protein precipitation method using methanol and acetonitrile individually and in combination. The results of the protein precipitation method were not satisfactory as high ion suppression with poor recovery of the analyte was observed. Therefore, using n-hexane, ethyl acetate and 1-butanol as the extracting agents, liquid–liquid extraction was tested. Herein, diethyl ether and TBME were not chosen as they were already reported with previous methods and are not environmentally benign solvents. The results with ethyl acetate were the most acceptable ion in terms of both recovery and matrix effects, so it was selected for the sample extraction procedure. The comparative recoveries and matrix effects data for the other tried solvents are presented in Figure S3 of the Supplementary Materials.

3.2. Method Validation

3.2.1. Selectivity and Sensitivity

In selectivity studies, no endogenous interferences were observed at the retention time of umifenovir and the IS in six different samples of blank plasma compared to LLOQ samples. This result indicates that the developed method is selective and specific for the quantitative analysis of umifenovir in plasma samples.
The LLOQ of the method was identified as 1.32 ng mL−1 whose S/N ratio value was ≥10. Moreover, precision and accuracy of the back-calculated concentration were found to be within the limit of ≤20% and ±20, respectively. The LLOQ was adequate for assessing the pharmacokinetics of umifenovir in rats using this approach. Figure 2 presents an MRM chromatogram of umifenovir and the IS in blank plasma (a) and plasma spiked at LLOQ level (b).

3.2.2. Linearity of the Method

The developed method showed excellent linearity in the concentration range of 1.32–625 ng mL−1 in rat plasma. The concentration–response relationship showed best fitting through using a 1/x2 weighted regression model. Mean correlation coefficients of r2 ≥ 0.995 were obtained for all the CCs. The equations of the CC for mean standard curve were y = 0.0275 x + 0.1565, where y is the analyte/IS peak area ratio and x is the analyte nominal concentration. All of the CS back-calculated results were within 15% of the nominal value.

3.2.3. Precision and Accuracy

The precision and accuracy data for the developed method are presented in Table 1. While the intra- and inter-day accuracy were in the ranges of 90.5–105.8% and 87.8–108.9%, respectively, the intra- and inter-day precision (RSD, %) were determined to be ≤9.65% and ≤11.21%, respectively. All these value were within the acceptable limit and, therefore, the developed method could be accurate and reliable for the quantitative determination of umifenovir in real plasma samples.

3.2.4. Recovery and Matrix Effects

The % ER and % ME evaluated using LQC, MQC and HQC are presented in Table 2. Overall, the mean % ER of umifenovir was 80.60% with a % RSD value of 4.83% using ethyl acetate as an extracting agent. Moreover, the result is consistent, precise and concentration-independent among the range of QCs. A slight ion suppression effect was observed in the matrix effect evaluation of umifenovir in all three QCs with a % RSD of ≤5%. The mean % ME for umifenovir was 94.11%, whereas for IS, it was 89.08%. Overall, the results confirmed that this value is insignificant and under the level recommended in the guidelines (±15%).

3.2.5. Stability and Dilution Integrity

The stability of umifenovir in spiked plasma after putting them at different anticipated storage conditions (short-term, freeze–thaw, auto-sampler and long-term) and integrity results of diluted samples are presented in Table 3. The precision value reported in the form of %RSD was ≤9.34%, whereas the accuracy of the projected concentration of umifenovir achieved following various stability conditions was in the range of 86.3–109.4%. The results indicate that the analyte remained stable in plasma samples, which may ensure the reliability of the results obtained in routine analysis of actual samples. The acceptable dilution integrity results also ensure the integrity of the results of those samples which need to be diluted before analysis.

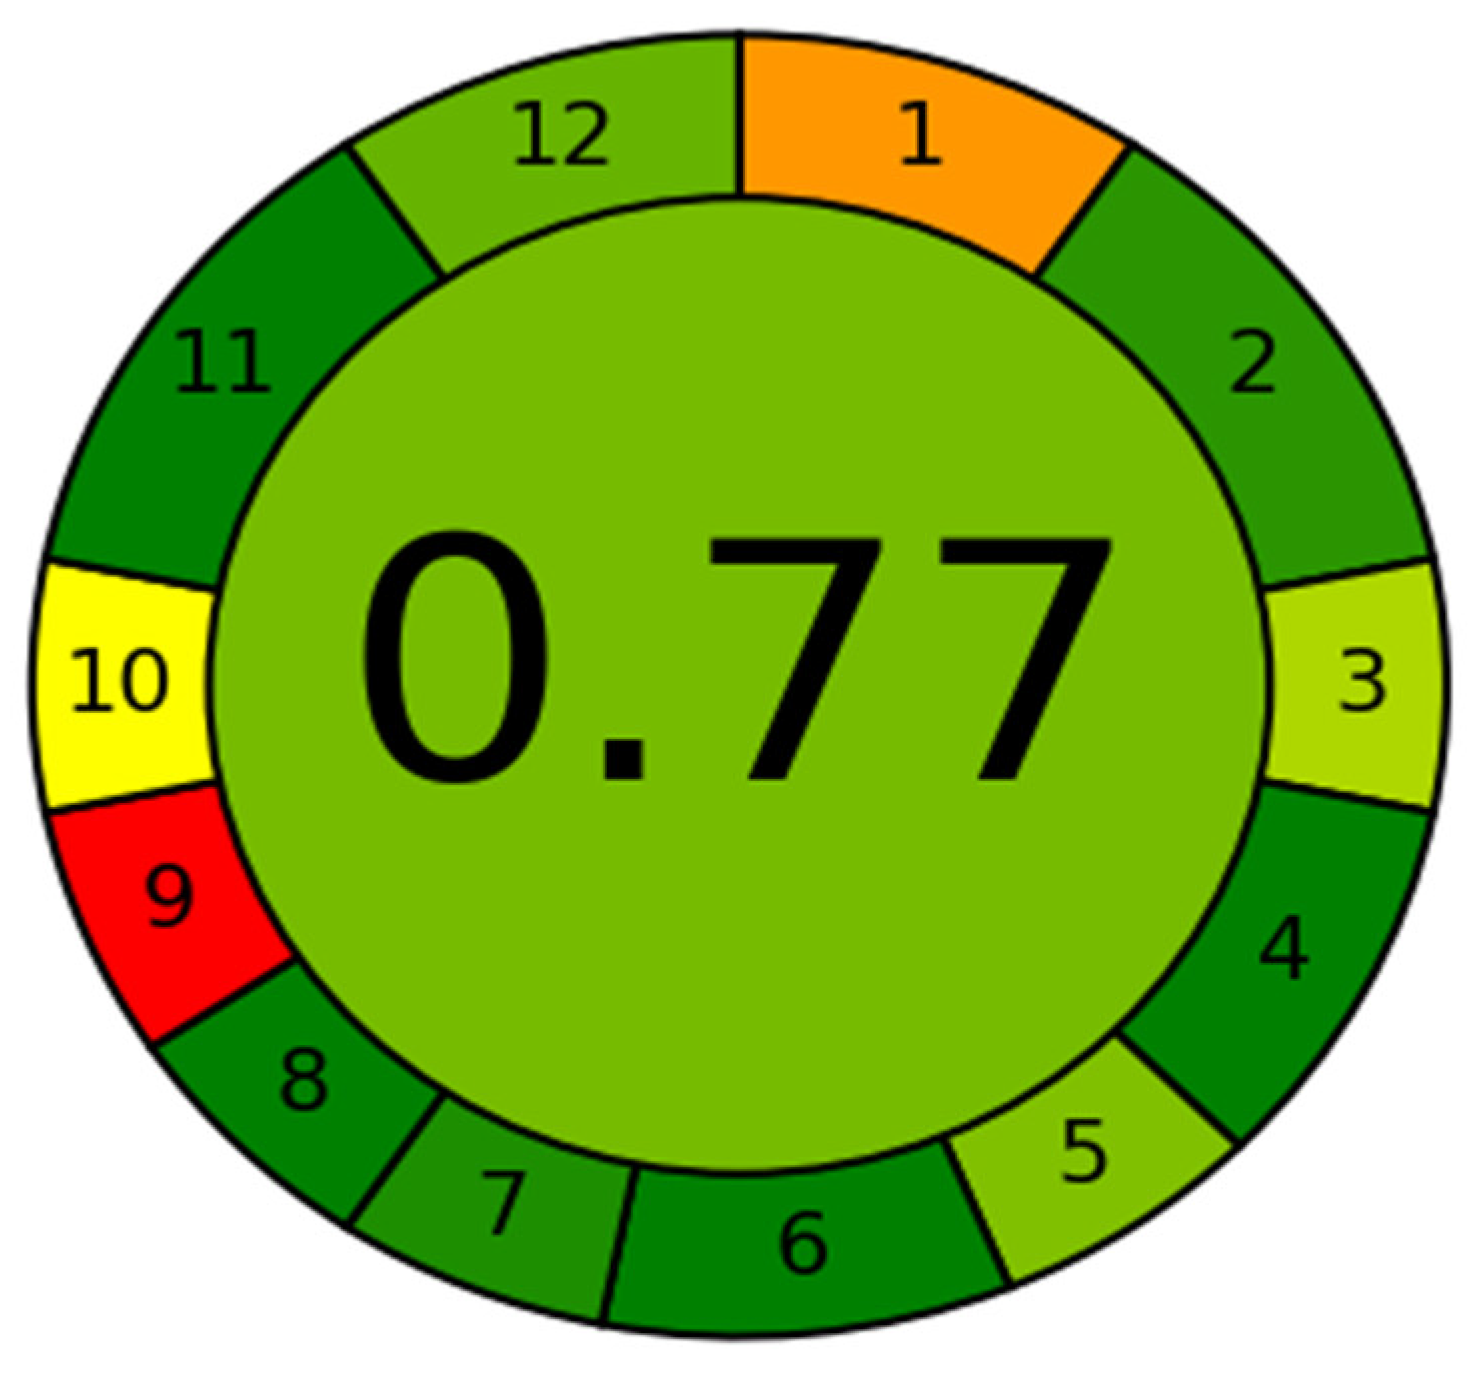
3.3. Greenness Assessment Using AGREE

The developed method’s greenness was evaluated using AGREE software, which covers all 12 GAC factors [27]. The analytical eco-scales for the various GAC principles are given weights ranging from 0.0 to 1.0 in this tool. The weights are represented as a circle with twelve parameters and a range of colors from dark green to red. Figure 3 shows the eco-scale profile for this method, while the analytical greenness report sheet with individual scores for each of the 12 criteria is shown in the Supplementary Materials (Table S1). The score was found to be 0.77 based on the many aspects of the approach, reflecting the method’s greenness (the greener the method, the closer the score is to 1.0). Eco-scale values between 0.75 and 1.00 show that the environmental friendliness of the analytical process is excellent. As a result, this assay can be regarded as the best green approach for measuring umifenovir in plasma samples.

3.4. Literature Comparison of the Method

A comparison of this method with previously reported assays is presented in Table 4. Compared to all previously reported methods, this method offers a short runtime (only 2.5 min) and is suitable for high-throughput analysis. Herein, the organic modifiers (acetonitrile) used for separation are the same as previously reported methods, but due to short run time and low flow rate (0.3 mL min−1), it will definitely result in low consumption of acetonitrile in large numbers of sample analysis. Although the sample preparation method for all methods, including this one, was liquid–liquid extraction, the extracting agent used in this method was ethyl acetate, which is more environmentally friendly than TBME and diethyl ether. Moreover, the extraction solvent used here (1 mL) was also lower than the previously reported 3 mL [19] and 5 mL [17] of previous methods. Although this amount was lower (0.6 mL) in one method [18], the used solvent is more toxic in comparison to this method. In addition, the sensitivity of this reported method is comparable to previously reported assays.

3.5. Application in Pharmacokinetic Study of Novel Formulations in Rats

The validated method was successfully applied in a comparative pharmacokinetic study to evaluate the bioavailability of a newly developed formulation of kneaded ternary umifenovir/β-cyclodextrin with 1% poloxamer 188 (KDB) in rats [31]. The animal research protocol was approved by the “Bioethical Research Committee (Approval number: BERC-003-03-21), Prince Sattam Bin Abdulaziz University Alkharj, Saudi Arabia”. In the pharmacokinetic results, Cmax and AUC0-∞ values obtained through the administration of 20 mg kg−1 of a normal suspension of umifenovir in rats were 387 ngmL−1 and 1838 ng.h/mL, respectively, which was comparable to the results obtained in healthy human volunteers after oral administration of two formulations of 200 mg tablets (Cmax 417.4 & 414.8 ng/mL; AUC0-∞, 2285.4 & 2215.2 ng. hmL−1) [32]. The relative bioavailability of the optimized KDB formulation was 2.17-fold higher than the normal suspension. The comparative pharmacokinetic profiles of KDB and normal suspension in rats are presented in Figure 4.

4. Conclusions

In this study, a fast, precise and sensitive UPLC-MS/MS method was developed for the quantitative analysis of umifenovir in plasma samples. Validation was performed following standard international guidelines, and results of all parameters were within the acceptable limits. This method has been already successfully applied in a previously reported bioavailability enhancement study. Based on a greenness evaluation using AGREE, the developed UPLC-MS/MS technique is environmentally friendly in comparison to previously reported methods, and it could be more suitable for the routine analysis of the targeted analyte without affecting the environment.

Supplementary Materials

The following supporting information can be downloaded at: https://www.mdpi.com/article/10.3390/separations10070379/s1, Table S1: The greenness report sheet of the developed assay containing individual score by following GAC criteria; Chromatograms of analyte and IS with Acquity BEH column of 2.1 × 150 mm size (Figure S1 and Acquity CSH column (Figure S2); The comparative recoveries and matrix effects data for the other tried solvents (Figure S3).

Author Contributions

M.I. designed, conducted and supervised the project. E.A.A. developed and validated the method. F.I. wrote the manuscript and experimental work. M.A.K. pharmacokinetic analysis. S.S.A. manuscript editing and software. M.K.A. formulation development and analysis. All authors have read and agreed to the published version of the manuscript.

Funding

This research was funded by Deputyship for Research and Innovation, “Ministry of Education” Saudi Arabia (IFKSUOR3-377-1).

Institutional Review Board Statement

The animal study protocol was approved by the “Bioethical Research Committee, Prince Sattam Bin Abdulaziz University Alkharj, Saudi Arabia. (Approval number: BERC-003-03-21)”.

Informed Consent Statement

Not available.

Data Availability Statement

The datasets used and/or analyzed during the current study are available from the corresponding author on reasonable request.

Acknowledgments

The authors extend their appreciation to the Deputyship for Research and Innovation, “Ministry of Education” in Saudi Arabia for funding this research (IFKSUOR3-377-1).

Conflicts of Interest

The authors declare no conflict of interest.

References

  1. Boriskin, Y.S.; Leneva, I.A.; Pécheur, E.I.; Polyak, S.J. Arbidol: A broad-spectrum antiviral compound that blocks viral fusion. Curr. Med. Chem. 2008, 15, 997–1005. [Google Scholar] [CrossRef] [PubMed]
  2. Liu, Q.; Xiong, H.R.; Lu, L.; Liu, Y.Y.; Luo, F.; Hou, W.; Yang, Z.Q. Antiviral and anti-inflammatory activity of arbidol hydrochloride in influenza A (H1N1) virus infection. Acta Pharmacol. Sin. 2013, 34, 1075–1083. [Google Scholar] [CrossRef] [PubMed] [Green Version]
  3. Fink, S.L.; Vojtech, L.; Wagoner, J.; Slivinski, N.S.; Jackson, K.J.; Wang, R.; Khadka, S.; Luthra, P.; Basler, C.F.; Polyak, S.J. The antiviral drug arbidol inhibits Zika virus. Sci. Rep. 2018, 8, 8989. [Google Scholar] [CrossRef] [PubMed] [Green Version]
  4. Pécheur, E.I.; Borisevich, V.; Halfmann, P.; Morrey, J.D.; Smee, D.F.; Prichard, M.; Mire, C.E.; Kawaoka, Y.; Geisbert, T.W.; Polyak, S.J. The synthetic antiviral drug arbidol inhibits globally prevalent pathogenic viruses. J. Virol. 2016, 90, 3086–3092. [Google Scholar] [CrossRef] [PubMed] [Green Version]
  5. Pécheur, E.I.; Lavillette, D.; Alcaras, F.; Molle, J.; Boriskin, Y.S.; Roberts, M.; Cosset, F.L.; Polyak, S.J. Biochemical mechanism of hepatitis C virus inhibition by the broad- spectrum antiviral arbidol. Biochemistry 2007, 46, 6050–6059. [Google Scholar] [CrossRef] [Green Version]
  6. Blaising, J.; Polyak, S.J.; Pécheur, E.I. Arbidol as a broad spectrum antiviral: An update. Antivir. Res. 2014, 107, 84–94. [Google Scholar] [CrossRef]
  7. Zhonghua, L.; Xing, B.; Xue, Z. Special Expert Group for Control of the Epidemic of Novel Coronavirus Pneumonia of the Chinese Preventive Medicine Association. An update on the epidemiological characteristics of novel coronavirus pneumonia (COVID-19). Zhonghua Liu Xing Bing Xue Za Zhi 2020, 41, 139–144. [Google Scholar]
  8. Jie, X.; Hongmei, Y.; Ping, F.; Kuikui, Z.; Bohan, Y.; Rui, M. Beneficial effect of Arbidol in the management of COVID-19 infection. Aging 2021, 13, 9253–9264. [Google Scholar] [CrossRef]
  9. Gao, W.; Chen, S.; Wang, K.; Chen, R.; Guo, Q.; Lu, J.; Wu, X.; He, Y.; Yan, Q.; Wang, S.; et al. Clinical features and efficacy of antiviral drug, Arbidol In 220 nonemergency COVID-19 patients from East-West-Lake Shelter Hospital in Wuhan: A retrospective case series. Virol. J. 2020, 17, 162. [Google Scholar] [CrossRef]
  10. Nojomi, M.; Yassin, Z.; Keyvani, H.; Makiani, M.J.; Roham, M.; Laal, A.; Dehghan, N.; Navaei, M.; Ranjbar, M. Effect of Arbidol (Umifenovir) on COVID-19: A randomized controlled trial. BMC Infect. Dis. 2020, 20, 954. [Google Scholar] [CrossRef]
  11. Lin, L.; Li, T.S. Diagnosis and treatment plan for COVID-19 (trial version 8 revision) National Health Commission of the People’s Republic of China. Chin. J. Clin. Infect. Dis. 2021, 14, 81–88. [Google Scholar]
  12. Abdelrahman, Z.; Liu, Q.; Jiang, S.; Li, M.; Sun, Q.; Zhang, Y.; Wang, X. Evaluation of the current therapeutic approaches for COVID-19: A systematic review and a meta-analysis. Front. Pharmacol. 2021, 12, 607408. [Google Scholar] [CrossRef]
  13. Jomah, S.; Asdaq, S.M.B.; Al-Yamani, M.J. Clinical efficacy of antivirals against novel coronavirus (COVID-19): A review. J. Infect. Public Health 2020, 13, 1187–1195. [Google Scholar] [CrossRef]
  14. Ul’yanovskii, N.V.; Kosyakov, D.S.; Sypalov, S.A.; Varsegov, I.S.; Shavrina, I.S.; Lebedev, A.T. Antiviral drug Umifenovir (Arbidol) in municipal wastewater during the COVID-19 pandemic: Estimated levels and transformation. Sci. Total Environ. 2022, 805, 150380. [Google Scholar] [CrossRef]
  15. Full Prescribing Information: Arbidol (umifenovir) film-coated tablets 50 and 100 mg: Corrections and Additions. State Register of Medicines. Open joint-stock company “Pharmstandard-Tomskchempharm Prospekt Lenina, Tomsk, Tomsk Region, 634009”. Available online: https://newdrugapprovals.org/2020/03/21/arbidol-umifenovir/ (accessed on 15 April 2023). (In Russian).
  16. Liu, X.; Chen, X.H.; Zhang, Y.Y.; Liu, W.T.; Bi, K.S. Determination of arbidol in rat plasma by HPLC-UV using cloud-point extraction. J. Chromatogr. B 2007, 856, 273–277. [Google Scholar] [CrossRef]
  17. Metz, R.; Muth, P.; Ferger, M.; Kukes, V.G.; Vergin, H. Sensitive high-performance liquid chromatographic determination of arbidol, a new antiviral compound, in human plasma. J. Chromatogr. A 1998, 810, 63–69. [Google Scholar] [CrossRef]
  18. Xiong, X.; Zhai, S. High-performance liquid chromatography/tandem mass spectrometry method for the determination of arbidol in human plasma. J. AOAC Int. 2011, 94, 1100–1105. [Google Scholar] [CrossRef] [Green Version]
  19. Liu, X.; Huang, Y.W.; Li, J.; Li, X.; Bi, K.S.; Chen, X.H. Determination of arbidol in human plasma by LC-ESI-MS. J. Pharm. Biomed. Anal. 2007, 43, 371–375. [Google Scholar] [CrossRef]
  20. Iqbal, M.; Ezzeldin, E.; Anwer, M.K.; Imam, F. Eco-Friendly UPLC-MS/MS Quantitation of Delafloxacin in Plasma and Its Application in a Pharmacokinetic Study in Rats. Separations 2021, 8, 146. [Google Scholar] [CrossRef]
  21. Alam, P.; Ezzeldin, E.; Iqbal, M.; Mostafa, G.A.E.; Anwer, M.K.; Alqarni, M.H.; Foudah, A.I.; Shakeel, F. Determination of Delafloxacin in Pharmaceutical Formulations Using a Green RP-HPTLC and NP-HPTLC Methods: A Comparative Study. Antibiotics 2020, 9, 359. [Google Scholar] [CrossRef]
  22. Alam, P.; Ezzeldin, E.; Iqbal, M.; Anwer, M.K.; Mostafa, G.A.; Alqarni, M.H.; Foudah, A.I.; Shakeel, F. Ecofriendly densitometric RP-HPTLC method for determination of rivaroxaban in nanoparticle formulations using green solvents. RSC Adv. 2020, 10, 2133–2140. [Google Scholar] [CrossRef] [Green Version]
  23. Haq, N.; Iqbal, M.; Alanazi, F.K.; Alsarra, I.A.; Shakeel, F. Applying green analytical chemistry for rapid analysis of drugs Adding health to pharmaceutical industry. Arab. J. Chem. 2017, 10, S777–S785. [Google Scholar] [CrossRef] [Green Version]
  24. Iqbal, M. UHPLC-MS/MS assay using environment friendly organic solvents: A green approach for fast determination of quetiapine in rat plasma. Arab. J. Chem. 2019, 12, 1774–1782. [Google Scholar] [CrossRef] [Green Version]
  25. Ibrahim, F.A.; Elmansi, H.; Fathy, M.E. Green RP-HPLC method for simultaneous determination of moxifloxacin combinations: Investigation of the greenness for the proposed method. Microchem. J. 2019, 148, 151–161. [Google Scholar] [CrossRef]
  26. Abou-Taleb, N.H.; Al-Enany, N.M.; El-Sherbiny, D.T.; El-Subbagh, H.I. Digitally enhanced thin layer chromatography for simultaneous determination of norfloxacin tinidazole with the aid of Taguchi orthogonal array and desirability function approach: Greenness assessment by analytical eco-scale. J. Sep. Sci. 2020, 43, 1195–1202. [Google Scholar] [CrossRef] [PubMed]
  27. Pena-Pereira, F.; Wojnowski, W.; Tobiszewski, M. AGREE Analytical Greenness metric approach and software. Anal. Chem. 2020, 92, 10076–10082. [Google Scholar] [CrossRef]
  28. Duan, X.; Liu, X.; Dong, Y.; Yang, J.; Zhang, J.; He, S.; Yang, F.; Wang, Z.; Dong, Y. A green HPLC method for determination of nine sulfonamides in milk and beef, and its greenness assessment with analytical eco-scale and greenness profile. J AOAC Int. 2020, 103, 1181–1189. [Google Scholar] [CrossRef]
  29. Abdelrahman, M.M.; Abdelwahab, N.S.; Hegazy, M.A.; Fares, M.Y.; EL-Sayed, G.M. Determination of the abused intravenously administered madness drops (tropicamide) by liquid chromatography in rat plasma; an application to pharmacokinetic study and greenness profile assessment. Microchem. J. 2020, 159, E105582. [Google Scholar] [CrossRef]
  30. Bioanalytical Method Validation Guidence for Industry. Food and Drug Administration, Center for Drug Evaluation and Research. Center for Veterinary Medicine (CVM). 2018. Available online: https://www.fda.gov/files/drugs/published/Bioanalytical-Method-Validation-Guidance-for-Industry.pdf (accessed on 15 February 2023).
  31. Anwer, M.K.; Iqbal, M.; Ahmed, M.M.; Aldawsari, M.F.; Ansari, M.N.; Ezzeldin, E.; Khalil, N.Y.; Ali, R. Improving the Solubilization and Bioavailability of Arbidol Hydrochloride by the Preparation of Binary and Ternary β-Cyclodextrin Complexes with Poloxamer 188. Pharmaceuticals 2021, 14, 411. [Google Scholar] [CrossRef]
  32. Liu, M.Y.; Wang, S.; Yao, W.F.; Wu, H.Z.; Meng, S.N.; Wei, M.J. Pharmacokinetic properties and bioequivalence of two formulations of arbidol: An open-label, single-dose, randomized-sequence, two-period crossover study in healthy Chinese male volunteers. Clin. Ther. 2009, 31, 784–792. [Google Scholar] [CrossRef]
Figure 1. Parent (MS) to daughter ion (MS/MS) spectra of umifenovir.
Separations 10 00379 g001
Figure 2. The representative MRM chromatogram of umifenovir and IS in blank plasma (a) and plasma spiked at LLOQ concentration (b).
Separations 10 00379 g002
Figure 3. The eco-scale profile of proposed method generated using AGREE software.
Separations 10 00379 g003
Figure 4. Comparative plasma concertation time profiles via oral administration of 20 mg/kg of umifenovir normal suspension (NSP) and new KDB formulation in rats (n = 6 each). (This figure is reproduced from an earlier figure published under an open-access Creative Common CC BY license [31]).
Separations 10 00379 g004
Table 1. Summarized view of intra- and inter-batch precision and accuracy data for umifenovir in rat plasma in five replicates.
Concentration (ng mL−1)Intra-Day (n = 5)Inter-Day (n = 15)
Mean ± SD (ng mL−1)Precision RSD (%)Accuracy (%)Mean ± SD (ng mL−1)Precision RSD (%)Accuracy (%)
1.321.39 ± 0.064.62105.81.44 ± 0.1611.21108.9
4.03.91 ± 0.235.8897.83.74 ± 0.328.4993.5
110113 ± 10.109.65102.7116 ± 8.327.14105.9
555498 ± 7.921.5990.5483 ± 25.55.2987.8
Table 2. Recovery and matrix effect data of umifenovir in rat plasma.
conc. (ng mL−1)% ER% ME
% Mean ± SD% RSD%Mean ± SD% RSD
Umifenovir4.083.97 ± 8.5013.7093.56 ± 3.994.27
11081.54 ± 5.196.3797.04 ± 3.203.29
55076.35 ± 6.438.4291.73 ± 3.483.79
average80.60 ± 3.894.8394.11 ± 2.702.87
IS2584.56 ± 6.267.4389.08 ± 5.436.09
Table 3. Stability and dilution integrity data of umifenovir in rat plasma (n = 5).
Stability Nominal Concentration (ng mL−1) (n = 6)Precision (RSD, %)Accuracy
(%)
Short-term (8 h)
47.86104.6
5503.2597.7
Freeze–thaw (three cycles)
42.93108.9
5505.2093.2
Auto-sampler (24 h)
45.53109.4
5507.1997.8
3 months at −80 °C
48.0591.6
5509.3486.3
Dilution integrity2 times6.76107.6
4 times8.64102.4
Table 4. Literature comparison of previously reported methods.
MethodExtraction Solvent (Volume)Calibration Range (ng mL−1)Run TimeApplicationReference
(min)
HPLC-MS/MSTBME 0.5–500 6H1N1 influenza virus-infected patients[18]
(0.6 mL)
HPLC-U/Vsurfactant Triton X-114 (1 mL)80–20,00010Pharmacokinetic study in rats[16]
LC-ESI-MS/MSDiethyl ether (3 mL)1–1000 6 Healthy men volunteers[19]
HPLC-UVTBME 5–10,00025Healthy men volunteers[17]
(5 mL)
This methodEthyl acetate1.32–625 2.5Pharmacokinetic study in rats-
(1 mL)
Disclaimer/Publisher’s Note: The statements, opinions and data contained in all publications are solely those of the individual author(s) and contributor(s) and not of MDPI and/or the editor(s). MDPI and/or the editor(s) disclaim responsibility for any injury to people or property resulting from any ideas, methods, instructions or products referred to in the content.

