Article

Comparative Study of Conventional, Microwave-Assisted and Supercritical Fluid Extraction of Bioactive Compounds from Microalgae: The Case of Scenedesmus obliquus

Laboratory of Thermodynamics and Transport Phenomena, School of Chemical Engineering, National Technical University of Athens (NTUA), Zografou Campus, 15780 Athens, Greece
*
Authors to whom correspondence should be addressed.
Separations 2023, 10(5), 290; https://doi.org/10.3390/separations10050290
Submission received: 10 April 2023 / Revised: 25 April 2023 / Accepted: 28 April 2023 / Published: 4 May 2023
(This article belongs to the Special Issue Separation, Extraction and Purification of Natural Products)

Abstract

:
The recovery of bioactive products with green processes is a critical topic for the research and industry fields. In this work, the application of solid–liquid (SLE), microwave-assisted extraction (MAE) with aq. ethanol 90% v/v and supercritical fluid extraction (SFE) with CO2 for the recovery of biocomponents from Scenedesmus obliquus is studied. The effects examined were temperature (30–60 °C), time (6–24 h), and solvent-to-biomass ratio (20–90 mLsolv/gbiom) for SLE, temperature (40–60 °C), time (5–25 min), solvent-to-biomass ratio (20–90 mLsolv/gbiom), and microwave power (300–800 W) for MAE, and temperature (40–60 °C), pressure (110–250 bar), solvent flow rate (20–40 gsolv/min), and cosolvent presence (0, 10% w/w ethanol) for SFE in relation to the extract’s yield, phenolic, chlorophyll, carotenoid content, and antioxidant activity. The optimum extraction conditions determined were 30 °C, 24 h, and 90 mLsolv/gbiom for SLE, 60 °C, 5 min, 90 mLsolv/gbiom, and 300 W for MAE, and 60 °C, 250 bar, and 40 gsolv/min for SFE. Additionally, a kinetic SFE study was conducted and the obtained results were satisfactorily correlated using Sovová’s model. The comparison between the methods proved MAE’s efficiency in all terms compared to SLE. Moreover, SFE was accompanied with the lowest yield and chlorophyll content, yet led to an increased carotenoid content and improved antioxidant activity. Finally, the cosolvent addition significantly improved SFE’s yield and led to the most superior extract.

Graphical Abstract

1. Introduction

Due to the constantly increasing industrial demand for the naturally derived components of bioactive importance, both alternative feedstocks as well as green processes need to be utilized [1]. The forestry and agriculture biomass are considered vital resources for the bioeconomy [2]. However, taking into account the need of biomass exploitation for food over industrial use and the overutilization of biomass along with its dreadful consequences, it is required to become more conservative and cautious regarding biomass selection and utilization.
The diverse group of microalgae are prokaryotic or eukaryotic organisms grown either autotrophically, heterotrophically, or mixotrophically in both sea and fresh water [3]. Microalgae comprise proteins, carbohydrates, lipids, and other biocomponents, and are considered a resource of bioactive compounds, e.g., pigments, polyphenols, vitamins, and fatty acids [4,5]. Such components exhibit antibiotic, antibacterial, antifungal, and antioxidant activities and are suitable for application in the food, pharmaceutical, and cosmetic industries [5,6]. Furthermore, the rapid growth rate of microalgae, land-use efficiency during cultivation, and no competition with agricultural land constitute a comparative advantage over other biomass resources [7,8]. The above arguments support microalgae as an alternative choice over other biomass types to be exploited for the recovery of bioactive components.
The popular genus Scenedesmus presents high nutritional content and bioactivity, while being heat tolerant, resistant to tropical climate, and able to grow rapidly under proper conditions [9]. More specifically, Scenedesmus obliquus (S. obliquus) species exhibits promising prospects regarding bioactive compound synthesis [10]. Components known for their antioxidant, antiviral, and curative potentials, such as carotenoids (lutein, β-carotene, astaxanthin), chlorophylls, and phenolic compounds, are found in S. obliquus biomass [6,11].
To date, several studies focus on the extraction of biocomponents such as natural phenolic compounds and pigments from S. obliquus, using various solvents as well as different conventional or non-conventional methods [12,13,14]. The conventional technique of solid–liquid extraction (SLE) is a commonly used and straightforward method employed for the extraction of microalgae compounds [15]. During SLE, the solvent transfers from the bulk solution to the surface of the matrix, then penetrates the matrix and dissolves the solutes in order to transfer them to the matrix surface and subsequently into the bulk solution through diffusion. The selection of solvent and liquid/solid ratio, extraction temperature, and duration are critical factors affecting SLE’s efficiency [16]. Nevertheless, SLE is associated with challenges concerning prolonged exposure to high temperatures [17]. In order to overcome such obstacles, non-conventional technologies have been investigated.
An alternative to SLE is the microwave-assisted extraction (MAE). MAE has proven to be effective in the extraction of microalgal components [12]. During MAE, the utilized polar solvent absorbs the microwave energy, leading to intense molecular mobility, instant heating, and therefore, the release of extractables from the matrix in the bulk solution [17]. MAE’s efficiency is affected by factors similar to the case of SLE, as well as the applied microwave power [18].
Another non-conventional technique is the supercritical fluid extraction (SFE). Carbon dioxide (CO2) is widely used as a solvent in SFE and has also been investigated for microalgae extraction [14]. The safe, inexpensive, and easily available CO2 presents increased dissolving power under supercritical conditions (Tc = 30.98 °C, Pc = 73.77 bar [19]), while the extract is protected from being thermally or chemically degraded [20]. The method is considered less efficient in the extraction of polar compounds. This limitation, however, can be addressed by adding a polar cosolvent, e.g., the common ethanol and methanol [21].
The novelty and objective of this study lies in the effect study, process optimization, and comparison of both conventional and non-conventional methods regarding not only the extraction yield, but also the recovery of high value-added components, as well as the antioxidant activity of microalgal extracts. More specifically, this work is a comprehensive investigation of the recovery of bioactive compounds from the microalga S. obliquus. An effect study of crucial extraction parameters was conducted on three different extraction techniques, namely SLE, MAE, and SFE. More specifically, SLE with aq. ethanol 90% v/v was examined under the variation of extraction temperature from 30 to 60 °C, time from 6 to 24 h, and solvent-to-biomass ratio from 20 to 90 mLsolv/gbiom, while MAE with the same solvent was examined under the variation of extraction temperature from 40 to 60 °C, time from 5 to 25 min, solvent-to-biomass ratio from 20 to 90 mLsolv/gbiom, and microwave power from 300 to 800 W. SFE with CO2 was examined under the variation of extraction temperature from 40 to 60 °C, pressure from 110 to 250 bar, and solvent flow rate from 20 to 40 gsolv/min, as well as the absence or presence of a cosolvent (10% w/w ethanol). The impact of the aforementioned parameters was evaluated in terms of the extraction yield, the phenolic, chlorophyll, selected, i.e., astaxanthin, lutein, and β-carotene, and total carotenoid content, as well as the extract’s antioxidant activity. Moreover, a kinetic study of SFE was conducted under representative conditions, where experimental data of yield were correlated using the mass transfer model of Sovová [22,23]. All methods were optimized in terms of both yield and bioactivity, and finally, the optimized results of SLE, MAE, and SFE were compared.

2. Materials and Methods

2.1. Materials

S. obliquus biomass was purchased from Allmicroalgae—Natural Products, S.A (Pataias, Portugal) in January 2022. The biomass was cultivated in a closed system, gently spray-dried and received in powder form. The nutrient and pigment composition of S. obliquus biomass provided by the company is displayed in Table 1.
All the chemicals and reagents were used as purchased and are listed in Table 2, accompanied by their supplier, CAS registry number, and purity.

2.2. Extraction Methods

2.2.1. Solid–Liquid Extraction (SLE)

The solid–liquid extraction was carried out in a double-wall vessel placed in the dark. An appropriate amount of aq. ethanol, 90% v/v, with approximately 1 g of S. obliquus biomass was loaded in the vessel. The choice of ethanol/water mixture and their ratio was determined from preliminary experiments as well as the findings of Cha et al. [24] and Vieira et al. [16], which exhibited the benefits of the selected solvents and ratio over others in terms of the extraction of bioactive microalgal compounds. The mixture was stirred at 500 rpm, and the extraction conditions, including time, temperature, and solvent-to-biomass ratio were regulated based on an appropriate experimental design (see Section 2.4). In order to minimize solvent losses, a condenser was adjusted on the top of the vessel. After the SLE, mixture centrifugation was performed in a Hermle centrifuge Z206-A (Hermle AG, Baden-Württemberg, Germany) at 1110× g for 8 min. The supernatant was then filtered through a ChromPure PTFE/L 0.45 μm filter (Membrane solutions, Auburn, WA, USA) and evaporated under vacuum at 100 mbar and 45 °C in a Hei-Vap Advantage ML rotary evaporator (Heidolph Instruments GmbH & Co., KG, Bayern, Germany). Eventually, the dry extracts were temporarily stored at −18 °C until further analysis. The extraction yield was determined gravimetrically based on the weight of the obtained extracts, and the experimental error was calculated from repetition (three times) of the experimental design’s center point.

2.2.2. Microwave-Assisted Extraction (MAE)

The microwave-assisted extraction was conducted using a MAS-II Plus microwave synthesis/extraction reaction workstation (Sineo Microwave Chemistry Technology Co. Ltd., Shanghai, China). An appropriate amount of aq. ethanol, 90% v/v, with approximately 1 g of S. obliquus biomass was loaded in a double-wall vessel. The mixture was stirred at 500 rpm, and the extraction conditions, including time, temperature, solvent-to-biomass ratio, and microwave power were regulated based on an appropriate experimental design (see Section 2.4.). In order to minimize solvent losses, a condenser was adjusted on the top of the vessel. After the MAE, the mixture’s centrifugation, supernatant’s filtration and vacuum evaporation, and extract’s storage were performed according to the corresponding steps described in Section 2.2.1. Eventually, the dry extracts were temporarily stored at −18 °C until further analysis. The extraction yield was determined gravimetrically based on the weight of the obtained extracts, and the experimental error was calculated from repetition (three times) of the experimental design’s center point.

2.2.3. Supercritical Fluid Extraction (SFE)

The supercritical fluid extraction using CO2 was conducted in a SFE-500 bench scale apparatus (SEPAREX CHIMIE FINE, Champigneulles, France), the detailed description of which is provided by Papamichail et al. [25]. During SFE, the extraction vessel was filled with approximately 80 g of S. obliquus biomass, along with glass beads (d = 4.5 mm) at the top and bottom to reduce dead space and ensure uniform flow distribution. According to preliminary experiments regarding the exhaustive extraction of S. obliquus biomass, the CO2 consumption was established at 200 kgCO2/kgbiom for all of the performed experiments. The extraction conditions, including temperature, pressure, and solvent flow rate were regulated based on an appropriate experimental design (see Section 2.4.). The solvent–solute mixture was subjected to depressurization, and the extract was collected from two separators operating at 8 °C and 60 and 10 bar, respectively. All the collected extracts were stored at −18 °C until further analysis. The extraction yield was determined by measuring the weight loss of biomass in the vessel at the end of each experiment and the experimental error was calculated based on the repetition (three times) of the experimental design’s center point.
In the case of the cosolvent addition, a piston pump was used for the addition of ethanol, and ethanol content in CO2 was set to 10% w/w. The resulting mixture of solutes in ethanol was then evaporated under vacuum at 100 mbar and 45 °C and stored at −18 °C until further analysis. The supercritical fluid extraction with cosolvent addition was conducted in duplicate.
Regarding the SFE kinetic study, experiments were regularly interrupted for weight loss measurement. The kinetic study experiments were conducted in duplicate.

2.3. Extract Analyses

Determination of extract’s phenolic, chlorophyll, and carotenoid content, as well as antioxidant activity was performed on the received extracts. Detailed description of all the employed methods can be found elsewhere [26].
Briefly, the total phenolic content (TPC) was determined using the Folin–Ciocalteu assay, according to Drosou et al. [27]. TPC was detected at 765 nm, and extract’s mass concentration was expressed in gallic acid equivalents (mgGA/gextr). The total pigment content, namely chlorophyll (CHL) and carotenoid (CAR), was determined spectrophotometrically at 664, 647, 630, 510, and 480 nm, using the equations provided from Jeffrey et al. [28,29]. CHL and CAR were expressed in milligrams of the corresponding compound per extract’s gram (mg/gextr), according to appropriate conversions [26]. Moreover, the DPPH• scavenging assay was performed, according to Laina et al. [30], for the determination of the antioxidant activity. The indicator of half-maximal inhibitory concentration (IC50) was measured at 515 nm and expressed in extract’s milligrams per milligram of DPPH• (mgextr/mgDPPH). Essentially, the higher the sample’s antioxidant activity is, the lower the IC50 value. A Shimadzu UV-1900i UV-Vis spectrophotometer (Shimadzu Corporation, Kyoto, Japan) with quartz cuvettes of 1 cm length was used for the aforementioned spectrophotometric assays.
The selected carotenoid content (sel. CAR), i.e., lutein, astaxanthin, lutein, and β-carotene, was quantified using reversed-phase high performance chromatography (RP-HPLC). Analysis was performed in an HPLC apparatus, the description of which is provided elsewhere [31]. Methanol, MTBE, and aq. phosphoric acid, 1% v/v, consisted of the mobile phase in a linear gradient (Table 3) provided by Stramarkou et al. [32], and flow rate was set at 1 mL/min. A YMC C30 reversed-phase column, 5 μm, 250 × 4.6 mm I.D. (YMC Co., Ltd., Kyoto, Japan), operating at 35 °C, was utilized as the stationary phase. All the samples injected were dissolved in ethyl acetate and filtered with ChromPure PTFE/L 0.45 μm filters (Membrane solutions, Auburn, WA, USA). The calibration curves of the selected carotenoids are provided in detail elsewhere [31]. Finally, sel. CAR was expressed in milligrams of the selected carotenoids per extract’s gram (mg/gextr).

2.4. Experimental Design, Statistical Analysis and Process Optimization

A 2-level full factorial design was applied to effectively investigate the impact of the selected experimental factors of SLE, MAE, and SFE at 2 levels (−1, +1) in order to estimate their individual effect as well as their interactions. The independent parameters studied were: temperature—T (30–60 °C), time—t (6–24 h), solvent-to-biomass ratio—R (20–90 mLsolv/gbiom) for SLE; temperature—T (40–60 °C), time—t (5–25 min), solvent-to-biomass ratio—R (20–90 mLsolv/gbiom), and microwave power—P (300–800 W) for MAE; and temperature—T (40–60 °C), pressure—P (110–250 bar), and solvent flow rate—F (20–40 gsolv/min) for SFE. The examined responses were the extraction yield, TPC, CHL, CAR, sel. CAR, and IC50. The experimental design of the extraction methods consisted of 2n factorial points and 3 repetitions of the center point, where n stands for the number of the examined independent parameters.
Eventually, analysis of variance (ANOVA) was conducted for data correlation using Equations (1) and (2). A reduction in the number of model terms was also attempted, provided, however, that the hierarchy of the model is maintained.
Y S L E , S F E = b 0 + i = 1 3 b i X i + i = 1 2 j = i + 1 3 b i j X i X j
Y M A E = b 0 + i = 1 4 b i X i + i = 1 3 j = i + 1 4 b i j X i X j + i = 1 2 j = 2 3 k = 3 4 b i j k X i X j X k
where, Y S L E , S F E represents the examined responses of SLE and MAE, Y M A E is the examined responses of MAE, and b 0 , b i , b i j , and b i j k are the constant, linear, two-factor interaction, and three-factor interaction coefficients, respectively.
Finally, during process optimization, all the successfully correlated examined responses were concurrently tended toward their optimal value, while the independent parameters of each method ranged in their domain. The statistical significance of the results was assessed using Fisher’s statistical test (F-test) at a significance level of 95%. The experimental design, modeling, analysis, and optimization were conducted using the trial version of Design Expert® Version 13 software (Stat-Ease Inc., Minneapolis, MN, USA).

2.5. Mathematical Model of SFE Kinetics

The experimental yield data of SFE were correlated through the application of Sovová’s model [22,23]. This mass balance model is based on an extended version of Lack’s plug flow model [33] and is considered appropriate for describing the supercritical fluid extraction of microalgal compounds [34].
According to Sovová’s model, SFE is divided in three stages. During the first stage (I), the easily accessible compounds are extracted fast at a constant rate. During the third diffusion-controlled stage (III), compounds from the inside of the substrate are slowly extracted, while the second stage (II) represents the transition from the first to the third stage.
The model equations are presented beneath, while further details and model assumptions can be found in the literature [22,23].
e = q y r 1 e x p Z , q < q m ( I ) y r q q m exp z W Z , q m < q < q n ( I I ) x 0 y r / W l n 1 + [ e x p ( W x 0 / y r ) 1 ] e x p [ W ( q m q ) ] x k / x 0 , q q n ( I I I )
The following equations are used for the determination of the additional required values:
q m = ( x 0 x k ) / y r Z
q n = q m + 1 / W l n [ x k + ( x 0 x k ) e x p ( W x 0 / y r ) ] / x 0
z w / Z = y r / ( W x 0 ) l n ( x 0 e x p [ W ( q q m ) ] x k ) / ( x 0 x k )
Z = k f α 0 ρ f / q ˙ ( 1 ε ) ρ s
W = k s α 0 / q ˙ ( 1 ε )
where, e is the specific amount of the extracted solute (kgextr/kgsolute-free feed), q is the specific amount of the passing solvent through the extractor (kgsolv/kgsolute-free feed), q n is the value of q when the easily accessible solute is completely extracted, and q m is value of q when the extraction inside the particles begins. Moreover, y r is the solute’s solubility in the solvent (kgsolute/kgsolv), x 0 is the initial concentration of the solute in the solid phase (kgsolute/kgsolute-free feed), x k is the concentration of the less accessible solute in the solid (kgsolute/kgsolute-free feed), z w is the dimensionless coordinate between slow and fast extraction and k s and k f represent the mass transfer coefficient of solid and solvent-phase (m/s), respectively. Finally, W and Z are the dimensionless mass transfer parameters in the solid and fluid phases, respectively, ρ f and ρ s are the density of the fluid and solid (kg/m3), respectively, α 0 is the specific interfacial area (m2/m3), ε is the bed void fraction, and q ˙ is the specific flow rate (s−1).
In this work, a kinetic SFE study was conducted under representative experimental conditions and Sovová’s model was employed to correlate the experimental data. During correlation, x 0 was assigned the experimental value obtained from the exhaustive extraction, while y r was assigned the value of stage’s I estimated curve slope. Eventually, x k , W , and Z were fitted through minimization of the objective function of the absolute average deviation (AAD) of e (Equation (9)).
A A D % = 100 N i = 1 N | e i p r e d i c t e d e i e x p e r i m e n t a l | e i e x p e r i m e n t a l
where, N stands for the number of experimental points for each experiment.

3. Results and Discussion

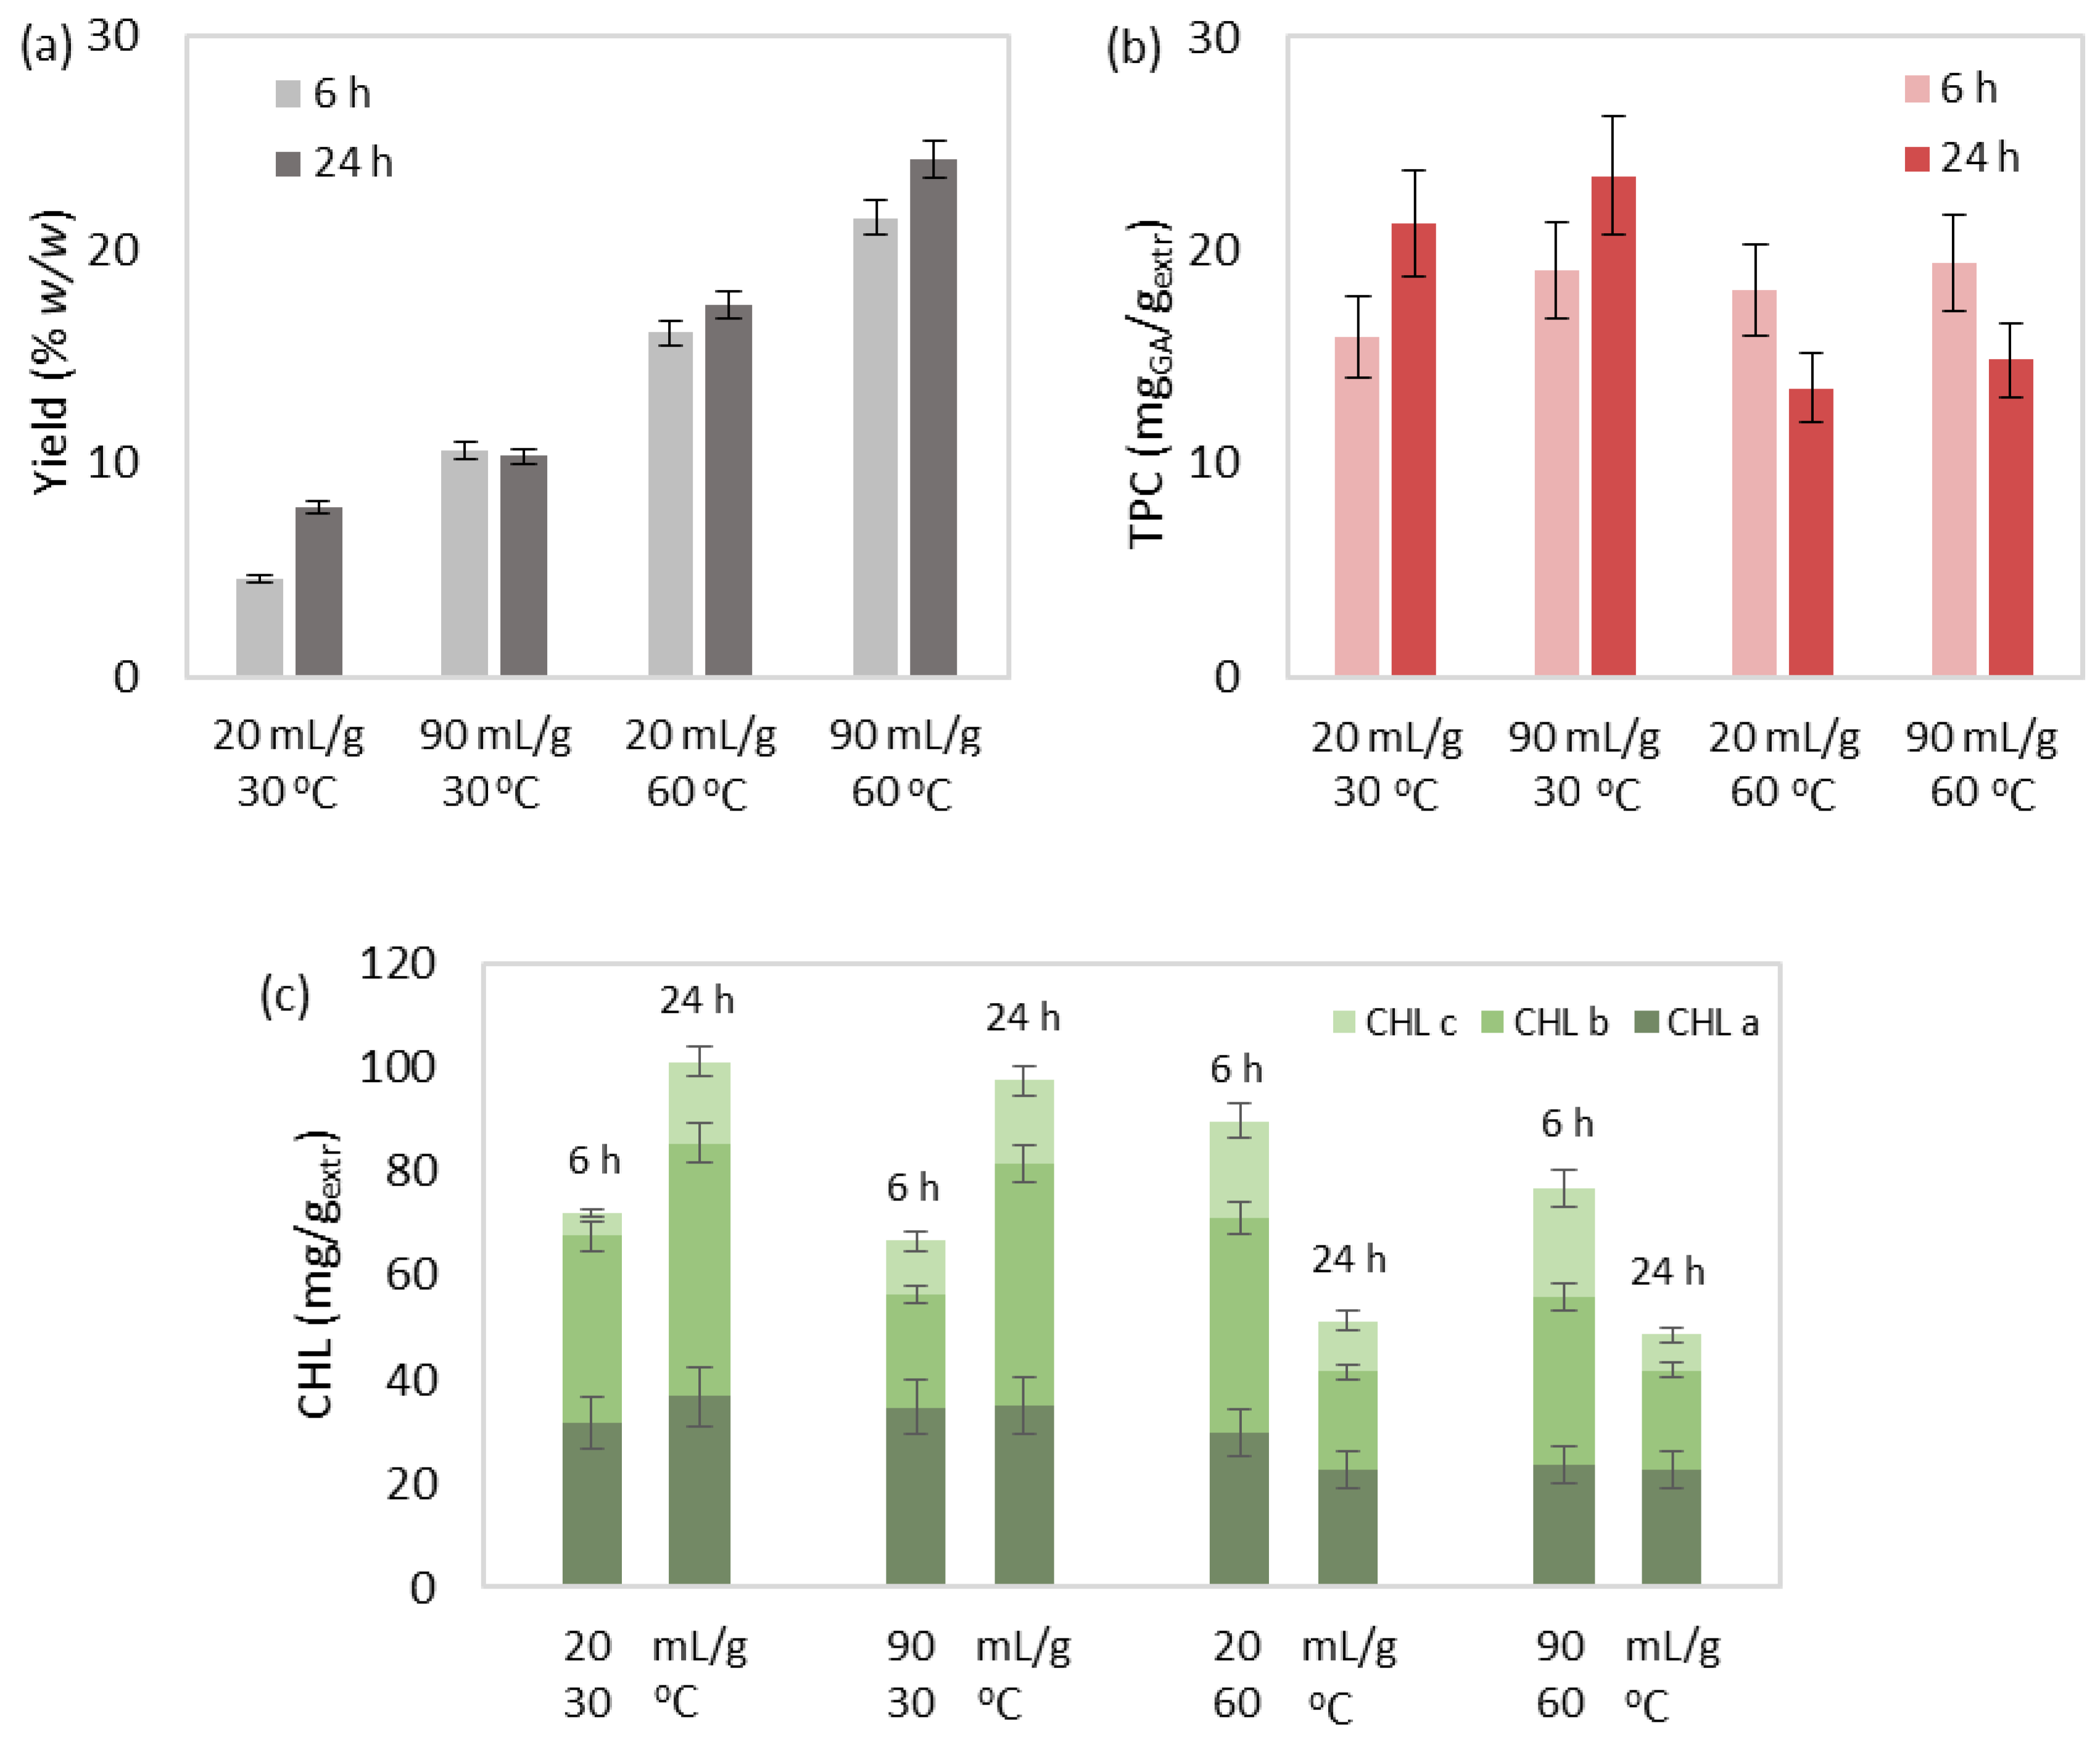
3.1. SLE of Bioactive Compounds

3.1.1. Effect Study

The SLE extracts obtained were characterized by a dark green color and a mild fishy scent. The results of the examined responses are displayed in Table 4, and the temperature, time, and solvent-to-biomass ratio effects are depicted in Figure 1.
The extraction yield was enhanced by both the individual and simultaneous increase in the values of all three independent variables (Figure 1a). The temperature and solvent-to-biomass ratio effects proved to be the most significant. However, the rest of the responses exhibited a more complex behavior. More specifically, maintaining either low temperature and long duration or high temperature and short duration favored phenolic (Figure 1b), chlorophyll (Figure 1c), and carotenoid (Figure 1e) content, and consequently, the extract’s antioxidant activity (Figure 1f). The solvent-to-biomass ratio increase improved the extract’s phenolic content, while chlorophyll content was not favored. Regarding the carotenoid content, total carotenoids improved during ratio increase in the short high-temperature extraction, while both selected and total carotenoids were favored during ratio increase in the long low-temperature extraction. Finally, antioxidant activity was improved with increasing ratio under low temperature.
In general, the temperature increase favors extraction yield by reducing the solvent’s viscosity and increasing the solubility and diffusion coefficients of the microalgal compounds [35]. Moreover, the solvent-to-biomass ratio increase offers a greater gradient of the solvent–biomass system; therefore, provides a faster diffusion of solutes from the microalgal matrix to the bulk solution [36]. Additionally, the duration increase, depending on the structure of the microalgal cells, offers sufficient time, improved dilution, and mass transfer of microalgal solutes [37].
Nonetheless, high temperatures and prolonged extraction duration are associated with epimerization, oxidation, and degradation of nutraceutical components, such us pigments [37,38]. Furthermore, the solvent-to-biomass increase could be related to the dissolution and extraction of additional potentially undesirable components, which could reduce solvent’s selectivity toward the examined nutraceuticals of interest [39].

3.1.2. Correlation and Parameter Optimization

The SLE experimental results were submitted to ANOVA for statistical analysis and data correlation. Appropriate equations were constructed and are displayed in Supplementary Materials. All the responses were successfully correlated, except from the selected carotenoid content. According to the Supplementary Materials, extraction temperature is the most statistically significant positive effect on yield (p-value < 0.0001) and negative on extract’s carotenoid content (p-value: 0.0048). Additionally, the combined effect of extraction temperature and duration ( T t ) is considered the most significant positive effect on phenolic and chlorophyll content (p-value: 0.0004). The T t interaction also showed a significant positive effect on IC50 value, which indicates a negative effect on the extract’s antioxidant activity (p-value: 0.0021). The parameter optimization performed using the optimization tool of Design Expert® indicated that optimum SLE conditions were 30 °C, 24 h and 90 mLsolv/gbiom (Table 4—Run 4).

3.2. MAE of Bioactive Compounds
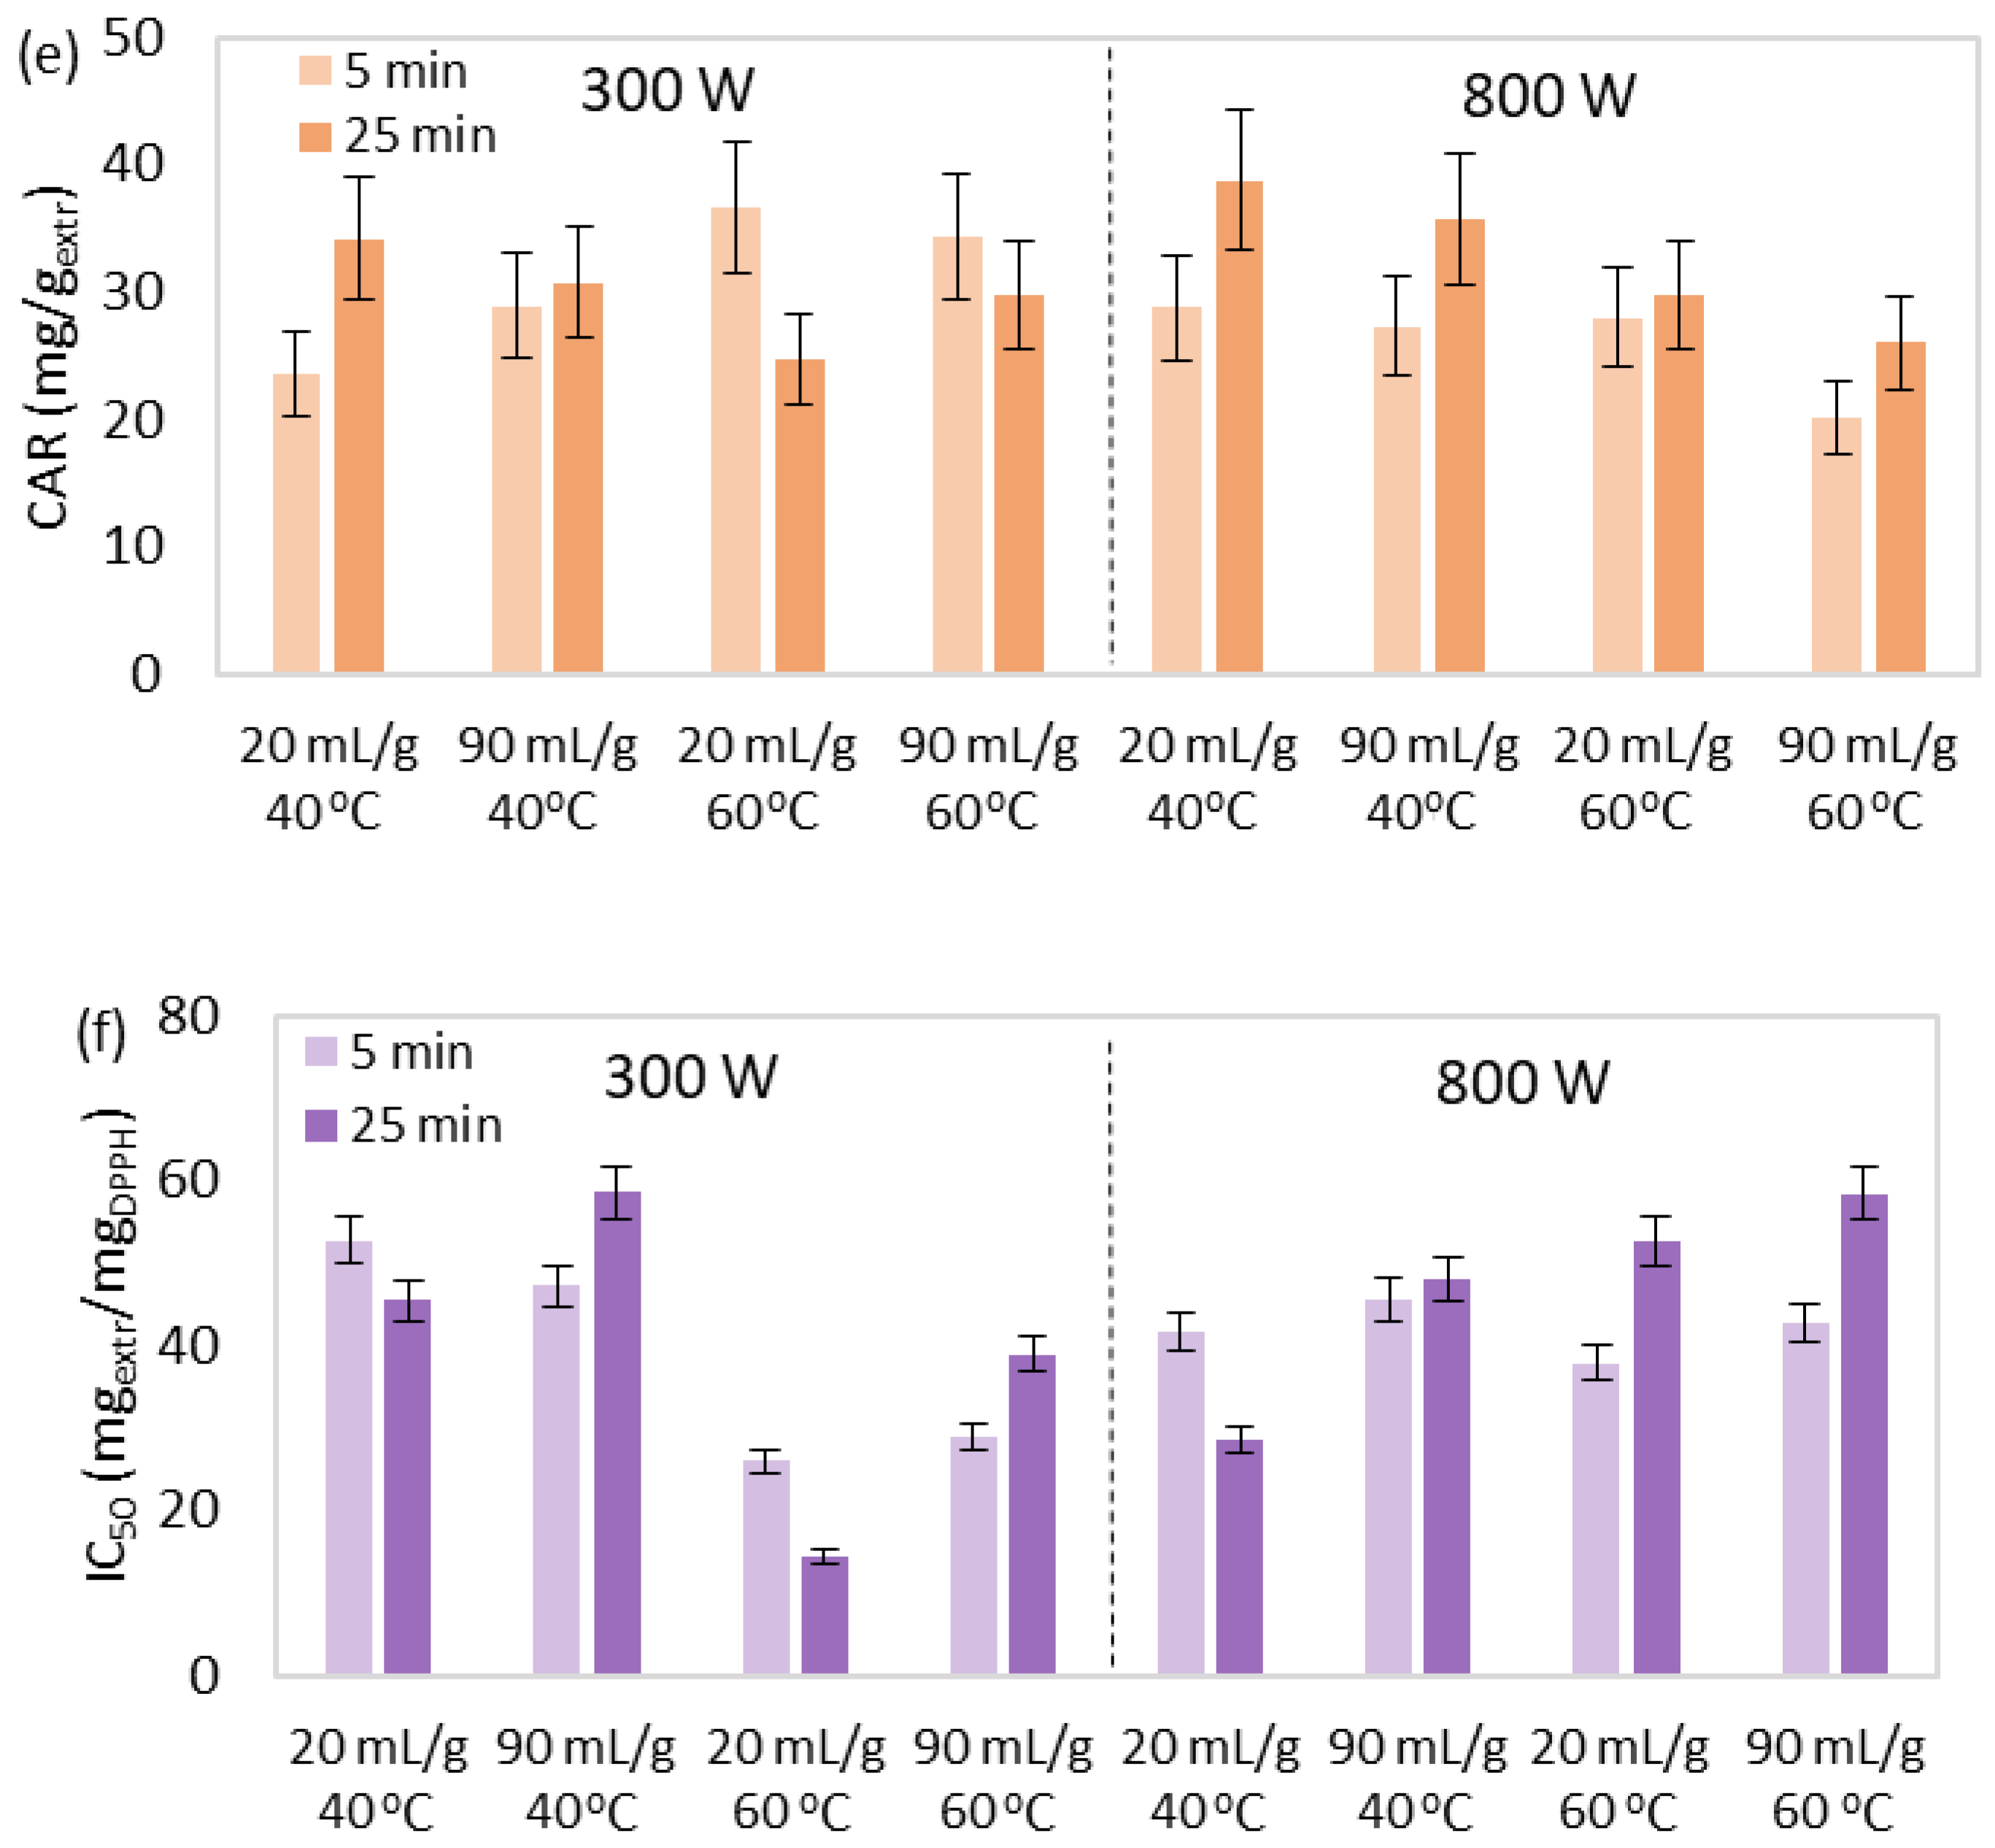
3.2.1. Effect Study

The MAE extracts obtained were characterized by a dark green color and a mild fishy scent. The results of the examined responses are displayed in Table 5 and the temperature, time, solvent-to-biomass ratio, and microwave power effects are depicted in Figure 2.
The MAE yield was mainly enhanced by the individual increase in the values of all four independent variables (Figure 2a). However, a more complex behavior was followed by the rest of the examined responses. The total phenolic content did not follow a specific trend but a lower value emerged at low microwave power, temperature, time, and ratio level (Figure 2b). Moreover, chlorophyll content maintained a relatively stable value during low microwave power, except the lower value at low temperature, solvent-to-biomass ratio, and prolonged duration (Figure 2c). Yet, an improvement was still achieved with the microwave power increase mainly under low extraction temperature. In addition, the selected carotenoid content did not follow a specific trend, but a lower value emerged at low microwave power, time, and ratio level (Figure 2d). However, the combination of either short MAE at elevated temperature and low microwave power or prolonged MAE at low temperature and elevated power enhanced the carotenoid content (Figure 2e). Similarly, antioxidant activity was enhanced during either at elevated temperature and low microwave power or low temperature and elevated power (Figure 2f).
In general, the temperature as well as solvent-to-biomass ratio effect during MAE could be justified similarly to SLE. On the other hand, extraction duration during MAE is considerably reduced. Although time increase may initially boost MAE’s efficiency and the recovery of selected bioactive compounds up to a certain point, prolonged radiation exposure could lead to the denaturation of nutraceuticals [40]. Finally, microwave power enhances MAE’s yield due to the improved molecular interaction between the matrix and the electromagnetic field, but relatively increased values are associated with the degradation of the extract’s bioactive components [41,42]. Therefore, a complex effect of the examined independent variables was obtained. The literature also reports similar fluctuations in phenolic and pigment recovery during the effect study of MAE from different types of biomass [43,44].

3.2.2. Correlation and Parameter Optimization

The MAE experimental results were submitted to ANOVA for statistical analysis and data correlation. Appropriate equations were constructed and are presented in Supplementary Materials. Only the responses of the yield and extract’s antioxidant activity were successfully correlated. According to the Supplementary Materials, extraction temperature has the most statistically significant positive effect on yield (p-value < 0.0001), while the combined effect of extraction temperature and microwave power ( T P ) proved to be the most significant positive effect on IC50 value (p-value < 0.0001), which indicates a negative effect on the extract’s antioxidant activity. The parameter optimization performed using the optimization tool of Design Expert® indicated that optimum ΜAΕ conditions were 60 °C, 5 min, 90 mLsolv/gbiom, and 300 W (Table 5—Run 14).

3.3. SFE of Bioactive Compounds
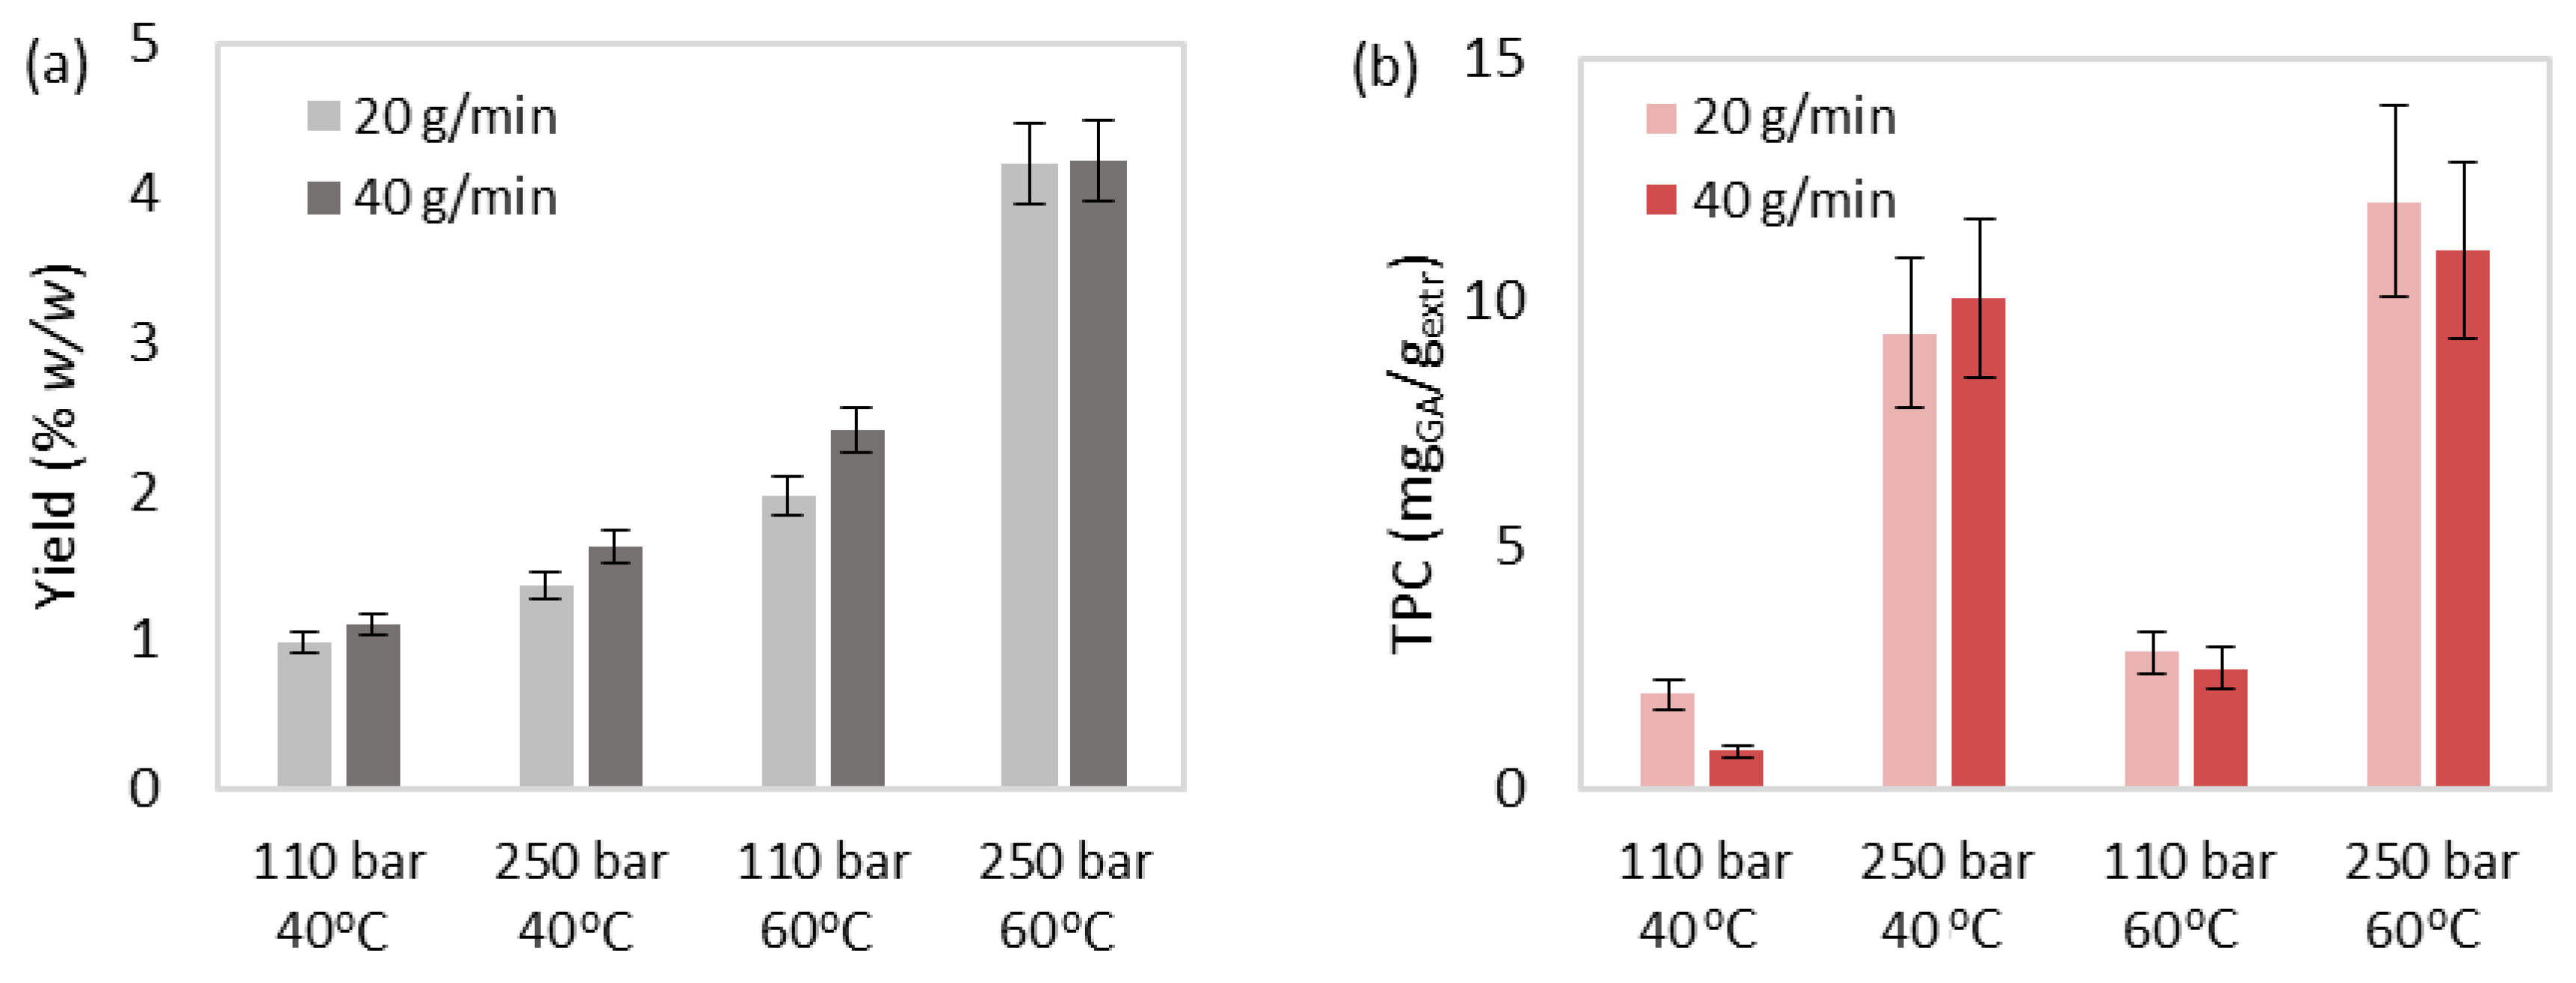
3.3.1. Effect Study

The SFE extracts obtained were characterized by a dark yellow color and no fishy scent. The results of the examined responses are displayed in Table 6, and the temperature, time, and solvent-to-biomass ratio effects are depicted in Figure 3.
Both the individual and simultaneous increase in pressure and temperature enhanced the SFE yield (Figure 3a), and the extract’s phenolic (Figure 3b), chlorophyll (Figure 3c), and carotenoid (Figure 3d,e) content, and antioxidant activity (Figure 3f). Indeed, pressure rise during SFE increases scCO2 density and, consequently, its solvation capability [45]. Concerning the temperature effect, the rise in extraction temperature during SFE not only decreases scCO2 density and, therefore, its solvation capability, but additionally raises the vapor pressure of the extractable components, leading to two conflicted conditions regarding SFE’s efficiency [46]. However, according to the improved results during temperature rise, it is proven that the increased vapor pressure of the extractable compounds in scCO2 dominated over the scCO2 density decrease under the examined pressures, which is also observed in other studies [47,48]. Moreover, the carotenoid-favorable extraction and more limited chlorophyll recovery was also observed in the work of Guedes et al. [49]. Comparable total extract yields of the same order of magnitude have also been observed in the work of Lorenzen et al. (conditions: 300–800 bar, 50–80 °C, 100–200 kgCO2/kgbiom, 540 min, extraction yield: 5.8–7.6% w/w) [50].
The effect of the solvent flow rate increase was not considered consistent, leading to either increase, decrease, or even no influence toward the examined responses. On the one hand, the solvation capability of scCO2 is mainly formed by the extraction temperature and pressure [51], justifying any possible non-effects of the solvent’s flow rate. On the other hand, the rise in the flow rate could be responsible for the decrease in mass transfer resistance, which enhances the solute quantity transferred to the bulk solution and explains any response increase [52]. However, in some cases, a flow rate increase does not offer sufficient contact time between the matrix and the solvent, leading to a reduced recovery of selected compounds [53].

3.3.2. Correlation and Parameter Optimization

The SFE experimental results were submitted to ANOVA for statistical analysis and data correlation. All the responses were successfully correlated using appropriate equations (Supplementary Materials). According to the Supplementary Materials, extraction temperature has the most statistically significant positive effect on yield (p-value < 0.0001), while pressure proved to have the most significant positive effect on phenolic (p-value < 0.0001), chlorophyll (p-value: 0.0010), selected (p-value < 0.0001), and total (p-value: 0.0010) carotenoid content, and the extract’s antioxidant activity (p-value < 0.0001 for IC50). The parameter optimization performed using the optimization tool of Design Expert® indicated that optimum SFE conditions were 60 °C, 250 bar, and 40 gsolv/min (Table 6—Run 11).

3.3.3. Effect of Cosolvent

The disadvantage of lower SFE yields is often countered by the addition of a cosolvent. Ethanol, a safe and green solvent, is usually employed as a cosolvent in typically low concentrations during SFE [54,55]. For this reason, the addition of 10% w/w ethanol was performed during SFE under the optimum extraction conditions found in Section 3.3.2. The results are presented in Table 6 (Run—SFE+10% ethanol). The extract obtained exhibited a yellow-green color, and no unpleasant odor occurred. The addition of ethanol boosted SFE by significantly enhancing the extraction yield (+131.04%), the phenolic (+60.94%), chlorophyll (+1501.52%), selected (+18.29%), and total carotenoid (+30.32%) content, and the antioxidant activity of the extract (IC50: −34.21%).
The aforementioned improvement is due to the solvent’s polarity alteration that allowed the extraction of more polar compounds. The extraction of more polar phenolic [56], chlorophyll (e.g., chlorophyll b [57]), and carotenoid (e.g., xanthophylls [58]) compounds is favored, leading to improved antioxidant activity, as reported in other studies [48,55].

3.3.4. Kinetic Study of SFE

The description of SFE curves with the Sovová model is presented in Figure 4, while the estimated model parameters and the corresponding AAD of each dataset are given in Table 7. Thus, Figure 4 and the low AAD values indicate that the model describes satisfactorily the experimental SFE data at the representative operational conditions, proving the successful correlation attempt via the Sovová model [22,23].
Apparently, temperature and pressure change alter CO2 density and the solute’s vapor pressure and, therefore, lead to a variation of extracts’ solubility ( y r ) and concentration of the initial solute in the solid phase ( x 0 ). Other studies have also reported this [48,59]. Both terms, y r and x 0 , increased with temperature and pressure rise. Similar to x 0 , x k followed the same trend with pressure and temperature variation. Furthermore, y r and x k were not affected by the rise in solvent flow rate, as a result of their high dependence on the fluid state, i.e., temperature and pressure [51]. Solvent flow rate decrease did not affect the final SFE yield; however, a slight downward displacement of the extraction curve was observed (Figure 4) probably due to the rise in mass transfer resistance, which limited the amount of solute transferred to the bulk solution [52].
Regarding the mass transfer parameters, Z q ˙ was appropriately adjusted for all experiments conducted at 250 bar, considering the insignificant effect on the kinetic description as well as the risk of miscalculation due to the lack of experimental data during the fast extraction stage (I). The pressure drop from 250 to 110 bar resulted in increased Z q ˙ , also observed in other studies [48,59].
On the other hand, W q ˙ varied under different experimental conditions. More specifically, W q ˙ was mainly proportionally affected by the solvent flow rate. This finding, also observed by other researchers, indicates that the third and slower extraction stage, where intracellular mass transfer is considered dominant, is also affected by external mass transfer [59]. In addition, temperature and pressure slightly affected W q ˙ ; however, due to the simultaneous variation of x 0 , no definite conclusions could be drawn.
Finally, Z q ˙ prevailed over W q ˙ with a deviation of two-order magnitude. The lower W q ˙ values, also observed in other studies [48,59], indicated the greater resistance encountered in the solid phase, which affects the slow extraction stage.

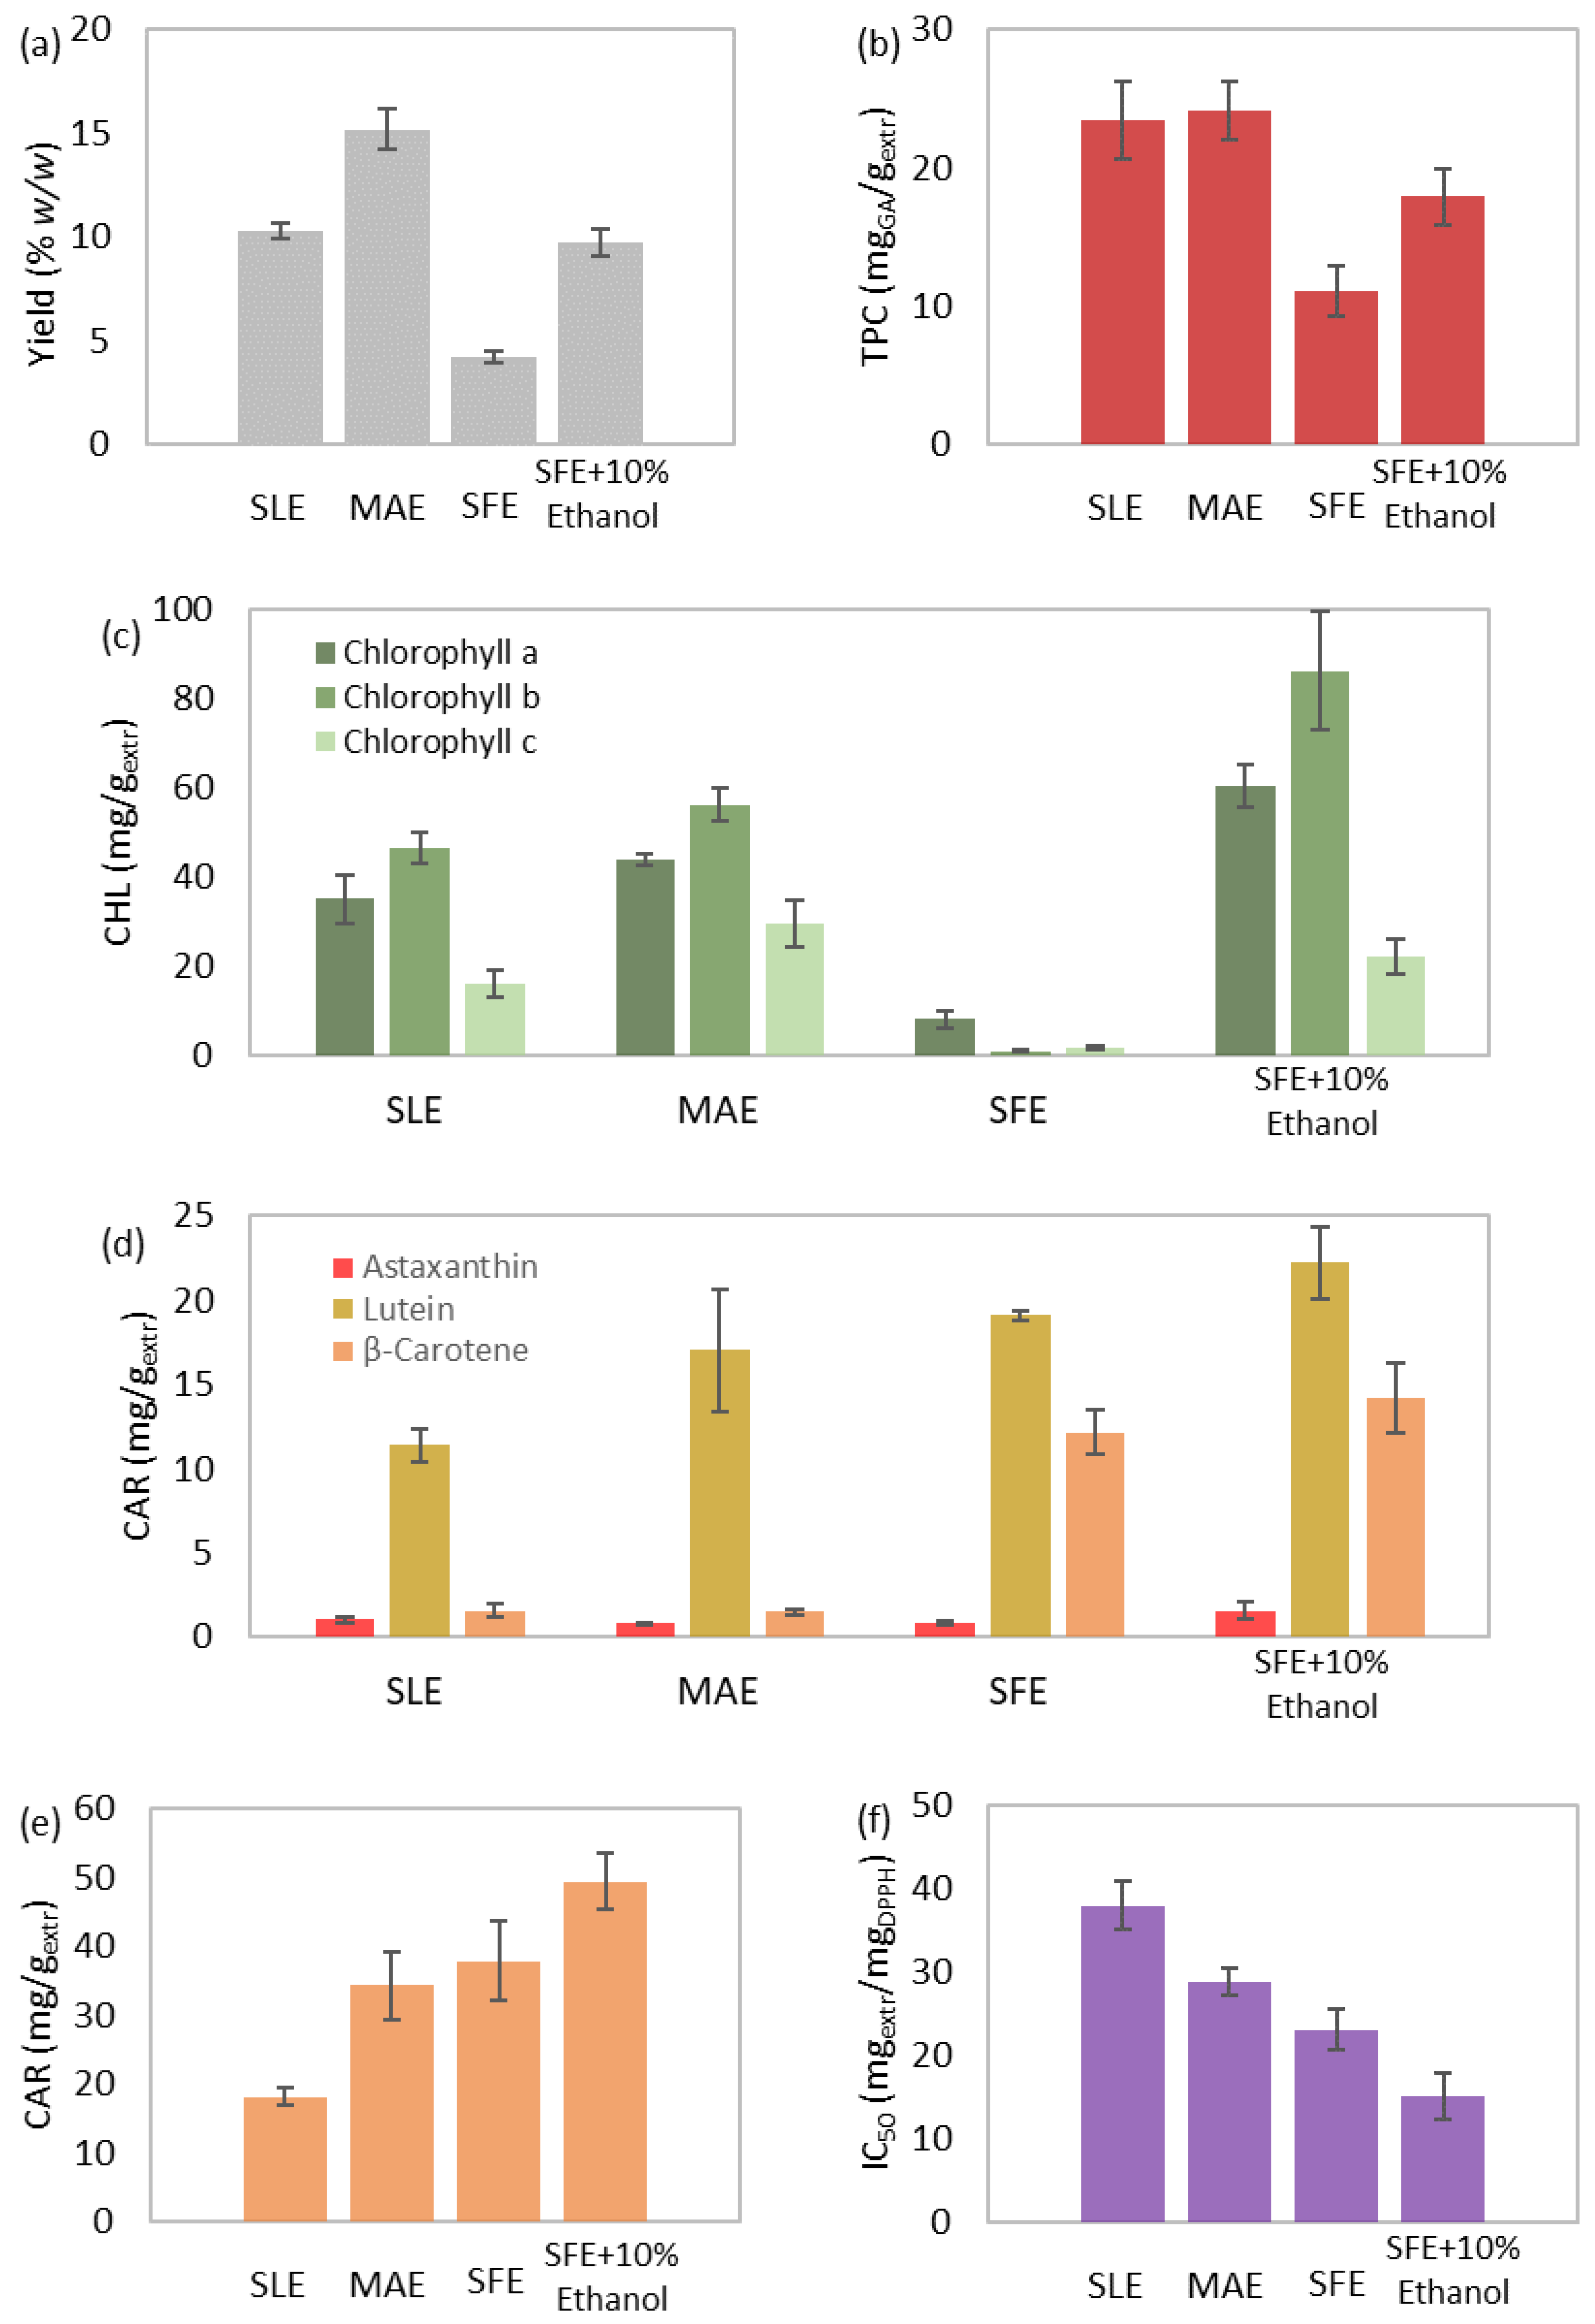
3.4. Comparison of the Proposed Extraction Methods

Finally, the examined methods of SLE, MAE, SFE, and SFE+10% ethanol were compared at optimal conditions, which are presented in Table 8. In the case of SFE+10% ethanol, the optimal conditions of SFE were employed. The detailed experimental results are presented in the corresponding tables for SLE (Table 4—Run 4), MAE (Table 5—Run 14), SFE (Table 6—Run 11), and SFE+10% ethanol (Table 6—SFE+10% ethanol) and are compared in Figure 5.
The dark green SLE and MAE extracts presented a distinct fishy odor due to the presence of certain microalgal volatile organic compounds (VOCs) [60]. However, the dark yellow and yellow-green extracts of SFE and SFE+10% ethanol, respectively, were free of unpleasant odors most likely due to VOCs’ removal during the abrupt depressurization of CO2.
The order of increasing extraction yield was as follows: SFE, SFE+10% ethanol, SLE, and MAE (Figure 5a). Among the tested methods, MAE provided the highest yield under the shortest possible time. SFE, although 3.6 times faster, exhibited a 59.15% lower yield compared to SLE. However, the cosolvent addition more than doubled SFE yield, leading to a comparable extraction yield to that of SLE.
The total phenolic content increase order was similar to yield (Figure 5b). TPC of the examined S. obliquus biomass probably consisted of more flavonoid glycosides and phenols of high molecular weight, which are effectively recovered by polar solvents (e.g., ethanol, water), rather than flavonoid aglycons, phenolic acids, and some phenolic terpenes, which are effectively extracted by non-polar solvents (e.g., CO2) [56].
Moreover, the order of increasing chlorophyll content was as follows: SFE, SLE, MAE, and SFE+10% ethanol (Figure 5c). A polar solvent choice is considered suitable for the extraction of chlorophylls [61], even when added during SFE in typically low concentrations [62]. Therefore, all methods presented higher chlorophyll content than SFE, which utilizes the non-polar CO2.
In terms of the selected and total carotenoid content, the increasing order was as follows: SLE, MAE, SFE, and SFE+10% ethanol (Figure 5d,e). The combination of the non-polar CO2 and the polar ethanol (SFE+10% ethanol) improved the extraction of the corresponding non-polar hydrocarbons (e.g., β-carotene) and the more polar xanthophylls (e.g., astaxanthin, lutein) [63]. It is also observed that β-carotene recovery was justifiably not favored during SLE and MAE, but remarkably improved during SFE and SFE+10% ethanol.
The extract’s antioxidant activity, which is inversely proportional to IC50 value, presented the same increasing order with carotenoid content (Figure 5f). Carotenoids are considered strong antioxidants [64]. Moreover, antioxidant activity may be favored in the presence of high chlorophyll content [65]. Therefore, the SFE+10% ethanol extract with the highest pigment concentration also exhibited the strongest antioxidant activity.
Finally, chlorophyll and carotenoid recovery per unit of biomass was also assessed, given their recognized value as bioactive compounds [66]. Carotenoids, in particular, are associated with particularly high prices ranging from 250 to 2000 USD/kg [67].
According to Figure 6, the SLE resulted in the recovery of 10.07 mg/gbiom chlorophylls (61.81% w/w) and 1.88 mg/gbiom carotenoids (29.19% w/w). The non-conventional MAE is in an advantageous position, achieving the notably highest chlorophyll (19.65 mg/gbiom − 61.81% w/w) and carotenoid (5.21 mg/gbiom − 81.02% w/w) recovery. The alternative SFE led to the lowest chlorophyll recovery (0.44 mg/gbiom − 1.40% w/w), while presenting comparable carotenoid content with SLE (1.60 mg/gbiom − 24.89% w/w). However, cosolvent addition during SFE notably improved pigment recovery (chlorophylls: 16.46 mg/gbiom − 51.77% w/w, carotenoids: 4.82 mg/gbiom − 74.94% w/w), making the extraction method superior to SLE and competitive with MAE.
In conclusion, SLE was satisfyingly efficient, yet provided a less competitive extract regarding the examined biocomponents and antioxidant activity. The MAE was considered as a more efficient method in terms of all the examined responses and duration compared to SLE. Moreover, SFE was the least efficient regarding extraction yield and chlorophyll content, yet led to a carotenoid-rich extract of improved antioxidant activity and odor. Finally, the cosolvent addition remarkably improved SFE yield and led to the best extract in terms of quality, i.e., bioactive components content and antioxidant activity.

4. Conclusions

In the current work, an effect study of crucial extraction parameters was conducted on conventional, microwave-assisted, and supercritical fluid extraction of the microalga S. obliquus in terms of yield, extracts’ bioactive content, namely phenolics, chlorophylls, and carotenoids, and antioxidant activity. The effect study data were associated, and, thus, all the extraction methods were optimized under the requirement that all the successfully correlated responses concurrently attain optimal values. The optimal extraction conditions were: 30 °C, 24 h, and 90 mLsolv/gbiom for SLE; 60 °C, 5 min, 90 mLsolv/gbiom, and 300 W for MAE; and 60 °C, 250 bar, and 40 gsolv/min for SFE.
Additionally, a kinetic study of SFE was conducted under representative conditions. The Sovová model successfully described the supercritical fluid extraction curves of S. obliquus. These findings could be considered valuable for simulation and scale-up purposes, yet accurate assessments require the determination of additional terms (e.g., characteristic size of biomass and extraction bed).
Furthermore, the comparison between SLE, MAE, and SFE with and without cosolvent addition (10% w/w ethanol) was also conducted. The short MAE was more efficient in terms of all the examined responses compared to SLE, which led to the extract of the lowest quality. Moreover, SFE presented the lowest yield and chlorophyll content among all methods, yet led to a carotenoid-rich extract of improved antioxidant activity and odor. Finally, the cosolvent addition significantly improved SFE yield and led to the most qualitative extract.
In conclusion, both non-conventional MAE and SFE are considered promising methods as they led to superior extracts compared to SLE. SFE’s extract quality was superior to MAE’s; however, both methods led to the comparative recovery of total pigments. Therefore, both MAE and SFE products could be employed in the demanding fields of food, health, and cosmetic industries.

Supplementary Materials

The following supporting information can be downloaded at: https://www.mdpi.com/article/10.3390/separations10050290/s1, Figure S1: The Pareto chart for the analysis of SLE’s (a) yield, and extract’s total (b) phenolic, (c) chlorophyll and (d) carotenoid content, and (e) index of antioxidant activity. Orange and blue columns indicate positive and negative effects, respectively; Figure S2: Experimental versus predicted values of SLE’s (a) yield, and extract’s total (b) phenolic, (c) chlorophyll and (d) carotenoid content, and (e) index of antioxidant activity. The error bars stand for the experimental error; Figure S3: The Pareto chart for the analysis of MAE’s (a) yield, and (b) extract’s index of antioxidant activity. Orange and blue columns indicate positive and negative effects, respectively; Figure S4: Experimental versus predicted values of MAE’s (a) yield, and (b) extract’s index of antioxidant activity. The error bars stand for the experimental error; Figure S5: The Pareto chart for the analysis of SFE’s (a) yield, and extract’s (b) phenolic, (c) chlorophyll content, (d) selected and (e) total carotenoid content, and (f) index of antioxidant activity. Orange and blue columns indicate positive and negative effects, respectively; Figure S6: Experimental versus predicted values of SFE’s (a) yield, and extract’s (b) phenolic, (c) chlorophyll, (d) selected and (e) total carotenoid content, and (f) index of antioxidant activity. The error bars stand for the experimental error; Table S1: The main ANOVA results and adequacy measures of the successfully correlated responses examined for the SLE of S. obliquus; Table S2: The main ANOVA results and adequacy measures of the successfully correlated responses examined for the MAE of S. obliquus; Table S3: The main ANOVA results and adequacy measures of the successfully correlated responses examined for the SFE of S. obliquus.

Author Contributions

Conceptualization, K.M.; methodology, I.G.; software, I.G.; validation, I.G., V.L. and K.M.; investigation, I.G.; data curation, I.G., V.L. and K.M.; writing—original draft preparation, I.G.; writing—review and editing, V.L. and K.M.; supervision, K.M.; project administration, K.M. All authors have read and agreed to the published version of the manuscript.

Funding

The implementation of the doctoral thesis of the author Ioulia Georgiopoulou was co-financed by Greece and the European Union (European Social Fund-ESF) through the Operational Program “Human Resources Development, Education and Lifelong Learning” in the context of the Act “Enhancing Human Resources Research Potential by undertaking a Doctoral Research” Sub-action 2: IKY Scholarship Program for PhD candidates in Greek Universities.

Data Availability Statement

Additional data for this study are not available on any public database, the corresponding author can provide them upon request.

Conflicts of Interest

The authors declare no conflict of interest.

References

  1. Martins, R.; Sales, H.; Pontes, R.; Nunes, J.; Gouveia, I. Food Wastes and Microalgae as Sources of Bioactive Compounds and Pigments in a Modern Biorefinery: A Review. Antioxidants 2023, 12, 328. [Google Scholar] [CrossRef]
  2. Priefer, C.; Jörissen, J.; Frör, O. Pathways to shape the bioeconomy. Resources 2017, 6, 10. [Google Scholar] [CrossRef]
  3. Vale, M.A.; Ferreira, A.; Pires, J.C.; Gonçalves, A.L. CO2 capture using microalgae. In Advances in Carbon Capture; Elsevier: Amsterdam, The Netherlands, 2020; pp. 381–405. [Google Scholar] [CrossRef]
  4. Koyande, A.K.; Chew, K.W.; Rambabu, K.; Tao, Y.; Chu, D.-T.; Show, P.-L. Microalgae: A potential alternative to health supplementation for humans. Food Sci. Hum. Wellness 2019, 8, 16–24. [Google Scholar] [CrossRef]
  5. de Morais, M.G.; Vaz, B.d.S.; de Morais, E.G.; Costa, J.A.V. Biologically active metabolites synthesized by microalgae. BioMed Res. Int. 2015, 2015, 835761. [Google Scholar] [CrossRef] [PubMed]
  6. Ampofo, J.; Abbey, L. Microalgae: Bioactive composition, health benefits, safety and prospects as potential high-value ingredients for the functional food industry. Foods 2022, 11, 1744. [Google Scholar] [CrossRef] [PubMed]
  7. Udayan, A.; Pandey, A.K.; Sirohi, R.; Sreekumar, N.; Sang, B.-I.; Sim, S.J.; Kim, S.H.; Pandey, A. Production of microalgae with high lipid content and their potential as sources of nutraceuticals. Phytochem. Rev. 2022, 21, 1–28. [Google Scholar] [CrossRef]
  8. Saratale, R.G.; Ponnusamy, V.; Sirohi, R.; Piechota, G.; Shobana, S.; Dharmaraja, J.; Lay, C.h.; Saratale, G.D.; Shin, H.S.; Veermuthu, A. Microalgae cultivation strategies using cost–effective nutrient sources: Recent updates and progress towards biofuel production. Bioresour. Technol. 2022, 361, 127691. [Google Scholar] [CrossRef]
  9. Khatoon, H.; Rahman, N.A.; Suleiman, S.S.; Banerjee, S.; Abol-Munafi, A.B. Growth and proximate composition of Scenedesmus obliquus and Selenastrum bibraianum cultured in different media and condition. Proc. Natl. Acad. Sci. India Sect. B Biol. Sci. 2019, 89, 251–257. [Google Scholar] [CrossRef]
  10. Zaharieva, M.M.; Zheleva-Dimitrova, D.; Rusinova-Videva, S.; Ilieva, Y.; Brachkova, A.; Balabanova, V.; Gevrenova, R.; Kim, T.C.; Kaleva, M.; Georgieva, A. Antimicrobial and antioxidant potential of Scenedesmus obliquus microalgae in the context of integral biorefinery concept. Molecules 2022, 27, 519. [Google Scholar] [CrossRef]
  11. Gilbert-López, B.; Mendiola, J.A.; van den Broek, L.A.M.; Houweling-Tan, B.; Sijtsma, L.; Cifuentes, A.; Herrero, M.; Ibáñez, E. Green compressed fluid technologies for downstream processing of Scenedesmus obliquus in a biorefinery approach. Algal Res. 2017, 24, 111–121. [Google Scholar] [CrossRef]
  12. Kapoore, R.V.; Butler, T.O.; Pandhal, J.; Vaidyanathan, S. Microwave-assisted extraction for microalgae: From biofuels to biorefinery. Biology 2018, 7, 18. [Google Scholar] [CrossRef] [PubMed]
  13. Silva, M.E.T.; Martins, M.A.; Leite, M.O.; Milião, G.L.; Coimbra, J.S.R. Microalga Scenedesmus obliquus: Extraction of bioactive compounds and antioxidant activity. Rev. Ciência Agronômica 2021, 52, 1–8. [Google Scholar] [CrossRef]
  14. Tzima, S.; Georgiopoulou, I.; Louli, V.; Magoulas, K. Recent Advances in Supercritical CO2 Extraction of Pigments, Lipids and Bioactive Compounds from Microalgae. Molecules 2023, 28, 1410. [Google Scholar] [CrossRef] [PubMed]
  15. Ventura, S.; Nobre, B.; Ertekin, F.; Hayes, M.; Garciá-Vaquero, M.; Vieira, F.; Koc, M.; Gouveia, L.; Aires-Barros, M.; Palavra, A. Extraction of value-added compounds from microalgae. In Microalgae-Based Biofuels and Bioproducts; Woodhead: Sawston, UK, 2017; pp. 461–483. [Google Scholar] [CrossRef]
  16. Vieira, B.B.; Soares, J.; Amorim, M.L.; Bittencourt, P.V.Q.; de Cássia Superbi, R.; de Oliveira, E.B.; dos Reis Coimbra, J.S.; Martins, M.A. Optimized extraction of neutral carbohydrates, crude lipids and photosynthetic pigments from the wet biomass of the microalga Scenedesmus obliquus BR003. Sep. Purif. Technol. 2021, 269, 118711. [Google Scholar] [CrossRef]
  17. Getachew, A.T.; Jacobsen, C.; Holdt, S.L. Emerging technologies for the extraction of marine phenolics: Opportunities and challenges. Mar. Drugs 2020, 18, 389. [Google Scholar] [CrossRef]
  18. Kataoka, H. Pharmaceutical Analysis| sample preparation. In Encyclopedia of Analytical Science; Elsevier: Amsterdam, The Netherlands, 2019. [Google Scholar] [CrossRef]
  19. Span, R.; Wagner, W. A new equation of state for carbon dioxide covering the fluid region from the triple-point temperature to 1100 K at pressures up to 800 MPa. J. Phys. Chem. Ref. Data 1996, 25, 1509–1596. [Google Scholar] [CrossRef]
  20. Nikolai, P.; Rabiyat, B.; Aslan, A.; Ilmutdin, A. Supercritical CO2: Properties and technological applications-a review. J. Therm. Sci. 2019, 28, 394–430. [Google Scholar] [CrossRef]
  21. Khaw, K.-Y.; Parat, M.-O.; Shaw, P.N.; Falconer, J.R. Solvent supercritical fluid technologies to extract bioactive compounds from natural sources: A review. Molecules 2017, 22, 1186. [Google Scholar] [CrossRef]
  22. Sovová, H. Rate of the vegetable oil extraction with supercritical CO2—I. Modelling of extraction curves. Chem. Eng. Sci. 1994, 49, 409–414. [Google Scholar] [CrossRef]
  23. Sovová, H.; Kučera, J.; Jež, J. Rate of the vegetable oil extraction with supercritical CO2—II. Extraction of grape oil. Chem. Eng. Sci. 1994, 49, 415–420. [Google Scholar] [CrossRef]
  24. Cha, K.H.; Lee, H.J.; Koo, S.Y.; Song, D.-G.; Lee, D.-U.; Pan, C.-H. Optimization of pressurized liquid extraction of carotenoids and chlorophylls from Chlorella vulgaris. J. Agric. Food Chem. 2010, 58, 793–797. [Google Scholar] [CrossRef] [PubMed]
  25. Papamichail, I.; Louli, V.; Magoulas, K. Supercritical fluid extraction of celery seed oil. J. Supercrit. Fluids 2000, 18, 213–226. [Google Scholar] [CrossRef]
  26. Georgiopoulou, I.; Tzima, S.; Pappa, G.D.; Louli, V.; Voutsas, E.; Magoulas, K. Experimental Design and Optimization of Recovering Bioactive Compounds from Chlorella vulgaris through Conventional Extraction. Molecules 2021, 27, 29. [Google Scholar] [CrossRef] [PubMed]
  27. Drosou, C.; Kyriakopoulou, K.; Bimpilas, A.; Tsimogiannis, D.; Krokida, M. A comparative study on different extraction techniques to recover red grape pomace polyphenols from vinification byproducts. Ind. Crops Prod. 2015, 75, 141–149. [Google Scholar] [CrossRef]
  28. Jeffrey, S.W.; Mantoura, R.F.C.; Wright, S.W. Phytoplankton Pigments in Oceanography: Monographs on Oceanographic Methodology; United Nations Educational, Scientific and Cultural Organizations: Paris, France, 1997. [Google Scholar]
  29. Jeffrey, S.W.; Humphrey, G.F. New spectrophotometric equations for determining chlorophylls a, b, c1 and c2 in higher plants, algae and natural phytoplankton. Biochem. Und Physiol. Der Pflanz. 1975, 167, 191–194. [Google Scholar] [CrossRef]
  30. Laina, K.M.; Eleni, P.N.; Tsitseli, K.G.; Krokida, M.K. Process Design for the Extraction of Bioactive Compounds from Several Mediterranean Medicinal Plants. Chem. Eng. Trans. 2021, 86, 1327–1332. [Google Scholar] [CrossRef]
  31. Georgiopoulou, I.; Tzima, S.; Louli, V.; Magoulas, K. Process Optimization of Microwave-Assisted Extraction of Chlorophyll, Carotenoid and Phenolic Compounds from Chlorella vulgaris and Comparison with Conventional and Supercritical Fluid Extraction. Appl. Sci. 2023, 13, 2740. [Google Scholar] [CrossRef]
  32. Stramarkou, M.; Papadaki, S.; Kyriakopoulou, K.; Krokida, M. Effect of drying and extraction conditions on the recovery of bioactive compounds from Chlorella vulgaris. J. Appl. Phycol. 2017, 29, 2947–2960. [Google Scholar] [CrossRef]
  33. Reverchon, E.; Marrone, C. Supercritical extraction of clove bud essential oil: Isolation and mathematical modeling. Chem. Eng. Sci. 1997, 52, 3421–3428. [Google Scholar] [CrossRef]
  34. Mouahid, A.; Crampon, C.; Toudji, S.-A.A.; Badens, E. Supercritical CO2 extraction of neutral lipids from microalgae: Experiments and modelling. J. Supercrit. Fluids 2013, 77, 7–16. [Google Scholar] [CrossRef]
  35. Strati, I.F.; Oreopoulou, V. Effect of extraction parameters on the carotenoid recovery from tomato waste. Int. J. Food Sci. Technol. 2011, 46, 23–29. [Google Scholar] [CrossRef]
  36. Radojković, M.; Zeković, Z.; Jokić, S.; Vidović, S.; Lepojević, Ž.; Milošević, S. Optimization of solid-liquid extraction of antioxidants from black mulberry leaves by response surface methodology. Food Technol. Biotechnol. 2012, 50, 167–176. [Google Scholar]
  37. Tchabo, W.; Ma, Y.; Kwaw, E.; Xiao, L.; Wu, M.; Apaliya, M.T. Impact of extraction parameters and their optimization on the nutraceuticals and antioxidant properties of aqueous extract mulberry leaf. Int. J. Food Prop. 2018, 21, 717–732. [Google Scholar] [CrossRef]
  38. Mäki-Arvela, P.; Hachemi, I.; Murzin, D.Y. Comparative study of the extraction methods for recovery of carotenoids from algae: Extraction kinetics and effect of different extraction parameters. J. Chem. Technol. Biotechnol. 2014, 89, 1607–1626. [Google Scholar] [CrossRef]
  39. Xiao, W.; Han, L.; Shi, B. Optimization of microwave-assisted extraction of flavonoid from Radix Astragali using response surface methodology. Sep. Sci. Technol. 2008, 43, 671–681. [Google Scholar] [CrossRef]
  40. Destandau, E.; Michel, T.; Elfakir, C. Microwave-assisted extraction. In Natural Product Extraction: Principles and Applications; Rostagno, M.A., Prado, J.M., Eds.; The Royal Society of Chemistry: London, UK, 2013; Volume 4. [Google Scholar] [CrossRef]
  41. Shang, A.; Luo, M.; Gan, R.-Y.; Xu, X.-Y.; Xia, Y.; Guo, H.; Liu, Y.; Li, H.-B. Effects of microwave-assisted extraction conditions on antioxidant capacity of sweet tea (Lithocarpus polystachyus Rehd.). Antioxidants 2020, 9, 678. [Google Scholar] [CrossRef]
  42. Bachtler, S.; Bart, H.-J. Increase the yield of bioactive compounds from elder bark and annatto seeds using ultrasound and microwave assisted extraction technologies. Food Bioprod. Process. 2021, 125, 1–13. [Google Scholar] [CrossRef]
  43. Nguyen, N.H.K.; An, N.T.D.; Anh, P.K.; Truc, T.T. Microwave-assisted extraction of chlorophyll and polyphenol with antioxidant activity from Pandanus amaryllifolius Roxb. in Vietnam. In Proceedings of the IOP Conference Series: Materials Science and Engineering, Coimbatore, India, 8–9 April 2021; p. 012039. [Google Scholar] [CrossRef]
  44. Zheng, X.; Xu, X.; Liu, C.; Sun, Y.; Lin, Z.; Liu, H. Extraction characteristics and optimal parameters of anthocyanin from blueberry powder under microwave-assisted extraction conditions. Sep. Purif. Technol. 2013, 104, 17–25. [Google Scholar] [CrossRef]
  45. Pan, B.; Lei, J.; Zhang, L.; Guo, Y. Research on the physical properties of supercritical CO2 and the log evaluation of CO2-bearing volcanic reservoirs. J. Geophys. Eng. 2017, 14, 1052–1060. [Google Scholar] [CrossRef]
  46. Machmudah, S.; Kawahito, Y.; Sasaki, M.; Goto, M. Process optimization and extraction rate analysis of carotenoids extraction from rosehip fruit using supercritical CO2. J. Supercrit. Fluids 2008, 44, 308–314. [Google Scholar] [CrossRef]
  47. Mendes, R.L.; Coelho, J.P.; Fernandes, H.L.; Marrucho, I.J.; Cabral, J.M.S.; Novais, J.M.; Palavra, A.F. Applications of supercritical CO2 extraction to microalgae and plants. J. Chem. Technol. Biotechnol. Int. Res. Process Environ. Clean Technol. 1995, 62, 53–59. [Google Scholar] [CrossRef]
  48. Georgiopoulou, I.; Tzima, S.; Louli, V.; Magoulas, K. Supercritical CO2 Extraction of High-Added Value Compounds from Chlorella vulgaris: Experimental Design, Modelling and Optimization. Molecules 2022, 27, 5884. [Google Scholar] [CrossRef] [PubMed]
  49. Guedes, A.C.; Gião, M.S.; Matias, A.A.; Nunes, A.V.M.; Pintado, M.E.; Duarte, C.M.M.; Malcata, F.X. Supercritical fluid extraction of carotenoids and chlorophylls a, b and c, from a wild strain of Scenedesmus obliquus for use in food processing. J. Food Eng. 2013, 116, 478–482. [Google Scholar] [CrossRef]
  50. Lorenzen, J.; Igl, N.; Tippelt, M.; Stege, A.; Qoura, F.; Sohling, U.; Brück, T. Extraction of microalgae derived lipids with supercritical carbon dioxide in an industrial relevant pilot plant. Bioprocess Biosyst. Eng. 2017, 40, 911–918. [Google Scholar] [CrossRef]
  51. Taher, H.; Al-Zuhair, S.; Al-Marzouqi, A.H.; Haik, Y.; Farid, M. Mass transfer modeling of Scenedesmus sp. lipids extracted by supercritical CO2. Biomass Bioenergy 2014, 70, 530–541. [Google Scholar] [CrossRef]
  52. Kumoro, A.C.; Hasan, M. Supercritical carbon dioxide extraction of andrographolide from Andrographis paniculata: Effect of the solvent flow rate, pressure, and temperature. Chin. J. Chem. Eng. 2007, 15, 877–883. [Google Scholar] [CrossRef]
  53. Da Silva, R.P.; Rocha-Santos, T.A.; Duarte, A.C. Supercritical fluid extraction of bioactive compounds. TrAC Trends Anal. Chem. 2016, 76, 40–51. [Google Scholar] [CrossRef]
  54. Perez-Vega, S.; Salmeron, I.; Perez-Reyes, I.; Kwofie, E.; Ngadi, M. Influence of the Supercritical Fluid Extraction (SFE) on Food Bioactives. In Retention of Bioactives in Food Processing; Springer: Cham, Switzerland, 2022; pp. 309–340. [Google Scholar] [CrossRef]
  55. Yen, H.-W.; Yang, S.-C.; Chen, C.-H.; Chang, J.-S. Supercritical fluid extraction of valuable compounds from microalgal biomass. Bioresour. Technol. 2015, 184, 291–296. [Google Scholar] [CrossRef]
  56. Galanakis, C.M.; Goulas, V.; Tsakona, S.; Manganaris, G.A.; Gekas, V. A knowledge base for the recovery of natural phenols with different solvents. Int. J. Food Prop. 2013, 16, 382–396. [Google Scholar] [CrossRef]
  57. Mandal, R.; Dutta, G. From photosynthesis to biosensing: Chlorophyll proves to be a versatile molecule. Sens. Int. 2020, 1, 100058. [Google Scholar] [CrossRef]
  58. Augustynska, D.; Jemioła-Rzemińska, M.; Burda, K.; Strzałka, K. Influence of polar and nonpolar carotenoids on structural and adhesive properties of model membranes. Chem. Biol. Interact. 2015, 239, 19–25. [Google Scholar] [CrossRef]
  59. Kavoura, D.; Kyriakopoulou, K.; Papaefstathiou, G.; Spanidi, E.; Gardikis, K.; Louli, V.; Aligiannis, N.; Krokida, M.; Magoulas, K. Supercritical CO2 extraction of Salvia fruticosa. J. Supercrit. Fluids 2019, 146, 159–164. [Google Scholar] [CrossRef]
  60. Watson, S.B. Algal taste and odor. In Algae: Source to Treatment AWWA Manual of Water Supply Practices; AWWA Publishing: Denver, CO, USA, 2010; Volume 57, pp. 329–374. [Google Scholar]
  61. Amin, M.; Chetpattananondh, P.; Khan, M.N.; Mushtaq, F.; Sami, S.K. Extraction and Quantification of Chlorophyll from Microalgae Chlorella sp. In Proceedings of the IOP Conference Series: Materials Science and Engineering, Baleli, Pakistan, 2–3 April 2018; p. 012025. [Google Scholar] [CrossRef]
  62. Morcelli, A.; Cassel, E.; Vargas, R.; Rech, R.; Marcílio, N. Supercritical fluid (CO2+ethanol) extraction of chlorophylls and carotenoids from Chlorella sorokiniana: COSMO-SAC assisted prediction of properties and experimental approach. J. CO2 Util. 2021, 51, 101649. [Google Scholar] [CrossRef]
  63. Zaripheh, S.; Erdman Jr, J.W. Factors that influence the bioavailablity of xanthophylls. J. Nutr. 2002, 132, 531S–534S. [Google Scholar] [CrossRef] [PubMed]
  64. Wang, M.; Tsao, R.; Zhang, S.; Dong, Z.; Yang, R.; Gong, J.; Pei, Y. Antioxidant activity, mutagenicity/anti-mutagenicity, and clastogenicity/anti-clastogenicity of lutein from marigold flowers. Food Chem. Toxicol. 2006, 44, 1522–1529. [Google Scholar] [CrossRef] [PubMed]
  65. Marquez, U.M.L.; Barros, R.M.C.; Sinnecker, P. Antioxidant activity of chlorophylls and their derivatives. Food Res. Int. 2005, 38, 885–891. [Google Scholar] [CrossRef]
  66. Michalak, I.; Chojnacka, K. Algae as production systems of bioactive compounds. Eng. Life Sci. 2015, 15, 160–176. [Google Scholar] [CrossRef]
  67. FiorMarkets. Global Carotenoids Market is Expected to Reach USD 3.59 Billion by 2025: Fior Markets. Available online: https://www.globenewswire.com/news-release/2019/10/15/1929461/0/en/Global-Carotenoids-Market-is-expected-to-reach-USD-3-59-billion-by-2025-Fior-Markets.html (accessed on 5 April 2023).
Figure 1. The effect of temperature, time, and solvent-to-biomass ratio on SLE’s (a) yield, and extract’s (b) total phenolic, (c) chlorophyll, (d) selected, and (e) total carotenoid content, and (f) index of antioxidant activity.
Separations 10 00290 g001aSeparations 10 00290 g001b
Figure 2. The effect of temperature, time, solvent-to-biomass ratio, and microwave power on MAE’s (a) yield, and extract’s (b) total phenolic, (c) chlorophyll, (d) selected, and (e) total carotenoid content, and (f) index of antioxidant activity.
Separations 10 00290 g002aSeparations 10 00290 g002b
Figure 3. The effect of temperature, pressure, and solvent flow rate on SFE’s (a) yield, and extract’s (b) total phenolic, (c) chlorophyll, (d) selected, and (e) total carotenoid content, and (f) index of antioxidant activity.
Separations 10 00290 g003aSeparations 10 00290 g003b
Figure 4. Correlation results of experimental SFE yield data with Sovová’s model versus the specific amount of solvent (kgCO2/ kgbiom). The error bars stand for the experimental error.
Separations 10 00290 g004
Figure 5. Comparison of the examined methods regarding the extraction (a) yield, extract’s (b) total phenolic, (c) chlorophyll, (d) selected, and (e) total carotenoid content, and (f) index of antioxidant activity.
Separations 10 00290 g005
Figure 6. Comparison of the examined methods regarding the (a) chlorophyll and (b) carotenoid recovery from S. obliquus.
Separations 10 00290 g006
Table 1. Nutrient and pigment composition of S. obliquus.
NutrientsValue (%)
Protein52.00
Fat9.70
Carbohydrates7.90
Ash10.10
Moisture3.90
PigmentsValue (mg/gbiom)
Total chlorophylls31.79
Total carotenoids6.43
Table 2. Description of chemicals and reagents.
Chemical NameSupplierOriginCAS-RNPurity
Carbon dioxideTAE Hellas SA Athens Greece124-38-3999.5%
Anhydrous sodium carbonateFisher Scientific International Inc.Pittsburgh
PA, USA
497-19-899.5%
Orthophosphoric acid7664-38-285.4%
Water7732-18-5
Methanol67-56-1≥99.8%
Ethanol64-17-5≥99.8%
Tert-butyl-methyl ether (MTBE)1634-04-4≥99.5%
Ethyl acetate141-78-6≥99.9%
Gallic acid149-91-798%
AstaxanthinAcros Organics BVBAAntwerp,
Belgium
472-61-7≥98%
LuteinExtrasynthese SAS Lyon, France127-40-2≥92%
β-caroteneSigma Aldrich Co.Saint Louis, MO, USA7235-40-799%
2,2-diphenyl-1-picrylhydrazyl (DPPH•)1898-66-495%
Folin–Ciocalteu
reagent
Carlo Erba
Reagents SAS
Milan,
Italy
12111-13-16
Table 3. The adjusted linear gradient of the mobile phase of RP-HPLC.
Time (min)MTBE
(% v/v)
Methanol (% v/v)aq. Phosphoric Acid,
1% v/v (% v/v)
015814
1530664
2380164
2780164
27.115814
3515814
Table 4. Experimental SLE results of S. obliquus, including yield, and extracts’ total phenolic (TPC), chlorophyll (CHL), selected (sel. CAR) and total carotenoid (CAR) content, and index of antioxidant activity (IC50).
RunT
(°C)
t (h)R (mLsolv/gbiom)Yield
(% w/w)
TPC (mgGA/gextr)CHL
(mg/gextr)
sel. CAR (mg/gextr)CAR (mg/gextr)IC50
(mgextr/mgDPPH)
1306204.6215.9372.1212.3215.0258.93
23069010.6119.0466.6812.1815.0856.88
33024207.8921.22101.1710.5316.4948.92
430249010.3323.4797.4613.9418.1738.06
545155513.2713.0683.6612.3113.0156.52
645155514.199.8890.9511.7813.9751.61
745155513.0710.8498.7610.4115.3662.27
86062016.1418.1689.7410.6711.8750.99
96069021.5219.3976.757.8814.7452.86
1060242017.4213.5451.318.8412.0966.29
1160249024.2714.8648.4910.0010.4769.66
Table 5. Experimental MAE results of S. obliquus, including yield, and extracts’ total phenolic (TPC), chlorophyll (CHL), selected (sel. CAR) and total carotenoid (CAR) content, and index of antioxidant activity (IC50).
RunΤ (°C)P (W)R (mLsolv/gbiom)t
(min)
Yield
(% w/w)
TPC
(mgGA/gextr)
CHL
(mg/gextr)
sel. CAR (mg/gextr)CAR
(mg/gextr)
IC50 (mgextr/mgDPPH)
1403002053.4317.4173.3810.8923.6052.83
2408002057.8223.1078.9210.4228.7641.58
3403009058.9122.7094.7715.4328.9147.19
4408009059.5225.9980.2413.6327.2645.58
54030020258.3124.92127.0920.4234.1745.45
64080020256.8521.0979.6812.9838.7528.67
740300902510.4728.0591.5916.5430.7258.64
840800902510.0725.4270.3421.1935.6747.97
950550551515.2126.72113.9511.8422.3444.68
1050550551512.9721.68115.4617.7331.6942.70
1150550551514.2723.1995.9417.8026.7939.10
12603002055.8624.97127.9923.1936.6026.01
136080020512.6125.40100.1816.3928.0037.87
146030090515.1824.13129.4619.3434.3228.88
156080090516.1823.8390.2715.8420.1242.65
1660300202511.3124.4889.2916.8624.7414.45
1760800202512.0529.23105.4919.9429.7052.67
1860300902515.0222.64124.9123.3829.6838.98
1960800902516.7024.0998.0914.7525.9858.46
Table 6. Experimental SFE results of S. obliquus, including yield, and extracts’ total phenolic (TPC), chlorophyll (CHL), selected (sel. CAR), and total carotenoid (CAR) content, and index of antioxidant activity (IC50).
RunΤ (οC)P (bar)F
(gsolv/min)
Cosolvent (% w/w)Yield
(% w/w)
TPC
(mgGA/gextr)
CHL
(mg/gextr)
sel. CAR (mg/gextr)CAR
(mg/gextr)
IC50 (mgextr/mgDPPH)
1401102000.981.930.760.861.14101.74
2401104001.100.782.431.765.33122.77
3402502001.379.359.2220.0628.6543.91
4402504001.6310.077.2320.0223.7848.05
5501803002.905.684.7818.9021.9744.86
6501803002.554.714.1117.5329.6348.05
7501803002.764.114.4618.3925.1939.06
8601102001.972.795.2412.8115.6262.79
9601104002.412.483.407.7219.1178.48
10602502004.2012.069.0025.4431.5125.59
11602504004.2211.0610.5432.0437.9323.18
SFE+10% ethanol6025040109.7517.96168.8137.9049.4315.25
Table 7. Optimum estimated values of the Sovová’s model parameters for the S. obliquus SFE.
RunP (bar)T (°C)F
(g/min)
y r (kgsolute/kgsolv) x 0
(kgsolute/kgsolute-free feed)
x k
(kgsolute/kgsolute-free feed)
Z q ˙ 102 (s−1) W q ˙ 104 (s−1)AAD *
(%)
S – 111060400.00130.0250.0146.665.083.89
S – 225040400.00100.0170.0102.562.464.71
S – 325060200.00210.0440.0262.560.595.09
S – 425060400.00210.0440.0262.562.603.24
* AAD—absolute average deviation between experimental and predicted points (see Equation (9)).
Table 8. The experimental parameters for the compared extraction methods of SLE, MAE, SFE, and SFE+10% ethanol.
ParameterSLEMAESFESFE+10%
Ethanol
Solventaq. Ethanol 90% v/vaq. Ethanol 90% v/vCO2CO2-Ethanol 90/10 w/w
Solvent-to-biomass ratio (mLsolv/gbiom)9090100100
Stirring (rpm)500500n/a *n/a *
Temperature (°C)30606060
Pressure (bar)11250250
Solvent flow rate (g/min)n/a *n/a *4040
Microwave power (Watt)n/a *300n/a *n/a *
Duration (h)240.0836.676.67
* Not applicable.
Disclaimer/Publisher’s Note: The statements, opinions and data contained in all publications are solely those of the individual author(s) and contributor(s) and not of MDPI and/or the editor(s). MDPI and/or the editor(s) disclaim responsibility for any injury to people or property resulting from any ideas, methods, instructions or products referred to in the content.

