
Removal of Ni(II) and Cu(II) in Aqueous Solutions Using Treated Water Hyacinth (Eichhornia crassipes) as Bioadsorbent
 , and
, and
Abstract
:1. Introduction
2. Materials and Methods
2.1. Reagents
2.2. Pretreatment of Water Lily (E. crassipes)
2.3. Adsorption Isotherms
2.4. Batch Dye Removal (Adsorption Kinetics)
2.5. Characterization of Bioadorbent
3. Results and Discussions
3.1. Effect of the Initial Concentration of Metals on Adsorption with WL
3.2. Effect of the Amount of Adsorbent on the Adsorption of Ni(II) and Cu(II)
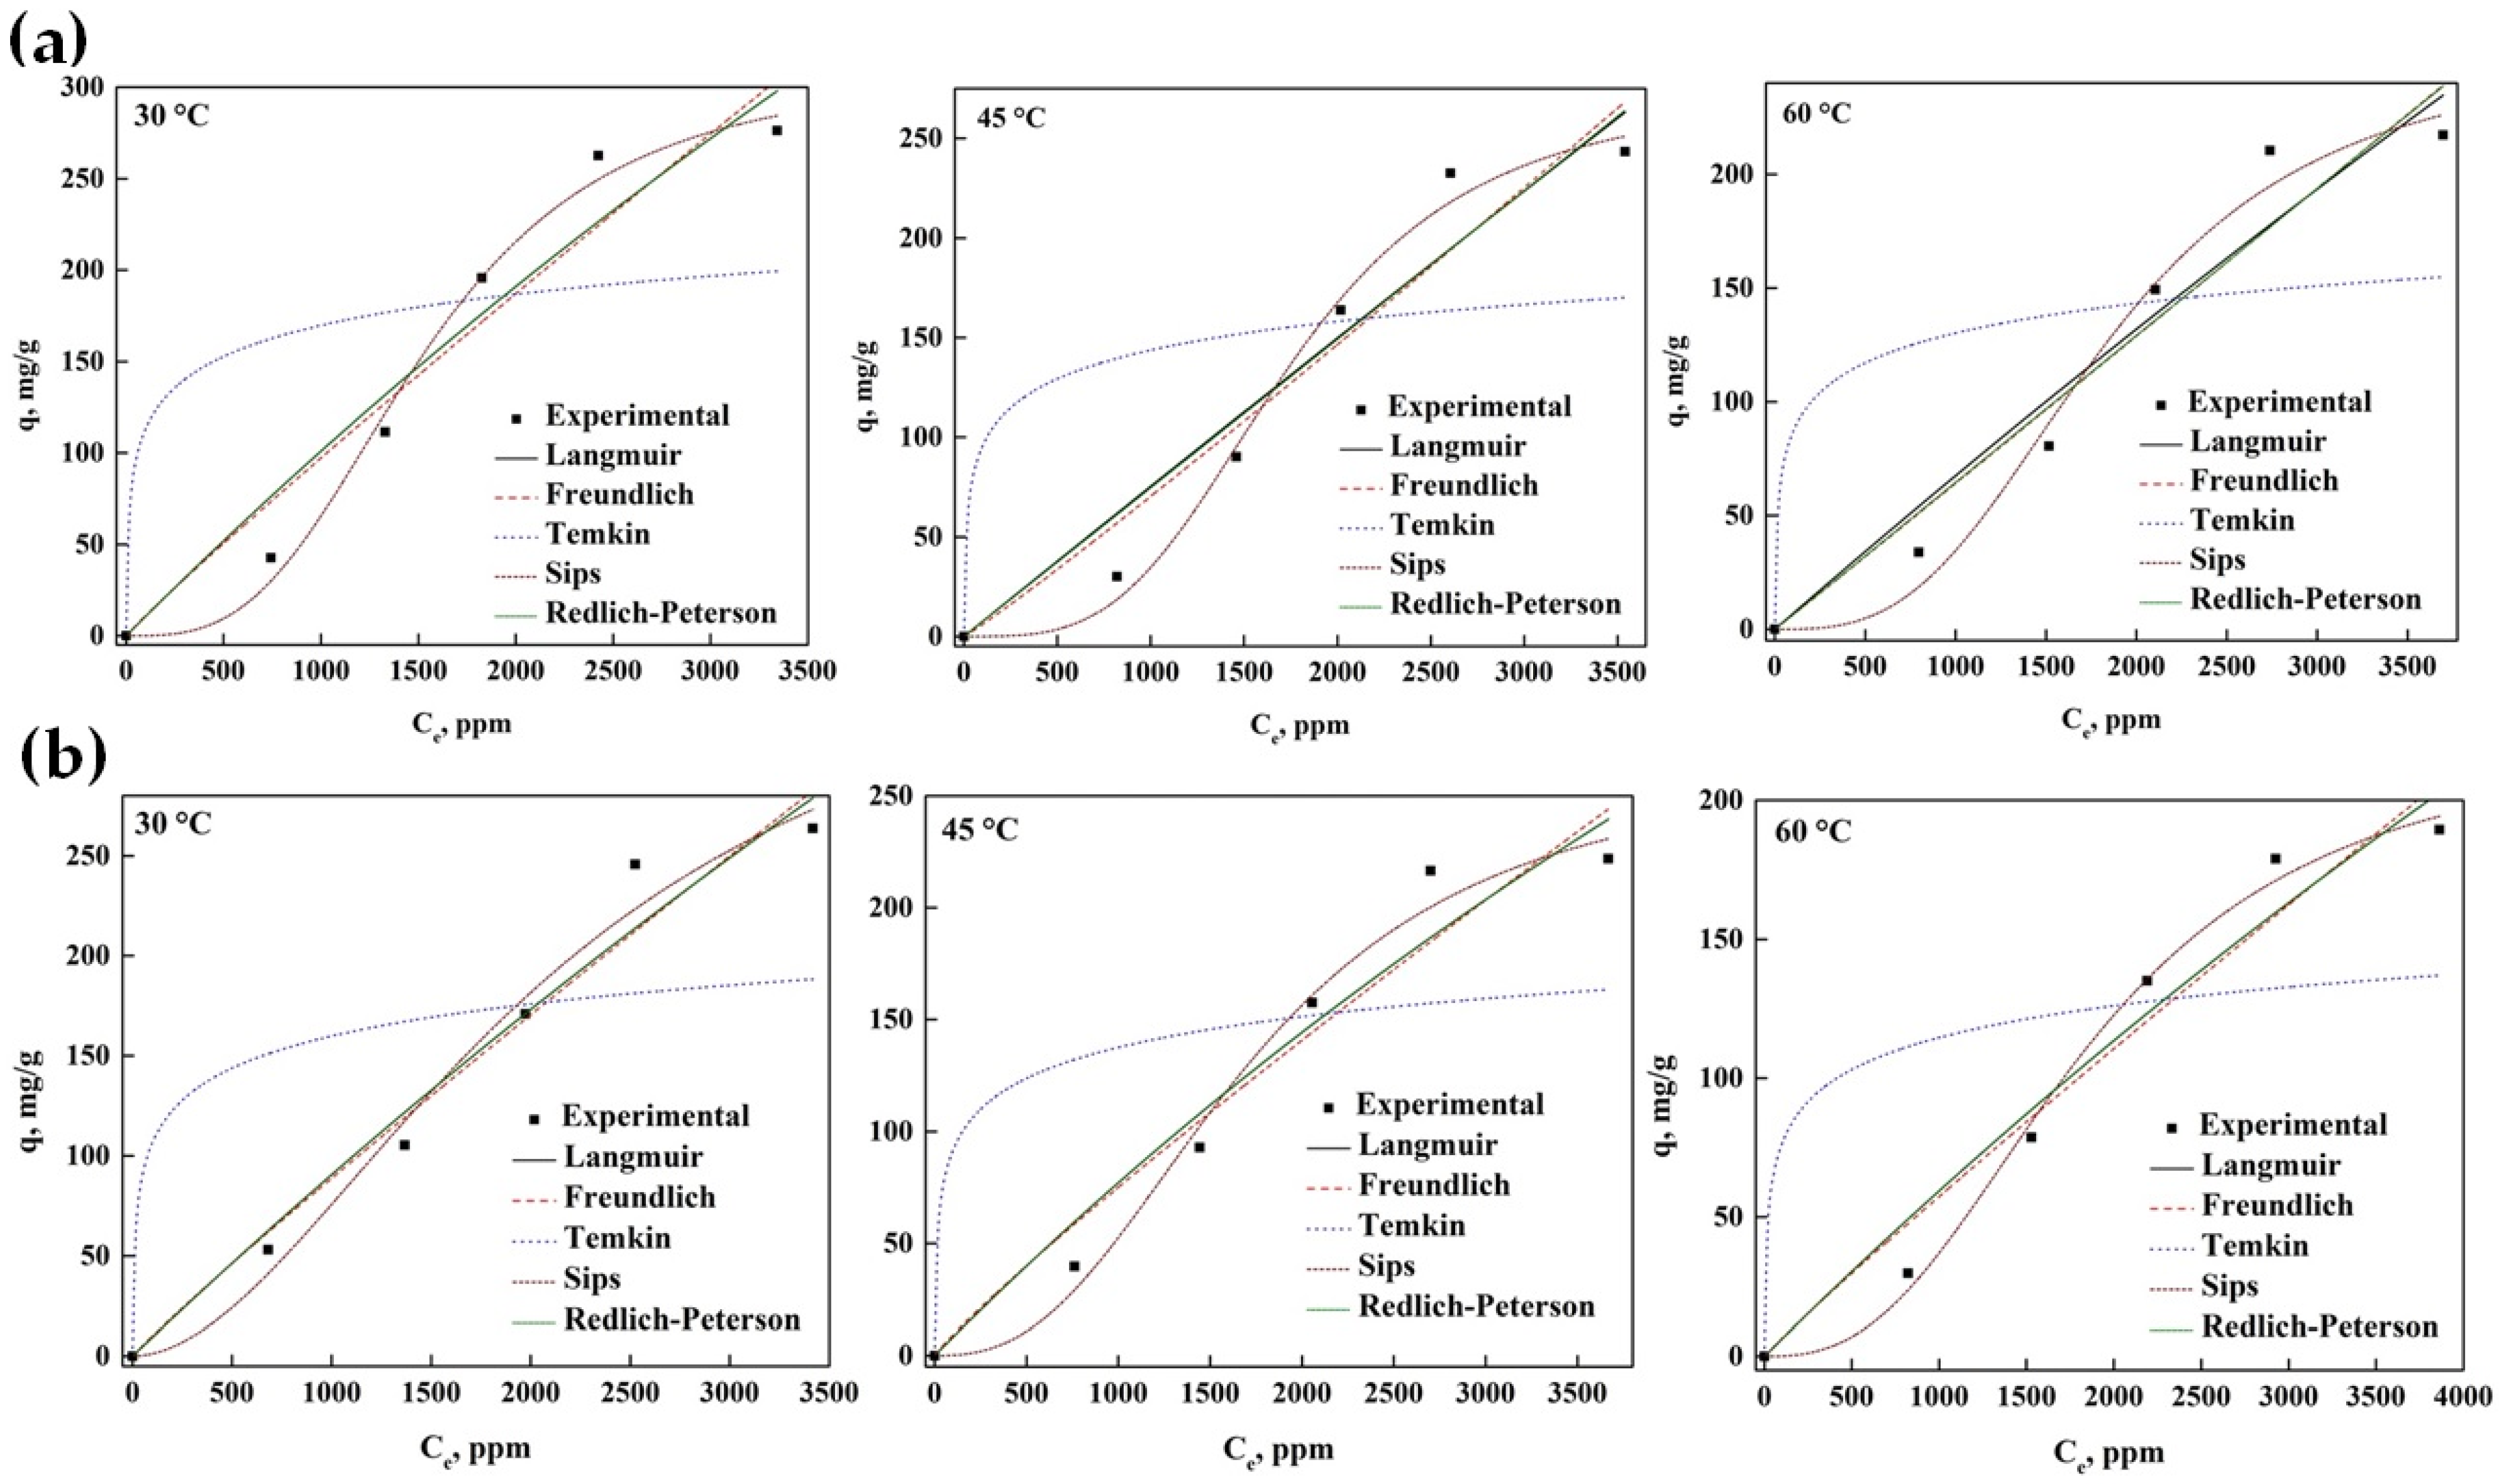
3.3. Ni(II) and Cu(II) Adsorption Isotherms Using WLW and WLN
3.4. Study of the Thermodynamics of Ni and Cu Removal Process in Pretreated WL
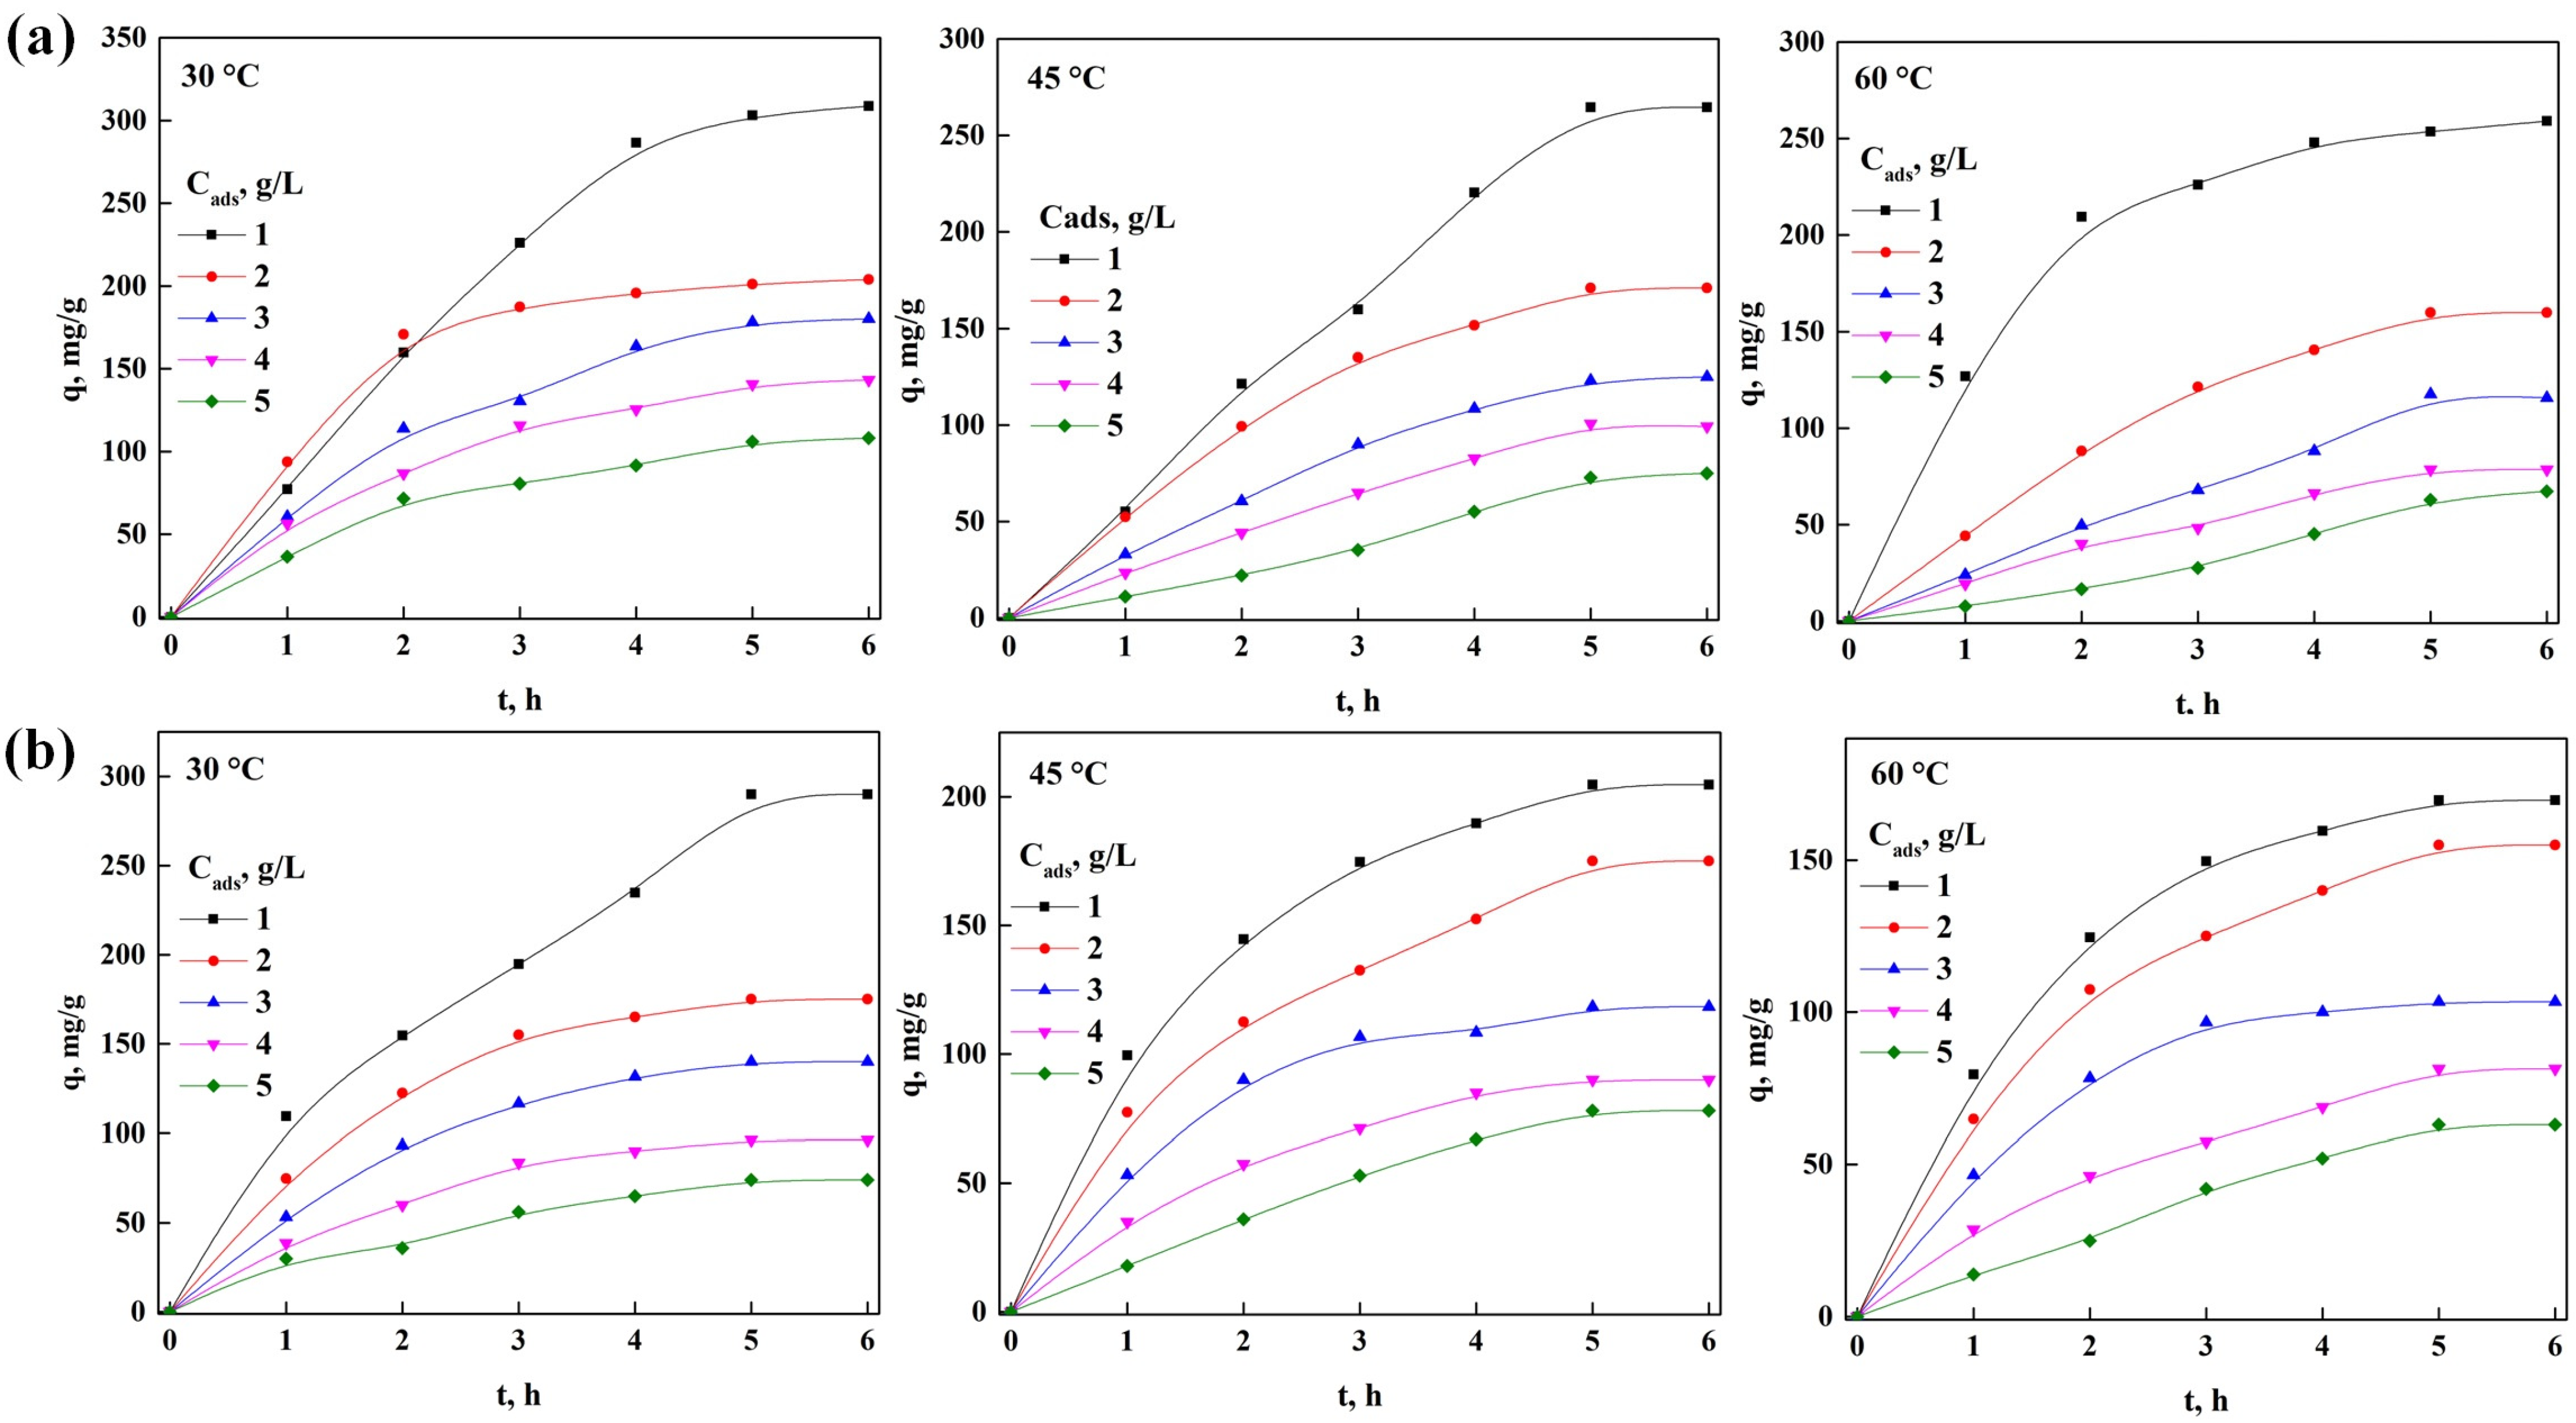
3.5. Effect of Contact Time on Metal Adsorption
3.6. Kinetic Mechanism of Ni(II) and Cu(II) Adsorption
3.7. Characterization of WLW and WLN
4. Conclusions
Supplementary Materials
Author Contributions
Funding
Institutional Review Board Statement
Informed Consent Statement
Data Availability Statement
Acknowledgments
Conflicts of Interest
Sample Availability
References
- Dai, Y.; Sun, O.; Wang, W.; Lu, L.; Liu, M.; Li, J.; Yang, S.; Sun, Y.; Zhang, K.; Xu, J.; et al. Utilizations of agricultural waste as adsorbent for the removal of contaminants: A review. Chemosphere 2018, 211, 235–253. [Google Scholar] [CrossRef] [PubMed]
- Peng, S.-H.; Wang, R.; Yang, L.-Z.; He, L.; He, X.; Liu, X. Biosorption of copper, zinc, cadmium and chromium ions from aqueous solution by natural foxtail millet shell. Ecotoxicol. Environ. Saf. 2018, 165, 61–69. [Google Scholar] [CrossRef] [PubMed]
- Abukhadra, M.R.; Dardir, F.M.; Shaban, M.; Ahmed, E.A.; Soliman, M.F. Superior removal of Co2+, Cu2+ and Zn2+ contaminants from water utilizing spongy Ni/Fe carbonate–fluorapatite; preparation, application and mechanism. Ecotoxicol. Environ. Saf. 2018, 157, 358–368. [Google Scholar] [CrossRef] [PubMed]
- Cao, F.; Lian, C.; Yu, J.; Yang, H.; Lin, S. Study on the adsorption performance and competitive mechanism for heavy metal contaminants removal using novel multi-pore activated carbons derived from recyclable long-root Eichhornia crassipes. Bioresour. Technol. 2019, 276, 211–218. [Google Scholar] [CrossRef]
- Sarkar, M.; Rahman, A.K.M.L.; Bhoumik, N.C. Remediation of chromium and copper on water hyacinth (E. crassipes) shoot powder. Water Resour. Ind. 2017, 17, 1–6. [Google Scholar] [CrossRef]
- Mwaniki, J.M. Adsorption and Its Applications: Using Zinc Adsorption on Water Hyacinth to Elaborate the Kinetics and Thermodynamics of Adsorption, 1st ed.; George, Z.K., Ed.; Intech Open: London, UK, 2019; Chapter 5. [Google Scholar]
- Joseph, L.; Jun, B.-M.; Flora, J.R.V.; Park, C.M.; Yoon, Y. Removal of heavy metals from water sources in the developing world using low-cost materials: A review. Chemosphere 2019, 229, 142–159. [Google Scholar] [CrossRef]
- Maheshwari, U.; Mathesan, B.; Gupta, S. Efficient adsorbent for simultaneous removal of Cu(II), Zn(II) and Cr(VI): Kinetic, thermodynamics and mass transfer mechanism. Process Saf. Environ. Prot. 2015, 98, 198–210. [Google Scholar] [CrossRef]
- Ranasinghe, S.H.; Navaratne, A.N.; Priyantha, N. Enhancement of adsorption characteristics of Cr(III) and Ni(II) by surface modification of jackfruit peel biosorbent. J. Environ. Chem. Eng. 2018, 6, 5670–5682. [Google Scholar] [CrossRef]
- Lacin, D.; Aroguz, A.Z. Kinetic studies on adsorption behavior of methyl orange using modified halloysite, as an eco-friendly adsorbent. SN Appl. Sci. 2020, 2, 2091–2113. [Google Scholar] [CrossRef]
- Márquez, C.O.; García, V.J.; Guaypatin, J.R.; Fernández-Martínez, F.; Ríos, A.C. Cationic and anionic dye adsorption on a natural clayey composite. Appl. Sci. 2021, 11, 5127. [Google Scholar] [CrossRef]
- Amalraj, R.; Ramsenthil, R.; Durai, G.; Jayakumar, R.; Palaniraj, R. Dyes removal using novel sorbents—A review. J. Pharm. Res. Int. 2021, 33, 355–382. [Google Scholar] [CrossRef]
- Nuhoglu, Y.; Malkoc, E. Thermodynamic and kinetic studies for environmentaly friendly Ni(II) biosorption using waste pomace of olive oil factory. Bioresour. Technol. 2009, 100, 2375–2380. [Google Scholar] [CrossRef] [PubMed]
- Asberry, H.B.; Kuo, C.-Y.; Gung, C.-H.; Conte, E.D.; Suen, S.-Y. Characterization of water bamboo husk biosorbents and their application in heavy metal ion trapping. Microchem. J. 2014, 113, 59–63. [Google Scholar] [CrossRef]
- Elbehiry, F.; Darweesh, M.; Al-Anany, F.S.; Khalifa, A.M.; Almashad, A.A.; El-Ramady, H.; El-Banna, A.; Rajput, V.D.; Jatav, H.S.; Elbasiouny, H. Using Biochar and Nanobiochar of Water Hyacinth and Black Tea Waste in Metals Removal from Aqueous Solutions. Sustainability 2022, 14, 10118. [Google Scholar] [CrossRef]
- Zhang, B.; Wu, Y.; Cha, L. Removal of methyl orange dye using activated biochar derived from pomelo peel wastes: Performance, isotherm, and kinetic studies. J. Dispers. Sci. Technol. 2019, 41, 125–136. [Google Scholar] [CrossRef]
- Kadhom, M.; Albayati, N.; Alalwan, H.; Al-Furaiji, M. Removal of dyes by agricultural waste. Sustain. Chem. Pharm. 2020, 16, 100259. [Google Scholar] [CrossRef]
- Kalam, A.; Rahman, L.; Sarker, A.; Ahmed, N.; Mustofa, M.; Awal, A. Efficient removal of toxic textile dye using petiole part (stem) of Nymphaea alba. Pollution 2021, 7, 643–656. [Google Scholar]
- Rashid, N.S.A.; Naim, M.N.; Che Ma, H.; Abu Bakar, N.F.; Mokhtar, M.N. Evaluation of surface water treated with lotus plant; Nelumbo nucifera. J. Environ. Chem. Eng. 2019, 7, 103048. [Google Scholar] [CrossRef]
- Sharma, R.; Saini, H.; Paul, D.R.; Chaudhary, S.; Nehra, S.P. Removal of organic dyes from wastewater using Eichhornia crassipes: A potential phytoremediation option. Environ. Sci. Pollut. Res. 2021, 28, 7116–7122. [Google Scholar] [CrossRef]
- Patel, S. Threats, management and envisaged utilizations of aquatic weed Eichhornia crassipes: An overview. Rev. Environ. Sci. Biotechnol. 2012, 11, 249–259. [Google Scholar] [CrossRef]
- Rezania, S.; Ponraj, M.; Talaiekhozani, A.; Mohamad, S.A.; Md Din, M.F.; Taib, S.M.; Sabbagh, F.; Sairan, F.M. Perspectives of phytoremediation using water hyacinth for removal of heavy metals, organic and inorganic pollutants in wastewater. J. Environ. Manag. 2015, 163, 125–133. [Google Scholar] [CrossRef] [PubMed]
- Tabinda, A.B.; Arif, R.A.; Yasar, A.; Baquir, M.; Rasheed, R.; Ahmood, A.; Iqbal, A. Treatment of textile effluents with Pistia stratiotes, Eichhornia crassipes and Oedogonium sp. Int. J. Phytorem. 2019, 21, 939–943. [Google Scholar] [CrossRef] [PubMed]
- Panneerselvam, B.; Priya, K.S. Phytoremediation potential of water hyacinth in heavy metal removal in chromium and lead contaminated water. Int. J. Environ. Anal. Chem. 2021, 4, 347–353. [Google Scholar] [CrossRef]
- Priya, E.S.; Selvan, P.S. Water hyacinth (Eichhornia crassipes)—An efficient and economic Adsorbent for textile effluent treatment—A review. Arabian J. Chem. 2017, 10, 3548–3558. [Google Scholar] [CrossRef]
- Tsade-Kara, H.; Anshebo, S.T.; Sabir, F.K.; Workineh, G.A. Removal of methylene blue dye from wastewater using periodiated modified nanocellulose. Int. J. Chem. Eng. 2021, 2021, 9965452. [Google Scholar] [CrossRef]
- Prasad, R.; Sharma, D.; Yadav, K.D.; Ibrahim, H. Eichhornia crassipes as biosorbent for industrial wastewater treatment: Equilibrium and kinetic studies. Can. J. Chem. Eng. 2021, 100, 439–450. [Google Scholar] [CrossRef]
- Acosta-Rodríguez, I.; Rodríguez-Pérez, A.; Pacheco Castillo, N.C.; Enríquez-Domínguez, E.; Cárdenas González, J.F.; Martínez-Juárez, V.M. Removal of cobalt (II) from waters contaminated by the biomass of Eichhornia crassipes. Water 2021, 13, 1725. [Google Scholar] [CrossRef]
- Hernández-Origel, C.D.; Patiño-Saldivar, L.; Salazar-Hernández, M.; Nelly Ardila, A.; Talavera-López, A.; Hernández-Soto, R.; Hernández, J. A: Use of Eichhornia crassipes as a Bioadsorbent for the Removal of Methyl Orange and Methylene Blue Present in Residual Solutions. J. Ecol. Eng. 2022, 23, 193–211. [Google Scholar] [CrossRef]
- Patiño-Saldivar, L.; Hernández, J.A.; Ardila, A.; Salazar-Hernández, M.; Talavera, A.; Hernández-Soto, R. Cr (III) Removal Capacity in Aqueous Solution in Relation to the Functional Groups Present in the Orange Peel (Citrus sinensis). Appl. Sci. 2021, 11, 6346. [Google Scholar] [CrossRef]
- López-Ahumada, E.; Salazar-Hernández, M.; Talavera-López, A.; Solis-Marcial, O.J.; Hernández-Soto, R.; Ruelas-Leyva, J.P.; Hernández, J.A. Removal of Anionic and Cationic Dyes Present in Solution Using Biomass of Eichhornia crassipes as Bioadsorbent. Molecules 2022, 27, 6442. [Google Scholar] [CrossRef] [PubMed]
- Obi, C.; Eigbiremonlen, S. Biosorption Characteristics of Water Hyacinth (Eichhornia crassipes) in the Removal of Nickel (II) Ion under Isothermal Condition. Pak. J. Sci. Ind. Res. Ser. A Phys. Sci. 2016, 59, 118–120. [Google Scholar] [CrossRef]
- Annadurai, G.; Juang, R.S.; Lee, D.J. Adsorption of heavy metals from water using banana and orange peels. Water Sci. Technol. 2002, 47, 185–190. [Google Scholar] [CrossRef]
- Boulaiche, W.; Hamdi, B.; Trari, M. Removal of heavy metals by chitin: Equilibrium, kinetic and thermodynamic studies. Appl. Water Sci. 2009, 9, 39–50. [Google Scholar] [CrossRef]
- El Hamidi, A.; Mulongo Masamba, R.; Khachani, M.; Halim, M.; Arsalane, S. Kinetics modeling in liquid phase sorption of copper ions on brushite di-calcium phosphate di-hydrate CaHPO4·2HO (DCPD). Desalin. Water Treat. 2015, 56, 779–791. [Google Scholar] [CrossRef]
- Jacob, J.J.; Varalakshmi, R.; Gargi, S.; Jayasri, M.A.; Suthindhiran, K. Removal of Cr (III) and Ni(II) from tannery effluent using calcium carbonate coated bacterial magnetosomes. NPJ Clean Water 2018, 1, 1. [Google Scholar] [CrossRef]
- Witek-Krowiak, A.; Szafran, R.G.; Modelski, S. Biosorption of heavy metals from aqueous solutions onto peanut shell as a low-cost biosorbent. Desalination 2011, 265, 126–134. [Google Scholar] [CrossRef]
- Zulaicha, A.S. Modification of Activated Carbon fromElaeis GuineensisJacq Shellwith Magnetite (Fe3O4) Particles and StudyAdsorption-Desorption on Ni(II) Ions in Solution. J. Phys. Conf. Ser. 2021, 1751, 012086. [Google Scholar] [CrossRef]
- Yildiz, S. Kinetic and isotherm analysis of Cu(II) adsorption onto almond shell (Prunus dulcis). Ecol. Chem. Eng. S. 2017, 24, 87–106. [Google Scholar] [CrossRef]
- Imran-Shaukat, M.; Wahi, R.; Rosli, N.R.; Aziz, S.M.A.; Ngaini, Z. Chemically modified palm kernel shell biochar for the removal of heavy metals from aqueous solution. In IOP Conference Series: Earth and Environmental Science; IOP Publishing: Bristol, UK, 2021; Volume 765, p. 012019. [Google Scholar]
- Ogbozige, F.J.; Nwobu, H.U. Biosorption of Ni2+ and Cr3+ in synthetic sewage: Adsorption capacities of water hyacinth (Eichhornia crassipes). Environ. Res. Tec. 2021, 4, 342–351. [Google Scholar] [CrossRef]
- Najem, A.M. Evaluation the Biosorption Capacity of Water Hyacinth (Eichhornia crassipes) Root for Some Heavy Metals. Iraqi J. Sci. 2015, 56, 2846–2852. [Google Scholar]
- Okugbawa, A.; Oghenerume, V.; Egbohs, H.O. Biosorption of Selected Heavy Metal Ions from A Multi-Metal Aqueous Solution using Water Hyacinth (Eichhornia crassipes) Root Powder. Int. J. Scient. Eng. Res. 2020, 12, 883–892. [Google Scholar]
- Burevska, K.A.; Memedi, H.; Lisichkov, K.; Kuvendziev, S.; Marinkovski, M.; Ruseska, G.; Grozdanov, A. Biosorption of nickel ions from aqueous solutions by natural and modified peanut husks: Equilibrium and kinetics. Water Environ. J. 2018, 32, 276–284. [Google Scholar] [CrossRef]
- Jahangiri, F.A.; Moutushi, H.T.; Moniruzzaman, M.; Hoque, S.; Hossain, M.E. Removal of lead from aqueous solutions and wastewaters using water hyacinth (Eichhornia crassipes) roots. Water Pract. Technol. 2021, 16, 404–419. [Google Scholar] [CrossRef]
- Yu, S.; Cheng, Y.; Yang, Y. The study of Ni(II) removal from aqueous solution by modified sediment. In IOP Conference Series: Earth and Environmental Science; IOP Publishing: Bristol, UK, 2017; Volume 64, p. 012062. [Google Scholar]
- Shen, Z.; Zhang, Y.; McMillan, O.; Jin, F.; Al-Tabba, A. Characteristics and mechanisms of nickel adsorption on biochars produced from wheat straw pellets and rice husk. Environ. Sci. Pollut. Res. 2017, 24, 12809–12819. [Google Scholar] [CrossRef]
- Qu, W.; He, D.; Guo, Y.; Tang, Y.; Shang, J.; Zhou, L.; Zhu, R.; Song, R.-J. Modified Water Hyacinth Functionalized with Citric Acid as an Effective and Inexpensive Adsorbent for Heavy Metal-Ion Removal. Ind. Eng. Chem. Res. 2019, 58, 18508–18518. [Google Scholar] [CrossRef]
- Yang, J.; Lin, J.; Yu, Q.; Zhong, H.; Liu, Y.; Chen, L. Study on Adsorption of Cu2+ in WasteWater by Residual Sludge as Adsorbent. In IOP Conference Series: Materials Science and Engineering; IOP Publishing: Bristol, UK, 2018; Volume 394, p. 052009. [Google Scholar]
- Li, Q.; Tang, L.; Hu, J.; Jiang, M.; Shi, X.; Zhang, T.; Li, Y.; Pan, X. Removal of toxic metals from aqueous solution by biochars derived from long-root Eichhornia crassipes. R. Soc. Open Sci. 2018, 5, 180966. [Google Scholar] [CrossRef]
- Hernández-Soto, R.; Hernández, R.A.; Ardila-Arias, A.N.; Salazar-Hernández, M. The Use of Industrial Waste for thBioremediation of Water Used in Industrial Processes, 1st ed.; Eyvaz, M., Yüksel, E., Eds.; Intech Open: London, UK, 2020; Chapter 5. [Google Scholar]
- Ouakouak, A.; Rihani, K.; Youcef, L.; Hamdi, N.; Guergazi, S. Adsorption characteristics of Cu(II) onto CaCl2 pretreated algerian bentonite. Mater. Res. Express 2020, 7, 025045. [Google Scholar] [CrossRef]
- Kyzas, G.Z.; Bikiaris, D.N.; Mitropoulos, A.C. Chitosan adsorbents for dye removal: A review. Polym. Int. 2017, 66, 1800–1811. [Google Scholar] [CrossRef]
- Mahamadi, C.; Madocha, B. Adsorptive Removal of Ni(II) from Water Using Alginate-Fixed Water Hyacinth: Effect of Organic Substances. Am. J. Analyt. Chem. 2013, 4, 373–378. [Google Scholar] [CrossRef]
- Asri, N.S.; Suharyadi, E. Preparation of CoFe2O4/SiO2 Magnetic Nanoparticles as Adsorbent of Ni and Cu ions from Aqueous Solution. AIP Conf. Proc. 2020, 2256, 030022. [Google Scholar]
- Bigui, W.; Xiaofei, Z.; Xiabing, C. Facile Preparation of Magnetic Graphene Oxide and Attapulgite Composite Adsorbent for the Adsorption of Ni(II). In IOP Conference Series: Earth and Environmental Science; IOP Publishing: Bristol, UK, 2017; Volume 104, p. 012019. [Google Scholar]
- Eskandari, M.; Zakeri Khatir, M.; Khodadadi Darban, A.; Meshkini, M. Decreasing Ni, Cu, Cd, and Zn heavy metal using magnetite-bentonite nanocomposites and adsorption isotherm study. Mater. Res. Express 2018, 5, 045030. [Google Scholar] [CrossRef]
- Isakov, V.A. Research on the Adsorption of Heavy Metal Ions from Model Solutions by Humic Acids Isolated from Sapropel. In IOP Conference Series: Earth and Environmental Science; IOP Publishing: Bristol, UK, 2021; Volume 852, p. 012039. [Google Scholar]
- Fernane, F.; Boudia, S.; Aiouache, F. Removal Cu(II) and Ni(II) by natural and synthetic hydroxyapatites: A comparative study. Desalin. Water Treat. 2014, 52, 2856–2862. [Google Scholar] [CrossRef]
- Sudha, R.; Srinivasan, K.; Premkumar, P. Removal of nickel(II) from aqueous solution using Citrus Limettioides peel and seed carbon. Ecotoxicol. Environ. Saf. 2015, 117, 115–123. [Google Scholar] [CrossRef] [PubMed]
- Ai, T.; Jiang, X.; Yu, H.; Xu, H.; Pan, D.; Liu, Q.; Chen, D.; Li, J. Equilibrium, kinetic and mechanism studies on the biosorption of Cu2+ and Ni2+ by sulfur-modified bamboo powder. Korean J. Chem. Eng. 2015, 32, 342–349. [Google Scholar] [CrossRef]
- Martins, J.I.; Órfão, J.J.M.; Soares, O.S.G.P. Sorption of Copper, Nickel and Cadmium on Bone Char. Prot. Metals Phys. Chem. Surf. 2017, 53, 618–627. [Google Scholar] [CrossRef]
- Osińska, M. Removal of lead(II), copper(II), cobalt(II) and nickel(II) ions from aqueous solutions using carbon gels. J. Sol.-Gel. Sci. Technol. 2017, 81, 678–692. [Google Scholar] [CrossRef]
- Alwaan, I.M.; Jaleel, M.A.K. Preparation and Characterization of Activated Carbon with (ZnCl2-Activated) from (PET) Bottle Waste for Removal of Metal ions (Cu+2) in Aqueous Solution. In IOP Conference Series: Materials Science and Engineering; IOP Publishing: Bristol, UK, 2021; Volume 1094, p. 012131. [Google Scholar]
- Panadare, D.C.; Lade, V.G.; Rathod, V.K. Adsorptive removal of copper(II) from aqueous solution onto the waste sweet lime peels (SLP): Equilibrium, kinetics and thermodynamics studies. Desalin. Water Treat. 2014, 52, 7822–7837. [Google Scholar] [CrossRef]
- Suratman, A.; Kamalia, N.Z.; Kusumawati, W.A. Adsorption and desorption of Zn(II) and Cu(II) on Ca alginate immobilized activated rice bran. In IOP Conference Series: Materials Science and Engineering; IOP Publishing: Bristol, UK, 2016; Volume 107, p. 012017. [Google Scholar]
- Attia, A.A.; Shouman, M.A.; Khedr, S.A.; El-Nabarawy, T. Removal of Cu(II) and Cd (II) Ions Onto Water Hyacinth Based Carbonaceous Materials. Carbon Sci. 2006, 7, 249–258. [Google Scholar]
- Li, W.C.; Law, F.Y.; Chan, Y.H.M. Biosorption studies on copper (II) and cadmium (II) using pretreated rice straw and rice husk. Environ. Sci. Pollut. Res. 2017, 24, 8903–8915. [Google Scholar] [CrossRef]
- Liang, S.; Guo, X.; Feng, N.; Tian, Q. Adsorption of Cu2+ and Cd2+ from aqueous solution by mercapto-acetic acid modified orange peel. Colloid. Surf. B Biointerf. 2009, 73, 10–14. [Google Scholar]
- Ivanets, A.I.; Srivastava, V.; Kitikova, N.V.; Shashkova, I.L.; Sillanp, M. Kinetic and thermodynamic studies of the Co(II) and Ni(II) ions removal from aqueous solutions by Ca-Mg phosphates. Chemosphere 2017, 171, 348–354. [Google Scholar] [CrossRef] [PubMed]
- da Silva Correia, I.K.; Fonseca Santos, P.; Santos Santana, C.; Neris, J.B.; Luzardo, F.H.M.; Velasco, F.G. Application of coconut shell, banana peel, spent coffee grounds, eucalyptus bark, piassava (Attalea funifera) and water hyacinth (Eichornia crassipes) in the adsorption of Pb2+ and Ni2+ ions in water. J. Environ. Chem. Eng. 2018, 6, 2319–2334. [Google Scholar] [CrossRef]
- de Menezes, E.W.; Lima, E.C.; Royer, B.; de Souza, F.E.; dos Santos, B.D.; Gregório, J.R.; Costa, T.M.H.; Gushikem, Y.; Benvenutti, E.V. Ionic silica based hybrid material containing the pyridinium group used as an adsorbent for textile dye. J. Colloid Interf. Sci. 2012, 378, 10–20. [Google Scholar] [CrossRef] [PubMed]
- Samily, B.; Dargahi, M. Kinetics and Thermodinamics of adsorption of congo red on cellulose. Eur. J. Chem. 2010, 8, 906–912. [Google Scholar]
- Zheng, J.-C.; Feng, H.-M.; Lam, M.H.-W.; Lam, P.K.-S.; Ding, Y.-W.; Yu, H.-Q. Removal of Cu(II) in aqueous media by biosorption using water hyacinth roots as a biosorbent material. J. Hazard. Mater. 2009, 171, 780–785. [Google Scholar] [CrossRef]
- Arim, L.A.; Guzzo, G.; Quina, M.J.; Gando-Ferreira, L.M. Single and binary sorption of Cr(III) and Ni(II) onto modified pine bark. Environ. Sci. Pollut. Res. 2018, 25, 28039–28049. [Google Scholar] [CrossRef]


| Model | Equation | |
|---|---|---|
| Langmuir | qe is equilibrium adsorption capacity (mg/g). Ce is the equilibrium concentration of the metal in the liquid (mg/L). V (L) is the volume of the dye solution. m (g), is the mass of the adsorbent. qm, is the maximum adsorbed capacity (mg/g). KL is the Langmuir constant related to adsorption energy (L/mg). KF is Freundlich constant related to binding energy (mg/g)(L/mg)1/n. n is the constant that is related to the linearity of the adsorption (dimensionless). B is the Temkin constant related to heat of adsorption (kJ/mol). A is a constant in the equilibrium bond. KR and aR are RP constants (L/g) and (L/mg)β, respectively. β is the RP exponent (dimensionless). KS is the Sips constant (L/mg). nS is the Sips exponent (dimensionless). kDR is the activity coefficient related to the adsorption energy (mol/J)2. ε is the Polanyi potential. E is the energy of adsorption | |
| Freundlich | ||
| Temkin | ||
| Redlich–Peterson (RP) | ||
| Dubinin–Radushkevich (DR) | ||
| Sips |
| Model | Equation | |
|---|---|---|
| Pseudo first order (PPO) | qt is the adsorption capacity (mg/g). C0 is the initial concentration of the dye in the liquid (mg/L). V (L) is the volume of the dye solution. m (g) is the mass of the adsorbent. qmax is the maximum adsorbed capacity (mg/g). k1 (1/h) is the speed constant of the PPO model. k2 (g s/mg) is the speed constant of the PSP model. kext is the Avrami constant (h−1). nA reflects the changes of the mechanism during the adsorption process. kInt (mg/g h) is the speed constant of the ID model. kExt (1/h) is the speed constant of the ED model. | |
| Pseudosecond order (PSO) | ||
| Avrami | ||
| Intraparticle diffusion (ID) | ||
| External diffusion (ED) |
| Models | Ni | Cu | ||||
|---|---|---|---|---|---|---|
| T, °C | 30 | 45 | 60 | 30 | 45 | 60 |
| Langmuir | ||||||
| qmax, mg/g | 567.4 | 476.8 | 386.1 | 363.64 | 361.12 | 716.78 |
| KL, L/mg | 0.0001 | 3.5 × 10⁻⁵ | 1 × 10⁻⁶ | 0.0012 | 0.0005 | 1.5 × 10⁻⁴ |
| RL | 0.67–0.91 | 0.88–0.97 | 0.99–1.00 | 0.14–0.45 | 0.29–0.67 | 0.57–0.89 |
| R2 | 0.9302 | 0.9229 | 0.9036 | 0.9776 | 0.9437 | 0.8671 |
| ∆q, % | 34.090 | 40.672 | 43.484 | 8.590 | 18.789 | 34.015 |
| Freundlich | ||||||
| KF, | 0.3836 | 0.1155 | 0.0773 | 6.6101 | 11.105 | 3.7164 |
| n | 1.1550 | 1.0042 | 0.9783 | 2.0940 | 2.7391 | 2.1260 |
| R2 | 0.9229 | 0.9210 | 0.9037 | 0.9710 | 0.9749 | 0.9726 |
| ∆q, % | 19.214 | 19.443 | 18.259 | 10.687 | 7.0881 | 7.0716 |
| Temkin | ||||||
| A | 3.9 × 10⁻¹⁶ | 3.5 × 10⁻¹⁴ | 1.0 × 10⁻¹⁴ | 5.1 × 10⁻¹⁴ | 2.6 × 10⁻¹⁴ | 3.3 × 10⁻¹⁵ |
| B | 32.1691 | 27.7897 | 24.2122 | 30.9096 | 23.2901 | 17.9915 |
| R2 | 0.5789 | 0.5289 | 0.5033 | 0.7953 | 0.8777 | 0.8157 |
| ∆q, % | 12.243 | 14.807 | 15.1834 | 5.1981 | 2.5145 | 5.4477 |
| Sips | ||||||
| qmax, mg/g | 430.79 | 355.22 | 301.65 | 344.39 | 247.47 | 206.61 |
| Ks | 0.0007 | 0.0008 | 0.0006 | 0.0012 | 0.0013 | 0.0009 |
| ns | 2.4118 | 3.5521 | 4.2608 | 1.4119 | 1.1630 | 1.3604 |
| R2 | 0.9567 | 0.9730 | 0.9785 | 0.9946 | 0.9916 | 0.9905 |
| ∆q, % | 8.5114 | 5.0642 | 3.7657 | 6.5693 | 6.8936 | 7.5288 |
| RP | ||||||
| aR | 0.0001 | 0.0002 | 0.0003 | 0.0008 | 0.0012 | 0.0006 |
| KR | 0.1743 | 0.1226 | 0.0983 | 0.3288 | 0.3101 | 0.1548 |
| β | 1.0000 | 0.8806 | 0.7436 | 1.0000 | 1.0000 | 1.0000 |
| R2 | 0.9302 | 0.9222 | 0.9035 | 0.9902 | 0.9910 | 0.9876 |
| ∆q, % | 17.866 | 13.434 | 15.341 | 4.7529 | 2.4373 | 4.9916 |
| DR | ||||||
| qmax, mg/g | 428.98 | 400.55 | 354.91 | 279.25 | 200.87 | 166.39 |
| kDR | 0.3343 | 0.2918 | 0.2155 | 0.0566 | 0.0350 | 0.0286 |
| R2 | 0.8788 | 0.9288 | 0.9423 | 0.8886 | 0.8709 | 0.8845 |
| E, kJ/mol | 1.2230 | 1.3091 | 1.5232 | 2.9722 | 3.7529 | 4.1812 |
| ∆q, % | 8.3567 | 9.5593 | 9.9136 | 2.3351 | 1.9125 | 1.4784 |
| Models | Ni | Cu | ||||
|---|---|---|---|---|---|---|
| T, °C | 30 | 45 | 60 | 30 | 45 | 60 |
| Langmuir | ||||||
| qmax, mg/g | 312.61 | 403.46 | 225.13 | 325.79 | 300.19 | 287.93 |
| KL, L/mg | 0.0009 | 0.00035 | 0.0001 | 0.0009 | 0.0006 | 0.0004 |
| RL | 0.18–0.52 | 0.37–0.74 | 0.67–0.91 | 0.19–0.53 | 0.26–0.64 | 0.33–0.72 |
| R2 | 0.7828 | 0.8535 | 0.7347 | 0.8128 | 0.9550 | 0.9621 |
| ∆q, % | 5.2122 | 17.753 | 1.5812 | 8.5156 | 11.657 | 15.309 |
| Freundlich | ||||||
| KF, | 0.1420 | 0.0467 | 0.0615 | 0.1314 | 0.1419 | 0.0824 |
| n | 1.0581 | 0.9439 | 0.9940 | 1.0604 | 1.1016 | 1.0554 |
| R2 | 0.9393 | 0.9371 | 0.9429 | 0.9689 | 0.9493 | 0.9584 |
| ∆q, % | 16.943 | 16.639 | 14.711 | 15.567 | 14.023 | 12.577 |
| Temkin | ||||||
| A | 5.2 × 10⁻¹⁵ | 1.2 × 10⁻¹⁴ | 1.5 × 10⁻¹³ | 9.3 × 10⁻¹⁶ | 1.7 × 10⁻¹⁴ | 6.5 × 10⁻¹⁴ |
| B | 24.574 | 20.809 | 18.843 | 23.137 | 19.918 | 16.582 |
| R2 | 0.5512 | 0.5101 | 0.5341 | 0.5831 | 0.5735 | 0.5627 |
| ∆q, % | 14.314 | 16.673 | 15.783 | 15.136 | 13.809 | 15.255 |
| Sips | ||||||
| qmax, mg/g | 309.87 | 273.03 | 253.64 | 386.17 | 265.19 | 222.21 |
| Ks | 0.0007 | 0.0006 | 0.0005 | 0.0005 | 0.0006 | 0.0005 |
| ns | 3.0935 | 3.4525 | 3.0194 | 1.8674 | 2.5436 | 2.6258 |
| R2 | 0.9924 | 0.9912 | 0.9840 | 0.9830 | 0.9871 | 0.9951 |
| ∆q, % | 4.8578 | 4.8737 | 6.4329 | 14.182 | 7.2945 | 6.6089 |
| RP | ||||||
| aR | 0.0002 | 0.0001 | 0.0001 | 0.0002 | 0.0015 | 0.0001 |
| KR | 0.1089 | 0.0844 | 0.0754 | 0.0958 | 0.0840 | 0.0630 |
| β | 0.8636 | 0.9054 | 0.9309 | 0.9171 | 0.9208 | 0.9216 |
| R2 | 0.9439 | 0.9358 | 0.9428 | 0.9712 | 0.9545 | 0.9617 |
| ∆q, % | 7.9651 | 52.825 | 12.612 | 7.9567 | 19.085 | 10.931 |
| DR | ||||||
| qmax, mg/g | 328.94 | 304.68 | 271.51 | 314.37 | 261.34 | 221.19 |
| kDR | 0.3515 | 0.3019 | 0.2659 | 0.3150 | 0.3060 | 0.2846 |
| R2 | 0.9682 | 0.9709 | 0.9496 | 0.9089 | 0.9453 | 0.9677 |
| E, kJ/mol | 1.1926 | 1.2869 | 1.3713 | 1.2599 | 1.2783 | 1.3255 |
| ∆q, % | 7.1690 | 9.0071 | 8.9545 | 7.2009 | 6.7331 | 6.2455 |
| Ni | ||||||
|---|---|---|---|---|---|---|
| WLW | WLN | |||||
| T, °C | −∆G, kJ/mol | −∆H, kJ/mol | −∆S, kJ/mol K | −∆G, kJ/mol | −∆H, kJ/mol | −∆S, kJ/mol K |
| 30 | 26.195 | 193.13 | 0.551 | 8.212 | 61.323 | 0.158 |
| 45 | 18.617 | 3.352 | ||||
| 60 | 9.659 | 1.003 | ||||
| Cu | ||||||
| 30 | 26.854 | 58.021 | 0.102 | 13.575 | 22.744 | 0.031 |
| 45 | 25.866 | 12.993 | ||||
| 60 | 23.751 | 12.673 | ||||
| Cads, g/L | 1 | 2 | 3 | 4 | 5 | ||||||||||
|---|---|---|---|---|---|---|---|---|---|---|---|---|---|---|---|
| Model | 30 °C | 45 °C | 60 °C | 30 °C | 45 °C | 60 °C | 30 °C | 45 °C | 60 °C | 30 °C | 45 °C | 60 °C | 30 °C | 45 °C | 60 °C |
| PFO | |||||||||||||||
| qm, mg/g | 262.41 | 408.96 | 482.09 | 209.30 | 202.78 | 200.49 | 206.25 | 171.19 | 260.55 | 156.28 | 166.43 | 120.25 | 118.88 | 90.000 | 70.753 |
| ki, L/mg | 0.7104 | 0.2620 | 0.1441 | 0.7095 | 0.3419 | 0.2945 | 0.3710 | 0.2380 | 0.1055 | 0.4287 | 0.1658 | 0.1909 | 0.4017 | 0.2270 | 0.2514 |
| R2 | 0.9966 | 0.9879 | 0.9880 | 0.9906 | 0.9951 | 0.9939 | 0.9941 | 0.9935 | 0.9857 | 0.9978 | 0.9893 | 0.9888 | 0.9921 | 0.9139 | 0.8608 |
| ∆q% | 6.1249 | 22.268 | 35.269 | 1.0645 | 7.6147 | 10.3706 | 5.9299 | 15.103 | 10.3706 | 3.6861 | 27.644 | 21.665 | 4.0899 | 8.1801 | 2.1210 |
| PSO | |||||||||||||||
| qm, mg/g | 323.87 | 636.45 | 829.46 | 259.68 | 295.17 | 302.13 | 292.02 | 269.41 | 464.83 | 213.42 | 279.91 | 79.753 | 165.26 | 100.00 | 69.753 |
| ki, L/mg | 0.0023 | 0.0003 | 0.0001 | 0.0029 | 0.0009 | 0.0007 | 0.0010 | 0.0006 | 0.0001 | 0.0017 | 0.0004 | 0.0089 | 0.0020 | 0.0027 | 0.0056 |
| R2 | 0.9918 | 0.9849 | 0.9872 | 0.9806 | 0.9920 | 0.9913 | 0.9926 | 0.9917 | 0.9854 | 0.9971 | 0.9884 | 0.8538 | 0.9917 | 0.8527 | 0.7491 |
| ∆q% | 2.0023 | 57.363 | 68.888 | 18.251 | 29.685 | 25.868 | 25.462 | 47.191 | 36.326 | 21.613 | 74.330 | 0.6198 | 21.613 | 13.625 | 1.5140 |
| Elovich | |||||||||||||||
| α | 0.0138 | 0.0072 | 0.0080 | 0.0168 | 0.0143 | 0.0146 | 0.0145 | 0.0182 | 0.0183 | 0.0197 | 0.0217 | 0.0286 | 0.0252 | 0.0000 | 0.0285 |
| β | 508.16 | 237.93 | 177.63 | 380.83 | 150.19 | 130.11 | 169.49 | 94.372 | 74.861 | 152.39 | 69.022 | 56.461 | 105.32 | 3470.4 | 34.475 |
| R2 | 0.9859 | 0.9914 | 0.9831 | 0.9719 | 0.9953 | 0.9957 | 0.9939 | 0.9924 | 0.9719 | 0.9965 | 0.9832 | 0.9837 | 0.9939 | 1.0000 | 0.9268 |
| ∆q% | 40.824 | 40.824 | 40.623 | 40.823 | 40.822 | 39.756 | 40.820 | 40.818 | 37.967 | 40.613 | 40.817 | 39.075 | 40.821 | 40.814 | 40.734 |
| ID | |||||||||||||||
| kint, h−1 | 119.64 | 128.68 | 104.03 | 95.291 | 72.888 | 67.105 | 76.885 | 51.098 | 44.515 | 61.721 | 39.592 | 31.418 | 45.788 | 26.665 | 22.598 |
| R2 | 0.9360 | 0.9508 | 0.9252 | 0.9191 | 0.9736 | 0.9664 | 0.9814 | 0.9577 | 0.9120 | 0.9891 | 0.9349 | 0.9466 | 0.9822 | 0.8343 | 0.7909 |
| ∆q% | 2.0719 | 7.8031 | 7.1285 | 5.8919 | 1.8243 | 1.932 | 1.8676 | 0.0645 | 1.1473 | 1.5511 | 0.9273 | 0.8316 | 1.5511 | 5.1438 | 7.2283 |
| ED | |||||||||||||||
| kext, L/mg | 0.0300 | 0.0334 | 0.0268 | 0.0505 | 0.0381 | 0.0349 | 0.0641 | 0.0406 | 0.0352 | 0.0693 | 0.0423 | 0.0327 | 0.0634 | 0.0357 | 0.0301 |
| R2 | 0.5887 | 0.9238 | 0.9707 | 0.6095 | 0.8871 | 0.9130 | 0.8903 | 0.9458 | 0.9796 | 0.8611 | 0.9704 | 0.9581 | 0.8718 | 0.9753 | 0.9617 |
| ∆q% | 2.7627 | 15.236 | 1.5218 | 2.0945 | 8.0160 | 7.8564 | 7.4510 | 6.2885 | 7.4443 | 7.0181 | 1.0095 | 5.4875 | 7.0180 | 1.1888 | 1.1359 |
| Avrami | |||||||||||||||
| qm, mg/g | 320.56 | 274.20 | 257.85 | 205.34 | 175.78 | 162.04 | 185.13 | 124.97 | 118.54 | 156.28 | 98.531 | 77.699 | 108.75 | 73.995 | 65.657 |
| kA, L/mg | 0.6903 | 0.3065 | 0.2091 | 0.6665 | 0.3727 | 0.3356 | 0.4071 | 0.2828 | 0.1710 | 0.4451 | 0.2235 | 0.2594 | 0.4308 | 0.2222 | 0.1916 |
| nA | 1.0291 | 0.8549 | 0.6894 | 1.0646 | 0.9173 | 0.8776 | 0.9113 | 0.8415 | 0.6168 | 0.9631 | 0.7417 | 0.7359 | 0.9324 | 0.9937 | 0.9243 |
| R2 | 0.9966 | 0.9879 | 0.9880 | 0.9906 | 0.9951 | 0.9939 | 0.9941 | 0.9935 | 0.9857 | 0.9978 | 0.9893 | 0.9888 | 0.9921 | 0.9164 | 0.9024 |
| ∆q% | 1.6968 | 1.4774 | 6.7289 | 0.2720 | 1.1650 | 1.0479 | 1.1422 | 0.0028 | 0.5523 | 0.8607 | 0.2896 | 0.4476 | 0.2627 | 0.5345 | 0.9721 |
| Cads, g/L | 1 | 2 | 3 | 4 | 5 | ||||||||||
|---|---|---|---|---|---|---|---|---|---|---|---|---|---|---|---|
| Model | 30 °C | 45 °C | 60 °C | 30 °C | 45 °C | 60 °C | 30 °C | 45 °C | 60 °C | 30 °C | 45 °C | 60 °C | 30 °C | 45 °C | 60 °C |
| PFO | |||||||||||||||
| qm, mg/g | 354.37 | 211.12 | 175.87 | 185.59 | 186.15 | 163.97 | 153.25 | 122.11 | 108.36 | 105.53 | 98.802 | 96.753 | 88.839 | 121.43 | 116.44 |
| ki, L/mg | 0.2933 | 0.5997 | 0.6142 | 0.5478 | 0.4647 | 0.5060 | 0.4651 | 0.6270 | 0.6297 | 0.4645 | 0.4344 | 0.3219 | 0.3229 | 0.1885 | 0.1417 |
| R2 | 0.9854 | 0.9984 | 0.9995 | 0.9978 | 0.9917 | 0.9978 | 0.9976 | 0.9958 | 0.9950 | 0.9943 | 0.9973 | 0.9945 | 0.9816 | 0.9902 | 0.9861 |
| ∆q% | 9.0739 | 1.2717 | 1.4930 | 2.4629 | 2.6962 | 2.3663 | 3.7680 | 1.2944 | 1.9897 | 3.9201 | 3.9823 | 7.7887 | 8.1726 | 22.707 | 34.633 |
| PSO | |||||||||||||||
| qm, mg/g | 291.77 | 201.77 | 223.06 | 242.07 | 246.77 | 216.25 | 207.47 | 154.88 | 137.48 | 142.61 | 136.44 | 139.68 | 127.91 | 200.66 | 65.765 |
| ki, L/mg | 0.0029 | 0.0071 | 0.0027 | 0.0021 | 0.0017 | 0.0021 | 0.0019 | 0.0040 | 0.0045 | 0.0028 | 0.0027 | 0.0018 | 0.0019 | 0.0006 | 0.0093 |
| R2 | 0.8966 | 0.9456 | 0.9960 | 0.9928 | 0.9952 | 0.9970 | 0.9934 | 0.9905 | 0.9865 | 0.9901 | 0.9948 | 0.9950 | 0.9816 | 0.9888 | 0.8393 |
| ∆q% | 0.2593 | 0.5926 | 12.848 | 11.202 | 15.636 | 16.137 | 19.644 | 12.598 | 13.496 | 19.642 | 21.052 | 29.357 | 29.172 | 64.159 | 1.7939 |
| Elovich | |||||||||||||||
| α | 0.0093 | 0.0162 | 0.0192 | 0.0171 | 0.0175 | 0.0193 | 0.0197 | 0.0275 | 0.0307 | 0.0289 | 0.0305 | 0.0322 | 0.0360 | 0.0276 | 0.0333 |
| β | 258.42 | 323.30 | 267.11 | 231.91 | 210.73 | 191.49 | 155.24 | 185.11 | 162.66 | 108.46 | 96.601 | 72.981 | 69.109 | 55.148 | 42.151 |
| R2 | 0.9795 | 0.9967 | 0.9924 | 0.9900 | 0.9952 | 0.9964 | 0.9918 | 0.9860 | 0.9803 | 0.9889 | 0.9943 | 0.9920 | 0.9745 | 0.9896 | 0.9799 |
| ∆q% | 40.814 | 39.648 | 38.756 | 40.065 | 39.648 | 38,764 | 39.965 | 38.957 | 37.520 | 39.056 | 40.005 | 37.956 | 38.856 | 38.856 | 37.895 |
| ID | |||||||||||||||
| kint, h−1 | 118.74 | 92.634 | 77.573 | 79.358 | 75.749 | 68.529 | 62.239 | 54.116 | 48.034 | 42.843 | 39.587 | 33.885 | 31.168 | 31.433 | 24.805 |
| R2 | 0.9849 | 0.9713 | 0.9613 | 0.9668 | 0.9925 | 0.9824 | 0.9763 | 0.9516 | 0.9423 | 0.9742 | 0.9829 | 0.9875 | 0.9770 | 0.9393 | 0.9203 |
| ∆q% | 0.1297 | 4.4202 | 4.9002 | 4.5155 | 2.4536 | 3.3909 | 3.6077 | 4.8989 | 5.6642 | 3.6667 | 9.1786 | 0.8785 | 1.2845 | 0.5440 | 1.4496 |
| ED | |||||||||||||||
| kext, L/mg | 0.0305 | 0.0229 | 0.0190 | 0.0413 | 0.0394 | 0.0352 | 0.0499 | 0.0422 | 0.0369 | 0.0452 | 0.0415 | 0.0351 | 0.0410 | 0.0419 | 0.0324 |
| R2 | 0.9049 | 0.6743 | 0.6514 | 0.7352 | 0.8045 | 0.7691 | 0.8118 | 0.6742 | 0.6534 | 0.8027 | 0.8262 | 0.8991 | 0.8884 | 0.9636 | 0.9711 |
| ∆q% | 6.2943 | 10.396 | 11.053 | 10.393 | 10.396 | 9.3493 | 9.4748 | 10.638 | 11.516 | 9.5593 | 3.1461 | 6.9079 | 7.3073 | 5.7186 | 4.9920 |
| Avrami | |||||||||||||||
| qm, mg/g | 290.78 | 205.21 | 167.99 | 175.59 | 173.87 | 154.32 | 175.87 | 120.99 | 108.36 | 95.583 | 92.867 | 82.632 | 75.061 | 77.985 | 63.632 |
| kA, L/mg | 0.3374 | 0.6252 | 0.6168 | 0.5475 | 0.4995 | 0.5198 | 0.4766 | 0.6115 | 0.6130 | 0.4720 | 0.4560 | 0.3640 | 0.3301 | 0.2448 | 0.2028 |
| nA | 0.8692 | 0.9592 | 0.9957 | 1.0007 | 0.9302 | 0.9735 | 0.9760 | 1.0255 | 1.0273 | 0.9842 | 0.9528 | 0.8842 | 0.9784 | 0.7701 | 0.6984 |
| R2 | 0.9854 | 0.9984 | 0.9995 | 0.9978 | 0.9917 | 0.9978 | 0.9980 | 0.9958 | 0.9950 | 0.9943 | 0.9973 | 0.9945 | 0.9816 | 0.9902 | 0.9861 |
| ∆q% | 0.1198 | 0.0933 | 0.4030 | 0.1305 | 0.2707 | 0.1756 | 1.2246 | 0.9081 | 0.2229 | 0.2974 | 1.2908 | 0.6936 | 0.5736 | 0.0234 | 0.4116 |
| Cads, g/L | 1 | 2 | 3 | 4 | 5 | ||||||||||
|---|---|---|---|---|---|---|---|---|---|---|---|---|---|---|---|
| Model | 30 °C | 45 °C | 60 °C | 30 °C | 45 °C | 60 °C | 30 °C | 45 °C | 60 °C | 30 °C | 45 °C | 60 °C | 30 °C | 45 °C | 60 °C |
| PFO | |||||||||||||||
| qm, mg/g | 313.51 | 291.36 | 247.76 | 309.69 | 274.19 | 224.05 | 294.92 | 240.83 | 296.76 | 265.11 | 177.94 | 316.49 | 269.34 | 226.20 | 555.78 |
| ki, L/mg | 0.3249 | 0.2882 | 0.3032 | 0.2299 | 0.2360 | 0.2495 | 0.1946 | 0.1856 | 0.1102 | 0.1767 | 0.2125 | 0.0754 | 0.1306 | 0.1046 | 0.0285 |
| R2 | 0.9954 | 0.9930 | 0.9864 | 0.9923 | 0.9917 | 0.9899 | 0.9919 | 0.9900 | 0.9884 | 0.9859 | 0.9882 | 0.9839 | 0.9778 | 0.9816 | 0.9670 |
| ∆q% | 8.5709 | 10.546 | 73.499 | 15.802 | 15.576 | 37.298 | 20.985 | 22.118 | 48.265 | 25.165 | 19.070 | 43.182 | 39.599 | 52.238 | 84.841 |
| PSO | |||||||||||||||
| qm, mg/g | 461.68 | 440.39 | 374.52 | 483.88 | 430.19 | 349.02 | 476.85 | 389.21 | 529.05 | 442.82 | 288.31 | 110.76 | 477.05 | 100.76 | 113.89 |
| ki, L/mg | 0.0005 | 0.0005 | 0.0006 | 0.0003 | 0.0004 | 0.0005 | 0.0003 | 0.0003 | 0.0001 | 0.0002 | 0.0005 | 0.0051 | 0.0002 | 0.0060 | 0.0001 |
| R2 | 0.9926 | 0.9908 | 0.9824 | 0.9915 | 0.9902 | 0.9878 | 0.9912 | 0.9898 | 0.9880 | 0.9846 | 0.9862 | 0.8092 | 0.9768 | 0.8092 | 0.9671 |
| ∆q% | 31.916 | 36.822 | 17.398 | 47.651 | 47.665 | 13.484 | 59.114 | 60.899 | 118.01 | 69.401 | 56.220 | 137.99 | 101.62 | 8.8557 | 149.13 |
| Elovich | |||||||||||||||
| α | 0.0093 | 0.0101 | 0.0114 | 0.0106 | 0.0116 | 0.0138 | 0.0118 | 0.0149 | 0.0155 | 0.0132 | 0.0178 | 0.0001 | 0.0001 | 0.0199 | 0.0002 |
| β | 221.86 | 185.61 | 160.04 | 172.75 | 152.76 | 128.98 | 142.74 | 113.15 | 88.383 | 115.52 | 88.454 | 303.40 | 25301 | 62.406 | 392.65 |
| R2 | 0.9959 | 0.9964 | 0.9919 | 0.9832 | 0.9861 | 0.9864 | 0.9811 | 0.9791 | 0.9742 | 0.9792 | 0.9891 | 1.0000 | 1.0000 | 0.9855 | 1.0000 |
| ∆q% | 40.824 | 40.822 | 41.956 | 40.532 | 40.005 | 40.005 | 40.321 | 39.756 | 38.945 | 39.065 | 39.745 | 38.756 | 37.856 | 40.003 | 37.856 |
| ID | |||||||||||||||
| kint, h−1 | 109.93 | 96.459 | 84.059 | 90.737 | 81.485 | 68.691 | 78.039 | 61.845 | 52.449 | 65.822 | 49.642 | 41.136 | 54.060 | 38.296 | 30.133 |
| R2 | 0.9726 | 0.9654 | 0.9530 | 0.9646 | 0.9594 | 0.9573 | 0.9535 | 0.9528 | 0.9151 | 0.9337 | 0.9423 | 0.8906 | 0.9052 | 0.8953 | 0.8398 |
| ∆q% | 1.6002 | 4.4667 | 1.5287 | 0.3486 | 0.2328 | 0.7084 | 0.7614 | 1.2314 | 2.2568 | 0.6924 | 6.909 | 4.7692 | 1.2847 | 2.2314 | 3.3882 |
| ED | |||||||||||||||
| kext, L/mg | 0.0280 | 0.0244 | 0.0211 | 0.0490 | 0.0434 | 0.0359 | 0.0659 | 0.0504 | 0.0422 | 0.0760 | 0.0545 | 0.0445 | 0.0788 | 0.0527 | 0.0407 |
| R2 | 0.8908 | 0.9094 | 0.8901 | 0.9526 | 0.9462 | 0.9335 | 0.9720 | 0.9680 | 0.9827 | 0.9737 | 0.9576 | 0.9828 | 0.9745 | 0.9783 | 0.9670 |
| ∆q% | 7.9313 | 7.2242 | 8.121 | 0.6741 | 15.921 | 7.0326 | 4.6553 | 27.413 | 3.9667 | 11.246 | 6.141 | 3.1265 | 4.1976 | 2.9851 | 3.1548 |
| Avrami | |||||||||||||||
| qm, mg/g | 264.87 | 234.87 | 201.45 | 224.85 | 198.54 | 167.05 | 197.92 | 154.62 | 137.32 | 164.99 | 122.99 | 106.89 | 138.65 | 101.03 | 81.642 |
| kA, L/mg | 0.3602 | 0.3360 | 0.3400 | 0.2730 | 0.2779 | 0.2941 | 0.2461 | 0.2505 | 0.1748 | 0.2299 | 0.2645 | 0.1434 | 0.1914 | 0.1732 | 0.0851 |
| nA | 0.8994 | 0.8576 | 0.8919 | 0.8423 | 0.8490 | 0.8485 | 0.7908 | 0.7408 | 0.6304 | 0.7688 | 0.8034 | 0.5259 | 0.6824 | 0.6038 | 0.3347 |
| R2 | 0.9954 | 0.9930 | 0.9864 | 0.9923 | 0.9917 | 0.9899 | 0.9919 | 0.9900 | 0.9884 | 0.9859 | 0.9882 | 0.9839 | 0.9778 | 0.9816 | 0.9672 |
| ∆q% | 0.9074 | 0.5861 | 0.6134 | 0.2878 | 0.0148 | 0.4098 | 0.6387 | 0.4133 | 0.4008 | 0.2045 | 0.5736 | 0.7468 | 0.5756 | 0.7389 | 0.5844 |
| Cads, g/L | 1 | 2 | 3 | 4 | 5 | ||||||||||
|---|---|---|---|---|---|---|---|---|---|---|---|---|---|---|---|
| Model | 30 °C | 45 °C | 60 °C | 30 °C | 45 °C | 60 °C | 30 °C | 45 °C | 60 °C | 30 °C | 45 °C | 60 °C | 30 °C | 45 °C | 60 °C |
| PFO | |||||||||||||||
| qm, mg/g | 217.58 | 155.03 | 108.79 | 176.55 | 118.23 | 83.275 | 200.69 | 97.971 | 78.736 | 626.17 | 80.853 | 83.381 | 180.71 | 130.54 | 42.211 |
| ki, L/mg | 0.4025 | 0.5306 | 0.8190 | 0.3510 | 0.5018 | 0.6499 | 0.1772 | 0.3820 | 0.3288 | 0.0315 | 0.2620 | 0.1611 | 0.0064 | 0.0751 | 0.2494 |
| R2 | 0.9952 | 0.9937 | 0.9992 | 0.9940 | 0.9937 | 0.9961 | 0.9940 | 0.9927 | 0.9935 | 0.9766 | 0.9914 | 0.9859 | 0.9738 | 0.9838 | 0.9927 |
| ∆q% | 4.7928 | 2.9417 | 1.6670 | 7.2338 | 3.0934 | 17.804 | 22.175 | 5.3493 | 7.4558 | 21.154 | 13.103 | 27.347 | 74.449 | 77.716 | 14.896 |
| PSO | |||||||||||||||
| qm, mg/g | 299.45 | 202.87 | 125.20 | 253.99 | 156.61 | 103.66 | 323.58 | 138.11 | 75.767 | 110.76 | 65.761 | 55.765 | 65.765 | 280.82 | 63.262 |
| ki, L/mg | 0.0011 | 0.0024 | 0.0077 | 0.0011 | 0.0029 | 0.0066 | 0.0004 | 0.0022 | 0.0085 | 0.0041 | 0.0106 | 0.0094 | 0.0075 | 0.0469 | 0.0027 |
| R2 | 0.9954 | 0.9891 | 0.9981 | 0.9915 | 0.9901 | 0.9987 | 0.9943 | 0.9912 | 0.9467 | 0.8181 | 0.8901 | 0.8906 | 0.7842 | 0.9628 | 0.9920 |
| ∆q% | 21.957 | 16.447 | 20.344 | 28.313 | 17.358 | 36.836 | 60.752 | 24.266 | 5.6352 | 3.8144 | 3.0371 | 4.7684 | 1.1265 | 21.418 | 42.685 |
| Elovich | |||||||||||||||
| α | 0.0144 | 0.0206 | 0.0392 | 0.0169 | 0.0266 | 0.’0432 | 0.0185 | 0.0302 | 0.0399 | 0.0204 | 0.0370 | 0.0474 | 0.0001 | 0.0469 | 0.0782 |
| β | 204.35 | 190.15 | 302.87 | 137.67 | 135.25 | 149.23 | 92.015 | 81.791 | 61.293 | 60.798 | 47.561 | 35.793 | 488.78 | 28.082 | 24.636 |
| R2 | 0.9936 | 0.9862 | 0.9933 | 0.9910 | 0.9881 | 0.9977 | 0.9812 | 0.9939 | 0.9901 | 0.9437 | 0.9930 | 0.9648 | 1.0000 | 0.9628 | 0.9849 |
| ∆q% | 40.8341 | 37.659 | 41.657 | 40.068 | 38.750 | 37.439 | 39.867 | 39.645 | 36.758 | 38.756 | 38.654 | 37.989 | 38.756 | 40.862 | 37.932 |
| ID | |||||||||||||||
| kint, h−1 | 83.921 | 65.681 | 49.113 | 64.237 | 49.249 | 37.289 | 50.042 | 36.970 | 27.857 | 37.459 | 25.443 | 19.502 | 23.218 | 16.933 | 12.648 |
| R2 | 0.9912 | 0.9665 | 0.9188 | 0.9777 | 0.9722 | 0.9648 | 0.9587 | 0.9793 | 0.9889 | 0.8724 | 0.9575 | 0.9471 | 0.8567 | 0.8988 | 0.9700 |
| ∆q% | 2.2727 | 4.5960 | 6.1627 | 2.0074 | 3.9947 | 15.696 | 2.3576 | 3.9947 | 2.2891 | 8.5783 | 0.7403 | 1.7682 | 4.5475 | 3.1576 | 2.7241 |
| ED | |||||||||||||||
| kext, L/mg | 0.0209 | 0.0160 | 0.0117 | 0.0331 | 0.0246 | 0.0182 | 0.0397 | 0.0283 | 0.0209 | 0.0402 | 0.0259 | 0.0197 | 0.0305 | 0.0217 | 0.0157 |
| R2 | 0.8291 | 0.7084 | 0.4737 | 0.8749 | 0.7476 | 0.6300 | 0.9713 | 0.8521 | 0.8817 | 0.9798 | 0.9228 | 0.9609 | 0.9730 | 0.9802 | 0.9248 |
| ∆q% | 8.6191 | 10.883 | 12.156 | 8.2301 | 10.184 | 10.494 | 3.5536 | 10.184 | 7.3878 | 31.192 | 7.1985 | 4.7725 | 1.8699 | 3.5441 | 6.6975 |
| Avrami | |||||||||||||||
| qm, mg/g | 201.56 | 142.78 | 103.99 | 146.32 | 111.11 | 82.891 | 88.048 | 134.76 | 68.915 | 62.634 | 98.731 | 50.879 | 64.827 | 45.879 | 29.698 |
| kA, L/mg | 0.4298 | 0.5399 | 0.8034 | 0.3722 | 0.5093 | 0.6799 | 02408 | 0.4155 | 0.3636 | 0.0867 | 0.3041 | 0.2182 | 0.0373 | 0.1386 | 0.2882 |
| nA | 0.9364 | 0.9828 | 1.0194 | 0.9429 | 0.9854 | 0.9556 | 0.7360 | 0.9193 | 0.9044 | 0.3633 | 0.8616 | 0.7282 | 0.1711 | 0.5422 | 0.8654 |
| R2 | 0.9952 | 0.9937 | 0.9992 | 0.9940 | 0.9937 | 0.9961 | 0.9940 | 0.9927 | 0.9935 | 0.9799 | 0.9914 | 0.9859 | 0.9738 | 0.9838 | 0.9927 |
| ∆q% | 1.4341 | 0.5166 | 0.2078 | 0.9951 | 0.4542 | 0.2797 | 1.4787 | 0.4542 | 1.4337 | 1.0339 | 0.9515 | 0.7737 | 0.5282 | 0.8371 | 1.6216 |
| Bioadsorbents | wt,% | |||||
|---|---|---|---|---|---|---|
| C | O | Al | Si | Ca | Metal | |
| WLW | 59.64 | 30.05 | 0.2 | 0.72 | 2.08 | ------- |
| Ni | 52.78 | 43.23 | 0.18 | 0.37 | 0.98 | 2.69 |
| Cu | 57.51 | 30.24 | 1.08 | 0.43 | 0.0 | 1.85 |
| WLN | 54.96 | 41.27 | 0.87 | 2.21 | 0.36 | ------- |
| Ni | 53.40 | 40.69 | 0.24 | 0.63 | 0.24 | 2.54 |
| Cu | 55.27 | 41.78 | 0.76 | 0.74 | 0.19 | 1.41 |
Disclaimer/Publisher’s Note: The statements, opinions and data contained in all publications are solely those of the individual author(s) and contributor(s) and not of MDPI and/or the editor(s). MDPI and/or the editor(s) disclaim responsibility for any injury to people or property resulting from any ideas, methods, instructions or products referred to in the content. |
© 2023 by the authors. Licensee MDPI, Basel, Switzerland. This article is an open access article distributed under the terms and conditions of the Creative Commons Attribution (CC BY) license (https://creativecommons.org/licenses/by/4.0/).
Share and Cite
González-Tavares, C.; Salazar-Hernández, M.; Talavera-López, A.; Salgado-Román, J.M.; Hernández-Soto, R.; Hernández, J.A. Removal of Ni(II) and Cu(II) in Aqueous Solutions Using Treated Water Hyacinth (Eichhornia crassipes) as Bioadsorbent. Separations 2023, 10, 289. https://doi.org/10.3390/separations10050289
González-Tavares C, Salazar-Hernández M, Talavera-López A, Salgado-Román JM, Hernández-Soto R, Hernández JA. Removal of Ni(II) and Cu(II) in Aqueous Solutions Using Treated Water Hyacinth (Eichhornia crassipes) as Bioadsorbent. Separations. 2023; 10(5):289. https://doi.org/10.3390/separations10050289
Chicago/Turabian StyleGonzález-Tavares, Carlos, Mercedes Salazar-Hernández, Alfonso Talavera-López, Juan Manuel Salgado-Román, Rosa Hernández-Soto, and José A. Hernández. 2023. "Removal of Ni(II) and Cu(II) in Aqueous Solutions Using Treated Water Hyacinth (Eichhornia crassipes) as Bioadsorbent" Separations 10, no. 5: 289. https://doi.org/10.3390/separations10050289