Article

Extraction of Organochlorine Pesticides from Porous Membrane Packed Dried Fish Samples: Method Development and Greenness Evaluation

by
Muhammad Sajid
1,* and
Khalid Alhooshani
2,*
1
Applied Research Center for Environment and Marine Studies, Research Institute, King Fahd University of Petroleum and Minerals, Dhahran 31261, Saudi Arabia
2
Chemistry Department, King Fahd University of Petroleum and Minerals, Dhahran 31261, Saudi Arabia
*
Authors to whom correspondence should be addressed.
Separations 2023, 10(4), 233; https://doi.org/10.3390/separations10040233
Submission received: 21 February 2023 / Revised: 20 March 2023 / Accepted: 30 March 2023 / Published: 1 April 2023

Abstract

:
In this work, ultrasound-assisted solvent extraction was utilized for extraction of organochlorine pesticides from membrane-protected dried fish samples. The dried fish samples were packed inside a porous membrane bag which was immersed in a solvent and subjected to ultrasonication. After the extraction process, the sample-containing bag was separated from the extract. Since samples were packed inside the membrane, their separation did not require centrifugation or filtration. Moreover, the complex components of the biota matrix may also retain inside the porous membrane bag, alleviating the requirement of extract cleanup before analysis. The parameters that can affect the ultrasound-assisted solvent extraction of membrane-protected dried fish samples were suitably optimized. These parameters include the extraction solvent and its volume, the sample amount, ultrasound intensity and extraction time. Under the optimum extraction conditions, good linearity was achieved for all the tested organochlorine pesticides, with the coefficients of determination (R2) higher than 0.9922 for the linear ranges from 5–1000, 10–1000 and 20–1000 ng/g. The values of intra-day and inter-day relative standard deviations were ≤13.8%. The limit of detection ranged from 1.5 to 6.8 ng/g. The spiked relative recoveries were in the range of 87.3–104.2%. This method demonstrated excellent figures of merit and could find potential applications in routine analytical laboratories. Finally, the greenness of this method was evaluated using the green analytical procedure index and analytical greenness calculator metrics.

1. Introduction

Sample preparation is a crucial step in analytical method development in the following cases [1,2]:
  • The concentration of target compounds is too low to perform direct determination without enrichment.
  • The matrix is complex, and needs clean-up before injecting into the instrument to avoid interference and instrument incompatibility issues.
  • The chemical features of the target compounds mismatch with the available instrumentation, and thus a chemical conversion (derivatization) is required.
Classical methods of sample preparation such as liquid–liquid extraction (LLE) and solid-phase extraction (SPE) are widely adopted due to their excellent performance in terms of extraction recoveries and well-established procedures. The principal demerit of LLE and SPE is consumption of large volume of hazardous solvents that pose risk both to the environment and workers [3,4,5,6]. Due to these conventional extraction techniques, sample preparation is generally considered the least green step in analytical method development. Apart from that, these extraction techniques involve multistep procedures which are not only time consuming but may also result in loss of the analytes [7,8]. According to some estimates, 80% of time is spent on sample preparation during analytical method development [9], and it is one of the major sources of errors in the analysis [10].
Alternatively, researchers have put great effort into the development of miniaturized sample preparation techniques, focusing on reducing the dimensions of extraction devices, minimizing the volumes of organic solvents, and improving the extraction performance [11]. Thus, many microextraction techniques have been developed during the last three decades, including solid-phase microextraction [12], liquid-phase microextraction [7,13,14,15], and their variants [14,16,17,18,19,20,21,22,23,24].
Membrane-based analytical extractions have been employed for extraction of analytes from environmental, food, and biological samples. Hollow-fiber protected solid-phase microextraction (HF-SPME) [25], hollow fiber liquid-phase microextraction (HF-LPME) [26,27], and porous membrane-protected micro-solid-phase extraction (µ-SPE) [28] are some typical examples of membrane-based extraction techniques. µ-SPE involves packing the sorbent material inside the membrane sheet by shaping it like a teabag through heat-sealing. µ-SPE gives freedom with regard to selection of the sorbent that can be packed inside the membrane, according to the nature of the target pollutants. The major benefit of µ-SPE is related to protection of the sorbent within the membrane bag, which allows its application in complex matrixed samples. The analytes can pass through the membrane and be captured by the sorbent, while macromolecules and extraneous matter may not penetrate through the membrane. In this way, filtration and extraction steps are integrated into a single step. Moreover, this device can be used several times without compromising its performance [28]. All the techniques mentioned above are applicable to samples that are present in liquid form.
Dealing with solid samples, either by classical or miniaturized extraction techniques, requires pretreatment steps such as digestion or dissolution into a suitable solvent before extraction. The separation of the resulting solid/liquid is also required before applying any extraction technique. The packing of solid samples into a membrane bag has been proposed as the simplest solution to avoid some of the pretreatment and separation steps, and also to deal with complex matrix samples [29]. In this approach, solid samples (generally fine powders) are packed inside the porous membrane bag and subjected to solvent-based extraction. The extraction can be assisted by ultrasonication, stirring, mechanical shaking, vortex, etc. The analytes are released into the solvent, while complex interfering components may remain in the bag. The bag can be easily separated from the extract without requiring the steps of filtration or centrifugation. In this way, it eliminates several pretreatment steps, integrates sample pretreatment and extraction of analytes, and shortens the time and cost associated with sample preparation.
Originally, this technique was developed for extraction of polycyclic aromatic hydrocarbons from the soil samples [29]. Then, it was employed for extraction of organic analytes in tea samples [30]. However, its application can be extended to the other kinds of solid samples, and particularly to those that present highly complex matrices. A food sample such as fish constitutes a complex biological matrix, and its packing inside the membrane can simplify the extract purification process compared to other extraction procedures. Hence, this work aims to investigate the extraction of target analytes from dried fish samples. Organochlorine pesticides (OCPs) were selected as model compounds.
OCPs belong to persistent organic pollutants and are known to cause many health issues in humans and wildlife [31]. They have been commonly used in agrochemicals and many other applications for decades. This is the reason that their concentrations are distributed throughout the environment, including in aqueous resources. Due to low polarity, OCPs have very little solubility in water, but they tend to readily accumulate in fat tissues through a process known as bioaccumulation. The levels of OCPs can magnify to several folds [32,33]. From the aqueous media, they may accumulate in fish and other aquatic organisms. In this work, for the first time, we have extended the application of solvent extraction of membrane-packed solid samples to fish samples for extraction of OCPs before gas chromatography-mass spectrometry (GC-MS) determination.

2. Experimental

2.1. Materials and Chemicals

Table 1 provides a list of the chemicals and reagents employed in this study.
Table 1. List of materials and chemicals.
Chemical/MaterialManufacturer
OCPs standard (15 OCPs investigated in this study are listed in Table 2).Restek (Bellefonte, PA, USA)
Polypropylene (PP) membrane sheet (pore size: 0.2; thickness of 157 μm)Membrana (Wuppertal, Germany)
Solvents (chloroform, methanol, n-hexane, dichloromethane (DCM))Fisher (Loughborough, UK)
Fish samplesLocal market (Al-khobar, KSA)
Table 2. OCPs, retention times, and selected m/z values for selective ion monitoring (SIM) mode.
AnalyteRetention Time (min)Selected m/z Values
Heptachlor11.9100272274
Aldrin13.06626379
Heptachlor Epoxide14.681353355
Trans-chlordane15.633375377
Endosulfan I16.2241239195
Cis-chlordane16.3373375377
Dieldrin17.5798182
4,4′-DDE17.7246318248
Endrin18.68179263
Endosulfan II19.2195241237
4,4′-DDD20.1235237165
Endrin Aldehyde20.267345250
Endosulfan Sulfate21.5387272274
4,4′-DDT21.923523165
Methoxychlor24.8227228-

2.2. Preparation of Fish Samples

The Epinephelus coioides (hamour) fish species was used for extraction experiments. The scales of fish were removed using a handheld fishing scale brush. The upper layer was carefully removed to obtain muscle tissues. The muscle tissues were then lyophilized using a freeze-drier (Genesis 25L model from SP Scientific). The lyophilized tissues were then grounded, sieved, and stored in a clean glass bottle.

2.3. Extraction Procedure

A membrane bag (2.0 cm × 2.0 cm) with one open end was fabricated from a flat PP membrane sheet with the assistance of a heat-sealer. The open end of the membrane bag was also heat-sealed after packing with 500 mg of dried fish samples. The sample containing a membrane bag was dipped in 3000 μL of extraction solvent (toluene) in a vial. The process of extraction was supported by application of medium-intensity ultrasound for 60 min. The membrane bag was separated from the extraction solvent using a pair of tweezers, and the extract was evaporated to dryness and reconstituted in 200 μL of n-hexane, and 1 μL aliquot was injected into the GC–MS system for analysis. The extraction procedure is shown in Figure 1.

2.4. Optimization of Extraction Parameters

For the purpose of optimizing the extraction parameters, dried fish samples that had been spiked with 250 ng/g of the OCPs mixture were employed. The tests were carried out three times. A univariate method was used to optimize every parameter that may have an impact on how well the extraction performed, such as the amount of the sample, the type and volume of the extraction solvent, the extraction time, and the ultrasonic intensity. To find the optimum value for each parameter, chromatographic peak areas were employed. Ultrasonic equipment (UCS-20 by Jeio Tech, Daejeon, Republic of Korea) was employed in these experiments.

2.5. GC-MS Analysis

For the separation and quantification of target OCPs, an Agilent 7890A GC-System outfitted with an MS-5975C inert mass selective detector with a triple axis detector was employed. An Agilent (GC-Sampler 80) autosampler and injector were connected to the system. The working conditions of GC-MS were used for suitable separation of the target OCPs, as per previously reported work [34].
A GC capillary column was employed in this study. It was 0.25 µm thick and 30 m long, with a diameter of 0.32 mm. High-purity helium was used as a carrier gas. The flow rate was maintained at 1.4 mL/min. The injection port, GC-MS interface, ion source, and MS quadrupole temperature were adjusted at 250, 250, 230, and 150 °C, respectively. The sample was injected using split mode, with a split ratio of 10:1. The oven temperature was also programmed. The initial temperature was kept at 50 °C. It was increased to 180 °C at a rate of 20 °C/min and held for 1.5 min. The temperature was further increased to 200 °C, but relatively, at a slower rate of 3 °C/min. It was maintained for 3 min. Finally, it was increased to 230 °C at a rate of 5 °C/min and maintained for 5 min. In this way, the total run time was 28.7 min. The qualitative peak identification was performed in scan mode, in an m/z range of 40–550. SIM mode was employed for quantitative measurements. The Wiley 8th Edition W8N08 database was employed for identification of compounds. The selected ions are provided in Table 2.

2.6. Analytical Method Validation

Calibration plots were created using dried fish samples that had been extracted under optimal conditions and spiked with various concentrations of the target compounds. Relative recoveries, relative standard deviations (%RSDs), limits of detection (LODs), and the linearity of calibration plots were all computed. After that, fish samples bought from the neighborhood market were tested for OCPs using the devised methodology. For technique optimization and quality control parameters, fish samples with the absence of OCPs (previously verified) were employed.

2.7. Greenness Evaluation

The greenness of the developed extraction approach and analysis was evaluated using green analytical chemistry metrics. The green analytical procedure index (GAPI) [35] and Analytical GREEnness (AGREE) [36] metrics were used for this purpose.
Recently, various green analytical chemistry metrics have been developed that are used to assess the greenness of analytical procedures [37,38,39,40]. The objective of these metrics is to spread awareness among the analytical community regarding the more or less green steps in their developed methods. GAPI and AGREE are two commonly used metrics for this purpose. GAPI was developed in 2018, and it evaluates the whole analytical procedure including sampling, sample preparation, the reagents and chemicals employed, energy consumption and waste generation. The outcome of GAPI is a pictogram that consists of five pentagrams. Each pentagram consists of several fields that represent a specific parameter, and the color of each field presents the environmental impact of that parameter. A red color denotes high, while yellow denotes medium, and green denotes low environmental impact. A simple look at the GAPI pictogram can reveal how many parameters are acceptable from a greenness perspective and how many need further improvement [35]. AGREE is another important green analytical chemistry metric which evaluates analytical methods based on 12 GAC principles. Its outcome is a clock-like pictogram that contains assessment of each principle and a final score. The final score ranges from 0–1. The closeness of the score to 1 indicates that the method has more green characteristics [36].

3. Results and Discussion

3.1. Optimization of Extraction Parameters

Analytes from solid samples were directly extracted into the extraction solvent with the aid of sonication. The potential parameters that may affect the extraction performance include extraction solvent, the volume of extraction solvent, the amount of the sample, ultrasound intensity, and extraction time. These parameters were appropriately optimized using a univariate approach. The initial, range, and optimum values of each parameter are provided in Table 3.

3.1.1. Extraction Solvent

The extraction solvent is most important parameter in solvent-based extraction. The interaction of the solvent with analytes as well as the solid sample contributes toward the release of the analytes. One straightforward criterion is whether the solvents have polarity match with the target compounds. However, some unknown factors related to interaction of the solvent and solid samples may provide unexpected results. Solvents with different polarity indices, such as n-hexane, dichloromethane (DCM), n-hexane:DCM, chloroform, methanol, and toluene, were evaluated in this study. The best extraction results were obtained with toluene except for aldrin, 4,4′-DDD, and 4,4′-DDT, which were better extracted in other solvents (Figure 2). Toluene effectively dilates the pores of the membrane and thus enhances overall mass transfer of analytes. Hence, it was selected as an optimum extraction solvent. However, in some cases, toluene may cause leaching of sample or deteriorate heat-sealing of membrane bag. This aspect should be carefully monitored. Such issues are less common with n-hexane.

3.1.2. Solvent Volume

The solvent volume should completely immerse the sample-containing bag so that the solid sample particles are fully exposed to the extraction solvent. An optimum volume is the one where high concentrations of the analytes are released from the solid matrix into the solvent. The lower volumes may cause an irreproducible release of analytes, while higher volumes may be difficult to evaporate, and harsh conditions may result in loss of the target compounds. The solvent volumes were investigated in the range of 0.5–5.0 mL. The extraction was increased from 0.5–3.0 mL, but a decrease was observed in the case of 5.0 mL (Figure 3). This suggests that analytes efficiently release with an increase in solvent volume from 0.5–3.0 mL, but after 3.0 mL, solvent evaporation may cause a loss of analytes due to the increased duration of evaporation. The analytes may also adsorb back to solid samples. An exception was observed in case of heptachlor, which was best extracted in a 5 mL solvent volume.

3.1.3. Amount of Sample

The increase in sample amount in a predefined volume of extraction solvent will lead to increased extraction. However, after reaching a certain amount, the volume of extraction solvent may not be sufficient for proper extraction. Hence, this parameter was properly investigated. Thus, five different sample amounts (125, 250, 500, 750, 1000 mg) were extracted using 3 mL of the extraction solvent. As illustrated in Figure 4, the chromatographic peak areas increased with the increase in sample amount from 125 mg to 500 mg, and after that, a decline was observed. This might be due to an insufficient volume of the extraction solvent, which cannot compensate for a further increase in the sample amount or may be unable to immerse the membrane bag.

3.1.4. Ultrasound Intensity

Ultrasound-assisted extraction is an environmentally friendly, low-cost, and easy-to-use approach. The process of acoustic cavitation occurs during sonication, and it controls the extraction process. This process is dependent on many factors such as the nature of the solvent, ultrasound features, and operating conditions. The solid matrix may be disrupted due to this process leading to enhanced penetration of the solvent into solid samples. These all are internal processes, arising from the effects of ultrasound. However, ultrasound intensity or power is the factor that can be controlled externally. In this work, an ultrasound that generates high-frequency 40 kHz sound waves was utilized and operated in low, medium, and high-intensity mode. The best extraction results were achieved at medium intensity (Figure 5).

3.1.5. Extraction Time

The sonication time influences the rate of mass transfer of analytes. Thus, the sonication time should be long enough to reach a state of equilibrium. However, very long extraction times may affect the extraction negatively. This is because sonication causes an increase in the temperature of the extract, due to which some analytes may evaporate to headspace. Opening the extraction vial may result in partial loss of analytes. Thus, the extraction time was examined from 15 to 75 min, and 60 min was found to be an optimum extraction time (Figure 6).

3.2. Analytical Method Validation

The matrix effect is generally caused by co-extracted species that lead to an enhanced or decreased ionization and chromatographic response of the analytes. The matrix effect represents the difference in the response of the analyte in standard solution versus the response of the analyte in a selected matrix, and it is highly dependent on the features of the detection system, the sample type, and the sample preparation. The differences were observed in the response of analytes in standard solution and post-extraction spiked samples. Membrane-based sample preparation may have a role in reducing the matrix effect. Besides that, to minimize the matrix effect on final determination, both calibration and unknown samples with the same matrix were subjected to the same extraction and analysis procedures.
Analytical figures of merit for this newly developed method were studied under optimal extraction conditions. The calibration graphs were built by spiking analyte-free dried fish samples at different concentration levels. This method showed a good linear working range for all the analytes, with correlation coefficients higher than 0.9922. The LODs were in the range of 1.5–6.8 ng/g. Intra-day and inter-day relative standard deviations (%RSDs) were in the range of 5.8–13.8. The values of %RSDs were within the acceptable range, as per the guidelines [41].
Table 4 provides analytical figures of merit for the proposed method.

3.3. Relative Recoveries, Analysis of Real Samples and Comparison with Other Methods

The pooled dried fish samples spiked at three different levels of 50, 100, and 250 ng/g were extracted under optimum conditions to evaluate relative recoveries using the above constructed calibration plots. The relative recoveries were in a range of 87.3–104.2%. Relative recoveries along with percentage RSDs at different spike levels are provided in Table 5. The values of relative recoveries were within the acceptable range as per the guidelines [41]. This method was then used for analysis of OCPs in three different fish samples purchased from the local market. The levels of studied OCPs were below method’s LOQ.
A comparison of the current method with the previously published literature dealing with the extraction and analysis of OCPs in fish samples is provided in Table 6. The volume of organic solvents consumed during sample pretreatment and extraction is an important factor in evaluating the greenness of analytical procedures, as per recent developments in green analytical chemistry. The volumes of organic solvents employed in the methods listed in Table 6 were much higher than those used in the current method, except in the case of U-SDME, where 1 mL of methanol and 1 µL of toluene were used. In the other methods, the volumes were above 5 mL and up to 163.5 mL. The volume of the extraction solvent used in the current method is 3 mL (toluene). However, it may also present some operational issues. This method demonstrated a broader linear range compared to reported methods, except for U-SDME, which was almost comparable. Regarding LODs, the current method showed slightly higher values to those reported in the literature. The %RSDs of the current method and those reported in the literature were comparable in some cases, but overall, they were within an acceptable range. Similarly, the recoveries of this method were either better or comparable to those reported in the literature.

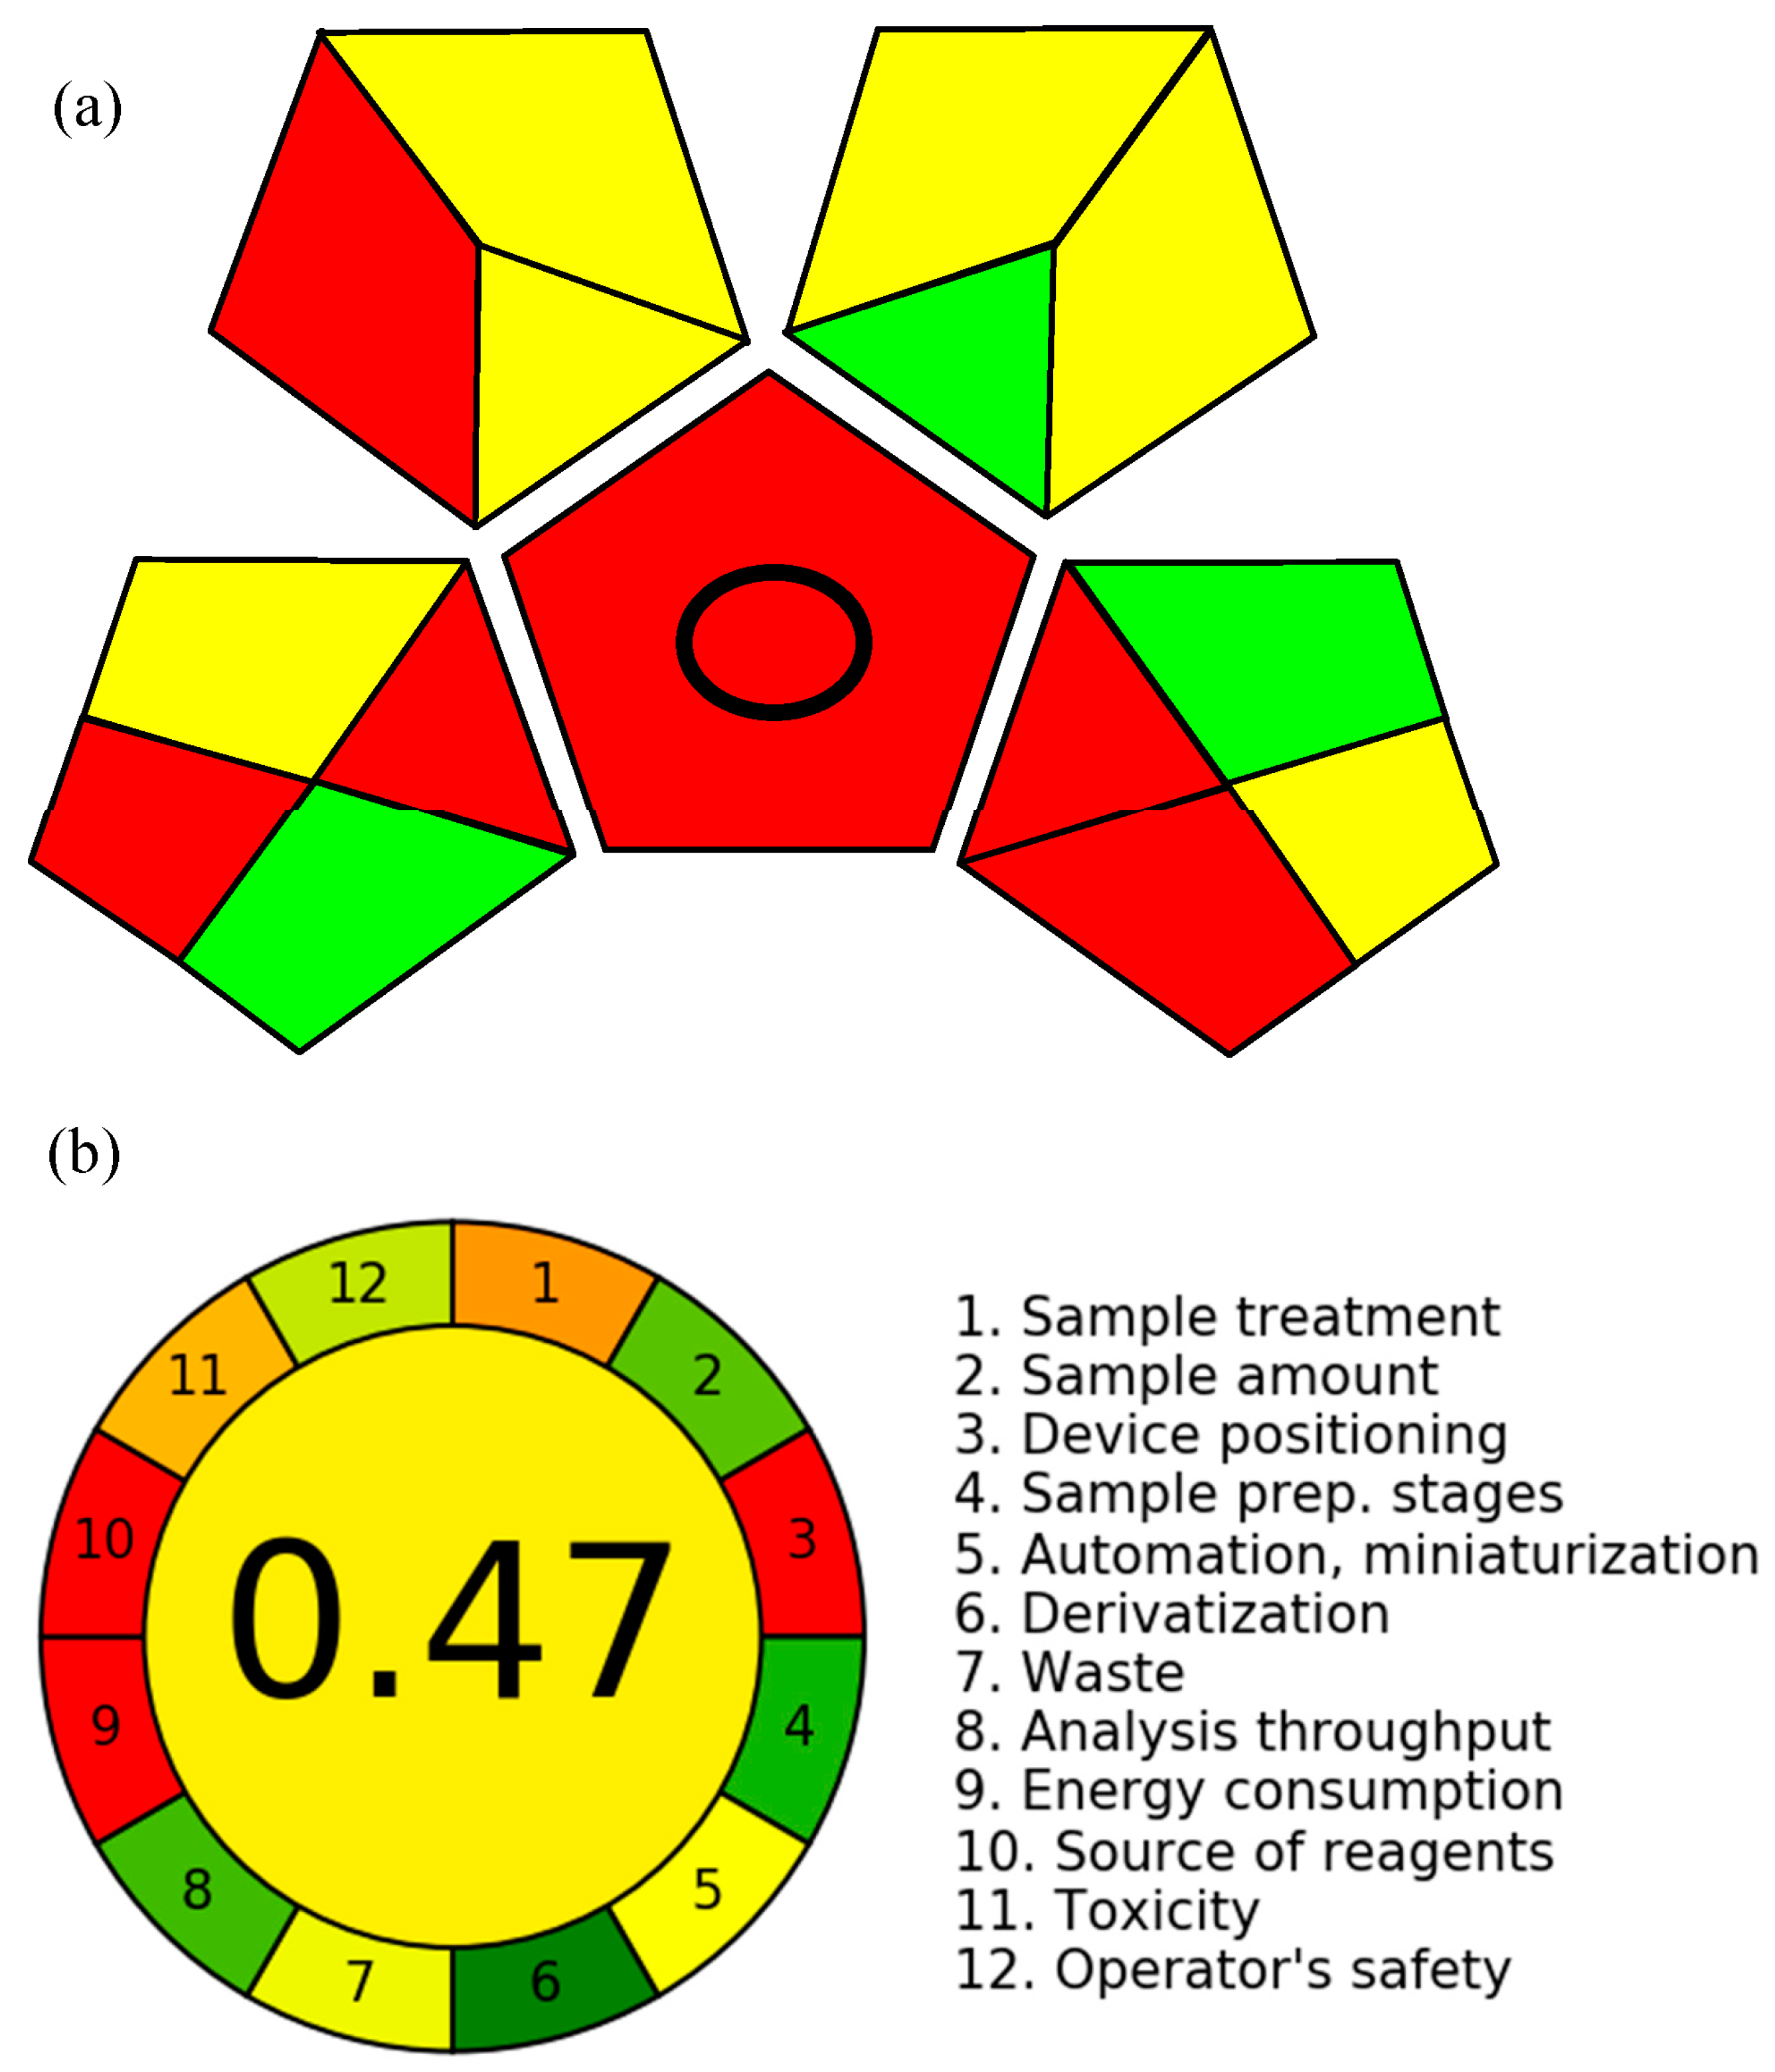
4. Greenness Evaluation

According to GAPI (Figure 7a), the following parameters of this newly developed method have the highest environmental impacts.
(i)
Sample collection;
(ii)
Sample transportation;
(iii)
Type of method;
(iv)
Solvents employed;
(v)
Energy related to instrumentation;
(vi)
Waste treatment.
This metric favors in-line sample collection, which is of course not possible in the case of collection of fish and biota samples. Similarly, there are fewer opportunities for on-site sample processing, and transportation will be required. GAPI favors methods that do not involve extraction and that perform direct measurements. However, in case of detection of OCPs in fish samples, the extraction process is unavoidable. GAPI also considers this method inadequate, because non-green solvents such as toluene and n-hexane were employed. This aspect, however, can be improved by using bio-based solvents or other less toxic solvents such as ionic liquids or deep eutectic solvents. However, this application will require entirely new investigations to find the solvents that show interactions with the analytes and are applicable with complex biota samples. GAPI also considers using high-energy instruments to be a negative point. GC-MS was employed in this work, and it is usually difficult to replace with another instrumentation. The waste generated during the extraction process was not treated, and this may have a high environmental impact according to GAPI.
According to AGREE, the method developed in this work has an overall score of 0.47 (Figure 7b), and a close overview of each criterion indicates that it needs improvements, particularly in terms of device positioning, energy consumption, sources of reagents and their toxicity. The one main limitation of the current work is the use of conventional organic solvents as extractants. The greenness can be enhanced by using alternative solvents such as ionic liquids, deep eutectic solvents, etc.

5. Conclusions

In present work, we successfully developed a method of extraction of OCPs in fish samples. Fish tissues were separated and freeze-dried prior to extraction. Freeze-dried samples were enclosed inside a porous membrane bag that was constructed using a heat-sealer. The extraction process was carried out using a solvent, and was assisted by the application of ultrasound. Membrane-packed samples can be easily separated from the solvent extract after extraction, and steps such as centrifugation or filtration are not required. Since macromolecules and fat species cannot easily escape from the membrane bag, a clean-up phase may also be sidestepped. The optimum results were obtained when a 500 mg sample was extracted using 3 mL of toluene under medium intensity sonication for 60 min. The present method showed excellent analytical figures of merit. The LODs of the target OCPs were in the range of 1.5–6.8 ng/g. The percentage RSDs were ≤13.8%. Application of this method can be extended to other biota species. This method has great potential for application in routine analysis, but this will require inter-laboratory validation.

Author Contributions

Conceptualization, M.S.; methodology, M.S. and K.A.; investigation, M.S. and K.A.; writing—original draft preparation, M.S.; writing—review and editing, M.S. and K.A. All authors have read and agreed to the published version of the manuscript.

Funding

This research received no external funding.

Data Availability Statement

All the relevant data is included in the manuscript. Any additional information can be obtained from the corresponding authors upon a reasonable request.

Acknowledgments

Muhammad Sajid wishes to acknowledge the support of the Applied Research Center for Environment and Marine Studies, Research Institute, King Fahd University of Petroleum and Minerals, Saudi Arabia. Khalid Alhooshani acknowledges the support of the Chemistry Department, King Fahd University of Petroleum and Minerals, Saudi Arabia.

Conflicts of Interest

The authors declare no conflict of interest.

References

  1. Chisvert, A.; Cárdenas, S.; Lucena, R. Dispersive Micro-Solid Phase Extraction. TrAC-Trends Anal. Chem. 2019, 112, 226–233. [Google Scholar] [CrossRef]
  2. Sajid, M.; Kalinowska, K.; Płotka-Wasylka, J. Ferrofluids Based Analytical Extractions and Evaluation of Their Greenness. J. Mol. Liq. 2021, 339, 116901. [Google Scholar] [CrossRef]
  3. Sajid, M.; Nazal, M.K.; Ihsanullah, I. Novel Materials for Dispersive (Micro) Solid-Phase Extraction of Polycyclic Aromatic Hydrocarbons in Environmental Water Samples: A Review. Anal. Chim. Acta 2021, 1141, 246–262. [Google Scholar] [CrossRef] [PubMed]
  4. Gutiérrez-Serpa, A.; González-Martín, R.; Sajid, M.; Pino, V. Greenness of Magnetic Nanomaterials in Miniaturized Extraction Techniques: A Review. Talanta 2021, 225, 122053. [Google Scholar] [CrossRef] [PubMed]
  5. Płotka-Wasylka, J.; Owczarek, K.; Namieśnik, J. Modern Solutions in the Field of Microextraction Using Liquid as a Medium of Extraction. TrAC-Trends Anal. Chem. 2016, 85, 46–64. [Google Scholar] [CrossRef]
  6. Płotka-Wasylka, J.; Szczepańska, N.; de la Guardia, M.; Namieśnik, J. Miniaturized Solid-Phase Extraction Techniques. TrAC-Trends Anal. Chem. 2015, 73, 19–38. [Google Scholar] [CrossRef]
  7. Sajid, M. Dispersive Liquid-Liquid Microextraction: Evolution in Design, Application Areas, and Green Aspects. TrAC-Trends Anal. Chem. 2022, 152, 116636. [Google Scholar] [CrossRef]
  8. Yamini, Y.; Rezazadeh, M.; Seidi, S. Liquid-Phase Microextraction—The Different Principles and Configurations. TrAC-Trends Anal. Chem. 2019, 112, 264–272. [Google Scholar] [CrossRef]
  9. Picó, Y. Recent Advances in Sample Preparation for Pesticide Analysis. Compr. Sampl. Sample Prep. Anal. Tech. Sci. 2012, 3, 569–590. [Google Scholar] [CrossRef]
  10. Kataoka, H. Column-Switching Sample Preparation. Compr. Sampl. Sample Prep. Anal. Tech. Sci. 2012, 2, 649–676. [Google Scholar] [CrossRef]
  11. Soares, J.B.; Medina, D.A.V.; Toffoli, A.L.; Maciel, E.V.M.; Lanças, F.M. Recent Advances and Trends in Miniaturized Sample Preparation Techniques. J. Sep. Sci. 2020, 43, 202–225. [Google Scholar] [CrossRef] [PubMed]
  12. Arthur, C.L.; Pawliszyn, J. Solid Phase Microextraction with Thermal Desorption Using Fused Silica Optical Fibers. Anal. Chem. 1990, 62, 2145–2148. [Google Scholar] [CrossRef]
  13. Liu, S.; Dasgupta, P.K. Liquid Droplet. A Renewable Gas Sampling Interface. Anal. Chem. 2002, 67, 2042–2049. [Google Scholar] [CrossRef]
  14. Liu, H.; Dasgupta, P.K. Analytical Chemistry in a Drop. Solvent Extraction in a Microdrop. Anal. Chem. 1996, 68, 1817–1821. [Google Scholar] [CrossRef] [PubMed]
  15. Jeannot, M.A.; Cantwell, F.F. Solvent Microextraction into a Single Drop. Anal. Chem. 1996, 68, 2236–2240. [Google Scholar] [CrossRef]
  16. Jeannot, M.A.; Cantwell, F.F. Mass Transfer Characteristics of Solvent Extraction into a Single Drop at the Tip of a Syringe Needle. Anal. Chem. 1997, 69, 235–239. [Google Scholar] [CrossRef]
  17. He, Y.; Lee, H.K. Liquid-Phase Microextraction in a Single Drop of Organic Solvent by Using a Conventional Microsyringe. Anal. Chem. 1997, 69, 4634–4640. [Google Scholar] [CrossRef]
  18. Ma, M.; Cantwell, F.F. Solvent Microextraction with Simultaneous Back-Extraction for Sample Cleanup and Preconcentration: Preconcentration into a Single Microdrop. Anal. Chem. 1999, 71, 388–393. [Google Scholar] [CrossRef]
  19. Baltussen, E.; Sandra, P.; David, F.; Cramers, C. Stir Bar Sorptive Extraction (SBSE), a Novel Extraction Technique for Aqueous Samples: Theory and Principles. J. Microcolumn Sep. 1999, 11, 737–747. [Google Scholar] [CrossRef]
  20. Rezaee, M.; Assadi, Y.; Milani Hosseini, M.-R.; Aghaee, E.; Ahmadi, F.; Berijani, S. Determination of Organic Compounds in Water Using Dispersive Liquid-Liquid Microextraction. J. Chromatogr. A 2006, 1116, 1–9. [Google Scholar] [CrossRef]
  21. Tsai, W.-H.; Huang, T.-C.; Huang, J.-J.; Hsue, Y.-H.; Chuang, H.-Y. Dispersive Solid-Phase Microextraction Method for Sample Extraction in the Analysis of Four Tetracyclines in Water and Milk Samples by High-Performance Liquid Chromatography with Diode-Array Detection. J. Chromatogr. A 2009, 1216, 2263–2269. [Google Scholar] [CrossRef] [PubMed]
  22. Shen, G.; Lee, H.K. Hollow Fiber-Protected Liquid-Phase Microextraction of Triazine Herbicides. Anal. Chem. 2002, 74, 648–654. [Google Scholar] [CrossRef] [PubMed]
  23. Basheer, C.; Alnedhary, A.A.; Rao, B.S.M.; Valliyaveettil, S.; Lee, H.K. Development and Application of Porous Membrane-Protected Carbon Nanotube Micro-Solid-Phase Extraction Combined with Gas Chromatography/Mass Spectrometry. Anal. Chem. 2006, 78, 2853–2858. [Google Scholar] [CrossRef]
  24. Nazal, M.K.; Sajid, M.; Gijjapu, D.R. Membrane-Based Inverted Liquid–Liquid Extraction of Organochlorine Pesticides in Aqueous Samples: Evaluation, Merits, and Demerits. Chem. Pap. 2023, 1–11. [Google Scholar] [CrossRef]
  25. Basheer, C.; Lee, H.K. Hollow Fiber Membrane-Protected Solid-Phase Microextraction of Triazine Herbicides in Bovine Milk and Sewage Sludge Samples. J. Chromatogr. A 2004, 1047, 189–194. [Google Scholar] [CrossRef] [PubMed]
  26. Esrafili, A.; Baharfar, M.; Tajik, M.; Yamini, Y.; Ghambarian, M. Two-Phase Hollow Fiber Liquid-Phase Microextraction. TrAC-Trends Anal. Chem. 2018, 108, 314–322. [Google Scholar] [CrossRef]
  27. Gjelstad, A. Three-Phase Hollow Fiber Liquid-Phase Microextraction and Parallel Artificial Liquid Membrane Extraction. TrAC-Trends Anal. Chem. 2019, 113, 25–31. [Google Scholar] [CrossRef]
  28. Sajid, M. Porous Membrane Protected Micro-Solid-Phase Extraction: A Review of Features, Advancements and Applications. Anal. Chim. Acta 2017, 965, 36–53. [Google Scholar] [CrossRef]
  29. Sajid, M.; Woźniak, M.K.; Płotka-Wasylka, J. Ultrasound-Assisted Solvent Extraction of Porous Membrane Packed Solid Samples: A New Approach for Extraction of Target Analytes from Solid Samples. Microchem. J. 2019, 144, 117–123. [Google Scholar] [CrossRef]
  30. Sajid, M.; Alhooshani, K. Ultrasound-Assisted Solvent Extraction of Organochlorine Pesticides from Porous Membrane Packed Tea Samples Followed by GC–MS Analysis. Microchem. J. 2020, 152, 104464. [Google Scholar] [CrossRef]
  31. Kafilzadeh, F. Assessment of Organochlorine Pesticide Residues in Water, Sediments and Fish from Lake Tashk, Iran. Achiev. Life Sci. 2015, 9, 107–111. [Google Scholar] [CrossRef] [Green Version]
  32. Sajid, M.; Basheer, C.; Narasimhan, K.; Buhmeida, A.; Qahtani, A.; Al-ahwal, M.S. Persistent and Endocrine Disrupting Organic Pollutants: Advancements and Challenges in Analysis, Health Concerns and Clinical Correlates. Nat. Environ. Pollut. Technol. 2016, 15, 733–746. [Google Scholar]
  33. Zhao, L.; Lee, H.K. Application of Static Liquid-Phase Microextraction to the Analysis of Organochlorine Pesticides in Water. J. Chromatogr. A 2001, 919, 381–388. [Google Scholar] [CrossRef] [PubMed]
  34. Hassan, A.A.; Sajid, M.; Al Ghafly, H.; Alhooshani, K. Ionic Liquid-Based Membrane-Protected Micro-Solid-Phase Extraction of Organochlorine Pesticides in Environmental Water Samples. Microchem. J. 2020, 158, 105295. [Google Scholar] [CrossRef]
  35. Płotka-Wasylka, J. A New Tool for the Evaluation of the Analytical Procedure: Green Analytical Procedure Index. Talanta 2018, 181, 204–209. [Google Scholar] [CrossRef]
  36. Pena-Pereira, F.; Wojnowski, W.; Tobiszewski, M. AGREE—Analytical GREEnness Metric Approach and Software. Anal. Chem. 2020, 92, 10076–10082. [Google Scholar] [CrossRef] [PubMed]
  37. Nowak, P.M.; Kościelniak, P. What Color Is Your Method? Adaptation of the Rgb Additive Color Model to Analytical Method Evaluation. Anal. Chem. 2019, 91, 10343–10352. [Google Scholar] [CrossRef]
  38. Gałuszka, A.; Migaszewski, Z.M.; Konieczka, P.; Namieśnik, J. Analytical Eco-Scale for Assessing the Greenness of Analytical Procedures. TrAC-Trends Anal. Chem. 2012, 37, 61–72. [Google Scholar] [CrossRef]
  39. NEMI. Available online: https://www.nemi.gov/about/ (accessed on 21 February 2023).
  40. Sajid, M.; Płotka-Wasylka, J. Green Analytical Chemistry Metrics: A Review. Talanta 2022, 238, 123046. [Google Scholar] [CrossRef]
  41. Lakshmi HimaBindu, M.R.; Angala Parameswari, S.; Gopinath, C. A Review on GC-MS and Method Development and Validation. Int. J. Pharm. Qual. Assur. 2013, 4, 42–51. [Google Scholar]
  42. Asati, A.; Satyanarayana, G.N.V.; Srivastava, V.T.; Patel, D.K. Determination of Organochlorine Compounds in Fish Liver by Ultrasound-Assisted Dispersive Liquid–Liquid Microextraction Based on Solidification of Organic Droplet Coupled with Gas Chromatography-Electron Capture Detection. J. Chromatogr. A 2018, 1561, 20–27. [Google Scholar] [CrossRef] [PubMed]
  43. Manuelmolina-Ruiz, J.; Cieslik, E.; Cieslik, I.; Walkowska, I. Determination of Pesticide Residues in Fish Tissues by Modified QuEChERS Method and Dual-d-SPE Clean-up Coupled to Gas Chromatography–Mass Spectrometry. Environ. Sci. Pollut. Res. 2014, 22, 369–378. [Google Scholar] [CrossRef] [PubMed]
  44. Chen, S.; Yu, X.; He, X.; Xie, D.; Fan, Y.; Peng, J. Simplified Pesticide Multiresidues Analysis in Fish by Low-Temperature Cleanup and Solid-Phase Extraction Coupled with Gas Chromatography/Mass Spectrometry. Food Chem. 2009, 113, 1297–1300. [Google Scholar] [CrossRef]
  45. Shrivas, K.; Wu, H.F. Ultrasonication Followed by Single-Drop Microextraction Combined with GC/MS for Rapid Determination of Organochlorine Pesticides from Fish. J. Sep. Sci. 2008, 31, 380–386. [Google Scholar] [CrossRef] [PubMed]
  46. Darko, G.; Akoto, O.; Oppong, C. Persistent Organochlorine Pesticide Residues in Fish, Sediments and Water from Lake Bosomtwi, Ghana. Chemosphere 2008, 72, 21–24. [Google Scholar] [CrossRef]
Figure 1. Schematic of the proposed extraction procedure.
Separations 10 00233 g001
Figure 2. Optimization of type of extraction solvent.
Separations 10 00233 g002
Figure 3. Optimization of extraction solvent volume.
Separations 10 00233 g003
Figure 4. Optimization of mass of sample.
Separations 10 00233 g004
Figure 5. Optimization of ultrasound intensity.
Separations 10 00233 g005
Figure 6. Optimization of extraction time.
Separations 10 00233 g006
Figure 7. Greenness evaluation of developed method using (a) GAPI and (b) AGREE metrics.
Separations 10 00233 g007
Table 3. Initial, range, and optimum extraction conditions.
ParameterInitial Value Range Investigated in Optimization ExperimentsOptimum Value
Extraction solvent -n-hexane, DCM, n-hexane:DCM (1:1), chloroform, methanol, tolueneToluene
Extraction solvent volume (mL)1.00.5–5.03.0
Mass of sample (mg)250125–1000500
Ultrasound intensityMediumLow, medium, highMedium
Extraction time (min)30 15–7560
Table 4. Analytical figures of merit for the proposed method.
AnalyteCorrelation Coefficient (R2) Linear Range (ng/g)LOD (ng/g)LOQ (ng/g)RSDs (%)
100 ng/g (n = 6)
Intra-DayInter-Day
Heptachlor0.995710–1000 2.99.75.86.0
Aldrin0.99895–10003.410.18.99.1
Heptachlor Epoxide0.992210–10003.310.510.010.3
Trans-chlordane0.99505–1000 3.410.39.710.3
Endosulfan I0.995210–10003.410.59.611.6
Cis-chlordane0.995620–10005.819.78.99.5
Dieldrin0.99955–1000 1.55.08.910.4
4,4′-DDE0.997910–1000 3.110.29.311.1
Endrin0.997410–1000 2.99.95.67.7
Endosulfan II0.999110–1000 3.210.710.811.9
4,4′-DDD0.996210–1000 3.310.18.38.5
Endrin Aldehyde0.998810–1000 3.210.18.69.1
Endosulfan Sulfate0.996720–1000 6.819.713.513.8
4,4′-DDT0.998910–10003.49.610.611.2
Methoxychlor0.99825–1000 1.85.29.110.3
Acceptable criteria for RSDs: <15%.
Table 5. Relative recoveries of OCPs after spiking pooled dried fish samples (n = 3).
AnalyteSpike Level 50 ng/gSpike Level 100 ng/gSpike Level 250 ng/g
Relative Recovery (%)RSDs (%)Relative Recovery (%)RSDs (%)Relative Recovery (%)RSDs (%)
Heptachlor 96.65.198.44.793.83.2
Aldrin 95.13.796.35.092.26.0
Heptachlor Epoxide 92.54.996.22.994.63.2
Trans-chlordane 89.75.491.54.494.64.9
Endosulfan I 89.54.696.84.994.56.1
Cis-chlordane 94.14.291.93.198.14.6
Dieldrin 96.63.897.42.089.22.9
4,4′-DDE 85.74.892.75.187.95.3
Endrin 88.24.391.64.589.83.9
Endosulfan II 98.42.996.15.190.06.0
4,4′-DDD 92.14.195.44.691.54.5
Endrin Aldehyde 99.13.698.23.3104.24.1
Endosulfan Sulfate 87.33.288.55.193.43.8
4,4′-DDT 96.11.8100.34.0100.16.8
Methoxychlor 88.22.286.12.588.63.5
Acceptable criteria for recoveries: 80–120%.
Table 6. Comparison of the current method with those reported in the literature.
MethodSolvents Employed and VolumeLinear Range LOD (ng/g)RSDs (%)Recoveries (%)Ref.
US-DLLME-SFO-GC-μECDAcetone (5 mL)
and 1-Undecanol (24 μL)
1–500 1.06–3.84<6.388.5–108.4[42]
QuEChERS-d-SPE-GC-MSAcetonitrile (10 mL),
chloroform (2 mL)
3–200 ng/mL1.0–3.0<1070–120[43]
LTC-SPE-GC–MSAcetonitrile (30 mL),
acetonitrile–toluene (3:1) (39 mL),
n-hexane (1 mL)
-0.5–20<13.578.7–113.7[44]
U-SDME-GC-MSMethanol (1 mL), toluene (1 µL)10–1000 0.59.4–1082.1–95.3[45]
Soxhlet Extraction-µC-GC-ECDAcetone: n-hexane (20:80 v/v) (150 mL),
n-hexane (13.5 mL)
-0.6– 3.0 ng/L5.0–1378–95[46]
UAE of membrane packed fish samples-GC-MSToluene (3 mL)5–1000, 10–1000 and 20–10001.5–6.8≤13.887.3–104.2This work
Disclaimer/Publisher’s Note: The statements, opinions and data contained in all publications are solely those of the individual author(s) and contributor(s) and not of MDPI and/or the editor(s). MDPI and/or the editor(s) disclaim responsibility for any injury to people or property resulting from any ideas, methods, instructions or products referred to in the content.

