1. Introduction
Biogenic amines (BAs) are a very large group of low-molecular-weight organic compounds containing nitrogen, which are mainly produced by microbes through the decarboxylation of free amino acids and amination and transamination of ketones and aldehydes [
1]. BAs can be classified according to their chemical structure into aliphatics, aromatics, and heterocyclics. They can be found in different food products rich in animal protein, such as meat or fish, as well as in fermented beverages (wine and beer). Fruits and vegetables contain BAs as endogenous components whose levels may be increased because of non-controlled microbial activity [
2].
BAs are natural metabolites of great importance for the proper functioning of the human organism. At low concentrations, they are essential for many biological functions, acting as neurotransmitters or hormones and also playing a key role in the regulation of body temperature and digestion. However, the consumption of food with high levels of BAs can cause several human health problems, including headaches, tension disorders, gastrointestinal and kidney problems, and anaphylactic shock [
1,
2]. In fact, some BAs have been identified as biomarkers for various human pathologies, including cancer, cardiovascular, autoimmune, and neurodegenerative disorders [
3]. For these reasons, the level of BAs has become an index of quality in various food products and their concentrations are regulated by different health agencies around the world such as the European Food Safety Authority (EFSA), World Health Organization (WHO), Food and Drugs Administration (FDA), etc. [
4]. In recent years, the cult of the body and the maintenance of high-level activity have driven the consumption of products for weight control, muscle gain, and extra energy. A large number of these products include extracts of bitter orange and other citrus fruits in their formulations, because of their relatively high content of different aromatic BAs, such as synephrine (SYN), octopamine (OCT), and tyramine (TYR), which have an adrenergic effect and structural similarities to the bioactive compounds ephedrine and adrenaline [
5,
6]. In citrus fruits, SNP is the most abundant, followed by OCT [
7]. Both para-SYN, commonly referred to as SYN, and
meta-SYN, also known as phenylephrine (PEP), gained scientific interest following the FDA’s 2004 ban on ephedrine-containing dietary supplements [
8]. Thus, the safety of botanical preparations for use as dietary supplements can be assessed using the guidance document published by the EFSA in 2009 [
9]. Although nutraceutical patents specify their compositions, such as that of Jones [
10], which includes SYN, OCT, at least one of TYR, N-methyltyramine, and hordenine, in many cases, not all the components are specified on commercial labels, or this information does not match the real content [
8].
The control of the abusive consumption of BAs widely implicated in food supplements is of great interest in order to preserve human health. Urine is the most widely selected matrix for bioanalysis due to the simplicity of sample collection, its relatively simple composition compared with other biological samples, and the fact that similar to blood, urine is considered an integrative biofluid that reveals the phenotypes and functions of different parts of the body within a single sample. The present work develops a targeted approach for the determination of SNP, OCT, TYR, and PEP in human urine. The selected aromatic BAs, which are likely to be contained in dietary supplements, have similar structures, all having a benzene ring with an attached hydroxyl group and an alkyl chain in the para-position (except PEP, which is in the meta-position) containing a primary or secondary amine group.
Several analytical methodologies have been described for the determination of the aromatic BAs studied here [
1,
2], including for the analysis of biological fluids capillary electrophoresis (CE) [
3,
11]; nuclear magnetic resonance (NMR) [
12]; gas chromatography (GC) [
13]; and liquid chromatography (LC) [
14,
15,
16,
17,
18,
19,
20,
21], with the latter being the most traditionally used. Among the different detectors coupled to LC systems for bioanalysis, tandem mass spectrometry (MS/MS) [
14,
15,
16,
19,
20,
21] and high-resolution MS (HRMS) [
17,
18] have been the most employed.
Several derivatization procedures have been proposed for BA determination to increase their volatility for GC separation [
13], to improve detection sensitivity (improving both absorbance and fluorescence measurements and MS ionization), chromatographic resolution, or even to modify the chemical properties of the target analytes to avoid matrix interferences [
1,
22]. Dansyl chloride (DNSCl) is a widely selected derivatizing reagent because it reacts with primary and secondary amines and provides very stable products in a short time that exhibit both fluorescence and visible/UV absorption properties and also favorable conditions for MS ionization [
22].
BAs are frequently present in biological matrices at low concentrations and therefore generally need a previous sample treatment step for cleaning and preconcentration. Although some procedures without sample preconcentration have been reported, solid-phase extraction (SPE) [
11,
14,
15,
18] is widely applied. The recent trends in sample treatment have moved toward miniaturized approaches. Studies in the literature highlight the application of liquid-phase microextraction procedures as well as those based on solid phases for BA preconcentration in foods. Thus, dispersive liquid–liquid microextraction (DLLME) [
23], ultrasound-assisted DLLME [
24], UA-DLLME using ionic liquids [
25], DLLME using magnetic ionic liquids [
26], and UA dispersive solid-phase extraction (UA-DSPE) [
27] have been applied in food analysis. However, to our knowledge, miniaturized sample processing techniques have not been applied for the determination of BAs in bioanalysis. Since its development, many improvements to DLLME have been proposed. The application of DLLME in the classical mode consists of the rapid injection of a mixture of two solvents (extractant and dispersant) into the aqueous sample, thus providing the emulsification of the extractant solvent through the donor phase, and consequently, the partition equilibrium of the analyte is rapidly reached [
28]. DLLME has provided high extraction efficiencies for very different samples, including biological fluids [
29]. The DLLME–derivatization coupling can be carried out in six different modes that are mainly adopted depending on the characteristics of both analytes and sample matrix. “Simultaneous derivatization and DLLME mode” is applied in a single step, and this method is the most preferred because of its simplicity and speed [
30].
The objective of this study was the development of a reliable and sensitive analytical method based on ultra-high performance liquid chromatography (UHPLC) combined with HRMS for the determination in human urine of four BAs (TYR, OCT, SNP, and PEP) that are generally contained in dietary supplements and can alter the normal functioning of the organism at high concentrations, and they are also biomarkers of some diseases. For this purpose, DLLME was applied for the preconcentration of samples previously subjected to a derivatization step. In addition, under the same experimental conditions, a non-targeted study was carried out to investigate the presence of BA metabolites and the related compounds in the samples studied.
2. Materials and Methods
2.1. Materials and Reagents
Phenylephrine hydrochloride (PEP, C9H14ClNO2), tyramine (TYR, C8H11NO), (±)-synephrine (SNP, C9H13NO), and (±)-octopamine hydrochloride (OCT, C8H12ClNO2), as well as dansyl chloride (DNSCl) and phenylpropanolamine (PPA), which were used as derivatization agent and internal standard (IS), respectively, were purchased from Sigma-Aldrich (St. Louis, MO, USA). HPLC-grade acetone, acetonitrile, and methanol were provided by Chem-Lab (Zedelgem, Belgium). Chloroform and formic acid were obtained from Sigma-Aldrich. Ammonia aq. (25%), ethanol and sodium carbonate were purchased from Panreac (Barcelona, Spain), and sodium hydrogen carbonate was purchased from Merck (Darmstadt, Germany). For creatinine analysis, creatinine anhydrous, picric acid, and dibasic potassium phosphate were purchased from Sigma, and sodium dodecyl sulfate was purchased from Fluka (Merck). High-quality water was obtained with a Milli-Q system (Millipore, Bedford, MA, US).
The individual stock solutions of the BAs (1000 mg L−1) were prepared in methanol and stored in glass vials at −20 °C. The working solutions of a mixture containing the four analytes (50 mg L−1) were prepared via water dilution and stored in the fridge. A stock solution (1000 mg L−1) of PPA as IS was prepared in methanol and stored at −20 °C. A working solution of PPA 5 mg L−1 was prepared via water dilution. DNSCl (3000 mg L−1) was prepared in acetone.
2.2. Instrumentation
The analyses were performed on an Agilent 1290 Infinity II Series UHPLC system (Agilent Technologies, Santa Clara, CA, USA) equipped with an automated multisampling module and a binary pump of high speed. A Zorbax Rapid-Resolution High-Definition (RRHD) Eclipse Plus C18 (Agilent, Waldbronn, Germany) was used with a reversed-phase column of 100 mm length, 2.1 mm internal diameter, and 1.8 μm particle size.
Detection was performed with an Agilent 6550 Q-TOF mass spectrometer (Agilent Technologies) using an Agilent Jet Stream dual-electrospray interface and electrospray ionization (AJS-Dual ESI). The MassHunter Workstation Data Acquisition software (Agilent Technologies, Revision B.08.00) was used to set up the experimental parameters for chromatographic separation and detection. Data analysis was conducted with the MassHunter Qualitative Analysis Navigator software (Agilent Technologies, Revision B.08.00) and MS-DIAL (Version 4.80, RIKEN).
The sample treatment stage required the use of a water-bath PRECISTERM series equipped with a thermostat (Selecta group, Spain), a centrifuge (Eba 20, Hettich Zentrifugen, Tuttlingen, Germany), and an automated system for extracts’ evaporation/concentration (XcelVap XCV-5400, Biotage, Uppsala, Sweden). Creatinine determination was carried out using a UV–visible spectrophotometer (ATI Unicam UV2) equipped with the VISION V3.00 software package. Quartz cells of 1 cm length path were used for absorbance measurements at 25 °C.
2.3. UHPLC-HRMS Analysis
Standards and samples were thermostated at 5 °C into an autosampler, while the analytical column was kept at 25 °C. Chromatographic separation was performed using a mobile phase consisting of water (solvent A) and acetonitrile (solvent B), both containing 0.1%
v/
v formic acid and with the following program: 0–10 min: 10–90% B; 10–12 min: 90% B; 12–12.5 min: 90–10% B; and 12.5–14 min: 10% B. The flow-rate mobile phase was kept constant at 0.4 mL min
−1. The injection volume was 20 μL. Under these experimental conditions, the derivatized analytes were eluted with retention times between 5.09 and 6.58 min and IS at 7.38 min (
Table 1).
HRMS analysis was carried out using ESI in positive mode. The nebulizer gas pressure was set at 40 psi, whereas the drying gas flow was set at 16 L min−1 at a temperature of 150 °C, and the sheath gas at 12 L min−1 at 300 °C. The capillary spray, nozzle, fragmentor, and octopole 1 RF Vpp voltages were 4000, 400, 360, and 750 V, respectively. For the MS scan, profile data in the 50–1000 m/z range were acquired under a 2 GHz extended dynamic range mode (3 spectra/s, 333.3 ms/spectrum, and 2675 transients/spectrum). The collision energies of 0, 10, and 40 V were applied in each cycle.
Data were converted to Analysis Base Framework (ABF) formats and treated with MS-DIAL, which involves peak selection, deconvolution, compound identification, and alignment of peaks. Targeted processing was carried out to identify and quantify the main analytes using exact mass MS, MS/MS data, and retention time. Experimental and theoretical
m/
z values for each monitored compound are shown in
Table 1. In percentage terms, the errors for the obtained
m/
z values with respect to the theoretical ones were calculated considering the difference between experimental and theoretical masses, which was divided by the theoretical value and multiplied by 10
6. Error masses between −0.91 and 0.24 ppm were obtained for the four targeted BAs.
2.4. Samples
Urine samples were obtained from three healthy individuals, pooled, spiked with the BAs at a concentration of 500 ng mL−1, and used for the method optimization and validation steps. As urine samples from individuals consuming dietary supplements containing BAs were not available, the proposed method was applied to the analysis of urine obtained from nine volunteers. All volunteers were healthy individuals aged between 22 and 70 years. The subjects collected their urine samples using sterile plastic containers, which were frozen at −20 °C for 24 h before analysis. For this, the urine samples were defrosted in a water bath at 30 °C and centrifuged at 3000 rpm for 4 min, and the supernatant was collected and filtered through a 0.22 μm polytetrafluoroethylene (PTFE) filter membrane.
2.5. Sample Procedure
For the derivatization step, the conditions selected by Cao et al. [
26] were applied, with slight modifications. Briefly, 5 mL of defrosted human urine, previously centrifuged and filtered, and 100 μL of PPA (IS, 5 mg L
−1) were placed in a glass tube, and the pH was adjusted to 9 by adding 500 μL of a 1 M NaHCO
3/Na
2CO
3 buffer solution. Next, 200 μL of DNSCl (3000 mg L
−1 in acetone) was added, and the mixture was stirred vigorously by hand for a few seconds before being placed in a water bath at 60 °C for 15 min to allow the reaction to proceed. The mixture was then cooled to room temperature, and 60 μL of 25% aqueous ammonia solution was added to stop the dansylation reaction.
For the DLLME step, a mixture of 350 μL chloroform as extractant solvent and 2 mL ethanol as disperser solvent was rapidly injected into the derivatized urine phase and vigorously shaken by hand for a few seconds. A cloudy solution was obtained consisting of CHCl3 microdrops dispersed through the donor phase in which the BAs were extracted. The solvent mixture was centrifuged for 4 min at 3000 rpm, and the resulting organic phase was recovered from the bottom of the tube and transferred to another glass tube of smaller capacity to be evaporated under a stream of compressed air. Finally, 150 μL of acetonitrile was added to the dried extract, and 20 μL of the reconstituted extract was injected into the UHPLC system.
The optimization and characterization of the method were carried out using urine spiked at different concentrations. The samples were spiked, stirred for a few seconds, and allowed to stand for 1 h before applying dansylation, DLLME step, and instrumental analysis. Each analysis was conducted in triplicate.
2.6. Analysis of Creatinine in Urine Samples
A 2 mL volume of picrate reagent, consisting of a mixture of equal volumes of 25 mM picric acid solution and 300 mM phosphate buffer (with pH adjusted to 12.7 with sodium hydroxide) dissolved in 0.2 g L−1 sodium dodecyl sulfate solution, was placed in a 1 cm path length quartz cuvette, for the determination of creatinine in the urine samples. Calibration curves were obtained as follows: 200 μL of the aqueous creatinine standard solution in the 50–2500 mg L−1 range was placed in the cuvette and mixed with a picrate reagent solution. The absorbance of the picrate–creatinine complex was measured for 2 min at 510 nm. In this assay, the parameter used as an analytical signal was the reaction rate. Creatinine in the urine samples was determined by applying the same experimental conditions used for the calibration step in which the creatinine standard solution was replaced by 2 mL of urine. To verify the accuracy of the applied method, “Organic Contaminants in Smokers’ Urine (Frozen)”, a certified reference material (Standard Reference Material, SRM 3672) obtained from the National Institute of Standards and Technology (Gaithersburg, MD, USA), was used. SRM 3672 was certified with a content of creatinine of 734 ± 5 mg kg−1, and the accuracy of the applied method was demonstrated because a creatinine content of 736 ± 7 mg kg−1 (n = 3) was obtained.
3. Results and Discussion
3.1. Optimization of the Chromatographic Separation
The resolution power for the derivatized compounds was studied with two different columns: a Zorbax RRHD Eclipse Plus C18 (1.8 μm, 100 × 2.1 mm) and an ACE Excel 3 C18-PFP (3 μm, 150 × 4.6 mm), the latter combining simultaneous C18 and pentafluorophenyl (PFP) separation mechanisms. For the latter, the elution of the derivatized BAs was tested using isocratic elution with different percentages of water (solvent A) and acetonitrile (solvent B), both containing 0.1% v/v formic acid. Thus, the organic solvent concentration varied between 60% and 90%, the best results being obtained with the 40:60 A:B proportion flowing at a rate of 1 mL min−1. However, under these conditions, OCT was eluted at 13.11 min, the SNP and PEP position isomers were co-eluted at 20.82 min, and TYR was eluted at 24.10 min, which means rather long retention times.
On the other hand, the separation efficiency of the Zorbax column was evaluated with a reduction in the flow rate from 1 to 0.4 mL min−1, which also benefited the MS ionization efficiency. Under isocratic conditions, the BAs did not separate well, and unsuitable chromatographic peak shapes were obtained. Accordingly, gradient elution was assayed and, of the different gradients tested, the best results were obtained with the one starting with a linear gradient from 10% to 90% in 10 min, maintaining this proportion for 2 min. Finally, the mobile phase was programmed to reach the initial composition in 0.5 min, being maintained for 1.5 min before the next injection. Under these conditions, the derivatized analytes were eluted with retention times of 5.09, 6.15, 6.45, and 6.58 min for OCT, SNP, PEP, and TYR, respectively, obtaining an appropriate peak resolution.
3.2. Sample Treatment Optimization
A preconcentration step was included in the sample treatment to increase the sensitivity of the method. Among the different miniaturized methodologies, DLLME was selected considering the multiple advantages that this technique has demonstrated for different analytes and matrices. To increase the affinity of the target compounds toward the extractant phase, it was decided to convert them to chemical forms of lower polarity using DNSCl as a derivatization reagent. For this purpose, the dansylation procedure was optimized based on the conditions of Cao et al. [
26], using 5 mL of a urine sample spiked with the target BAs at 500 ng mL
−1. It was verified that maximum sensitivity was reached at pH 9 with the addition of 0.2 mL DNSCl (3000 µg mL
−1).
The DLLME procedure was optimized using 5 mL of a urine sample spiked with the BAs at 500 µg L
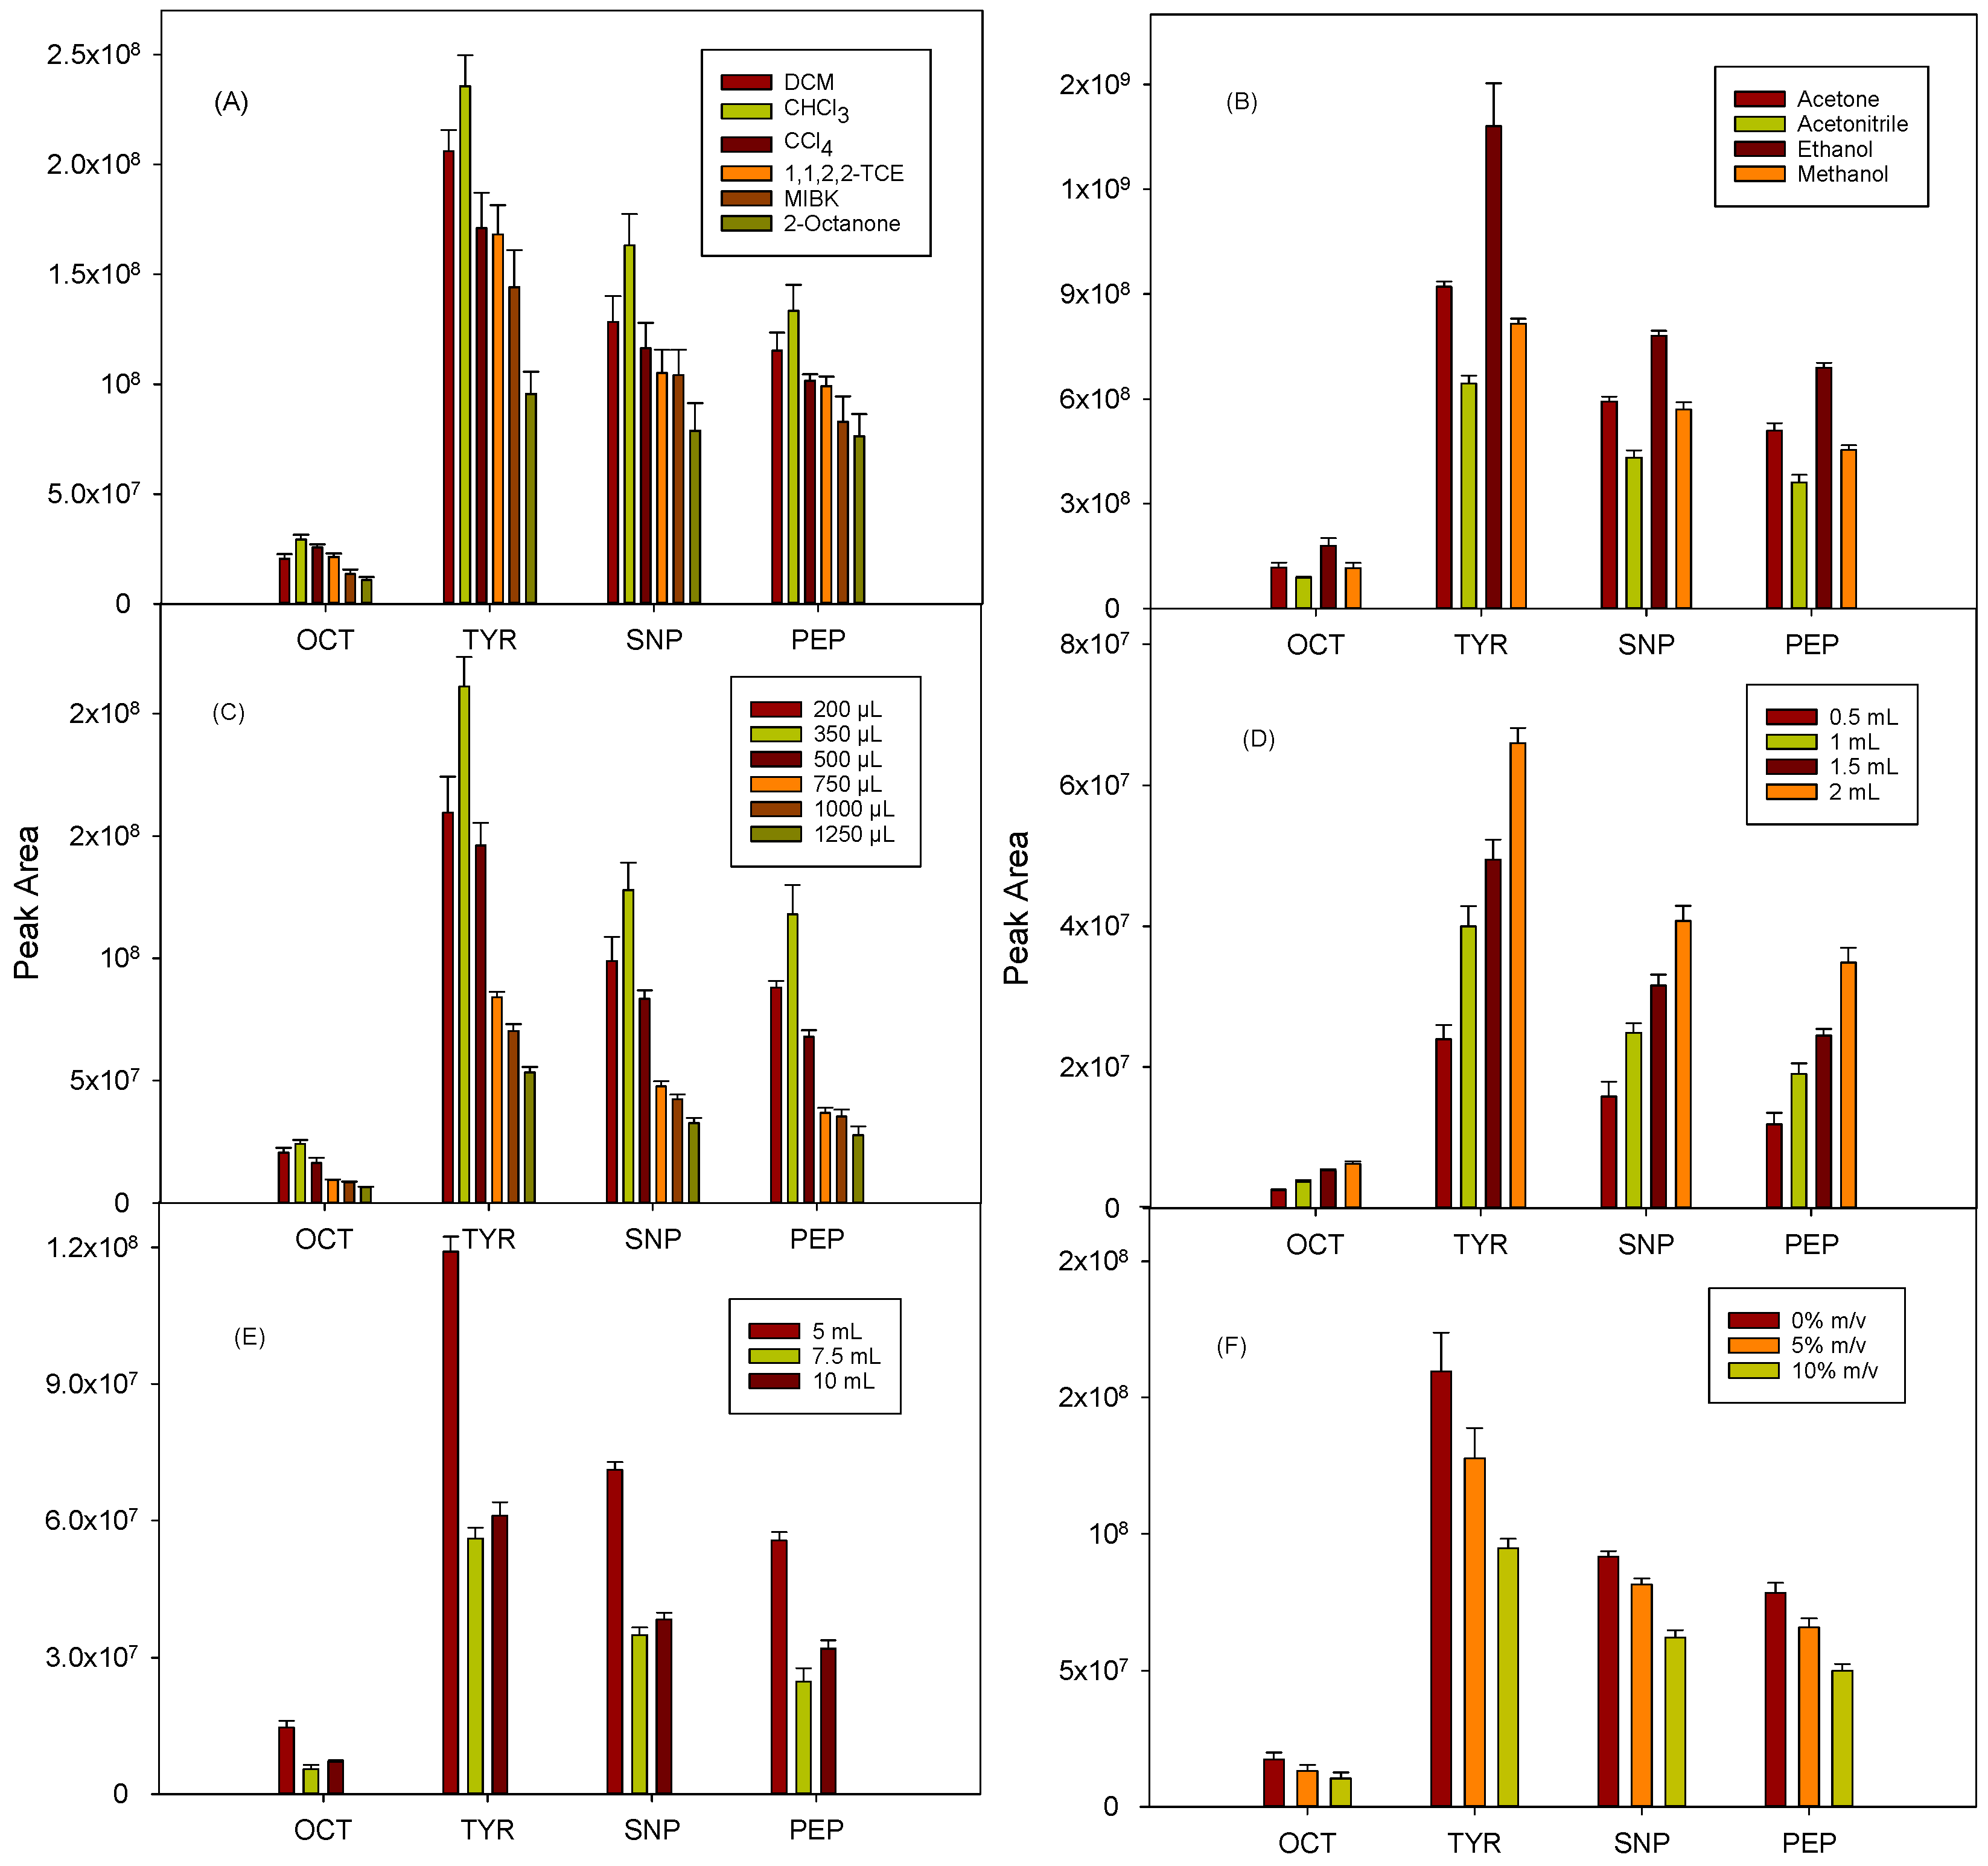
−1, and all experiments were performed in triplicate. For the selection of the extractant solvent, a high affinity must be considered for the analytes, and it should be miscible with the disperser agent but immiscible in the aqueous phase. In this experiment, a series of halogenated and non-halogenated organic solvents (0.5 mL) were tested, using ethanol (1.5 mL) as disperser in all cases, and the mixture was vigorously shaken by hand for a few seconds. The solvents denser than water, such as dichloromethane (DCM), chloroform, carbon tetrachloride, and 1,1,2,2-tethrachloroethane (1,1,2,2-TCE), were found to give better results than the tested organic solvents lighter than water (methyl isobutyl ketone (MIBK) and 2-octanone), with the added advantage of their easier collection after the centrifugation of the ternary mixture. Chloroform provided the best results for all the compounds (
Figure 1A), which may be due to its average polarity and water solubility values with respect to the other solvents assayed, which could favor the extraction of the dansylated derivatives. Consequently, chloroform was chosen.
Acetone, ethanol, methanol, and acetonitrile (1 mL) were investigated as disperser solvents, considering their miscibility in both the aqueous and extractant phases. In all cases, 0.5 mL of chloroform and 5 mL of fortified urine (500 µg L
−1) were used. As shown in
Figure 1B, the highest signals were obtained for all the analytes with ethanol, followed by acetone, methanol, and acetonitrile. Commercial chloroform is usually stabilized with ethanol to prevent oxidation and generation of unwanted substances (hydrochloric acid and phosgene), and this solvent combination was the most suitable for the proposed DLLME procedure. The results obtained, together with the low toxicity of ethanol, led to its selection as the disperser agent.
The influence of the volume of chloroform was studied in the range of 200 to 1250 μL. As shown in
Figure 1C, the extraction efficiency increased up to 350 µL and then decreased for higher volumes, probably due to dilution effects. Therefore, 350 μL was selected for further experiments. Regarding the ethanol volume, this parameter was studied between 0.5 and 2 mL. As observed in
Figure 1D, the larger the volume tested, the higher the signals obtained, probably due to a more efficient dispersion of the extractant phase. Considering that 2 mL is a relatively high volume of solvent for a miniaturized technique, assays with higher ethanol volumes were not tested, and this value was selected.
The influence of the sample volume on DLLME efficiency was optimized using 5, 7.5, and 10 mL of urine sample, using 350 µL chloroform and 2 mL ethanol as extractant and dispersant solvents, respectively.
Figure 1E shows that the best sensitivity was obtained for 5 mL, while a signal decrease was observed when the sample volume increased up to 10 mL, probably because of a matrix effect. Therefore, 5 mL of urine was selected.
The effect of the pH of the aqueous phase was not studied because it was determined by the conditions required to allow the derivatization of the analytes. The influence of the sodium chloride concentration in the aqueous phase (0, 5, and 10%
m/
v) was evaluated. As shown in
Figure 1F, the absence of salt provided the best results. Therefore, its addition was discarded.
Finally, considering the incompatibility of chloroform and the mobile phase applied for the chromatographic separation, the recovered extractant phase was evaporated and reconstituted using acetonitrile. For this purpose, acetonitrile volumes of 150 and 200 μL were tested and, as expected, 150 μL provided the best results, so this was the volume selected. Lower volumes were not assayed because of the difficulty of efficient reconstitution of the dry extract.
3.3. Method Validation
The range of linearity, precision, limits of detection (LODs) and quantification (LOQs), recovery, and trueness were estimated for method validation. The use of an IS was adopted to increase the precision of the method and to overcome the possible matrix effects. PPA was chosen as IS considering its similar chemical structure compared with the target BAs and its absence in the samples, which was assessed before analysis. A feature PPA has in common with the analytes is the benzene ring bonded to an alkyl chain containing an amine group. The presence of this primary amine allows it to be treated under the same conditions of derivatization and preconcentration as BAs. The retention time for the dansylated PPA under the selected elution conditions was 7.38 min.
To evaluate the possible matrix effect, calibration graphs were obtained in the presence of IS at 100 µg L
−1 level, for both aqueous solutions and two urine samples, by plotting the relationship between the peak areas of the analyte and IS versus analyte concentration using seven different concentrations. Statistically different values of slopes were obtained when comparing the slopes in the presence and absence of the matrix using a
t-test (
p < 0.05) (
Table 2). The sample matrix affected the DLLME extraction efficiency and/or instrumental measurement, leading to signal suppression. Nevertheless, matrix-matched calibration could be applied for the quantification of the samples, since there were no significant differences between the slopes obtained using the standard addition method for both urine samples (
p > 0.05).
Linearity in the 2.5–500 µg L
−1 range was obtained for SNP, PEP, and TYR, while for OCT, it was between 10 and 500 µg L
−1 (
Table 3).
The repeatability of the method was evaluated by consecutively analyzing in quintuplicate a urine sample spiked at two concentrations levels, 50 and 200 µg L
−1, with a mixture of the four BAs, showing relative standard deviation (RSD) values in the 12.4–16.1% and 4.2–12.2% ranges for the lowest and highest concentration, respectively. However, when repeatability was calculated using PPA as IS, a notable improvement in the RSD values was observed, now ranging between 5.1% and 8.1% for 50 µg L
−1 and between 3.4% and 10.2% for 200 µg L
−1 (
Table 3). The LOQs for the four BAs, which were calculated considering a signal-to-noise (S/N) ratio of 10, ranged from 1.8 to 12 µg L
−1, as shown in
Table 3. The LODs, obtained for S/N of 3, were between 0.54 and 3.6 µg L
−1. The preconcentration factors (PFs) were calculated as the ratio of the calibration slopes for the UHPLC-Q-TOF-MS method applying DLLME and those obtained without the preconcentration step. The PF values were in the range of 17.9 to 24.2.
Figure 2 shows the EICs obtained for a urine sample spiked with the BAs at 80 µg L
−1 using the proposed method, as well as those obtained for a blank sample.
To study the trueness of the method, recovery studies were performed because no reference materials were available. The analysis in triplicate of one urine sample fortified at 25 and 100 μg L
−1 provided recovery values in the ranges of 93.6–114% and 96.8–103% for the lowest and higher concentrations, respectively (
Table 3).
A comparison of the proposed DLLME with the UHPLC-Q-TOF-MS method with others previously published related to the determination of the BAs in urine samples studied here is presented in
Table 4. The results highlight that the proposed method constitutes the first application of a liquid-phase microextraction method to preconcentrate SYN, PEP, OCT, and TYR from urine samples. For those treatments involving SPE [
14,
15,
17,
18], the consumption of higher organic solvents (in the 3–8.25 mL) and the time involved can be highlighted, also resulting in lower sensitivities than those attained with the proposed method. Moreover, the derivatization of BAs resulted in improved sensitivity, as not only products with lower polarity and consequently higher affinity toward the DLLME organic phase but also a higher MS ionization efficiency was achieved. In addition, only two previous studies [
17,
18] used HRMS, allowing a metabolomic search to measure the exact masses of potential metabolites and compounds related to the target analytes. It is noteworthy that the proposed method allowed us to attain even better sensitivities than those provided using tandem MS/MS with a QTrap analyzer [
14,
15,
16,
19,
20], with the added advantage of enabling the use of the non-targeted approach for searching, thus avoiding added sample treatments such as enzymatic hydrolysis [
19,
21].
3.4. Analysis of Urine Samples
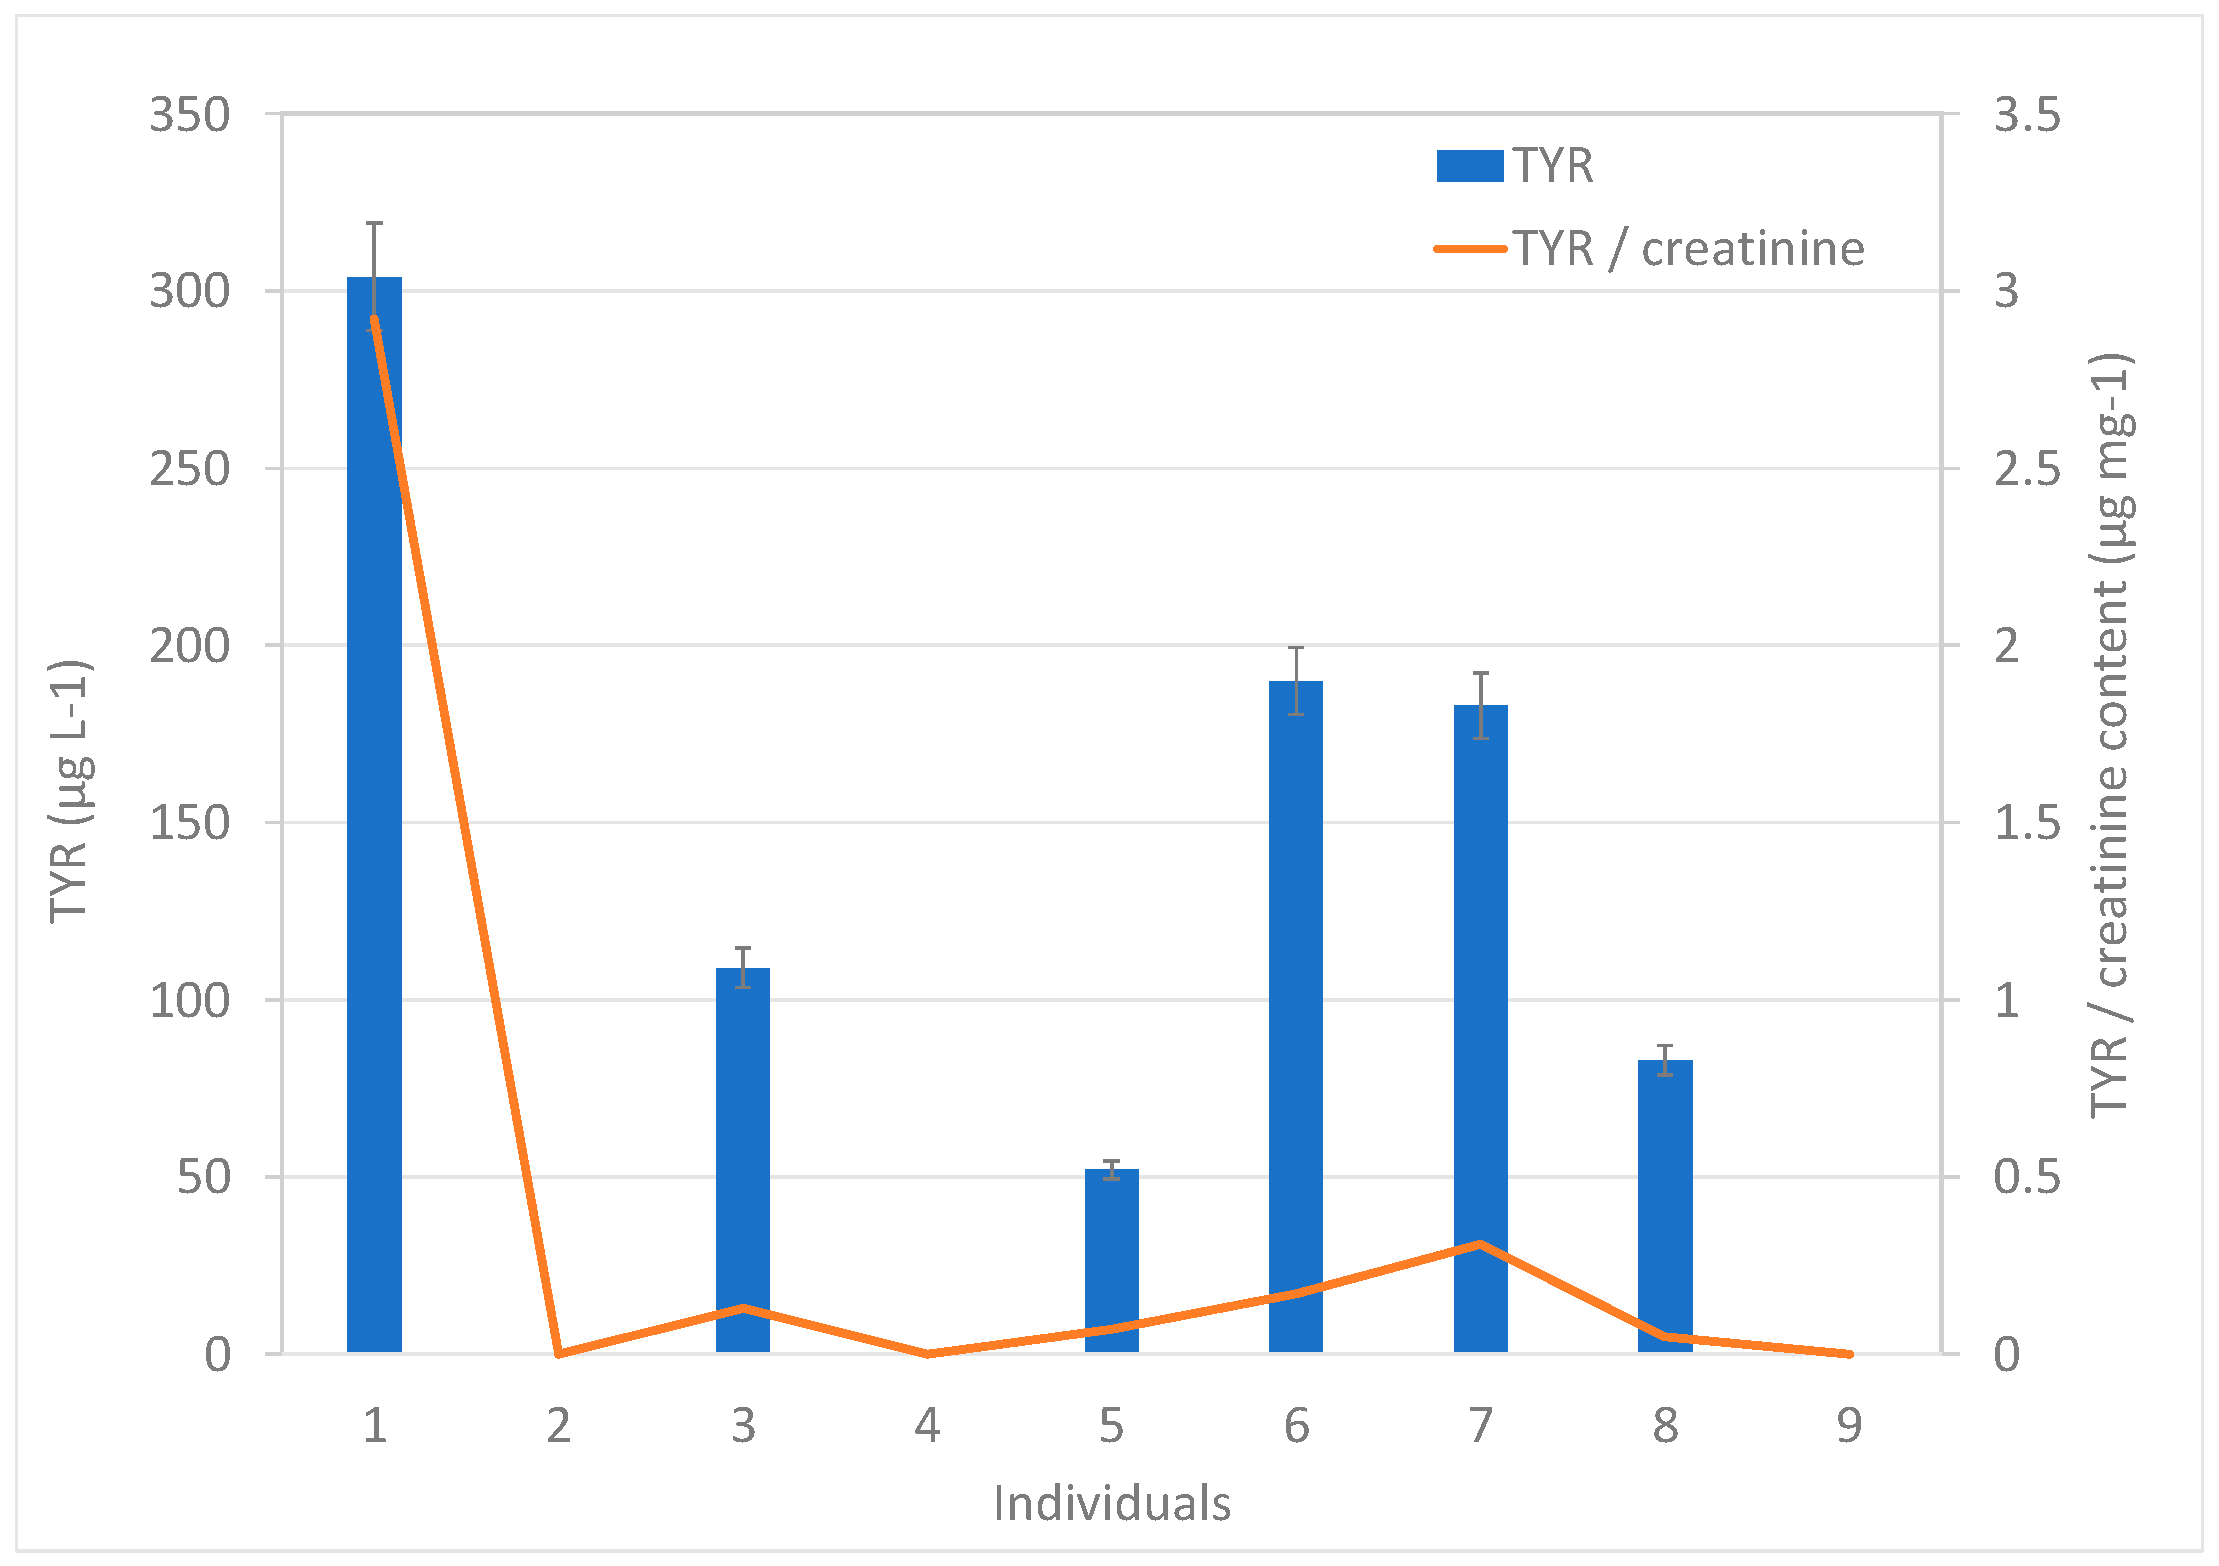
To demonstrate the applicability of the proposed methodology, the urine samples from nine healthy volunteers were analyzed. The bioamines SYN, OCT, and PEP were not detected in any sample, whereas TYR was quantified in 67% of the samples. It was not surprising that PEP was not detected in the samples, considering the controversy surrounding its actual availability in nature, being widely considered to be synthetic in nature [
8]. TYR concentrations ranged between 52 and 304 µg L
−1, as shown in
Figure 3. The creatinine-related BA contents were obtained. Considering the difference in the volumes of urine excreted by each individual, the creatinine content was used as a correction factor, knowing that, unlike urine, creatinine is produced and eliminated at a relatively constant rate. Thus, the amount of any substance eliminated through urine can be compared with the amount of creatinine in urine. The analysis of creatinine in the nine urine samples provided contents in the 72–1550 mg L
−1 range. The values of the TYR/creatinine ratios were in the range between 0.05 and 2.92 µg mg
−1 (
Figure 3).
3.5. Non-Targeted Analysis
The possible identification of BA metabolites and other related compounds in the analyzed samples was aborded by processing the data through a non-targeted analysis strategy. For this, the data acquired using an all-ion method were processed using the MS-DIAL software, by searching for matching attributes of accurate masses, isotope patterns, and fragmentation data with a metabolomic-based methodology. For MS1 and MS2, tolerance masses of 0.01 and 0.025 Da were used, respectively, which established a minimum value of 1000 for peak height for detection. A sigma window value of 0.5 was selected for deconvolution. Based on the literature, an MS database was created including the 29 compounds from the metabolites of the targeted BAs and related compounds that were searched using this non-targeted approach (
Table 5). The compounds included in
Table 5 can be classified into two different categories based on whether they are a kind of BA metabolite derived from the targeted ones (OCT, TYR, SNP, and PEP) or a related compound, that is, the ones that share similarities with the main targeted analytes in terms of their chemical structure.
Structurally, OCT, TYR, SNP, and PEP are quite similar to epinephrine (adrenaline), norepinephrine (noradrenaline), and ephedrine, and were included in the non-targeted study even though ephedrine is a derivative of phenylpropanolamine and does not contain a
para-position substituted hydroxyl group [
31]. Furthermore, N-methyltyramine was also searched for because it is derived from TYR under the same biosynthetic pathway. Hordenine and N-methyltyramine are included in some dietary supplements, and both were searched in the analyzed samples. Two more related compounds, isopropyloctylamine (Iso-propyl-OCT) and isoprenaline, were also searched in all samples even though their absence was reported in
Citrus aurantium by Mercader et al., and the probability of being detected was minimal, but their lipolytic activity has been described [
32].
Three of the four targeted analytes (TYR, OCT, and SNP) are derived via the same biosynthetic route, which starts with the amino acid L-phenylalanine followed by L-tyrosine. L-TYR, L-OCT, and L-SYN are synthetically obtained, in this order, from L-tyrosine. As reported by Thevis et al. [
15], OCT is metabolized to
p-hydroxymandelic acid (MNSP). On the other hand, Medana et al. reported no demethylation in the SNP metabolism and found MNSP and
p-hydroxyphenylglycol (MOCT) as the main SYN metabolites in plasma and urine, both generated through oxidative deamination and phase II conjugates SYN sulfate (SYN-S) and SYN glucuronide (SYN-G) [
17]. Additionally, TYR is metabolized to
p-hydroxyphenylacetaldehyde (MTYR1), which can generate
p-hydroxyphenylacetic acid (MTYR2) in a subsequent step [
15].
The possible formation of glucuronide (G) and sulfate (S) conjugates (OCT-G, TYR-G, SNP-G, and PEP-G; and OCT-S, TYR-S, SNP-S, and PEP-S) was also evaluated. For this reason, other possible putative compounds not described in the bibliography so far were also included in the database, namely OCT-G, TYR-G, SNP-G, and PEP-G; and OCT-S, TYR-S, SNP-S, and PEP-S. Glucuronide conjugates appear with the formation of an O-glycosidic bond between the BA hydroxyl group and a glucuronide molecule, while sulfonation occurs when a sulfate molecule binds a hydroxyl group of the BAs [
33].
The chance of a possible glucuronide and sulfate conjugation of the four main metabolites previously mentioned (MTYR1, MTYR2, MOCT, and MSNP) resulting in eight new metabolites (MTYR1-G, MTYR2-G, MOCT-G, and MSNP-G; and MTYR1-S, MTYR2-S, MOCT-S, and MSNP) was evaluated. This is a feasible option owing to the presence of a hydroxyl group in the benzene ring of each main metabolite, which is susceptible to undergoing these reactions. None of the compounds studied through the non-targeted approach were detected in the nine urine samples analyzed.


 and
and 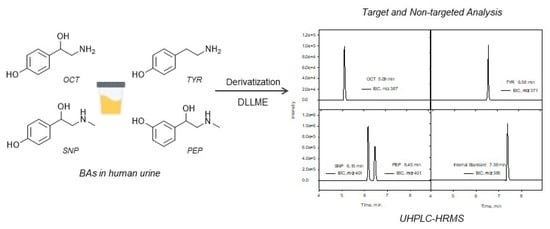


