Article

Rilpivirine and Dolutegravir Simultaneously Measured via RP-HPLC-PDA with Box–Behnken Design Application: A Study of Forced Degradation under Various Conditions

1
Department of Pharmacognosy, College of Pharmacy, King Khalid University, Abha 62529, Saudi Arabia
2
Department of Pharmacognosy, College of Pharmacy, Prince Sattam Bin Abdulaziz University, P.O. Box 173, Al-Kharj 11942, Saudi Arabia
3
Department of Clinical Pharmacy, Pharmacy Practice Research Unit (PPRU), College of Pharmacy, Jazan University, Jazan 45142, Saudi Arabia
4
Department of Pharmacognosy, Faculty of Pharmacy, Egyptian Russian University, Cairo-Suez Road, Badr City 11829, Egypt
*
Author to whom correspondence should be addressed.
Separations 2023, 10(3), 185; https://doi.org/10.3390/separations10030185
Submission received: 31 January 2023 / Revised: 23 February 2023 / Accepted: 2 March 2023 / Published: 8 March 2023

Abstract

:
Simultaneous estimation of rilpivirine (RLVN) and dolutegravir (DTGR) in bulk and tablet dosage forms via RP-HPLC-PDA with a Box–Behnken design (BBD) has been performed in this study to develop a fast, precise, timely and cost-saving method for estimating RLVN and DTGR in bulk and tablet dosage forms. The chromatographic conditions were optimized via the BBD, and the developed method was validated according to the ICH guidelines. Additionally, forced degradation studies were also conducted. RLVN and DTGR peaks were observed at retention times of 2.167 and 2.716 min, respectively, in a 6-min runtime. Kromasil 150 mm× 4.6 mm, 5 µm C 18 column was used. The flow rate of the mobile phase was 1.0 mL/min at a temperature of 30 °C. The mobile phase composition was a 0.1% OPA buffer and acetonitrile (ACN) in a 60:40 ratio. Elutes were measured at 260 nm (max) after being injected in a sample volume of 10 µL. The assay result of the marketed tablet was 99.19% and 99.09% for RLVN and DTGR, respectively. The results of forced degradation studies in different chemical environments conditions such as acid, base, dry heat, photo-stability, neutral, and oxidation conditions were observed for RLVN (5.96, 4.79, 3.27, 2.36, 0.99, and 4.35 in percentage degradation) and DTGR (5.67, 4.44, 4.09, 1.81, 0.43, and 4.28 in percentage degradation). The results of the validation parameters were within an acceptable range. The newly formed RP-HPLC-PDA method is novel, fast, precise, time-saving, and cost-effective.

1. Introduction

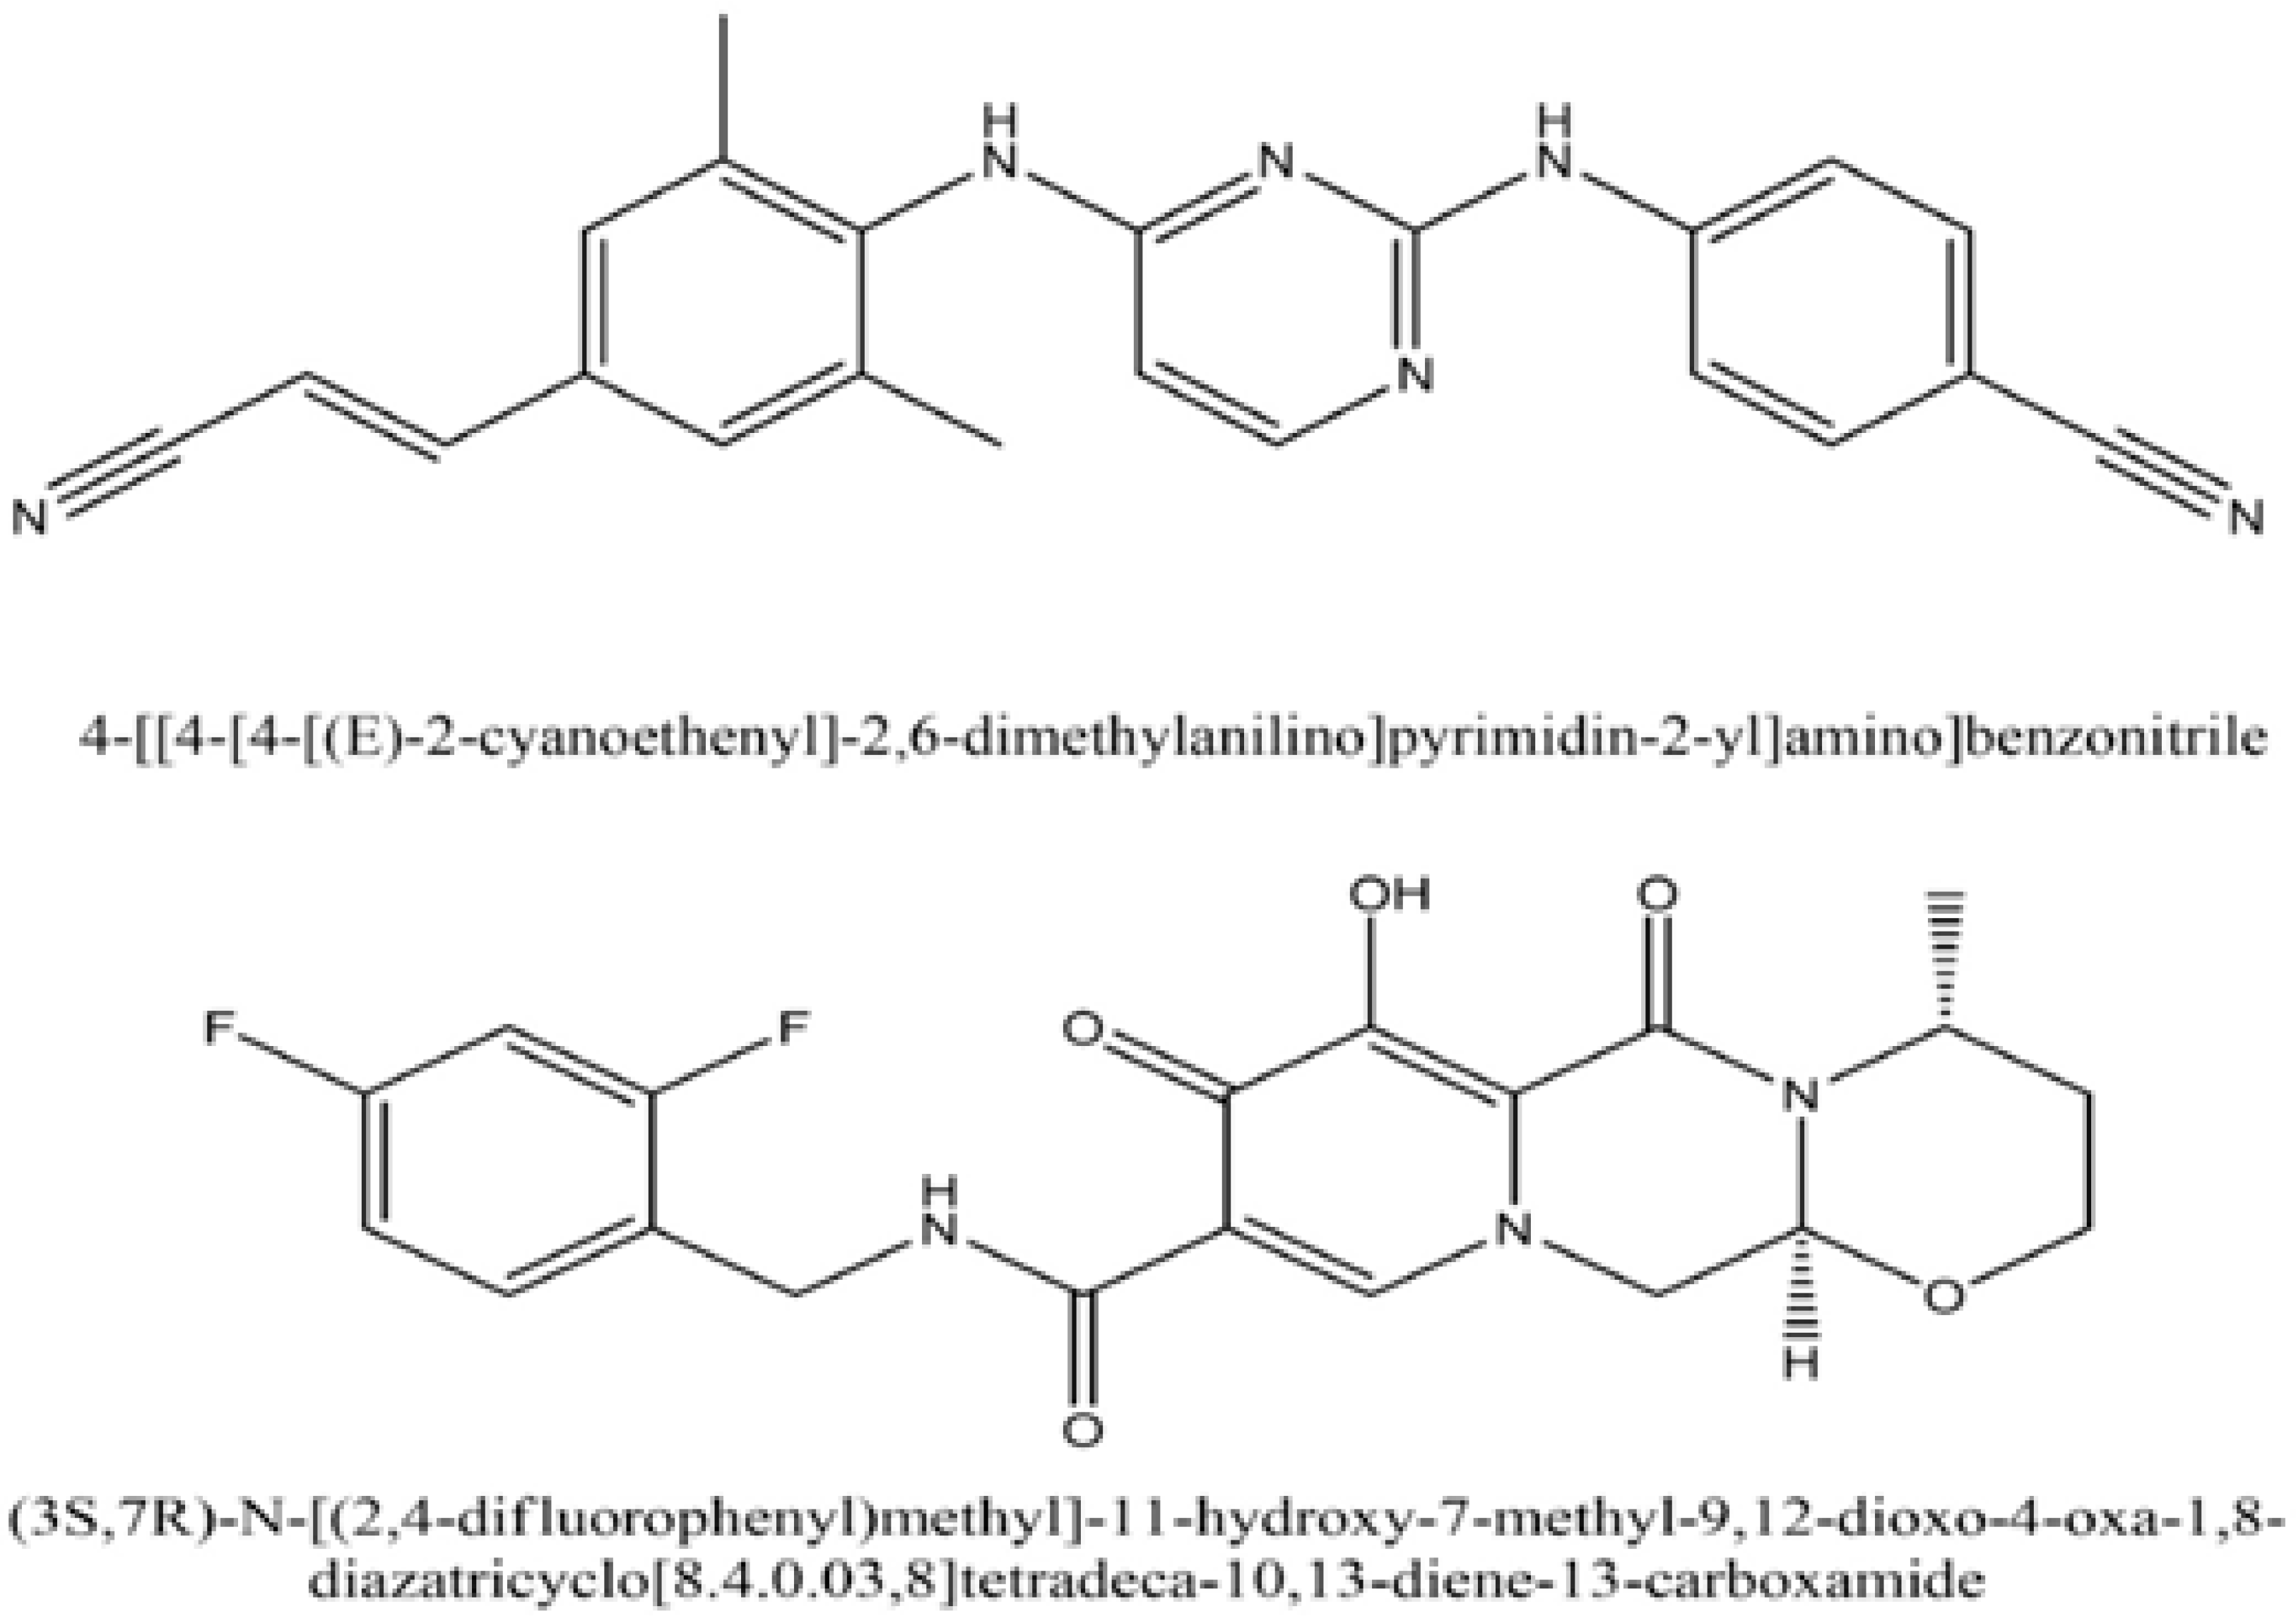
Rilpivirine (RLVN), a non-nucleoside reverse transcriptase inhibitor, is used to treat HIV-1 infections. It is a diarylpyrimidine, a pyrimidine nucleotide derivative found in DNA. The chemical structure of RLVN is shown in Figure 1. Dolutegravir (DTGR) is a medication used to treat HIV-1. It prevents the strand transfer step of retroviral DNA integration in the host cell by attaching to the protein surface of HIV integrase. The strand transfer phase, which affects HIV replication significantly, is crucial. The chemical structure of DTGR is shown in Figure 1 [1]. The creation of antiretroviral therapeutic approaches for HIV-1 infection has advanced significantly. The US Food and Drug Administration (FDA) approved dolutegravir/rilpivirine (DTGR/RLVN) as the first twin antiretroviral single tablet combination regimen for the maintenance therapy of HIV-1 infection [2].
Various analytical techniques such as a UV spectrophotometer, HPLC, and HPTLC were used to calculate the quantity of DTGR in bulk drug and tablet dosage forms. These techniques are used in quality control for testing the samples [3,4,5]. Another study used HPLC to measure RLVN in bulk and pharmaceutical dosage forms [6]. Simultaneous estimation of DTGR and RLVN was reported using a UV spectrophotometer in the pure bulk form [7]. Furthermore, DTGR and RLVN were quantified simultaneously via the RP-HPLC analytical technique, and developed methods were used to test drugs in quality control and plasma analysis [8,9,10]. Simultaneous estimation of DTGR and Lamivudine [11], RLVN and Lopinavir [12], and RLVN and Cabotegravir [13] via the RP-HPLC technique have been reported. Researchers also estimated DTGR via the UV spectrophotometer method with a Quality by Design (QbD) approach [14]. Via RP-HPLC, DTGR and lamivudine quantity were assessed in a study with a Box–Behnken design approach [15]. The spectrofluorimetric method was used for estimating the dosage of DTGR in tablet and bulk form [16]. Voltammetric determination of DTGR in tablet dosage form has been reported [17], quantitative analysis of DTGR and RLVN has been performed [18], and RP-HPLC has quantified the DTGR and RLVN in pharmaceutical formulations [19]. Some of the limitations of these research methodologies can be an inconvenience for analysis, such as the high costs, blocking of columns due to using high strength buffers and the occasional requirement of a solvent such as tetra butyl, and less precise yield findings due to high flow rates [20].
Presently, the application of Quality by Design in analytical method development and validation provides several advantages. The most important benefits are the saving of time, accuracy of results, and cost-effectiveness. As a result, several researchers have performed qualitative and quantitative analysis using QbD [21]. Thus, in this study, the RP-HPLC-PDA method was developed with the application of BBD for this drug combination to establish a fast, precise, timely and cost-saving method. The existing literature was very helpful in developing this novel method. This research considered a short retention time with good resolution and separation ability of the column’s stationary phase. In the given BBD optimised conditions, satisfactory results were found. Furthermore, the RP-HPLC-PDA method was produced and validated as per ICH guidelines. This approach is novel, simple, exact, and concise. The reduced retention time of both drugs makes this method novel and economical. To the best of our knowledge, there is no report on the RP-HPLC-PDA method with BBD application for simultaneous estimation of RLVN and DTGR in tablet dosage. This technique will be beneficial for routine analysis.

2. Materials and Methods

RLVN and DTGR pure standard (99% purity) were purchased from Sigma-Aldrich, a chemical company based in Mumbai, India. The RLVN 25 mg and DTGR 50 mg (manufactured by GSK Healthcare) pharmaceutical tablets were purchased from the pharmacy and had the brand name Juluca. The following chemicals, NaOH, H2O2, and HCl, were used for an analytical grade. In addition, an analytical-grade solvent, acetonitrile, Milli-Q water, and orthophosphoric acid (OPA) were used as HPLC-grade methanol.

2.1. Instrumentation

HPLC 2695 SYSTEM was used with a PDA detector integrated with Empower 2 Software of Waters Alliance. The column specification was C18 Kromasil (150 mm × 4.6 mm), with a particle size of 5 μm. The Meltronics sonicator (BVK enterprises) was used for degassing the solvent and enhancing the solubility of the solute. An Elico pH meter was also utilised in the laboratory. Electronics Balance was used by the Shimadzu company Dubai, UAE.

2.2. Application of BBD to Optimise the Chromatographic Conditions

Analytical Target Profile [ATP]: In simultaneous estimation, the peak precision of chromatograms will improve by optimising the separation settings. In ideal conditions, the peaks should have a low tailing factor and be well resolved. Furthermore, the ATP must fulfil the quality standard of the quantitative method [22].

2.3. Risk Assessment Studies

The goal of risk assessment studies is to monitor the influence of different factors which are causes of the target method quality profile [TMQP]. Before a risk assessment examination, it is required to judge the TMPQ’s parameter relation among them, which are empowered by critical analytical attributes [CAAs]. During the risk assessment studies, it is easy to find the primary cause of concern and origin of problems such as faults, variances, defects, or failures. Parallelly, another possible outcome of risk assessment studies is to list each risk factor. Risk factors are further categorised into low, medium, and high. In the present experiment, seven factors were used for screening. Out of the seven, three factors were considered for the study. For optimisation of the chromatographic conditions, two responses for each drug were considered, which are retention time and plate numbers. The factors considered in this experiment are mobile phase composition, flow rate, and detection of wavelength [23,24].

2.4. Optimisation

BBD was used for the optimisation of the chromatographic conditions. The software has used Design Expert, software version 13.0.3.0 from Stat-Ease Inc., Minneapolis, USA. Two responses for each drug were considered for optimisation: retention time and plate numbers. The factors considered in this experiment are mobile phase composition, flow rate, and detecting wavelength. Seventeen trials were conducted in the given set of variables. Out of the seventeen trials, twelve have shown factor interaction effects [25] (Table 1).

2.5. Method Development

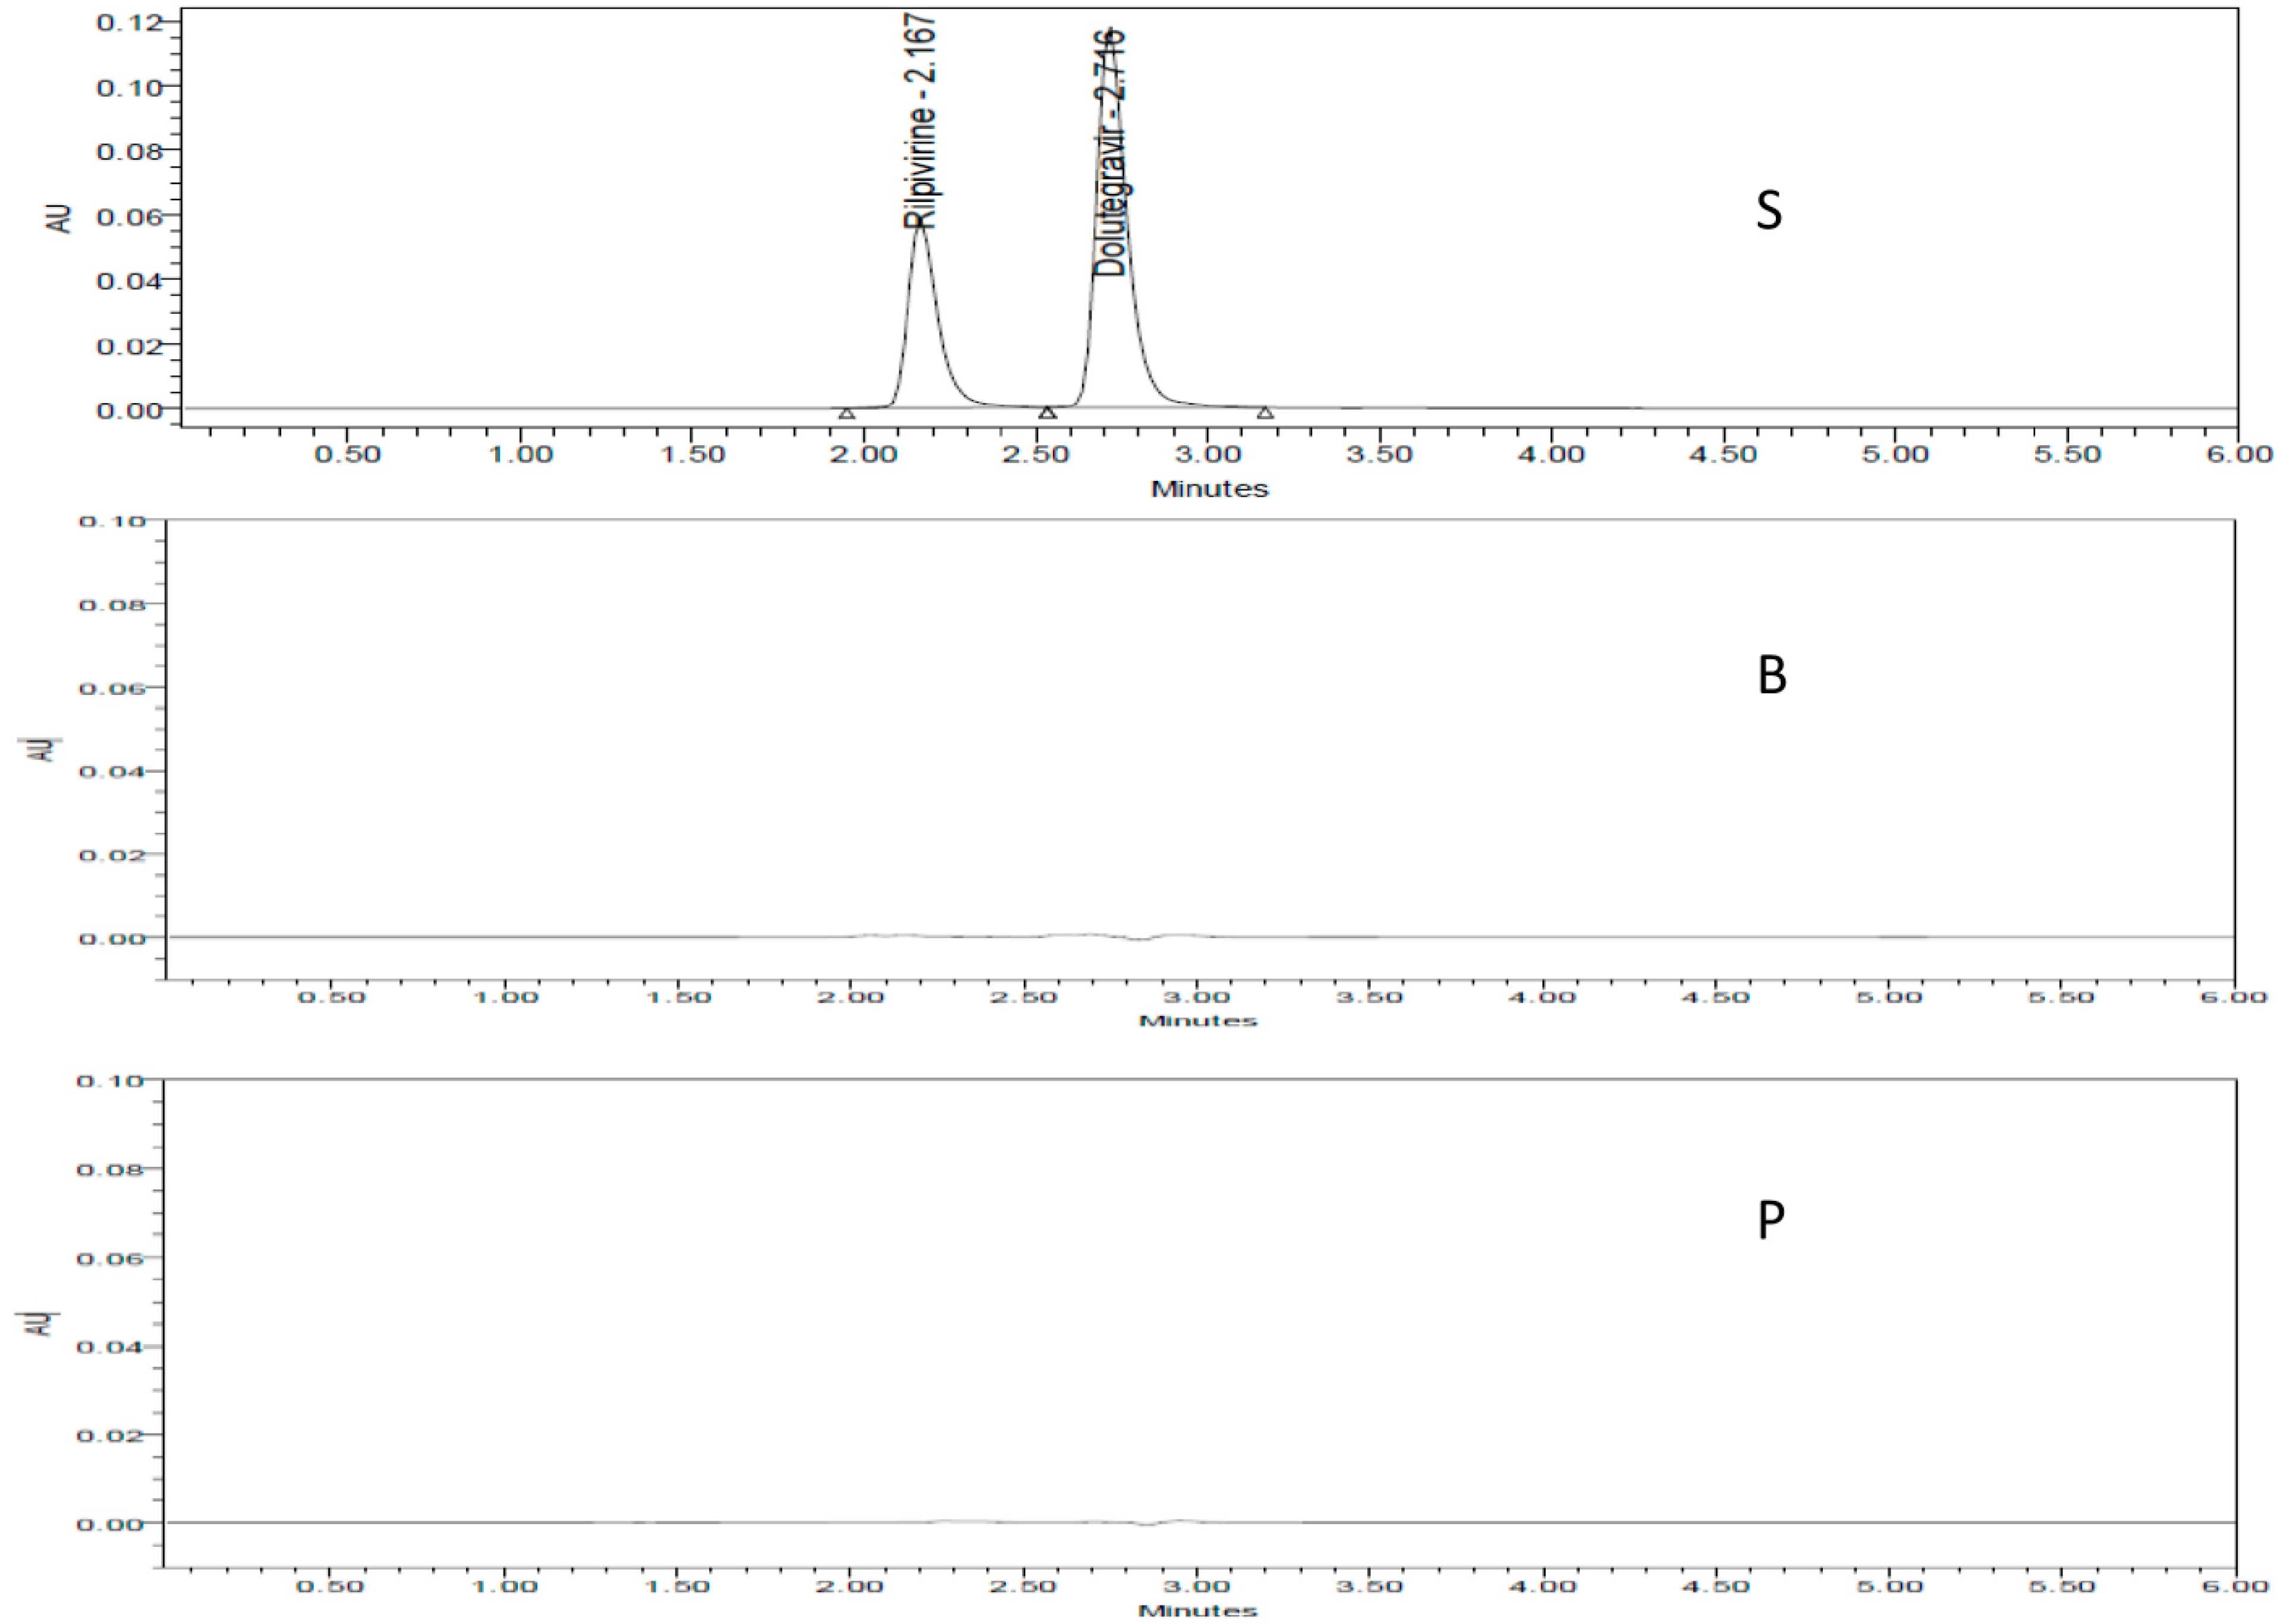
For chromatographic separation, the reverse stationary phase was used in C 18 column Kromasil 150 mm × 4.6 mm and with a particle size of 5 μm. The mobile phase composition was 0.1% v/v OPA buffer and acetonitrile (ACN) in a ratio of 60:40, and it was used at a flow rate of 1.0 mL/min. The analytes were detected at 260 nm using the PDA detector. The runtime for the analysis was fixed at 6 min at a temperature of 30 °C, and an isocratic mode of separation was used. The retention time of RLVN and DTRG is 2.167 and 2.716 min, respectively.
Buffer (0.1% v/v OPA): 0.1 % v/v orthophosphoric acid (OPA) was prepared in the laboratory, taking 1 mL of OPA from an 85% aqueous solution in 1000 mL of the volumetric flask with a small volume of milli-Q water. Then it was properly mixed, and the volume was made to 1000 mL with milli-Q water.

2.6. Preparation of Standard Solution

10 mg working standards of each standard drug (RLVN and DTGR) were accurately weighed and then transferred into separate, clean, and dry 10 mL volumetric flasks. Half of the total volume of methanol was added followed by diluents to carry the volume to the desired level. To finalise the concentration of a standard solution containing 50 μg/mL of RLVN and 100 μg/mL of DTGR, 50 μg/mL of RLVN were prepared from the stock solution, 0.5 mL of the stock solution was diluted to 10 mL. An amount of 100 μg/mL of DTGR was prepared from the stock solution, with 1 mL of stock solution diluted to 10 mL.
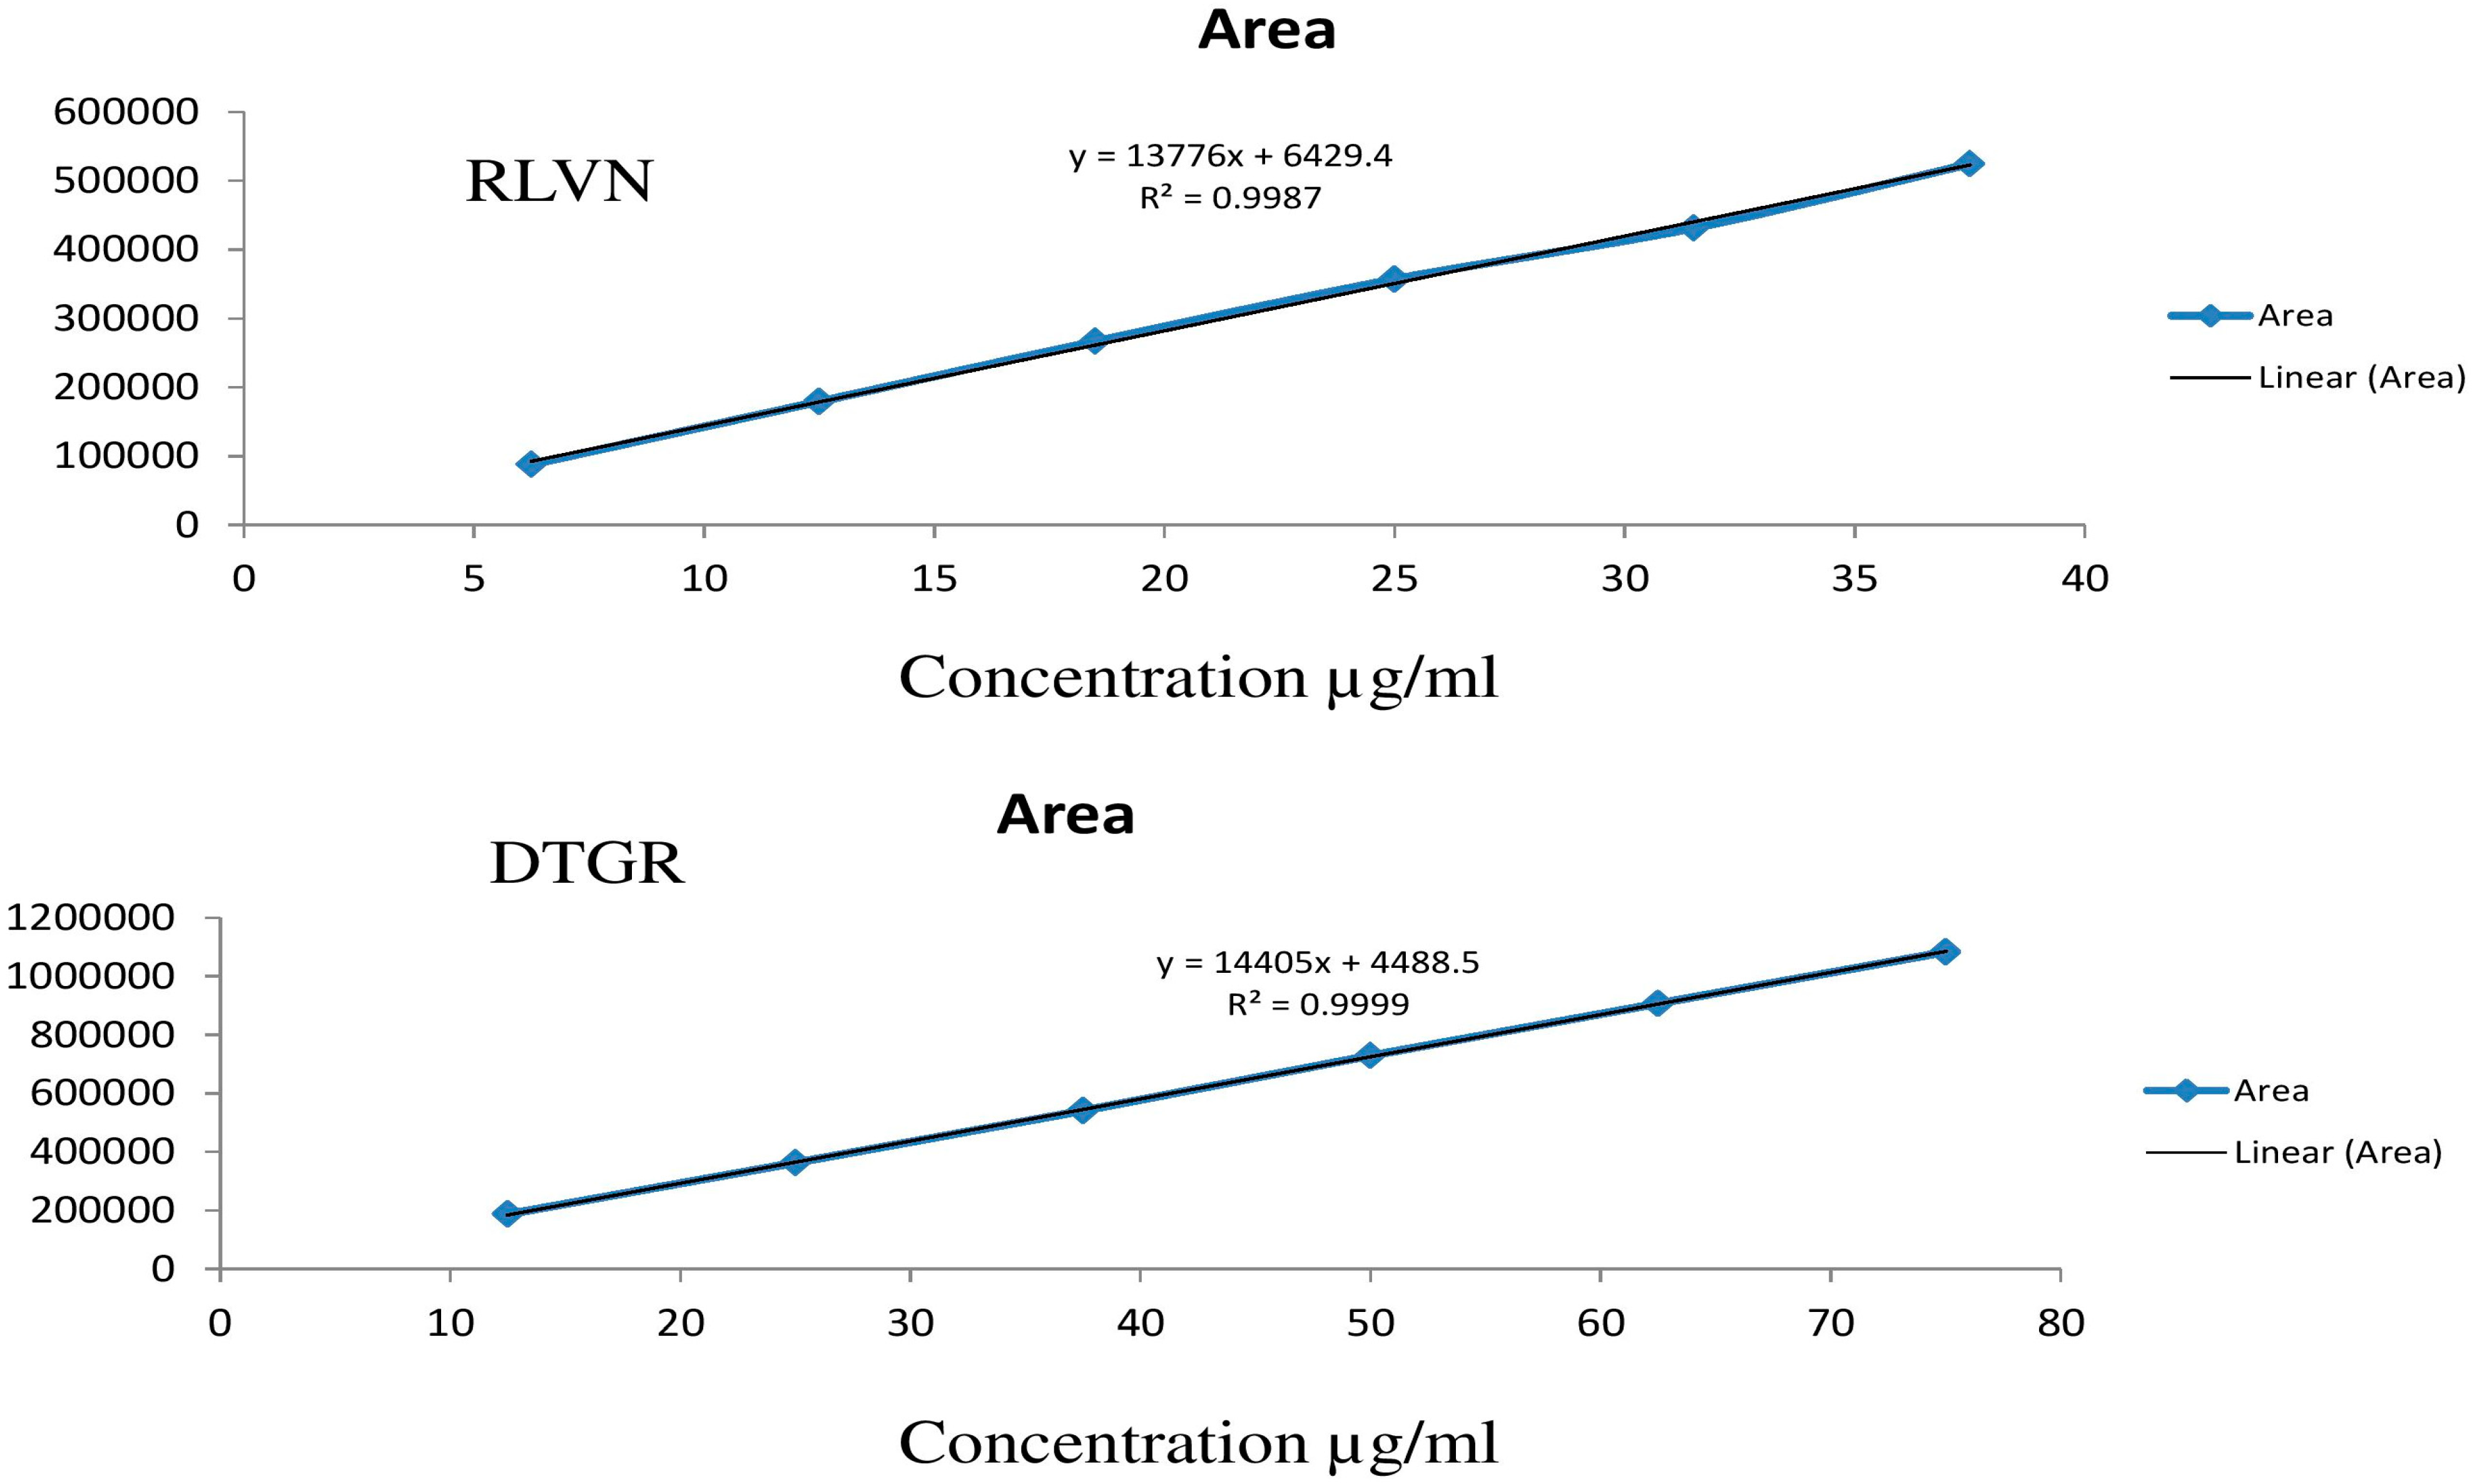
Calibration Curve: For both drugs, calibration curves were prepared at optimised ʎmax (260 nm). Six dilutions of each drug were prepared. Ranges between 6.25–37.5 µg/mL for RLVN and 12.5–75 µg/mL for DTGR were fixed. All dilutions were prepared from a second stock of solution for each drug; 50 µg/mL (RLVN) and 100 µg/mL (DTGR). LOD and LOQ for both drugs were finalised before the preparation of the calibration curve. In Table 2, details are presented (Figure 2). Three quality control samples were prepared for both drugs: low level-quality controls (LQC), middle level-quality controls (MQC), and high level-quality controls (HQC). The concentration was LQC (6.25 µg/mL), MQC (25 µg/mL), and HQC (37.5 µg/mL) for RLVN, and LQC (12.5 µg/mL), MQC (50 µg/mL), and HQC (75 µg/mL) for DTGR.

2.7. Preparation of Sample Solution

Twenty tablets were accurately weighed and crushed. The average weight of each tablet was determined. The equivalent amount of powder of one tablet was weighed and transferred into a 100 mL volumetric flask. Then three-fourths of the diluent volume were transferred to a 100 mL volumetric flask. For 30 min, the mixture was sonicated. After that, the remaining diluent was added. The solution was filtered with a 0.45 μm filter. An amount of 2.5 mL of the filtered solution was taken out and then transferred to a 25 mL volumetric flask. The volume of the volumetric flask was made with diluents and adequately mixed. The final concentration of the solution was 25 μg/mL of RLVN and 50 μg/mL of DTGR.

2.8. Method Validation

The developed RP-HPLC-PDA method was validated. Different parameters of validation were experimented with according to the ICH guidelines. The parameters are the limit of detection, limit of quantification, accuracy, precision, system suitability, specificity, and linearity. In addition, forced degradation studies were carried out [26,27].

2.9. System Suitability

Six replicate injections of a freshly prepared standard solution were used to evaluate the system’s suitability. The %RSD values (2.0%) were within allowable limits. The responses considered in the experiment were theoretical plates, resolution, and tailing factor; therefore, each parameter’s %RSD value was calculated for both drugs.

2.10. Linearity

Standard solutions were prepared for both drugs, RLVN and DTGR. Linearity was examined for both drugs across the given range of concentrations, 6.25 to 37.5 μg/mL for RLVN and 12.5 to 75 μg/mL for DTGR. Each experiment was conducted three times. The least squares method of multivariate analysis was used to demonstrate the linearity.

2.11. Precision

Intra-day and inter-day analyses served as a demonstration of the method’s precision. For the precision studies, 100% of the concentrations (25 μg/mL for RLVN and 50 μg/mL for DTGR) were used. To review inter-day precision, the drug analysis was performed six days in a row at a given concentration.

2.12. Accuracy

The addition method was used to measure the recovery of drugs to assess the accuracy. Levels of 0%, 50%, 100%, and 150% of the standard drug were added to predetermine the concentration (25 μg/mL for RLVN and 50 μg/mL for DTGR). The obtained results were examined, and they were found to be acceptable.

2.13. Ruggedness

The method is rugged. It was confirmed by examining data from different analysts using different instruments on various days.

2.14. Robustness

Three parameters from the chromatography’s optimal conditions were changed intentionally to test the robustness, including the composition of the mobile phase (±5%), flow rate (±0.1 mL/min), and detection of wavelength (±2 nm).

2.15. LOD and LOQ

Empower 2 Software calculated LOD and LOQ using the signal-to-noise ratio method.

2.16. Specificity

The purpose of performing the specificity of the method was to check the interference of impurities at the drug’s retention time, affecting the separation, identification, and quantification of the analytes. Experiments were carried out by injecting the blank solution into the column, followed by the standard drug solution in given chromatographic conditions.

2.17. Forced Degradation Studies

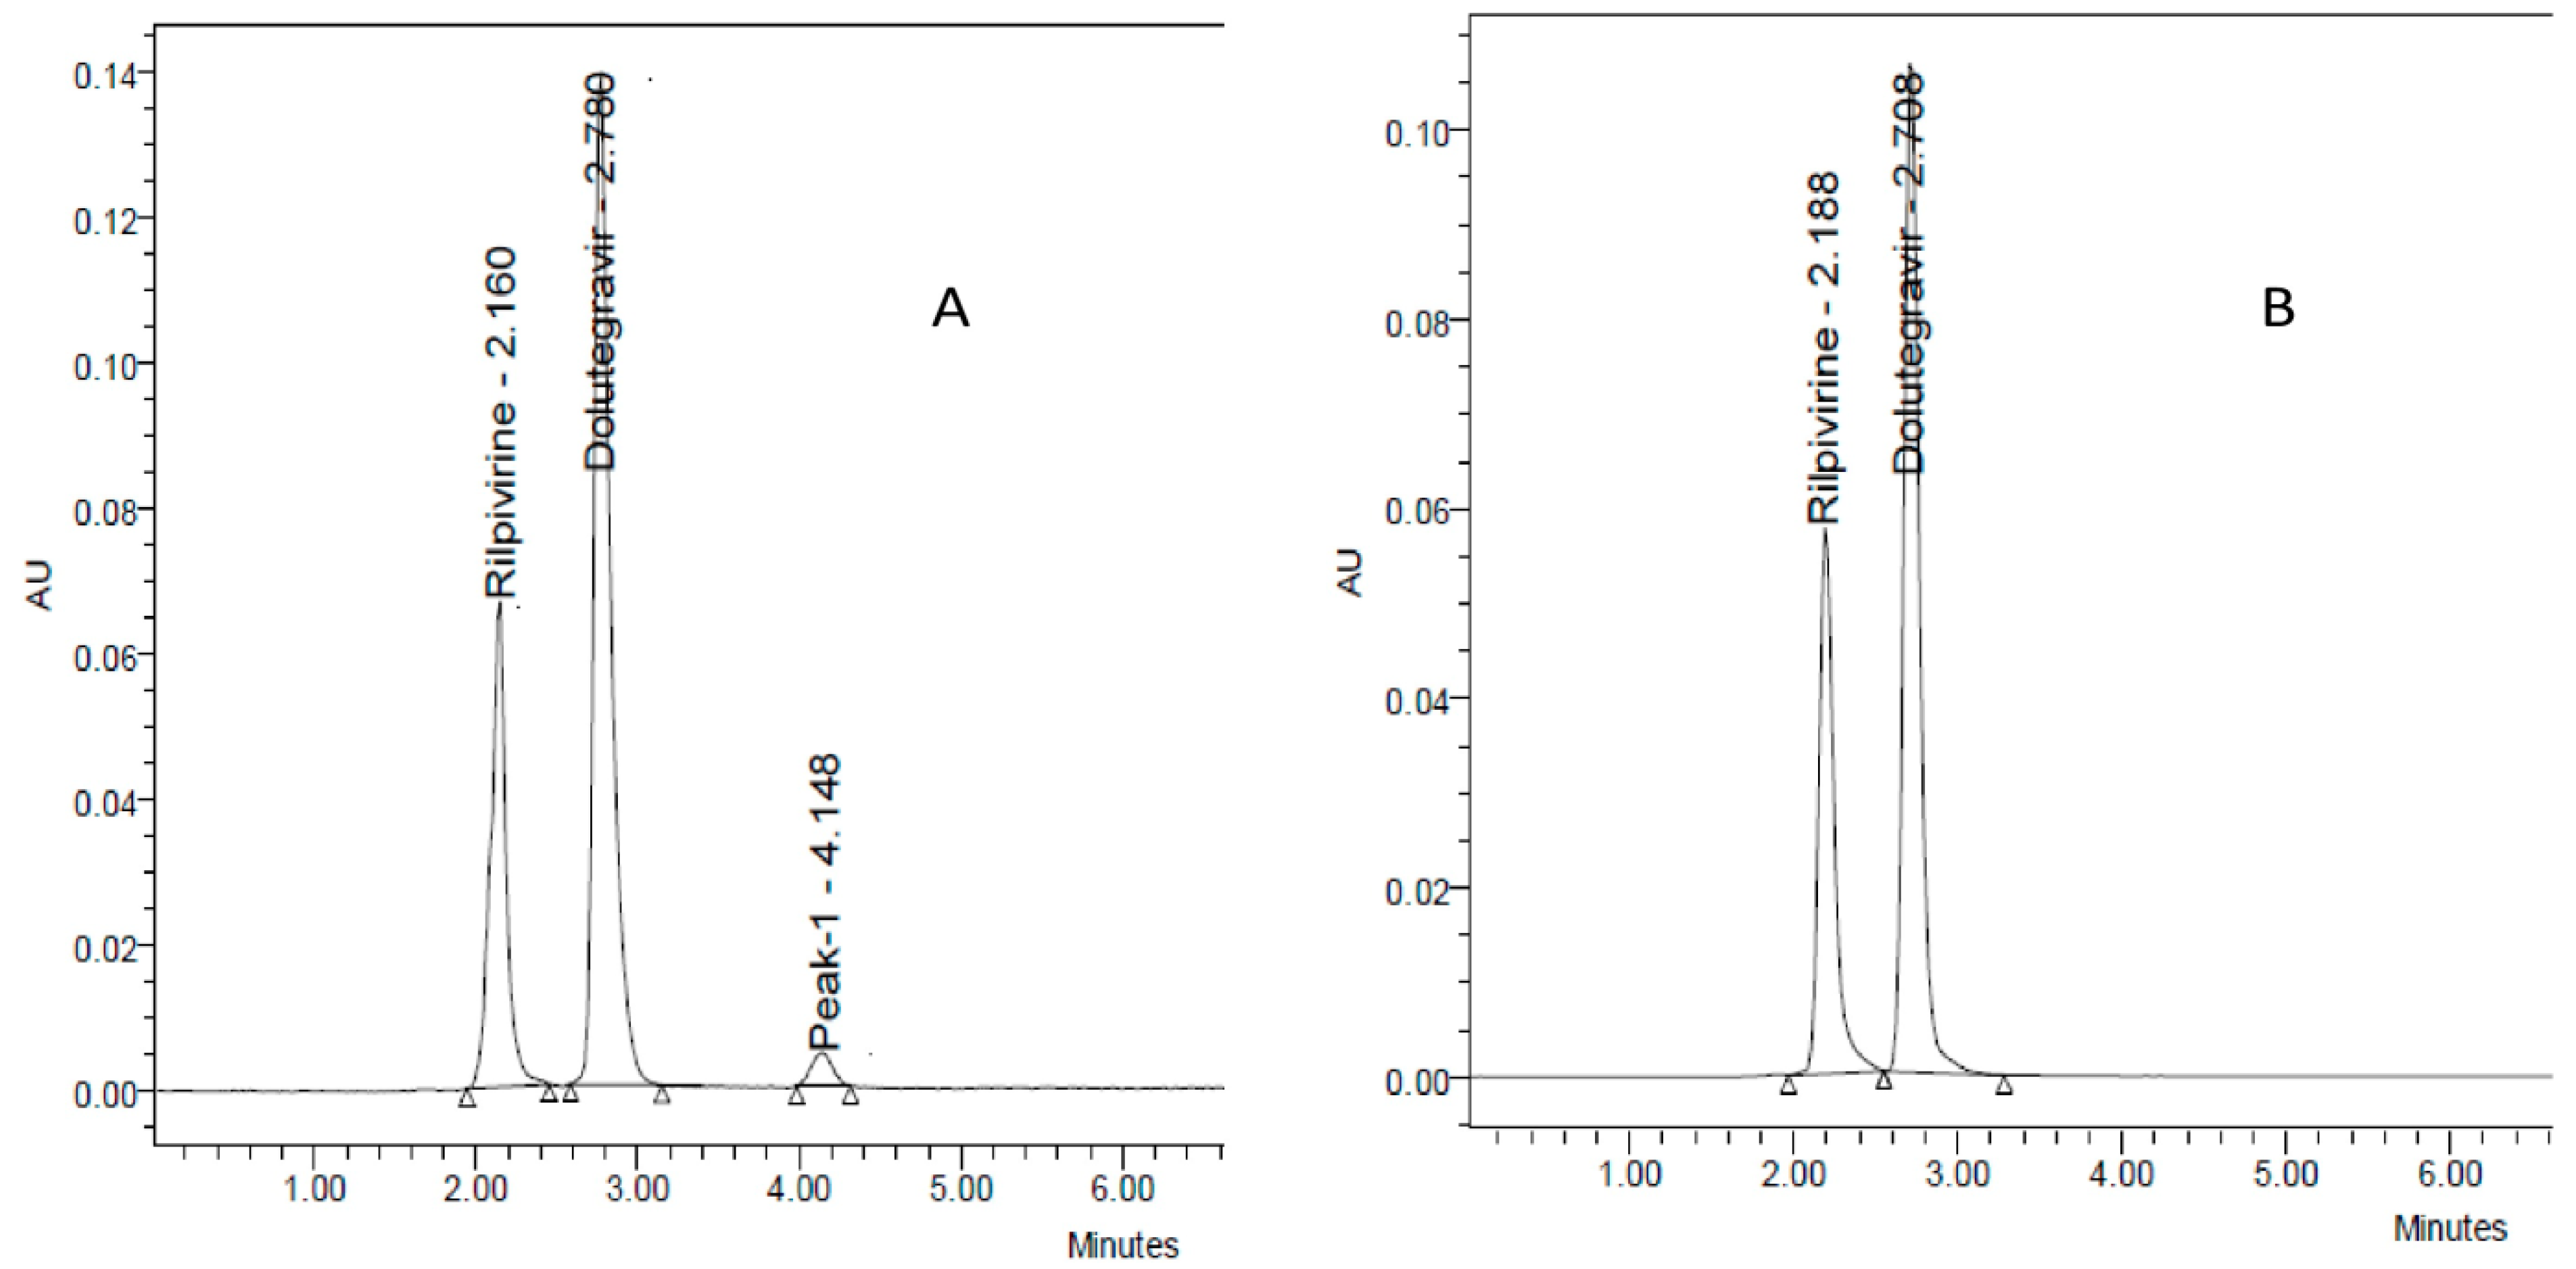
The goal of degradation studies is to examine the presence of degradants with API in different conditions. The intentional minor changes in the conditions were to determine whether the API was stable with degradants. The results, however, indicate its stability. The degradation studies chromatogram will help to calculate the drug dosage amount. The protocols were mentioned in the ICH guidelines (Q1A, Q1B, and Q2B). The present research followed these guidelines in degradation studies in different environmental conditions such as acid, alkali, oxidation, UV-light, neutral, and thermal stability conditions [28,29].

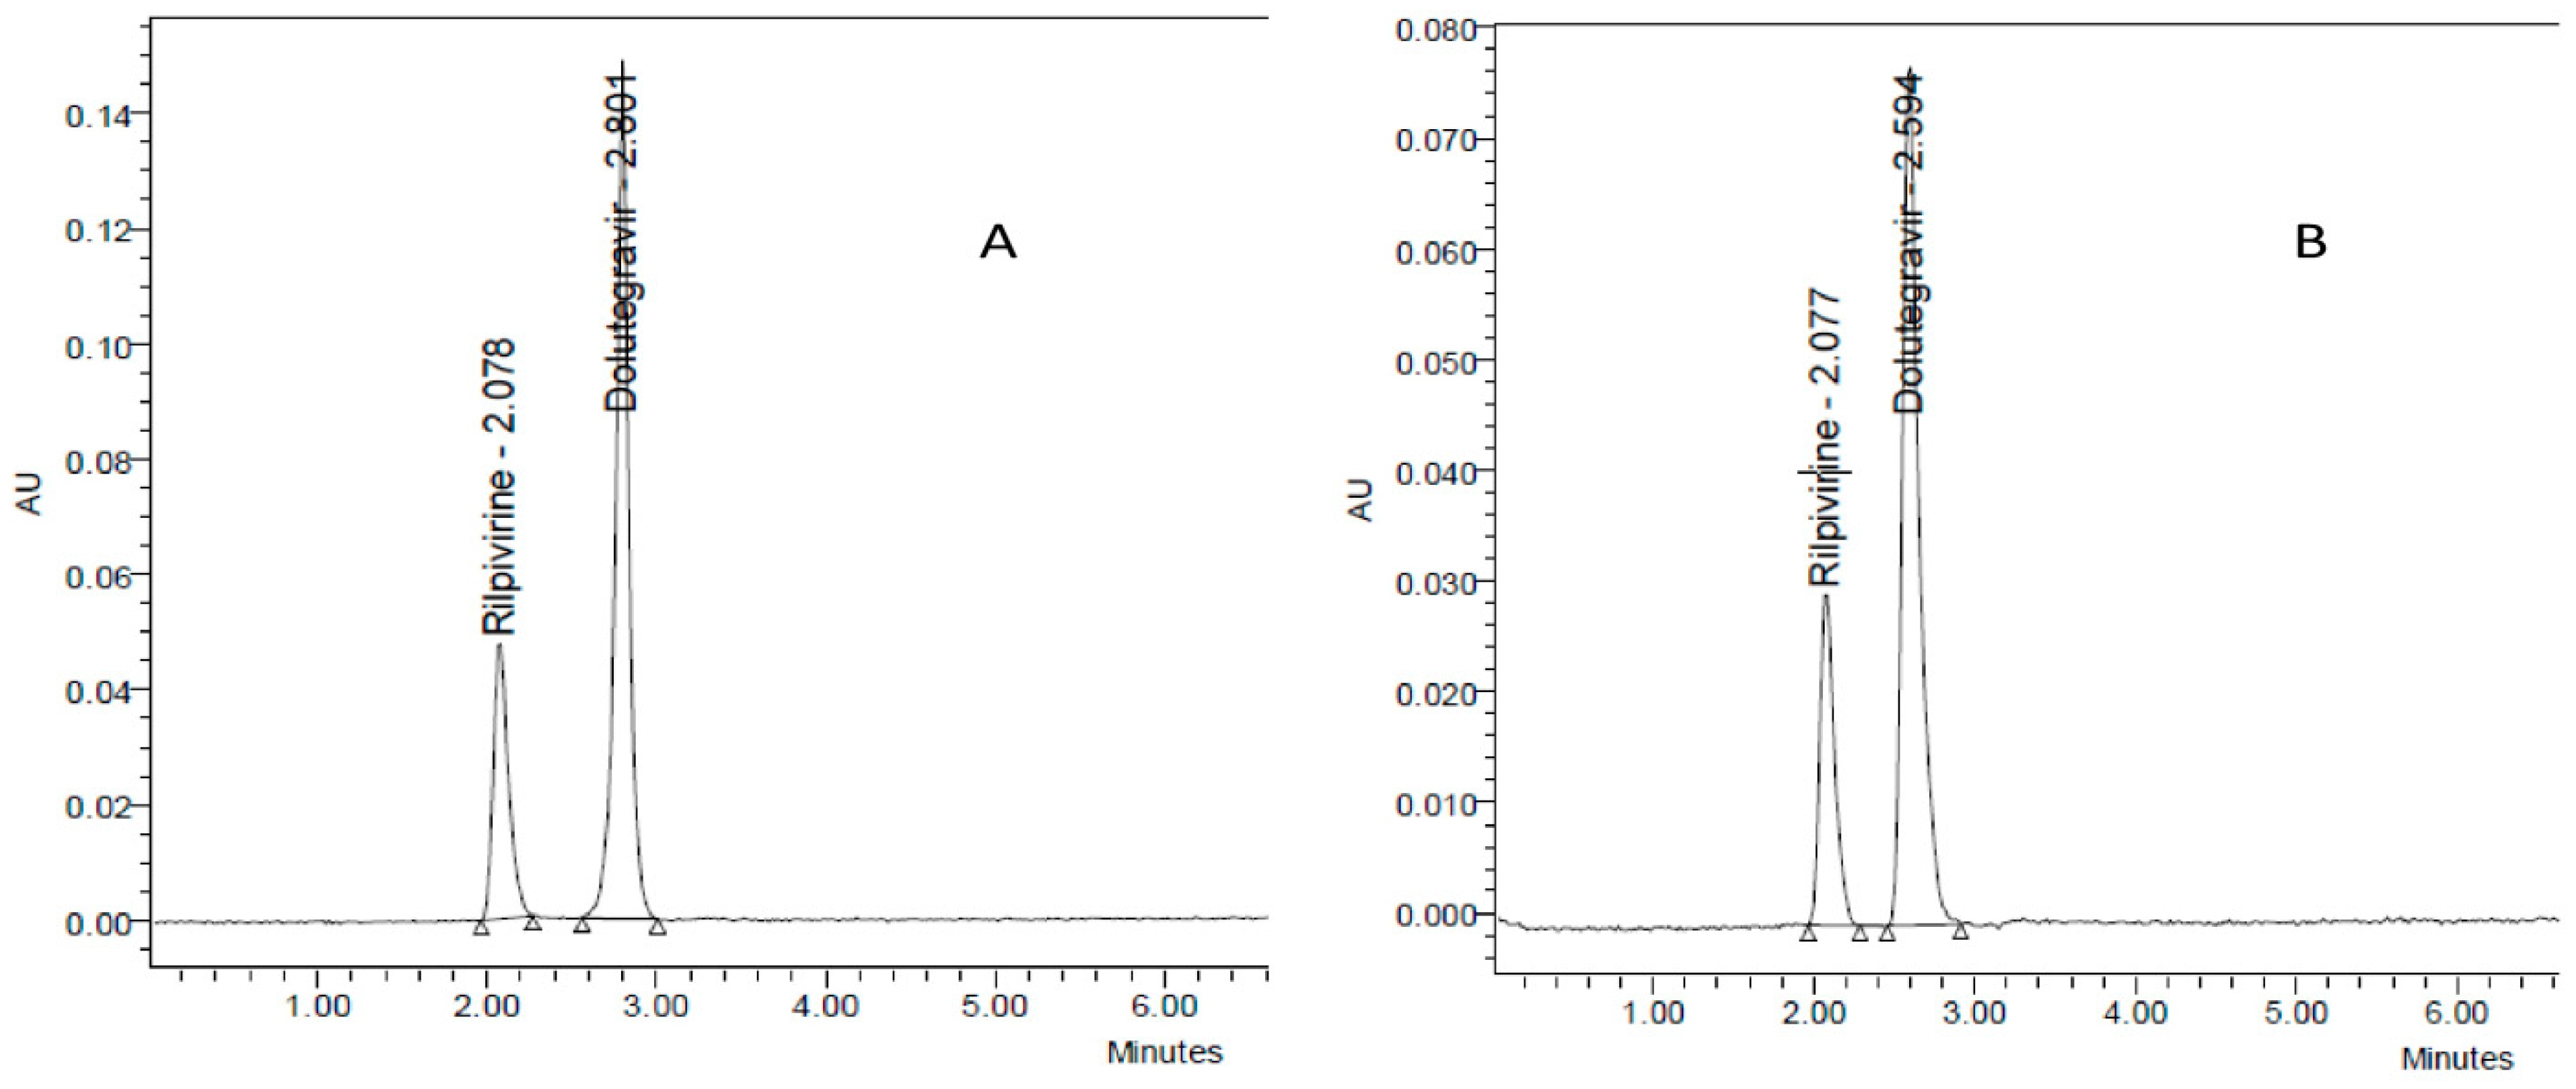
2.18. Acid Degradation

The 1 mL stock solutions of both drugs (RLVN and DTGR) were refluxed for 30 min in 1 mL of 2 N HCl. The resultant solution was then diluted to obtain the concentrations of 25 µg/mL and 50 µg/mL for RLVN and DTGR, respectively. Finally, 10 µL of this solution were injected into the column, then the chromatogram was analysed to determine the stability under the given conditions.

2.19. Alkali Degradation

The 1 mL stock solutions of both drugs (RLVN and DTGR) were combined with 1 mL of 2 N NaOH and refluxed for 30 min. Afterwards, the resultant solution was diluted to obtain the concentrations of 25 µg/mL and 50 µg/mL of RLVN and DTGR, respectively. Finally, 10 µL of this solution were injected into the column, and then the chromatogram was analysed to determine the stability under the given conditions.

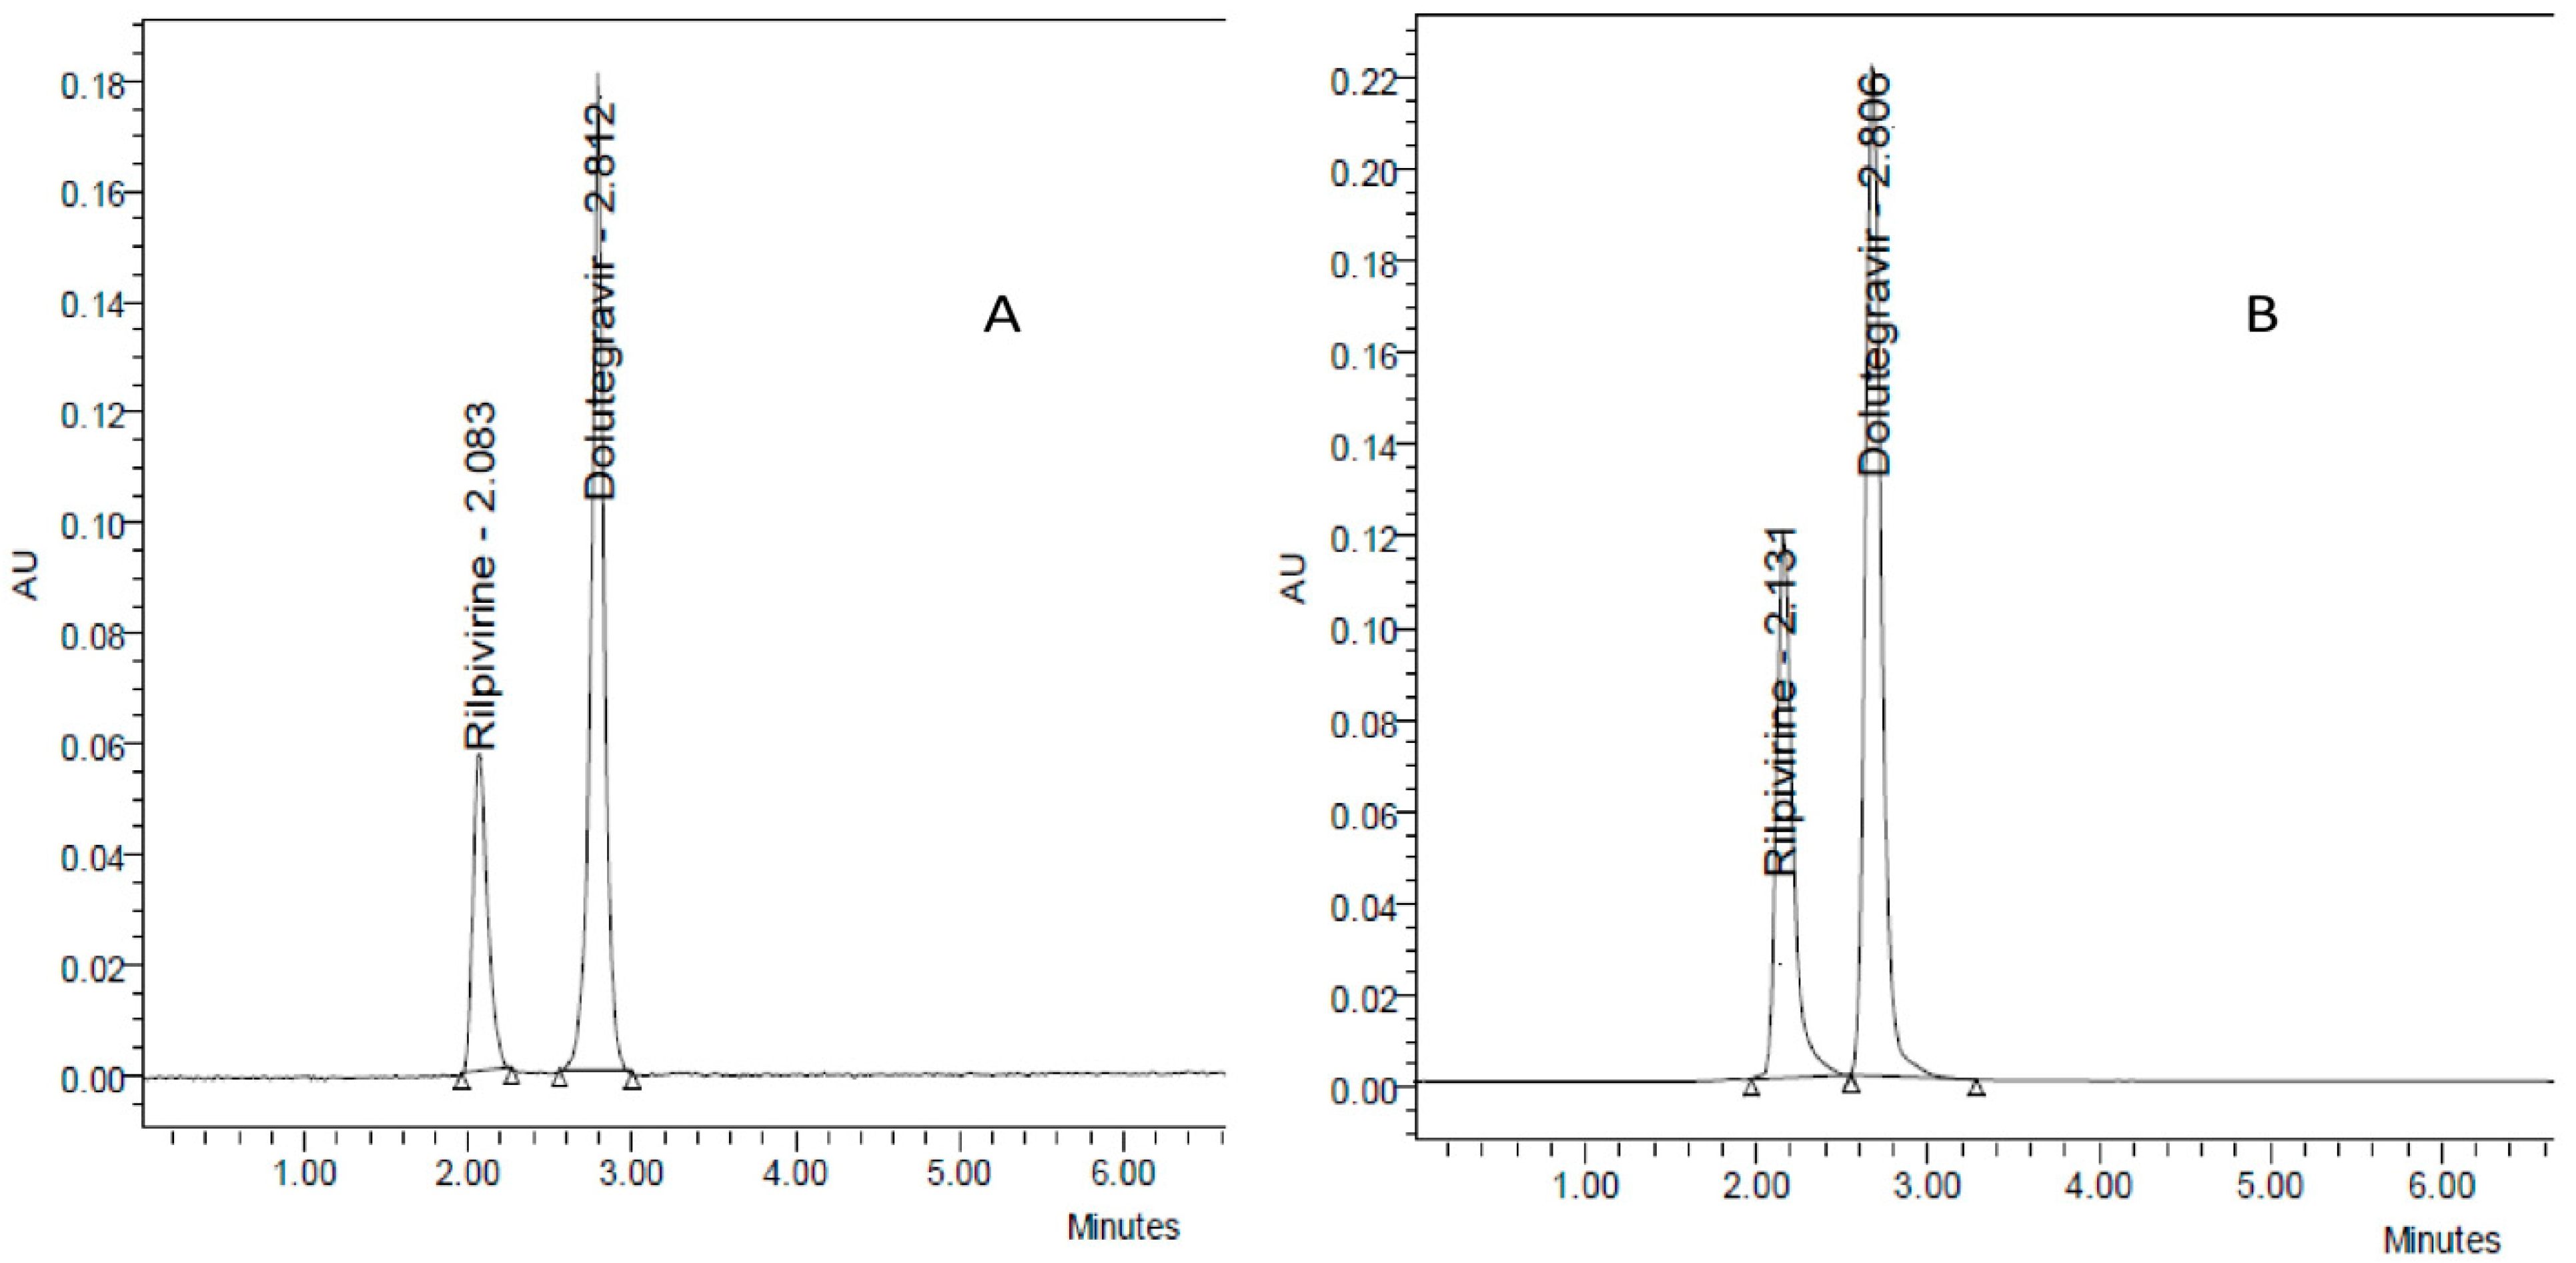
2.20. Dry Heat Degradation

For the dry heat degradation study, the standard solutions of drugs were kept in an oven at 105 °C for 6 h. Afterwards, the solutions were diluted to 25 µg/mL and 50 µg/mL of RLVN and DTGR, respectively. Finally, 10 µL of this solution were injected into the column. The chromatogram was analysed to determine the stability under the given conditions.

2.21. Photo Stability

UV light was used to expose the standard drug solutions of 250 µg/mL and 500 µg/mL for RLVN and DTGR, respectively. The beaker of the solution was kept in a UV chamber for 7 days or 200-watt hours/m2 in the photostability chamber. The resulting solution was diluted further to 25 µg/mL and 50 µg/mL. Finally, 10 µL of this solution were injected into the column, and the resulting chromatogram was analysed to establish stability.

2.22. Neutral Degradation

At a temperature of 60 °C, the standard solution of drugs in water was refluxed for 6 h under neutral conditions. After that, the solution was diluted to 25 µg/mL & 50 µg/mL. After injecting 10 µL of this solution into the column, the stability under the stated circumstances was evaluated using the chromatogram.

2.23. Oxidation

An amount of 1 mL of 20% hydrogen peroxide (H2O2) was added to 1 mL of the stock solution of RLVN, and another 1 mL of 20% hydrogen peroxide (H2O2) was added to 1 mL of the stock solution of DTGR. The combined solution was held for 30 min. Then, the resulting solution was diluted to create solutions (25 µg/mL and 50 µg/mL) for the RP-HPLC-PDA study. Finally, 3 mL were injected into the system, and the chromatograms were recorded to gauge the stability of the sample.

3. Results

Optimisation: After performing the risk assessment studies, three factors were considered in the BBD application. The factors are %ACN, the flow rate of the mobile phase, and ʎmax. The dependent variables for both drugs were observed as retention time and theoretical plate number (Table 1).

3.1. The Retention Time of RLVN

The inbuilt ANOVA was a quadratic model. The model is significant. Table 3 summarises the quadratic model and the lack of the fit test. The inbuilt value for the drug’s retention time indicated that it is significant. The final equation was with coded factors A (−0.2874), B (+0.0128), C (−0.2068), AB (−0.3929), AC (−0.1408), BC (−0.3367), A2 (−0.0368), B2 (−0.1511), and C2 (+0.0173). The inbuilt model graph of Figure 3 illustrates the colour point value of predicted vs. actual, while Figure 4 provides details on the 3D surface design points.

3.2. Theoretical Plate Value of RLVN

The inbuilt ANOVA for the quadratic model in the BBD application was used to optimise the theoretical plate number to check the column efficiency. Table 3 summarises the quadratic model and the lack-of-fit test. The final equation with the coded equation is A (−225.91), B (+60.11), C (−162.89), AB (−341.21), AC (−102.32), BC (−297.13), A2 (−157.67), B2 (−119.16), and C2 (+160.74). The inbuilt model graph of Figure 5 illustrates the colour point value of predicted vs. actual, while Figure 6 provides details on the 3D surface design points.

3.3. The Retention Time of DTGR

The quadratic model was used in ANOVA. The model is significant. Table 3 summarises the quadratic model and the lack-of-fit test. The inbuilt value for the drug’s retention time indicated that it is significant. The final equation was with coded factors A (−0.1210), B (+0.0445), C (−0.0732), AB (−0.1998), AC (−0.0016), BC (−0.0927), A2 (−0.2430), B2 (−0.0561), and C2 (+1381) values in the final equation. The inbuilt model graph of Figure 7 illustrates the colour point value of predicted vs. actual, while Figure 8 provides details on the 3D surface design points.

3.4. Theoretical Plate Value of DTGR

The inbuilt ANOVA for the quadratic model in the BBD application was used to optimise the theoretical plate number to check the column efficiency. Table 3 summarises the quadratic model and the lack-of-fit test. The final equation with the coded equation is A (−119.95), B (+18.05), C (−98.36), AB (−130.32), AC (−175.98), BC (−175.01), A2 (−272.36), B2 (+83.26), and C2 (−23.46). The inbuilt model graph of Figure 9 illustrates the colour point value of predicted vs. actual, while Figure 10 provides details on the 3D surface design points.
The RP-HPLC-PDA analytical technique was selected based on the literature information such as molecule characteristics, which can be neutral or ionic, degree of solubility, and relative molecular mass [1]. After that, the specificity experiment was performed with the BBD application in given chromatographic conditions. Different chromatographic conditions were used to analyse RLVN and DTGR in bulk and pharmaceutical dosage forms. Figure 11 presents the chromatograms of the API, blank, and placebo. The outcome was within the reasonable limit (not less than 2.0), indicating the specificity of the developed RP-HPLC–PDA method.

3.5. System Suitability

The injections of freshly prepared standard solutions were replicated six times. Three responses were examined: the theoretical plates, resolution, and tailing factor of both drugs. The %RSD of the experiment results was within the acceptable limit (≤2.0%). The results of the experiments are presented in Table 4.
Across the concentration range of 6.25–37.5 μg/mL for RLVN and 12.5 to 75.0 μg/mL for DTGR, standard solutions were prepared, and linearity was demonstrated. Each drug was prepared in six dilutions, and the responses were measured in triplicate. The multivariate analysis with the least squares method was used to examine the calibration curve’s linearity. In addition, the curve was plotted between the peak area and concentration. The results are shown in Table 2 and Figure 2.
The LOD and LOQ were calculated from the given formula:
LOD = 3.3 xavg . std . / slope LOQ = 10 xavg . std . / slope
Avg.std = standard deviation responses average.
Slope = slope of the calibration curve.
From this equation, the LOD and LOQ for RLVN were calculated at 0.45 µg/mL and 1.37 µg/mL, respectively, and for DTGR, the LOD and LOQ were established at 1.27 µg/mL and 3.86 µg/mL, respectively. All results were obtained within the acceptance criteria based on the ICH guidelines.

3.6. Precision and Accuracy

Precision and accuracy were evaluated using the replicated analysis (n = 6). The developed method precision was finalised via intra-day and inter-day analysis. The result analysis in terms of %RSD was computed and within the acceptable range—below 2.0 %. The accuracy of the method was determined. Each concentration level (0%, 50%, 100%, and 150%) was tested in six replicates, and the percentage recovery was calculated. % RSD values of the results were within acceptable limits. Table 5 and Table 6 present the results that were obtained.

3.7. Robustness

The robustness of the method was examined. Three factors were considered. We intentionally changed a bit of value from the optimised chromatographic conditions and observed the results. Under the optimised conditions, the mobile phase flow rate was increased and reduced by 10%, the mobile phase composition was changed by ±5%, and the elutes-detecting wavelength was altered by ±2%. The results of the experiments indicate that slight variations in given conditions did not cause significant changes in the responses, such as retention time, tailing factor, plate count, and resolution of peaks. In each change condition, three replicate injections were used. The experimental results confirm the method is robust (Table 7).
Forced degradation studies: The forced degradation studies were performed in different conditions. The chromatograms of both drugs are shown in Figure 12, Figure 13 and Figure 14. Table 8 presents the percentage degradation of the medicines in various given conditions.

4. Discussion

One of the main goals of this research was to measure RLVN and DTGR effectively in bulk and pharmaceutical dosage forms that could be used to identify degradation products by developing the RP-HPLC-PDA method with a BBD approach. Therefore, various chromatographic criteria were used to assess RLVN and DTGR in bulk and pharmaceutical dosage forms. As a result, the outcomes of the experiments were within a reasonable limit.
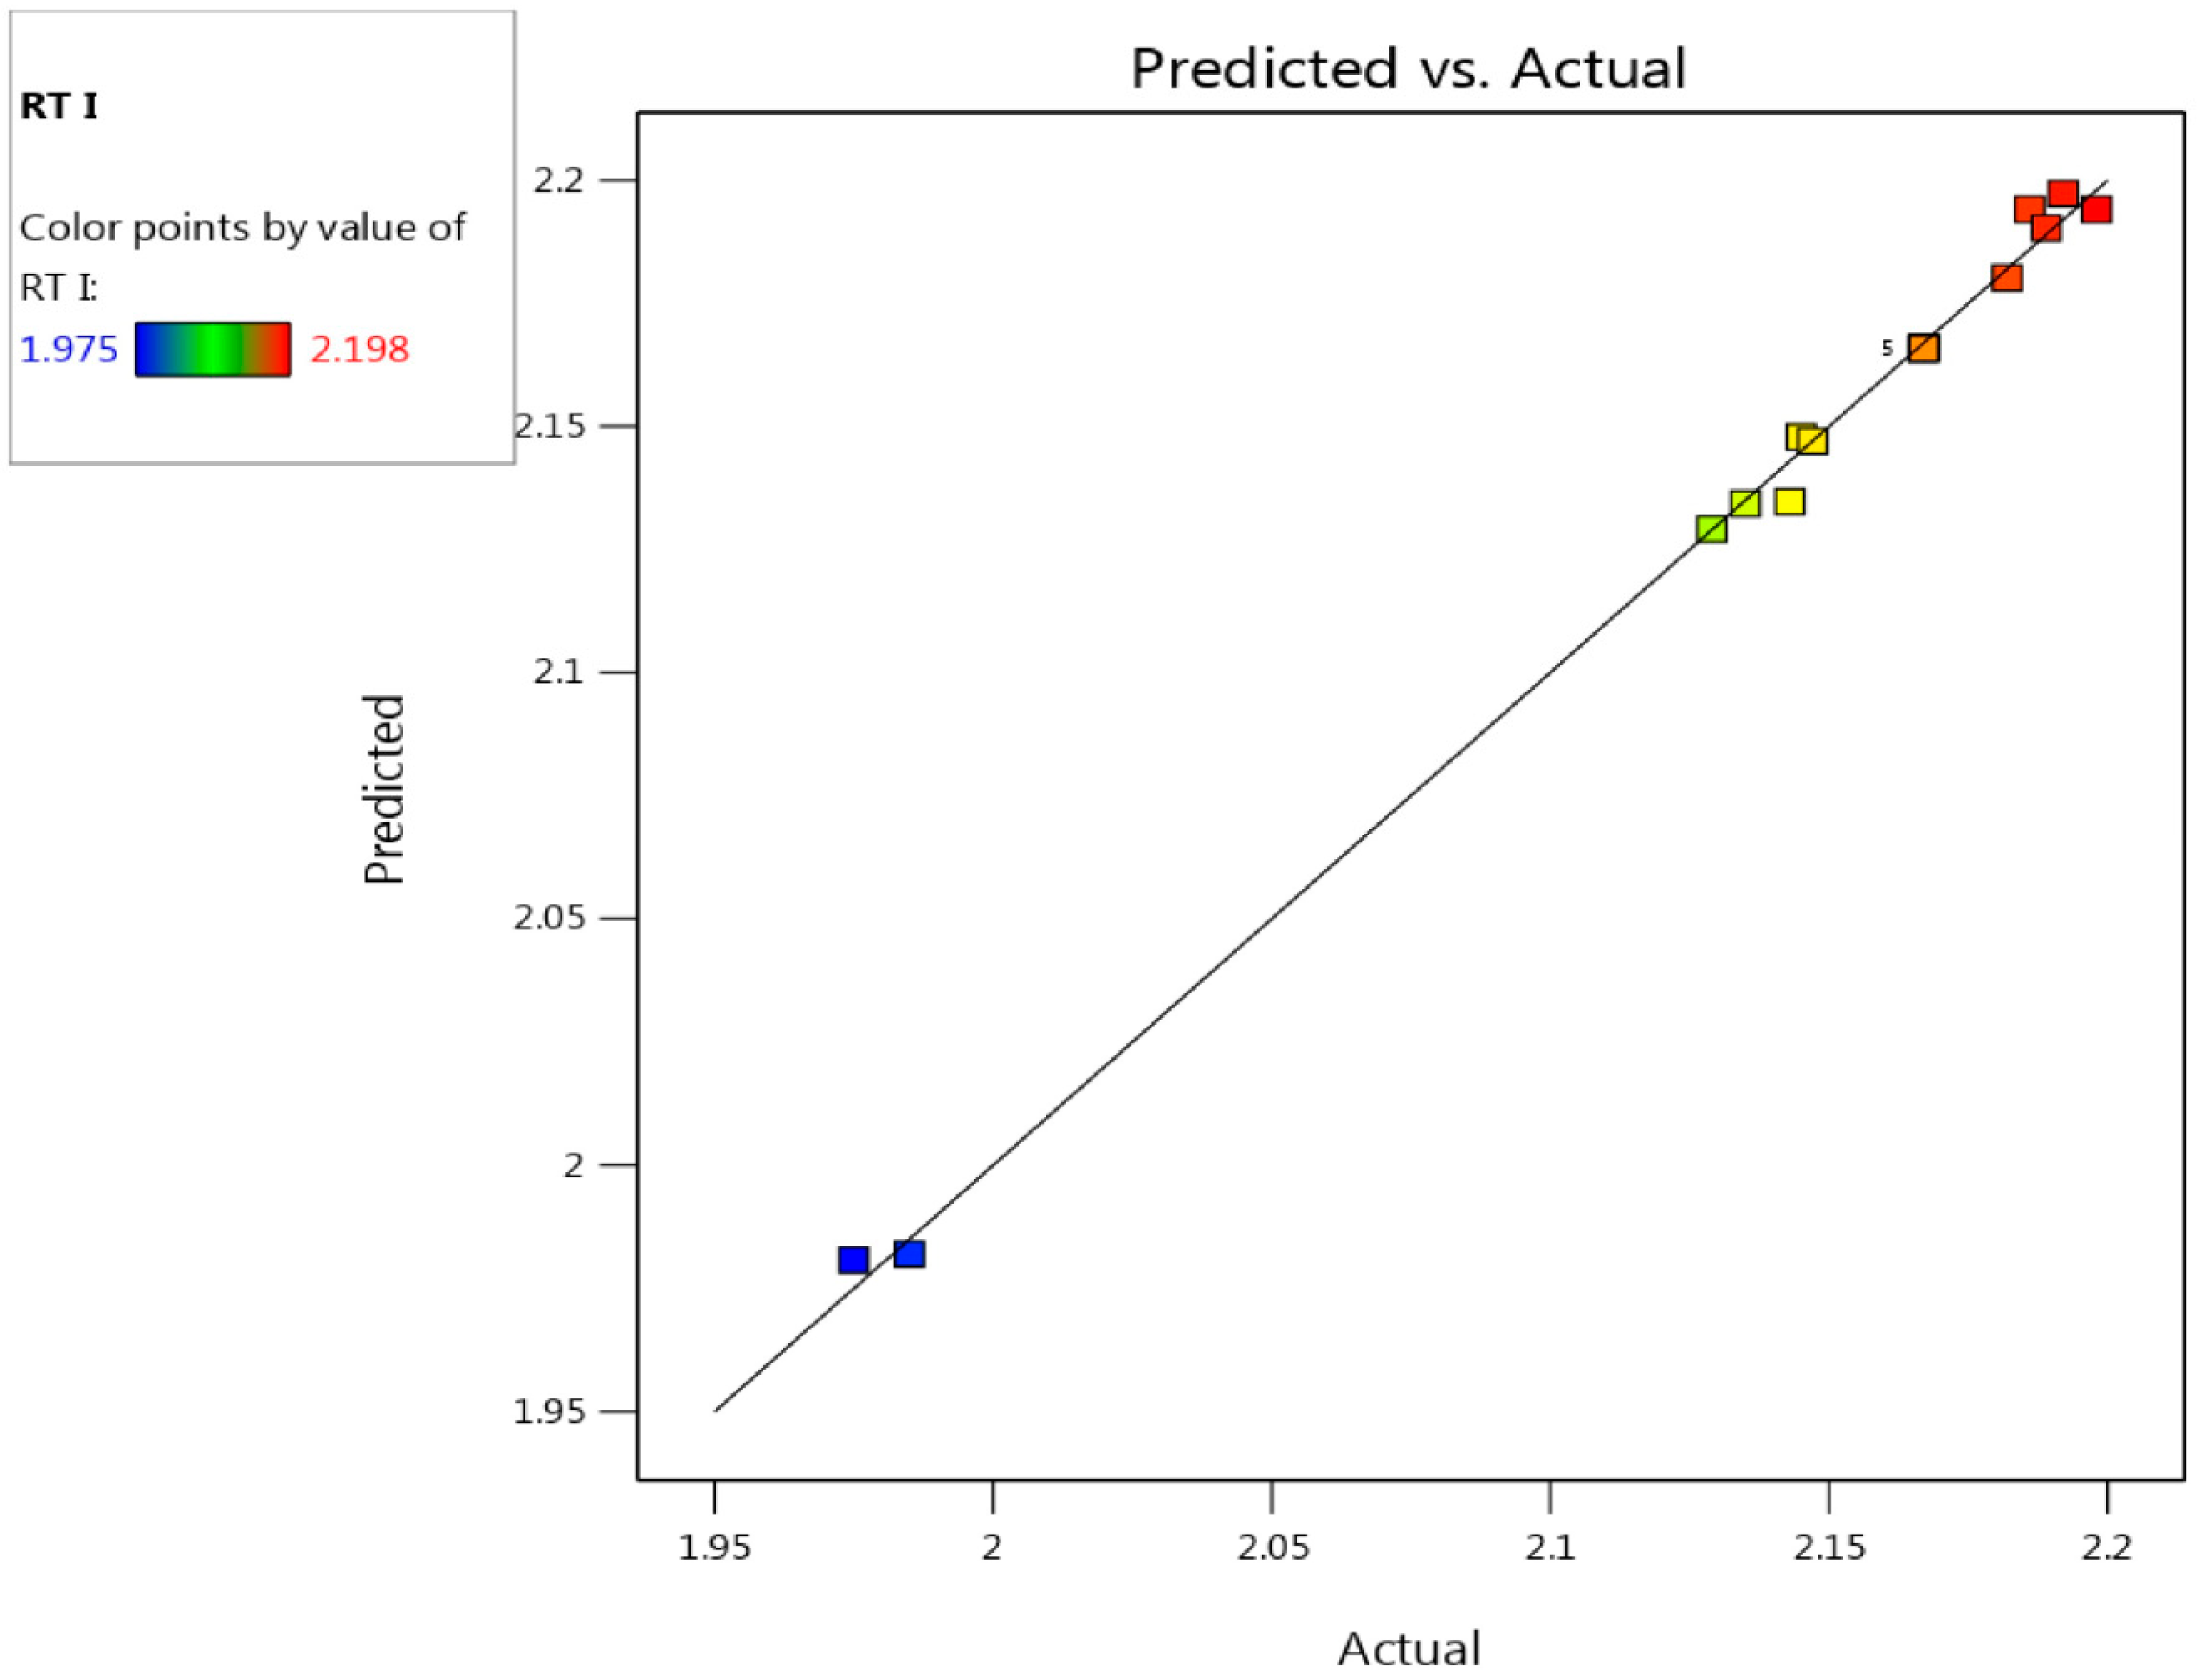
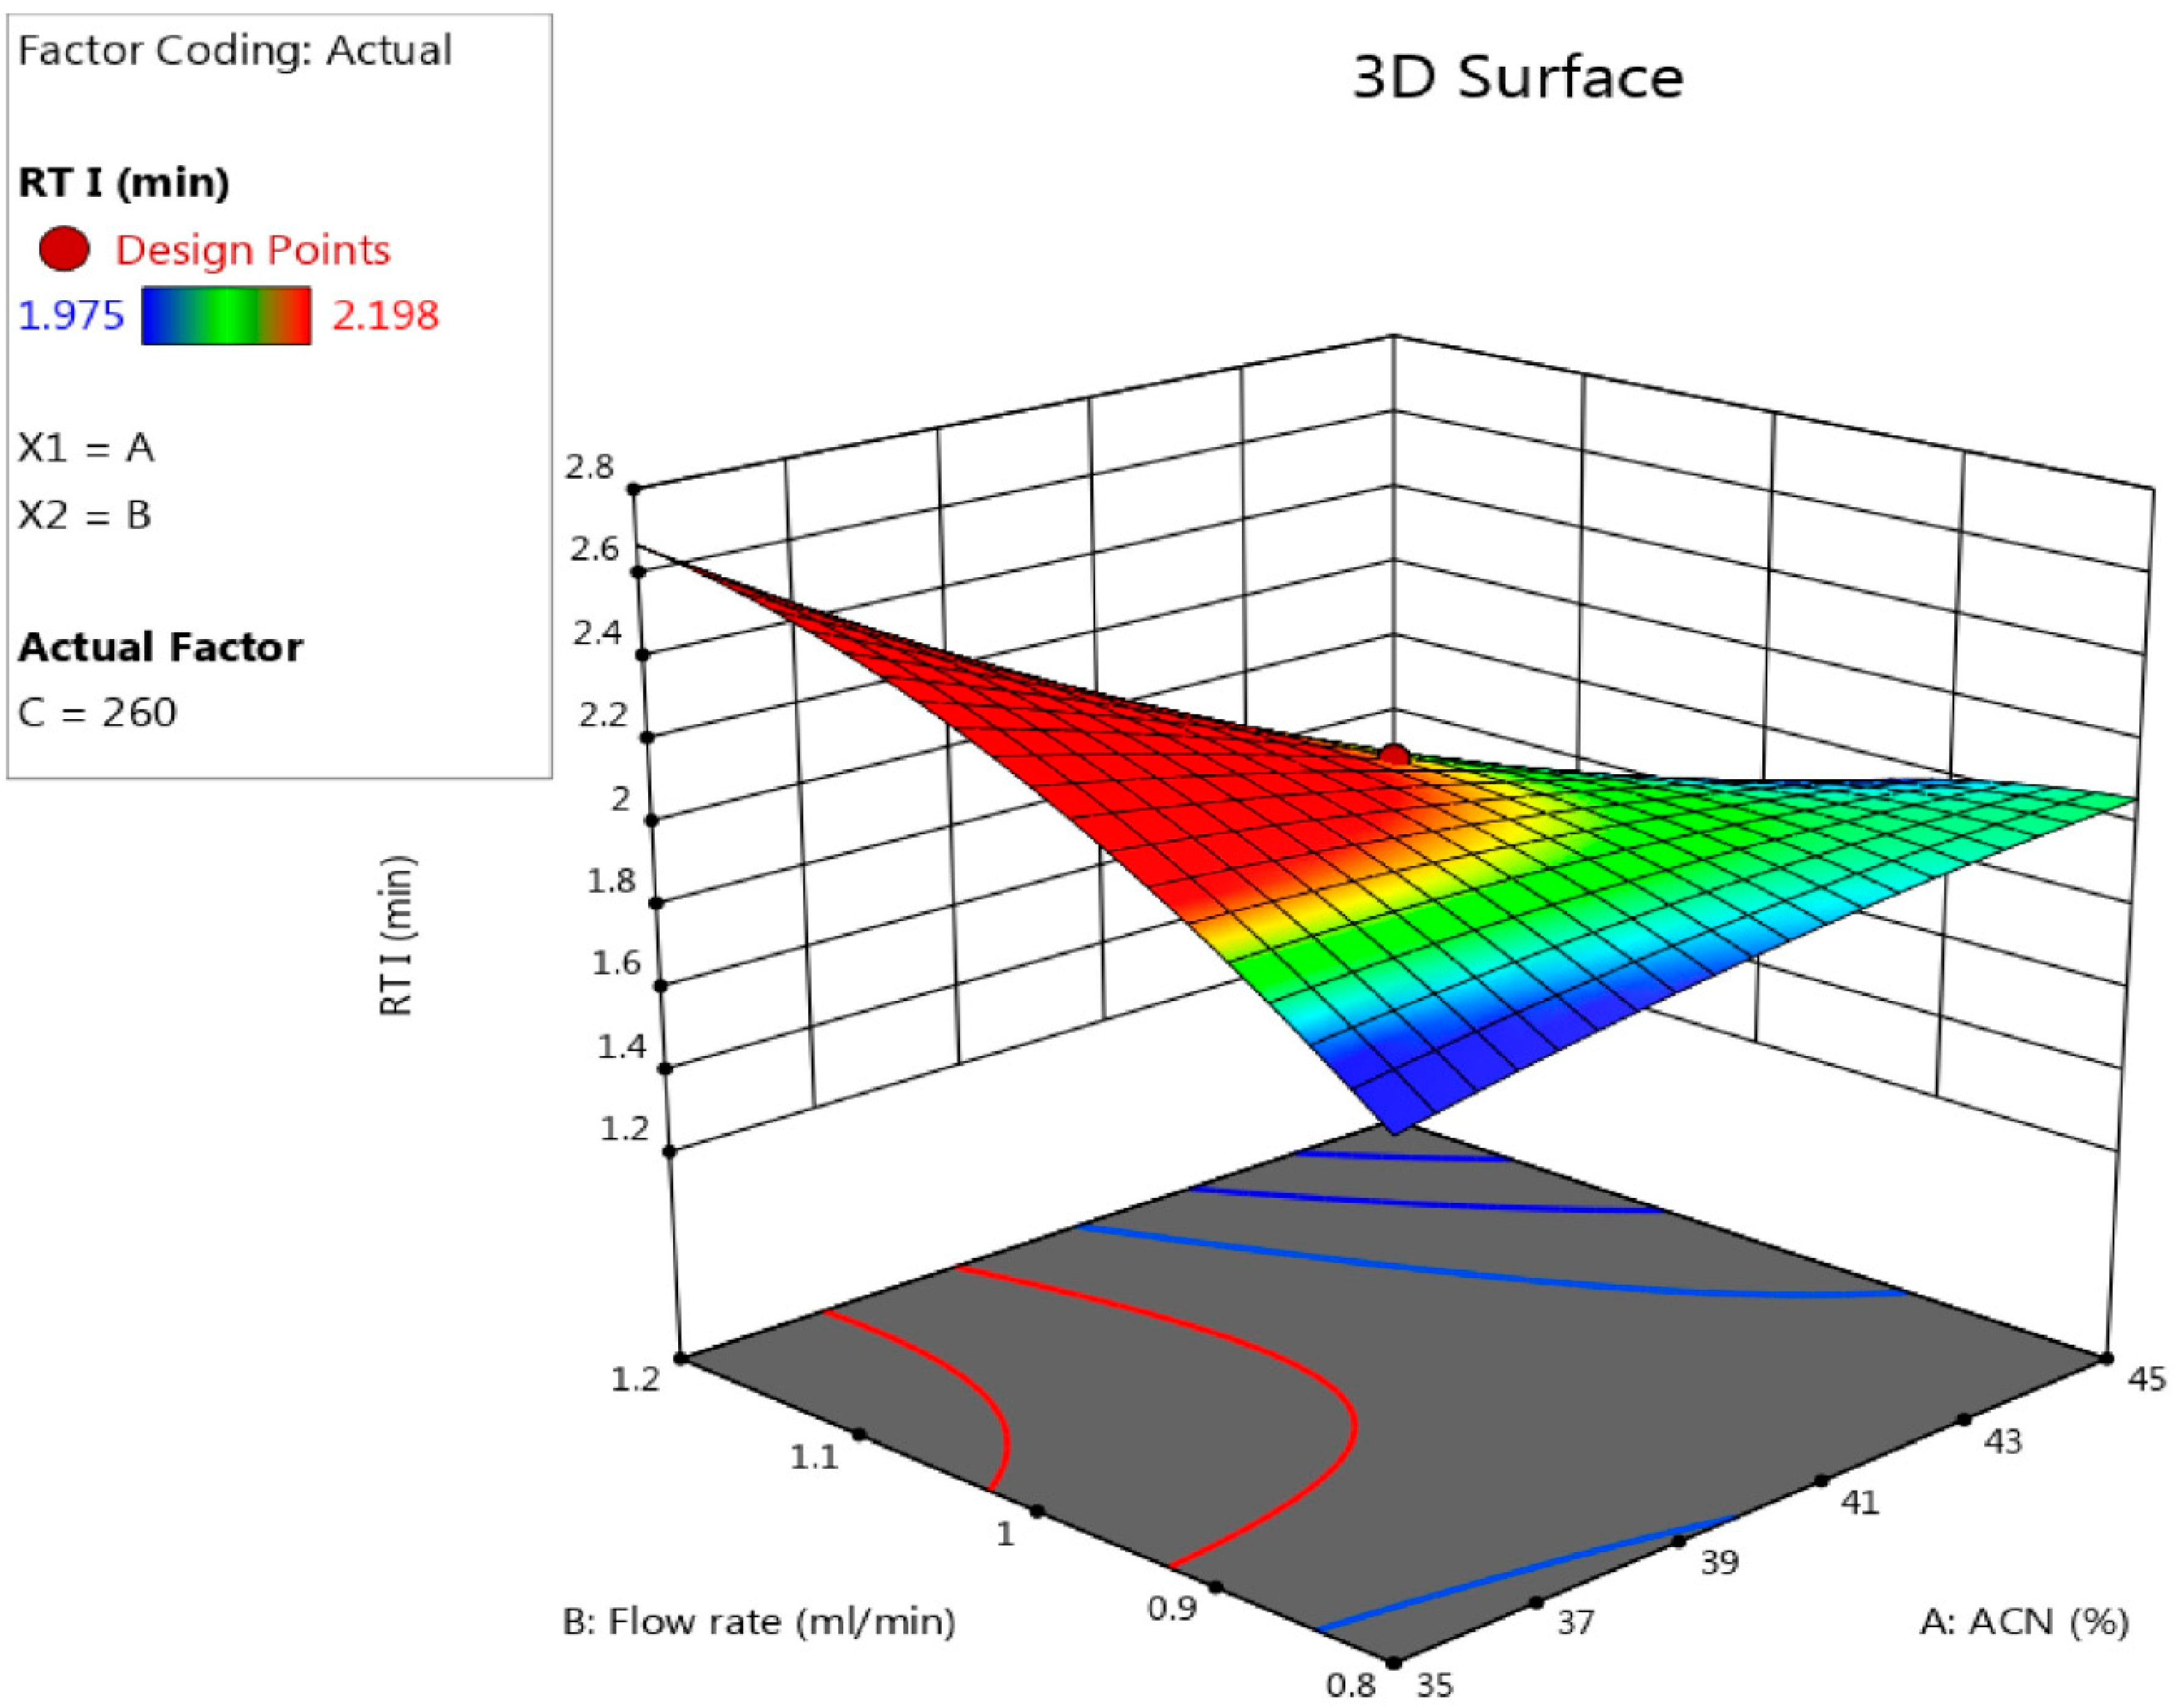
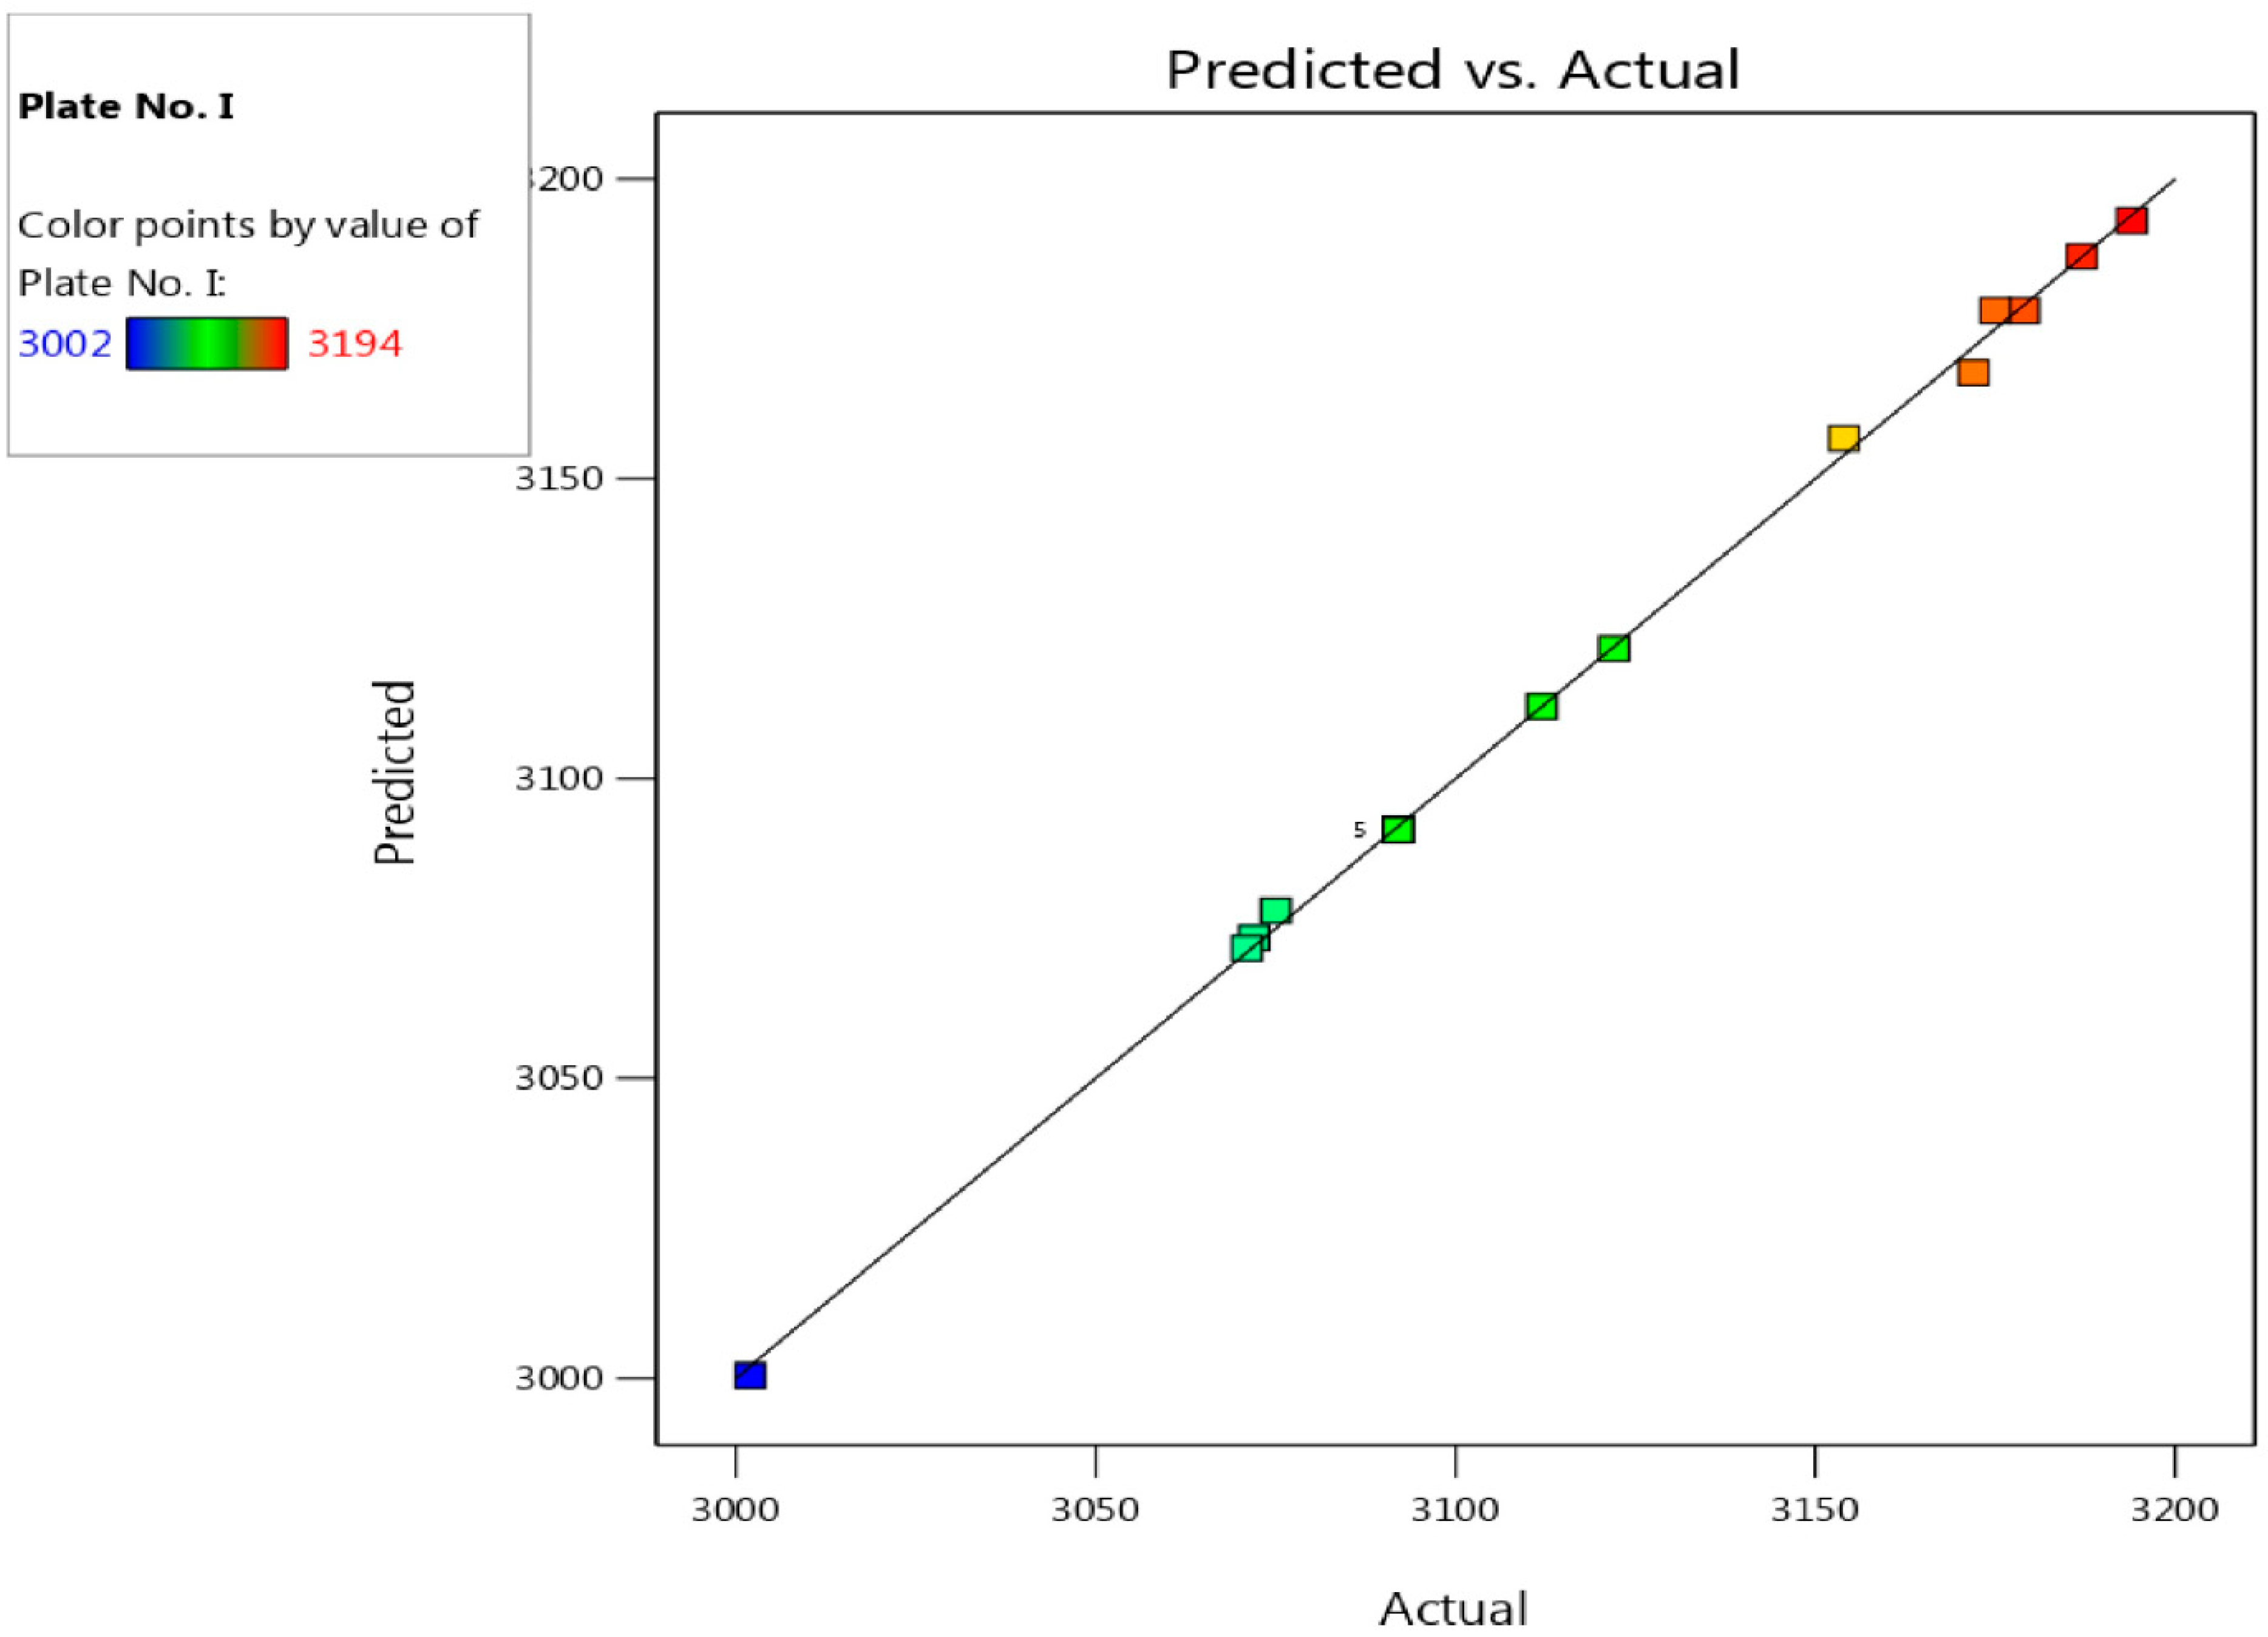
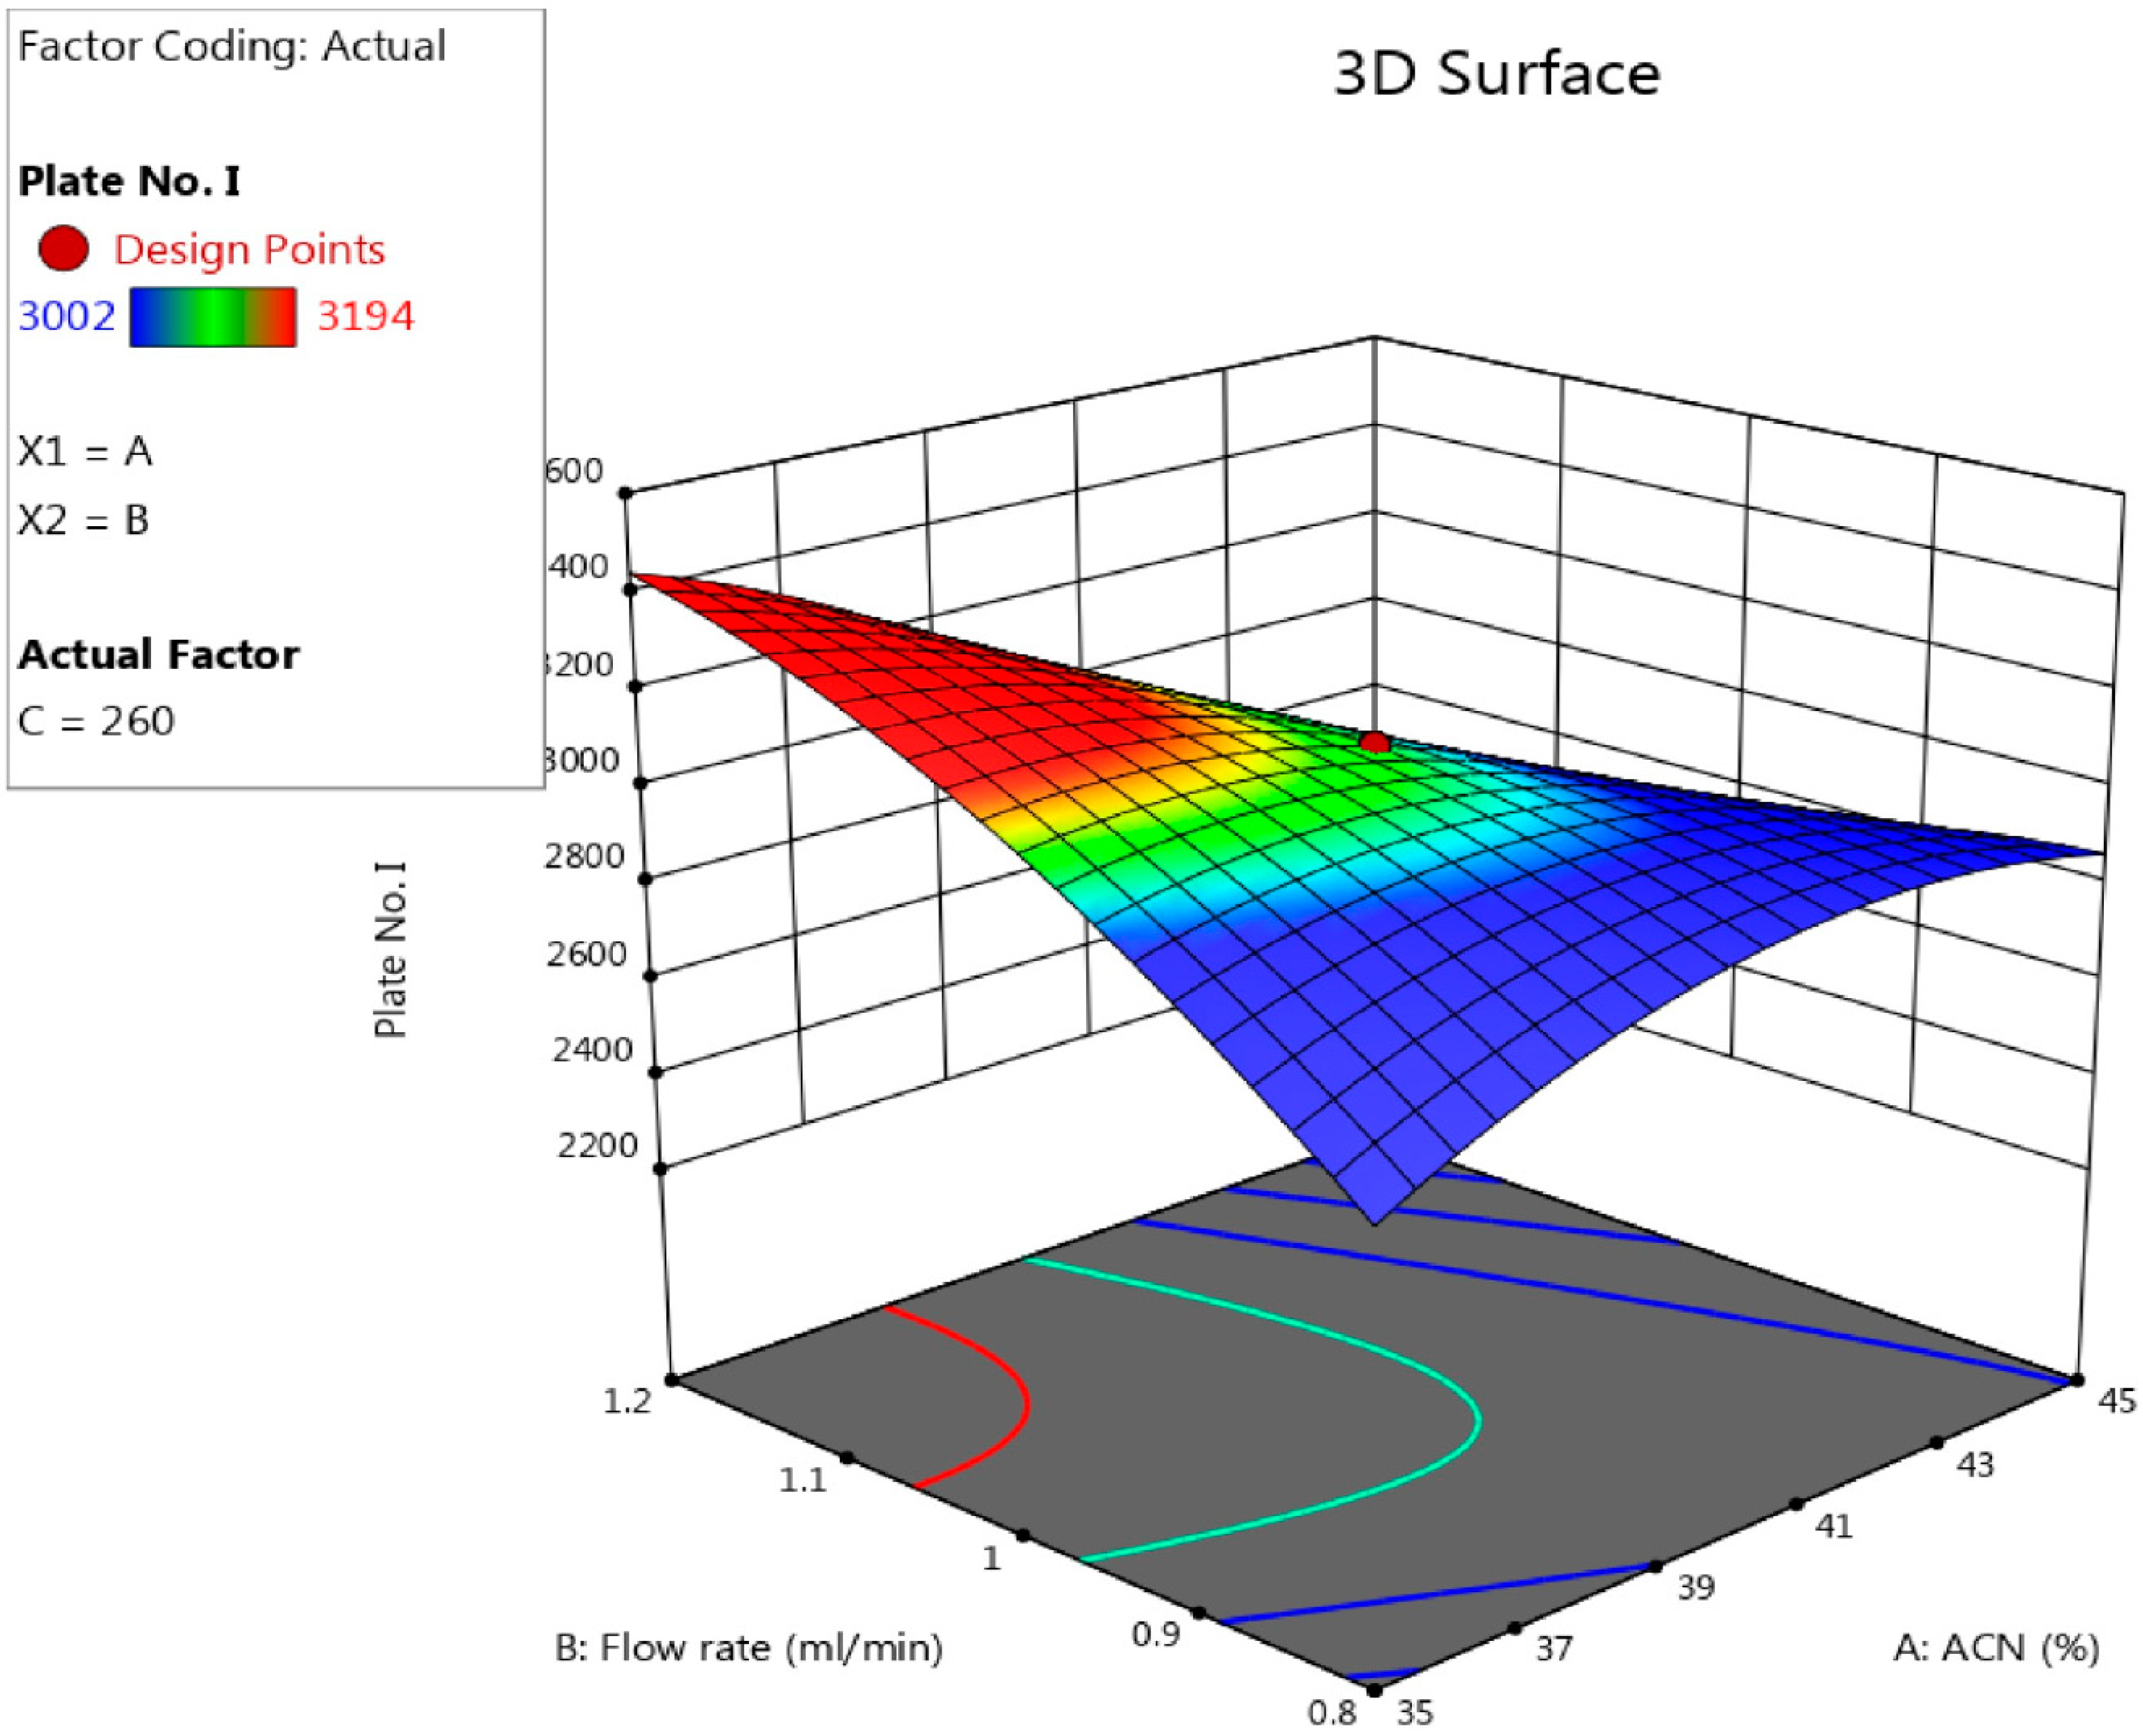
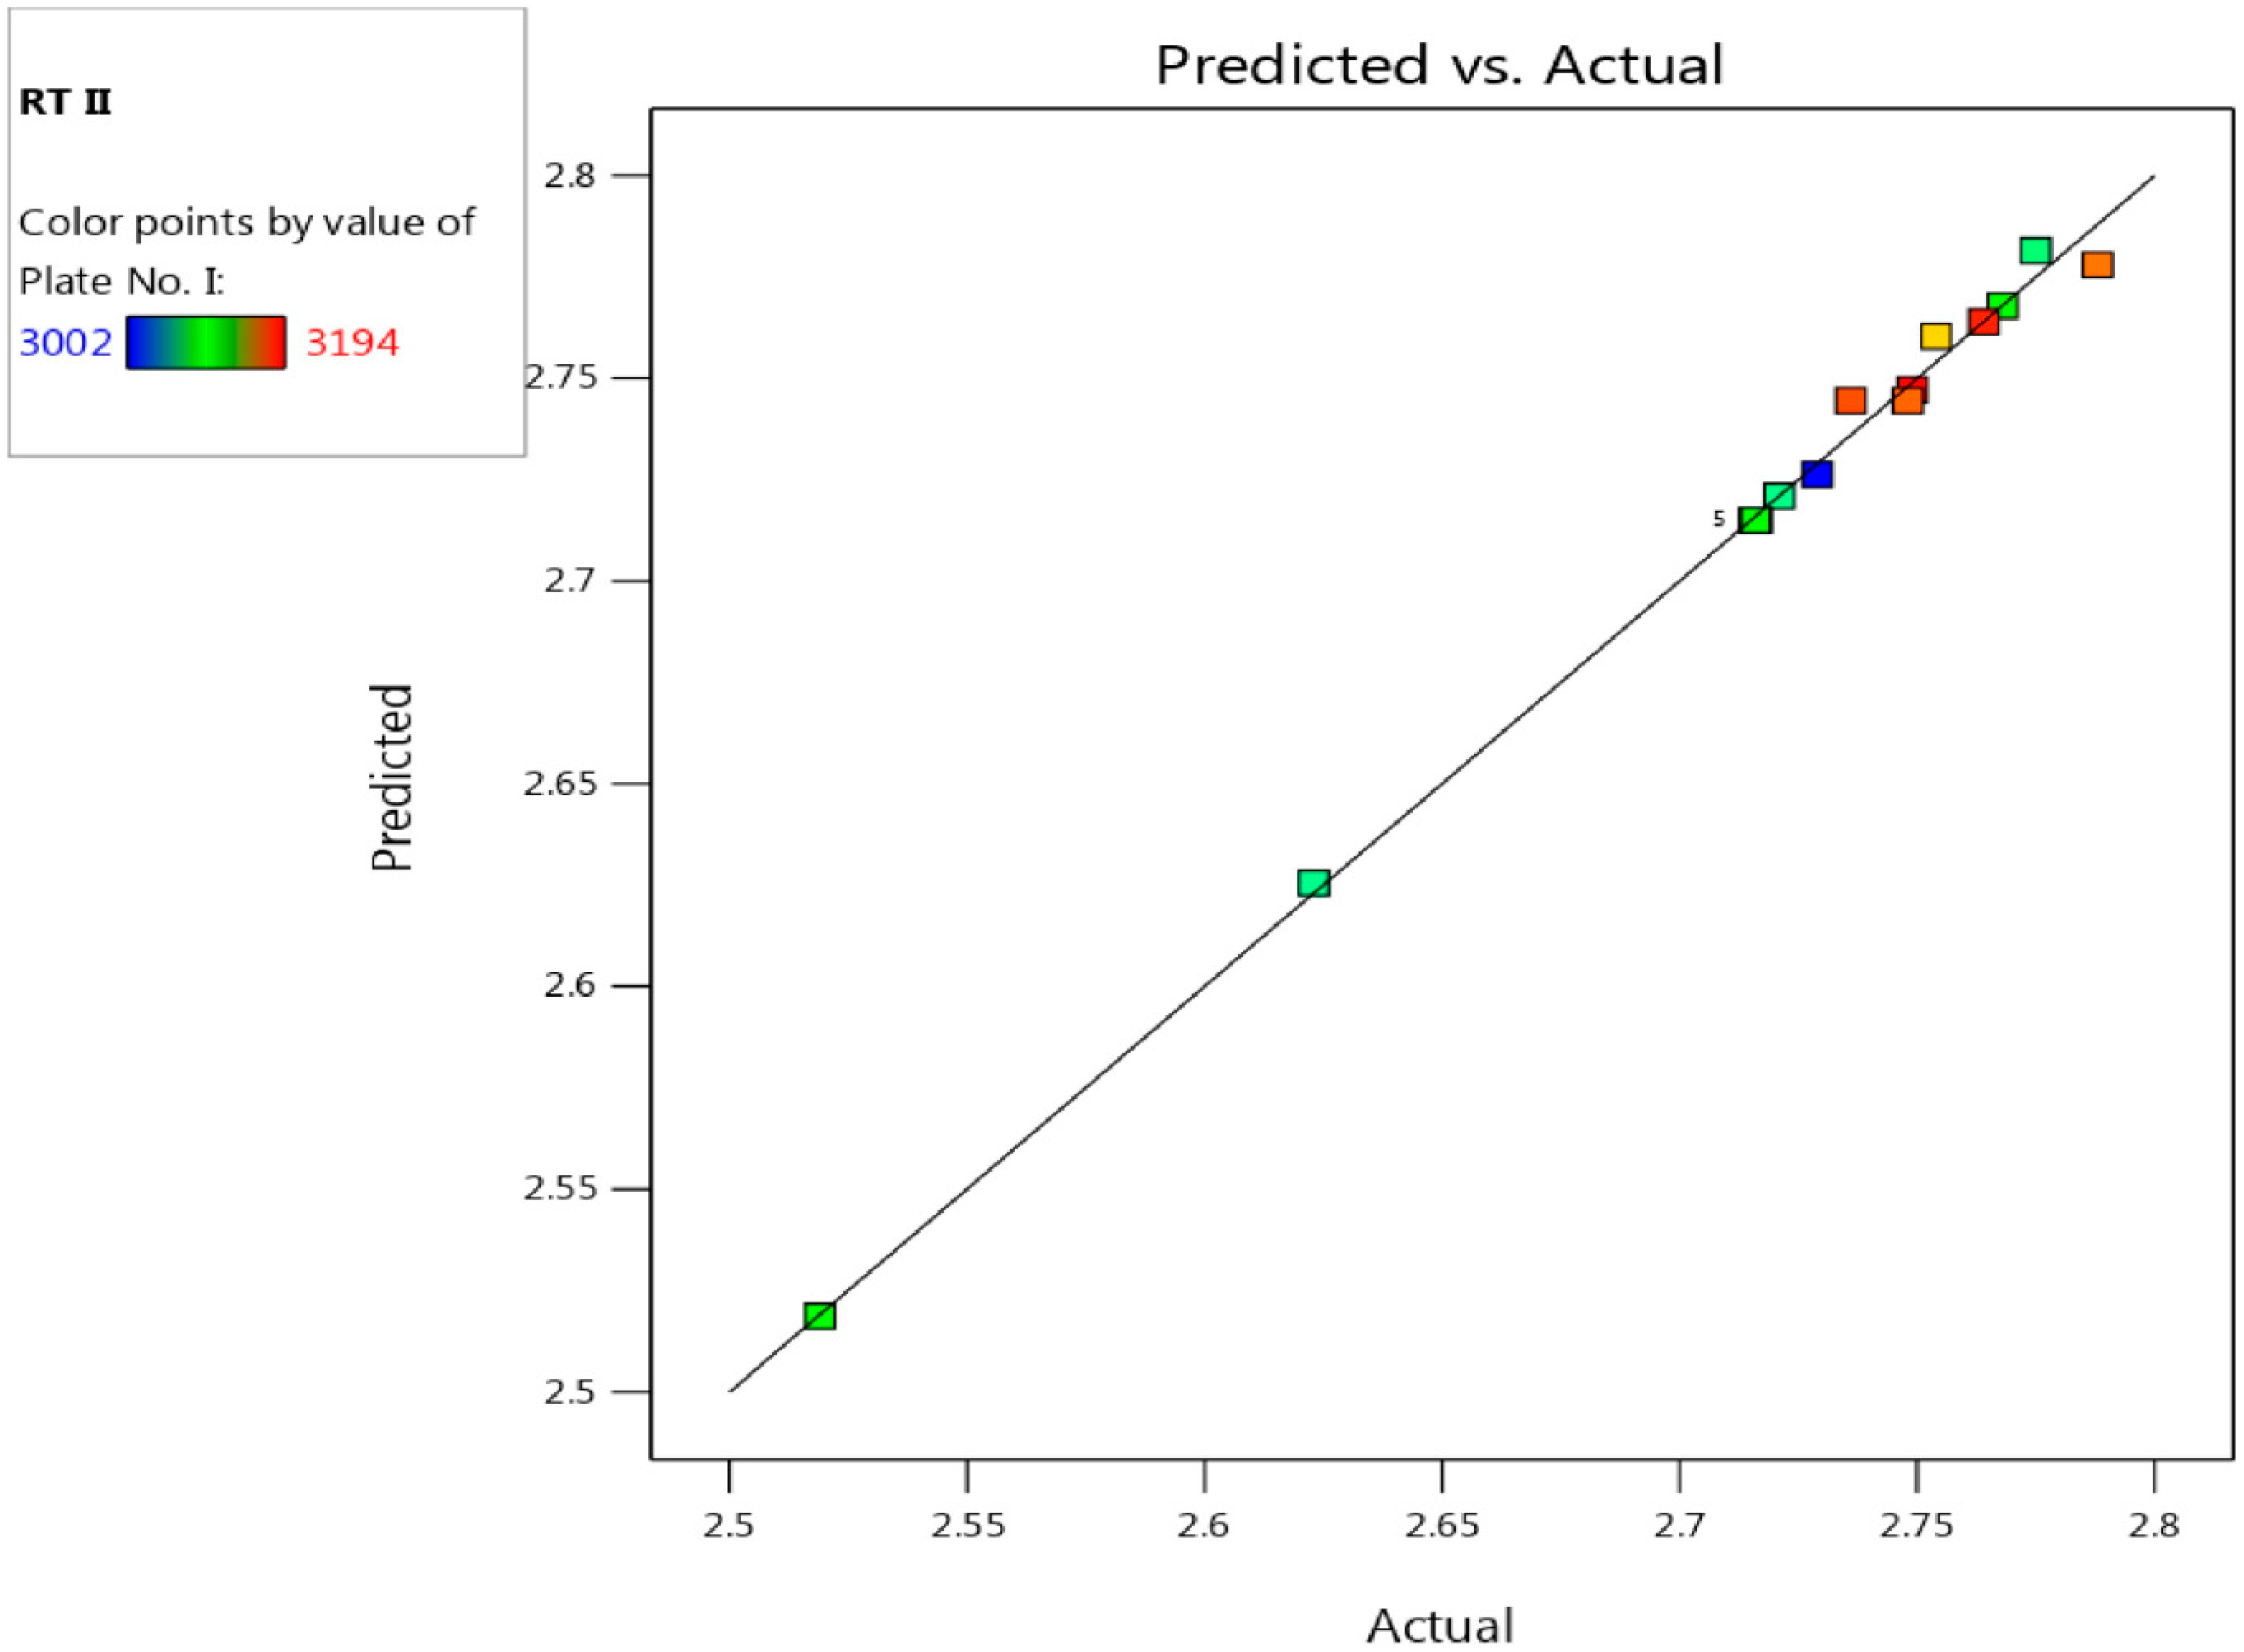
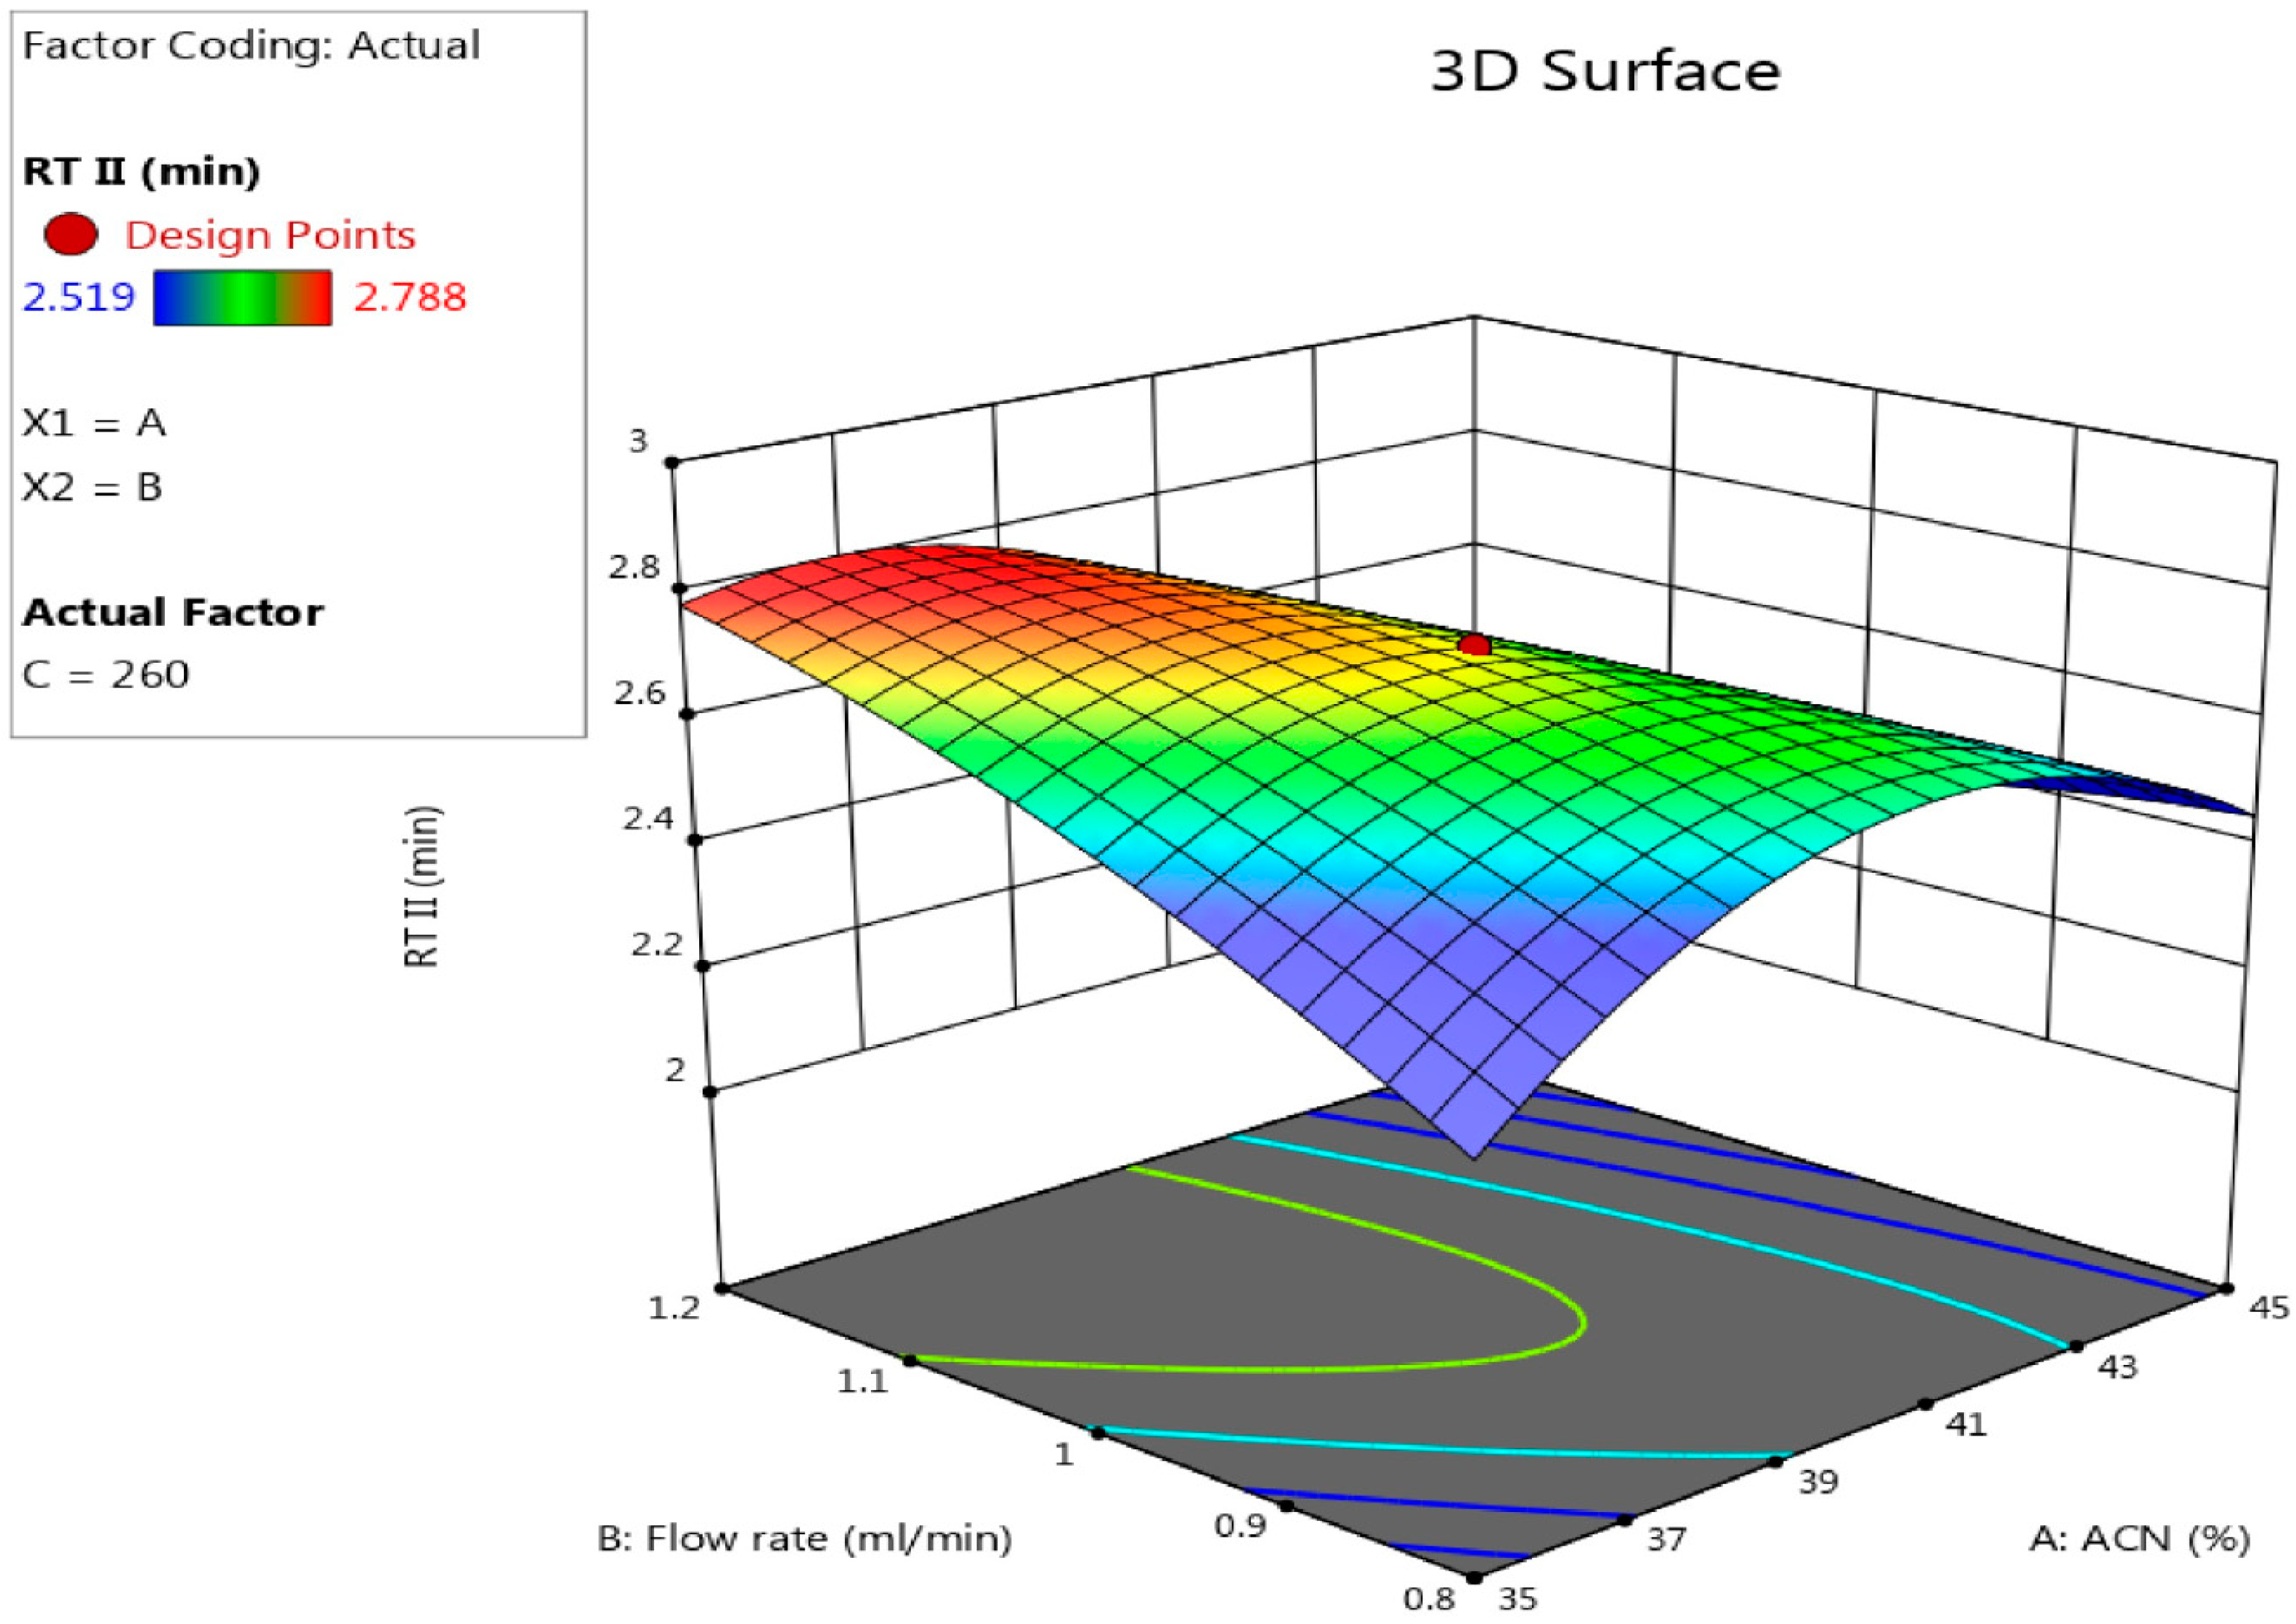
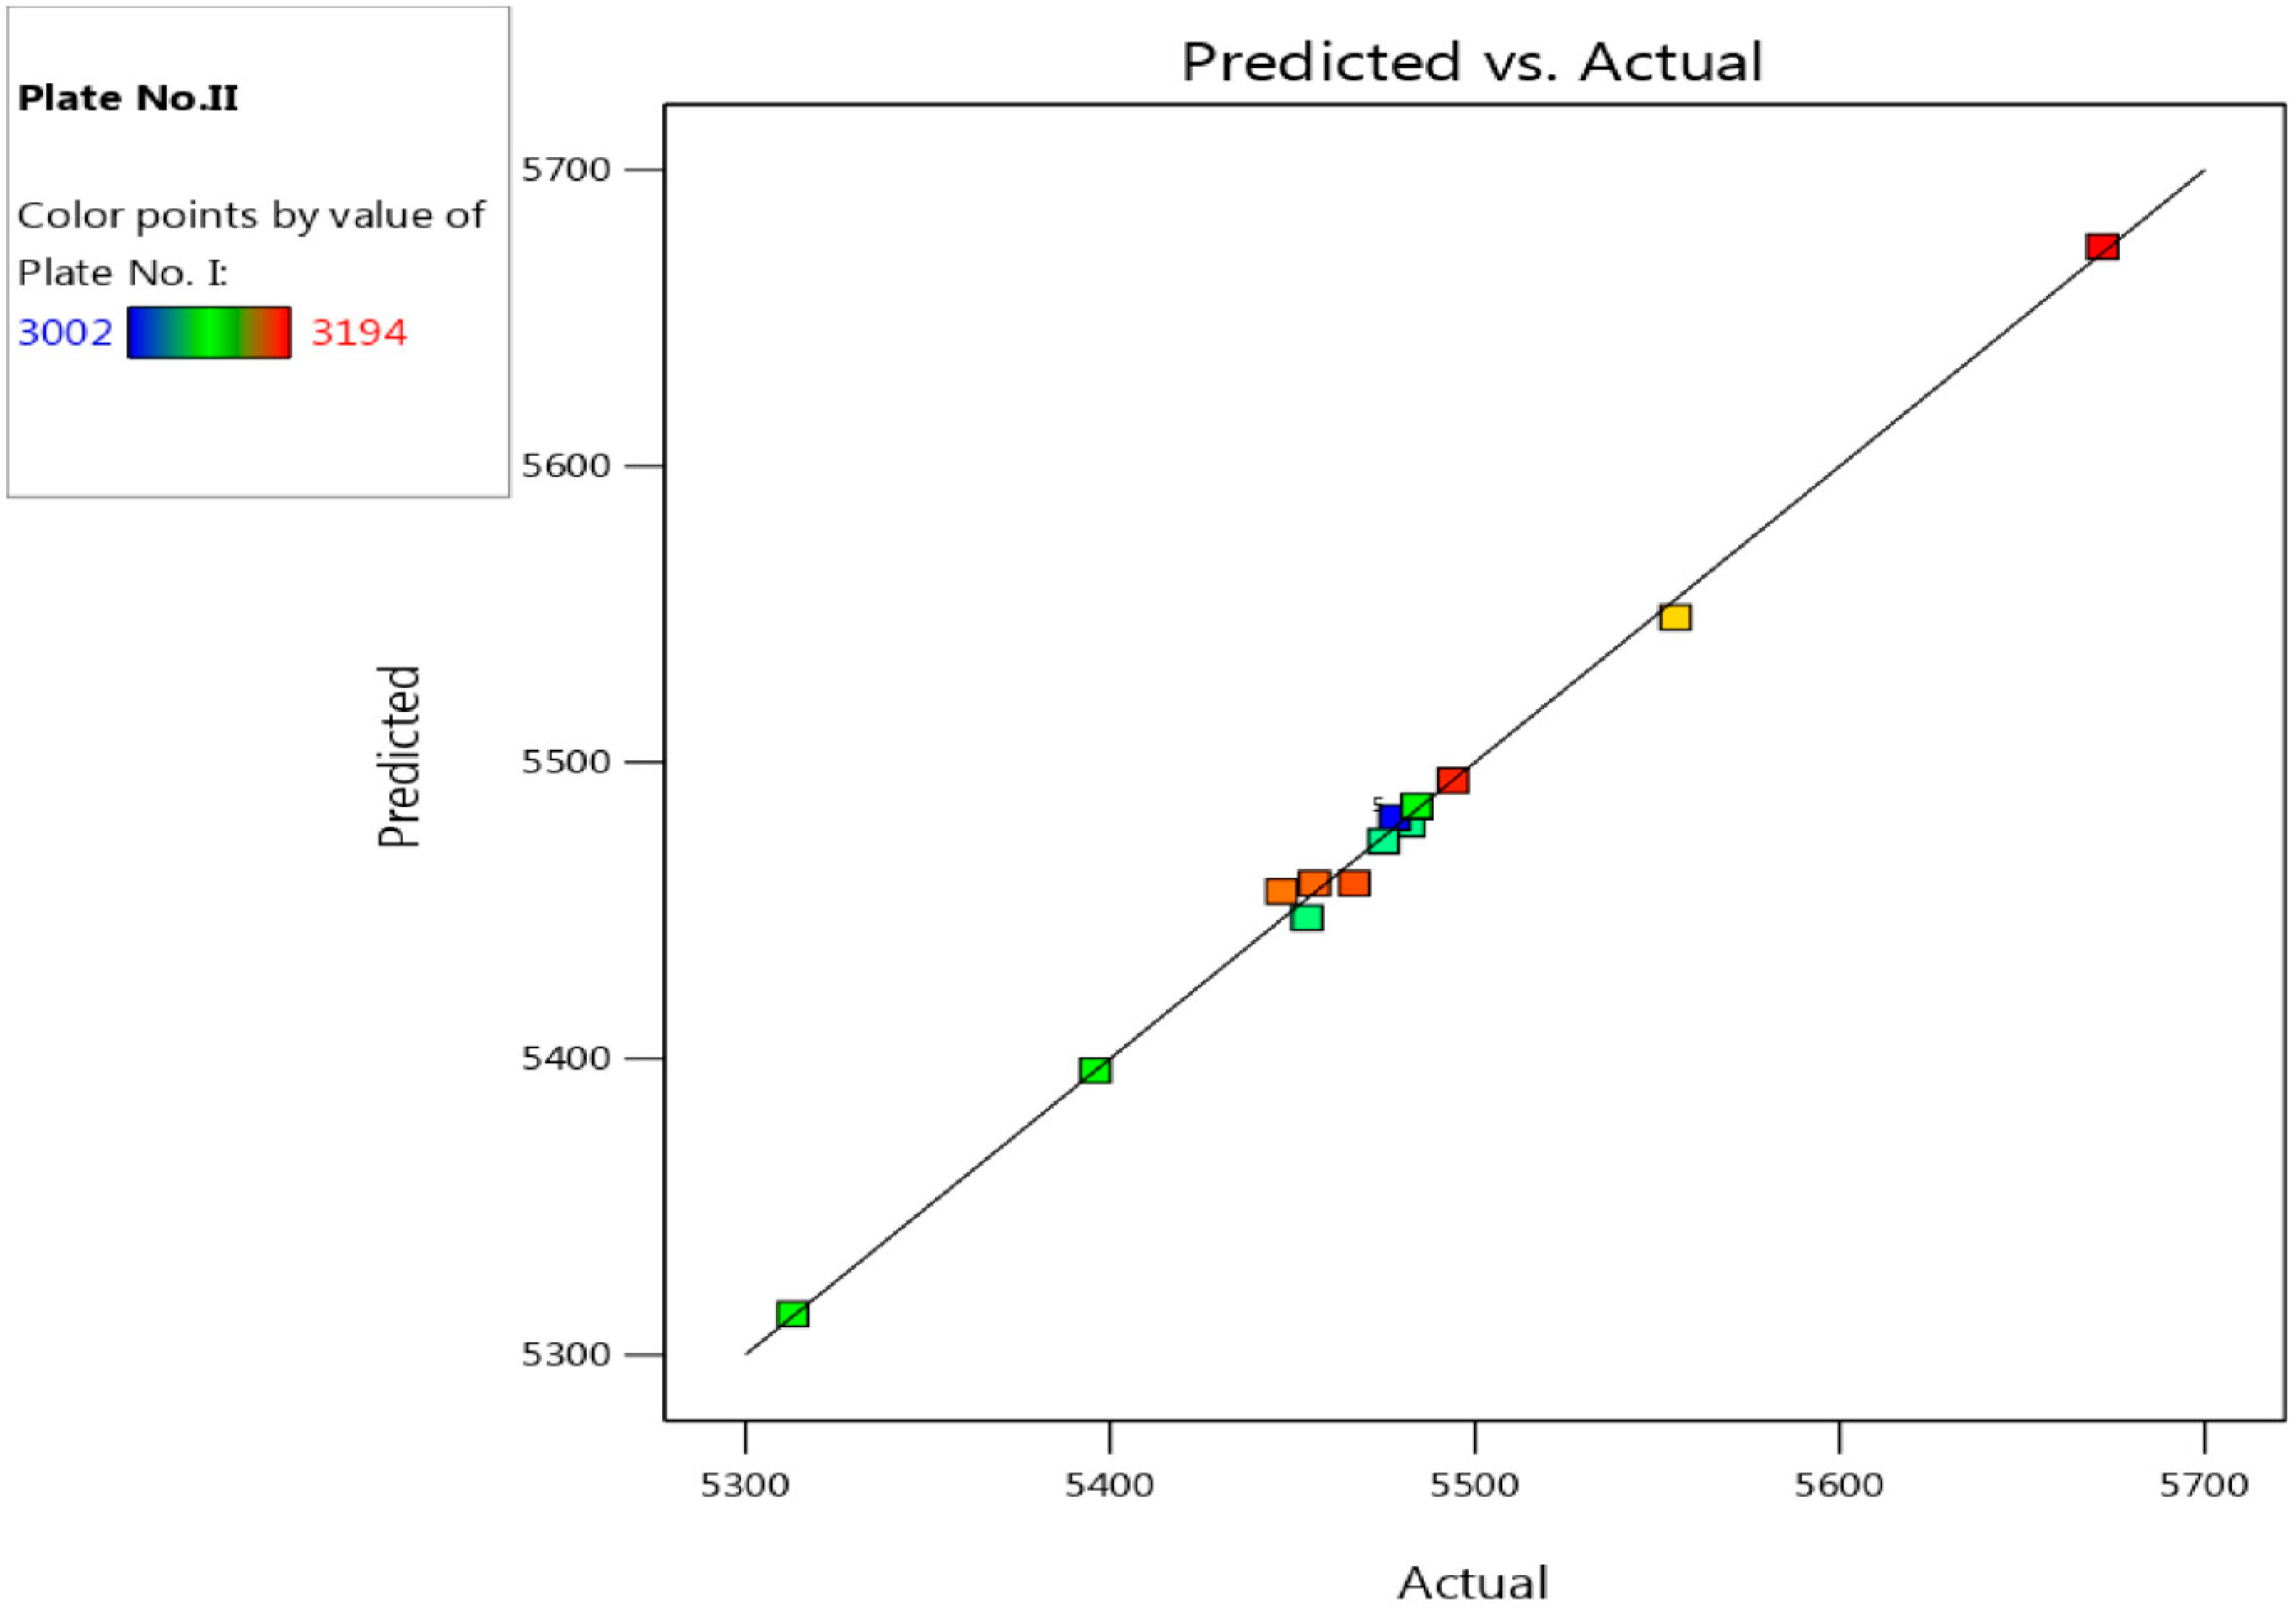
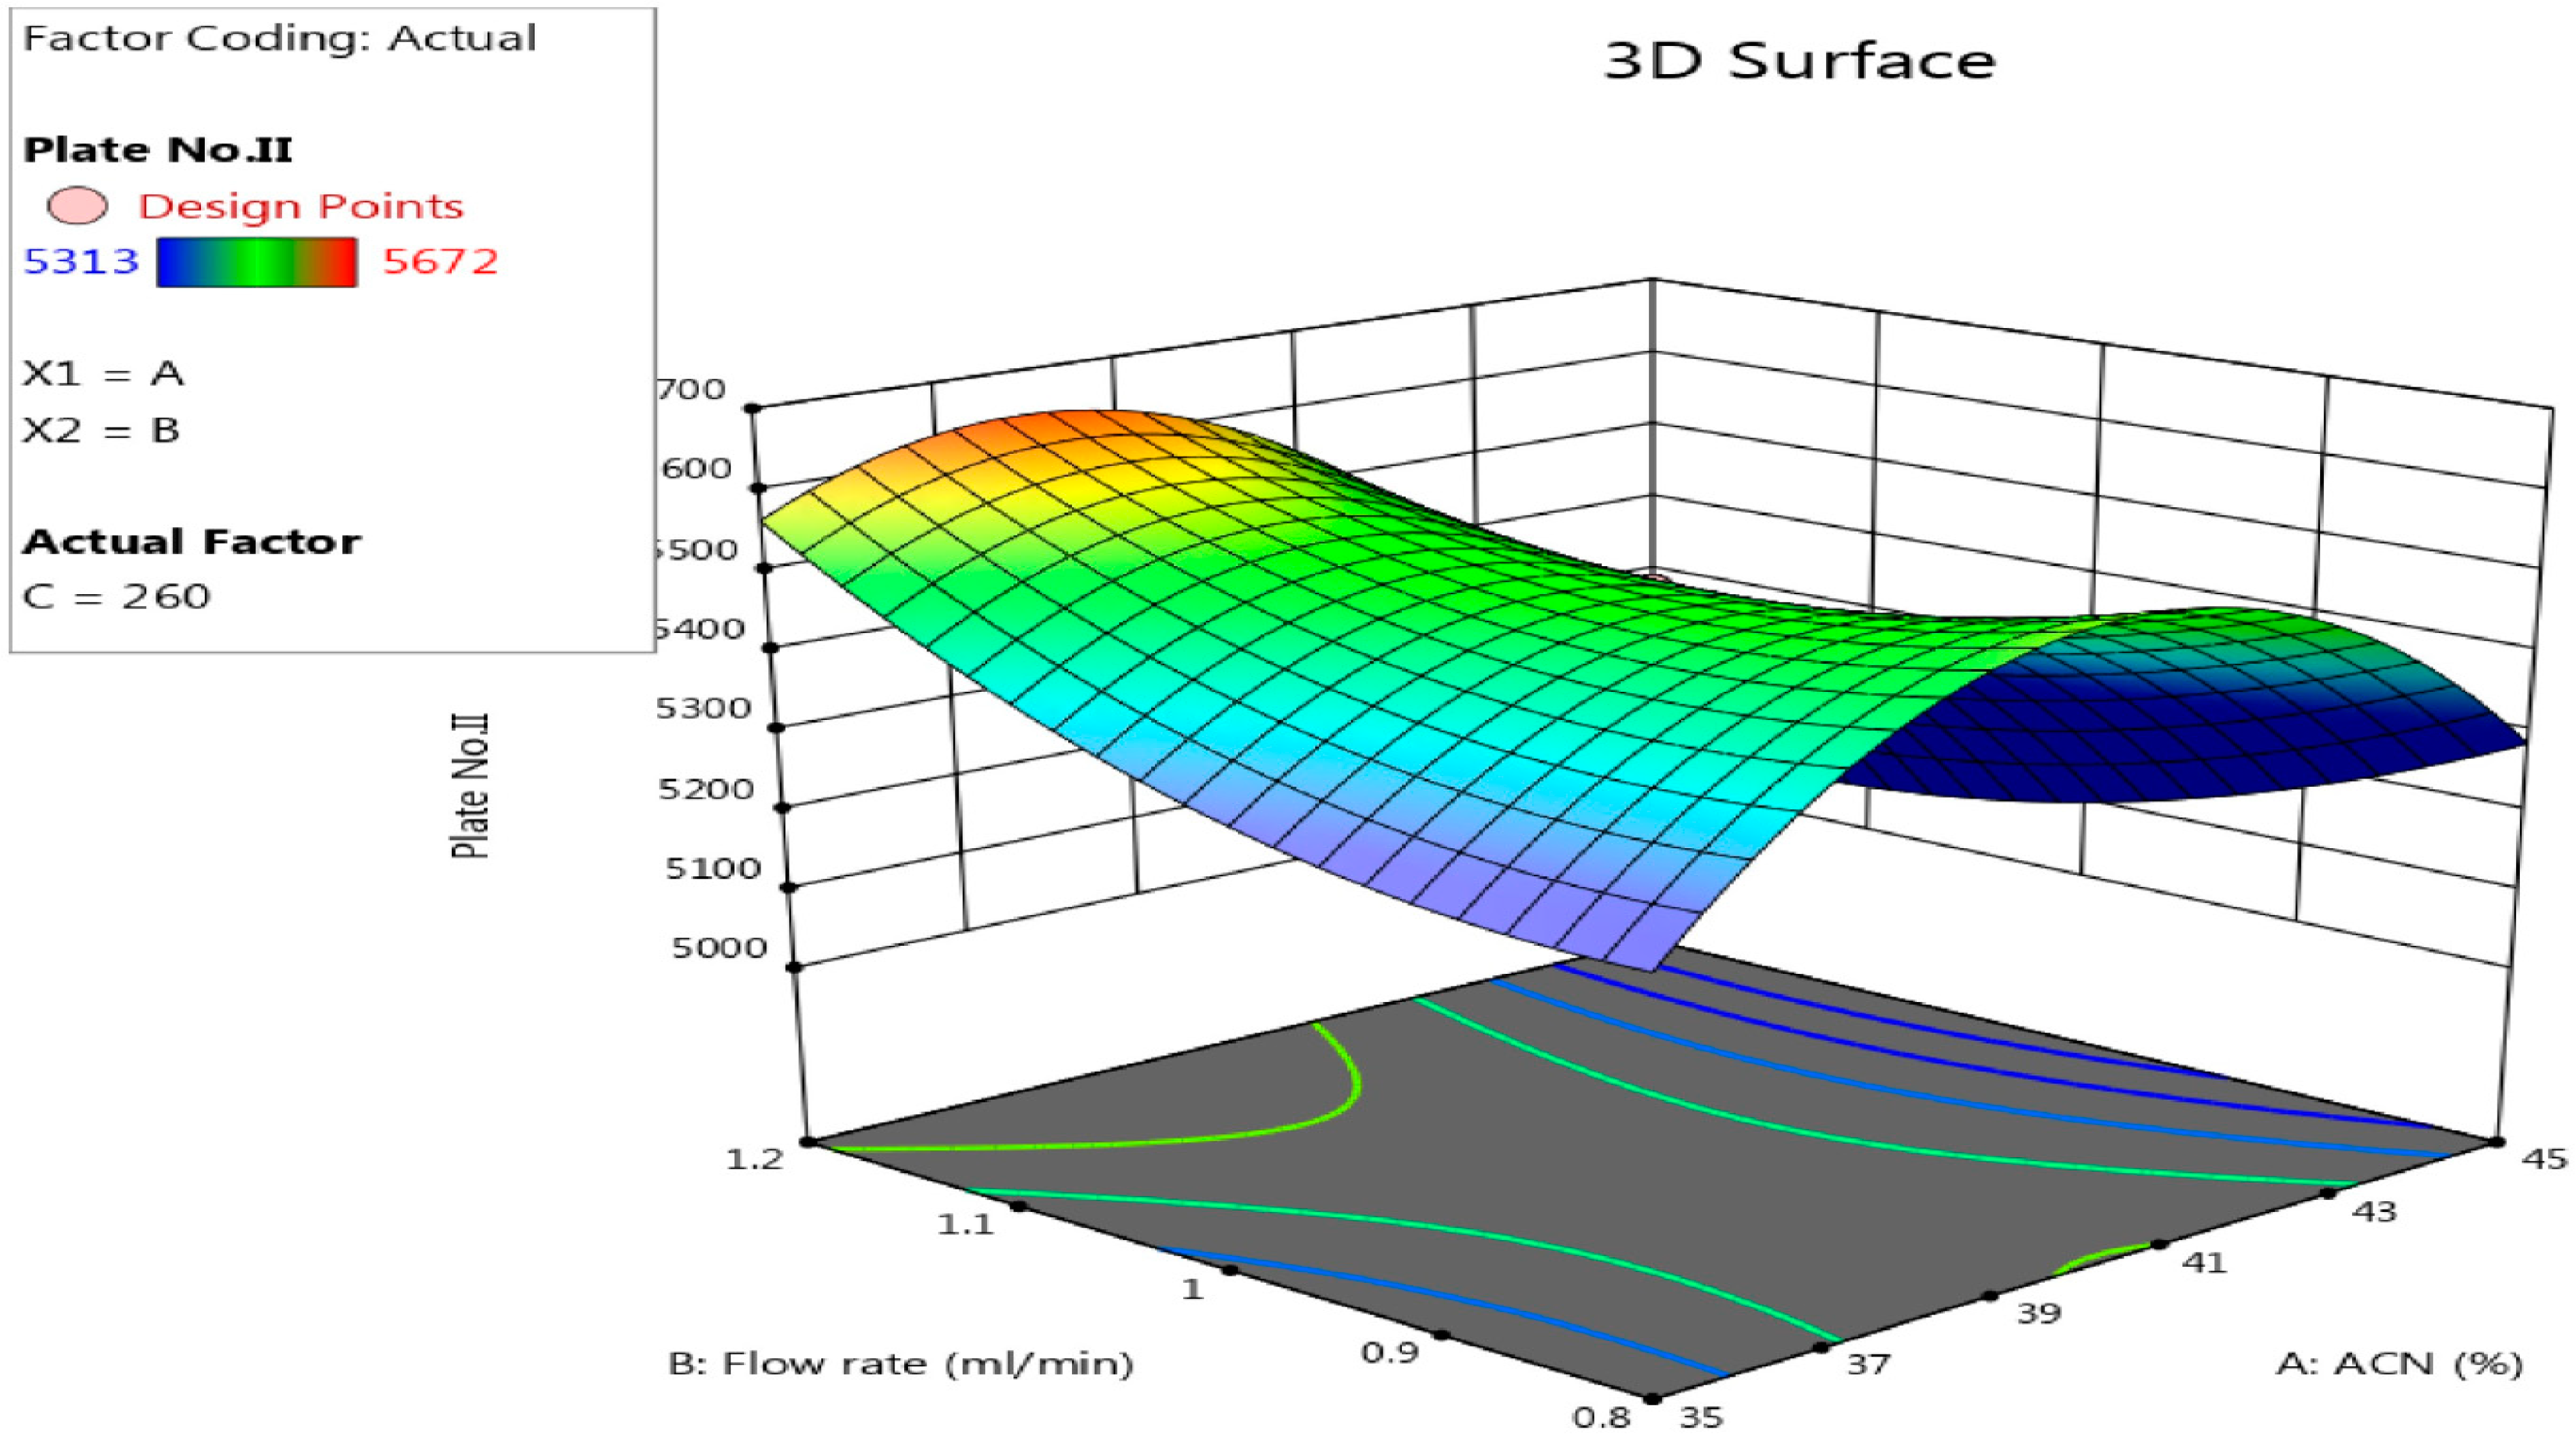
ANOVA inbuilt results came with the optimisation of chromatographic conditions with BBD. The dependent variables for both drugs’ retention times and plate numbers were optimised. The p-value and f-value results suggest that the model is significant. In addition, model graphs of both dependent variables in predicted vs. actual and 3D responses have shown reasonable agreement values between predicted R2 and adjusted R2.
Across the concentration range of 12.5 to 75.0 µg/mL for DTGR and 6.25 to 37.5 µg/mL for RLVN, it was found that the calibration curves were linear. The elutes were detected at 260 nm with an injection volume of 10 µL. In the optimised chromatographic conditions, the retention times were in a suitable resolution for the drugs, 2.168 and 2.719 min for RLVN and DTGR, respectively. The tailing factor and theoretical value of RLVN were, in the developed chromatogram, 1.36 and 3031, respectively; for DTGR, the values were 1.33 and 4598. In the given column, the peaks are well-resolved, sharp, and symmetric. The resolution received a score of 3.5. The linearity of the developed method was confirmed statistically. For accuracy and precision, the %RSD values were less than 2.0%, which confirmed that the developed method was accurate and precise. The chromatograms of the degradation studies indicated that the peaks of the degrading were well resolved in different chromatographic conditions in Empower 2 Software.
Several research manuscripts are available for simultaneously estimating both drugs via RP-HPLC. However, no research manuscript has used BBD to simultaneously quantify RLVN and DTGR. In the present research work, the optimization of chromatographic conditions was performed with the QbD tool, which makes this method novel. Earlier, the retention times were found to be 2.427 min (DTGR) and 4.436 min (RLVN) [8], 3.285 min (DTGR) and 4.635 min (RLVN) [9], and 4.35 min (DTGR) and 7.73 min (RLVN) [10]. However, in the present manuscript, the retention times of both drugs were observed at 2.167 and 2.716 min, for RLVN and DTGR, respectively, in the given chromatographic conditions. Both peaks are observed in a short run time. In routine analysis, this method is useful because more samples will be analysed in less time. For example, if the run time is five minutes, both peaks will be observed and could perform more sample analysis. So, the approach of timesaving will finally give the benefit in cost. The achievements of the short run time and application of BBD in this method development make it novel.

5. Conclusions

The formed chromatographic method is easy to use, precise, and selective. It has also been shown to be stable, which allows for the simultaneous estimation of RLVN and DTGR in pharmaceutical dosage forms and bulk. By emphasising process quality, using BBD in chromatographic optimisation for drug estimation is a novel approach that can save time and money while enhancing analytical quality. The result of the inbuilt ANOVA for QbD has shown that it was significant. The sampling is simple, and the analysis requires little time. Elution is performed using the isocratic method. To the best of our knowledge, no efforts have been made to assess this drug combination using the analytical forced degradation studies method. Nevertheless, all the active ingredients were quantified and generated peaks with good resolution. The developed stability-indicating method was successfully applied to determine the concentration of RLVN and DTGR in the bulk and pharmaceutical dosage forms. It may be expanded to examine RLVN and DTGR estimation in plasma and other biological fluids. It might even be used to estimate the quality control stability samples.

Author Contributions

Conceptualization, M.K. and S.W; methodology, S.A.; software, S.W.; validation, S.H.S., S.A. and S.W.; formal analysis, M.K.; investigation, M.K.; resources, S.W.; data curation, S.A.; writing—original draft preparation, M.K.; writing—review and editing, M.K.; visualization, S.W.; supervision, M.K.; project administration, S.H.S.; funding acquisition, S.W. All authors have read and agreed to the published version of the manuscript.

Funding

This study is supported via funding from Prince Sattam Bin Abdulaziz University project number (PSAU/2023/R/1444).

Data Availability Statement

Not applicable.

Acknowledgments

This study is supported via funding from Prince Sattam Bin Abdulaziz University project number (PSAU/2023/R/1444).

Conflicts of Interest

The authors declare no conflict of interest.

References

  1. Noorbasha, K.; Nurbhasha, S.A. New validated stability-indicating RP-HPLC method for simultaneous quantification of dolutegravir and lamivudine in bulk and pharmaceutical dosage form. Future J. Pharm. Sci. 2020, 6, 39. [Google Scholar] [CrossRef]
  2. Dowers, E.; Zamora, F.; Barakat, L.A.; Ogbuagu, O. Dolutegravir/rilpivirine for the treatment of HIV-1 infection. HIV/AIDS 2018, 10, 215–224. [Google Scholar] [CrossRef] [PubMed] [Green Version]
  3. Balasaheb, B.G.; Balasaheb, A.K.; Subhash, T.R.; Jijabapu, K.; Sudhakar, P.S. Development and validation of UV spectrophotometric method for estimation of dolutegravir sodium in tablet dosage form. Malays. J. Anal. Sci. 2015, 19, 1156–1163. [Google Scholar]
  4. Bhavar, G.B.; Pekamwar, S.S.; Aher, K.B.; Thorat, R.S.; Chaudhari, S.R. High-Performance Liquid Chromatographic and High-Performance Thin-Layer Chromatographic Method for Quantitative Estimation of Dolutegravir Sodium in Bulk Drug and Pharmaceutical Dosage Form. Sci. Pharm. 2016, 84, 305–320. [Google Scholar] [CrossRef] [PubMed] [Green Version]
  5. Mulak, U.A.; Narkhede, S.P.; Shinde, M.P. Development of analytical method for in-vitro drug dissolution study of dolutegravir marketed formulation. J. Pharm. Sci. Res. 2018, 10, 2726–2730. [Google Scholar]
  6. Katla, S.R.; Kumar, V.R.; Thota, S. Estimation of rilpivirine in bulk and pharmaceutical dosage form. Der. Pharm. 2014, 6, 146–151. [Google Scholar]
  7. Thoke, S.T.; Jadhao, U.T.; Dhembre, G.N. Development and Validation of UV Spectrophotometric Methods for Simultaneous Estimation of Dolutegravir Sodium and Rilpivirine Hydrochloride in Pure Bulk Form. Asian J. Pharm. Anal. 2022, 12, 181–186. [Google Scholar] [CrossRef]
  8. Yusuff, I.; Vara Prasad, M.V.; Shaheedha, S.M.; Habeeb, M. A New Stability Indicating RP-HPLC Method Development and Validation for the Simultaneous Estimation of Dolutegravir and Rilpivirine in Bulk and its Dosage Forms. Iran. J. Pharm. Sci. 2019, 15, 53–72. [Google Scholar]
  9. Sivagami, B.; Sharmil, K.; Chandrasekar, L.M.; Niranjan, R.; Babu, M. Development and Validation for the Simultaneous Estimation of Rilpivirine and Dolutegravir in Bulk and Pharmaceutical Dosage Forms by RP-HPLC Method. Res. J. Pharm. Technol. 2022, 15, 5302–5306. [Google Scholar] [CrossRef]
  10. Veeraswami, B.; Naveen, V.M.K. Development and Validation of RP-HPLC Method for the Estimation of Dolutegravir and Rilpivirine in Bulk and Pharmaceutical Dosage Form and Its Application to Rat Plasma. Asian J. Pharm. Clin. Res. 2019, 12, 267–271. [Google Scholar] [CrossRef]
  11. Godela, R. An effective stability indicating RP-HPLC method for simultaneous estimation of Dolutegravir and Lamivudine in bulk and their tablet dosage form. Future J. Pharm. Sci. 2020, 6, 9. [Google Scholar] [CrossRef] [Green Version]
  12. Srinivas, L.; Jain, N. Stability Indicative and Cost Effective Creation and Validation of Analytical Method of Lopinavir and Rilpivirine by High Performance Liquid Chromatography. Int. J. Res. Pharm. Sci. 2021, 12, 786–792. [Google Scholar] [CrossRef]
  13. Prasanna, A.; Rani, S.S. A Validated Stability Indicating RP-HPLC Method Development for Simultaneous Estimation of Cabotegravir and Rilpivirine in Pharmaceutical Dosage Form. World J. Pharm. Sci. 2022, 10, 22–29. [Google Scholar] [CrossRef]
  14. Haque, M.A.; Bakshi, V.; Thippani, M.; Manda, R.M.; Boggula, N. Development and Validation of UV Spectrophotometric method for the determination of Dolutegravir by using Quality by Design (QbD) Approach. J. Adv. Sci. Res. 2021, 12 (Suppl. 1), 113–119. [Google Scholar] [CrossRef]
  15. Mutalik, S.P.; Mullick, P.; Pandey, A.; Kulkarni, S.S.; Mutalik, S. Box–Behnken design aided optimization and validation of developed reverse phase HPLC analytical method for simultaneous quantification of dolutegravir sodium and lamivudine co-loaded in nano-liposomes. J. Sep. Sci. 2021, 44, 2917–2931. [Google Scholar] [CrossRef]
  16. Alossaimi, M.A.; El Gamal, R.M.; Altharawi, A.; Abbas, M. An eco-friendly, selective, and sensitive spectrofluorimetric method for the quantification of Dolutegravir in its bulk and tablet dosage form. Spectrochim. Acta Part A Mol. Biomol. Spectrosc. 2022, 273, 121035. [Google Scholar] [CrossRef]
  17. Allahverdiyeva, S.; Pınar, P.T.; Yardım, Y.; Şentürk, Z. First report for the electrochemical investigation of a new HIV integrase inhibitor dolutegravir: Its voltammetric determination in tablet dosage forms and human urine using a boron-doped diamond electrode. Diam. Relat. Mater. 2021, 114, 108332. [Google Scholar] [CrossRef]
  18. Cozzi, V.; Charbe, N.; Baldelli, S.; Castoldi, S.; Atzori, C.; Cattaneo, D.; Clementi, E. Development and validation of a chromatographic ultraviolet method for the simultaneous quantification of dolutegravir and rilpivirine in human plasma. Ther. Drug Monit. 2016, 38, 407–413. [Google Scholar] [CrossRef]
  19. Rao, P.V.; Rao, N.S. A new analytical method for determination of dolutegravir and rilpivirine in pharmaceutical formulations by RP-HPLC method. Int. J. Res. Pharm. Chem. Anal. 2019, 1, 68–74. [Google Scholar]
  20. John, C.; Chainulu, C.; Ghosh, P.; Srivastava, S.; Shukla, S.; Satyanarayana, S. Validated High Performance Thin Layer Chromatography Method for the Simultaneous Determination of Amitriptyline, Atenolol and Propranolol. Asian J. Res. Chem. 2011, 4, 1059–1063. [Google Scholar]
  21. Peraman, R.; Bhadraya, K.; Padmanabha Reddy, Y. Analytical quality by design: A tool for regulatory flexibility and robust analytics. Int. J. Anal. Chem. 2015, 2015, 868727. [Google Scholar] [CrossRef]
  22. Beg, S.; Sharma, G.; Katare, O.P.; Lohan, S.; Singh, B. Development and Validation of a Stability-Indicating Liquid Chromatographic Method for Estimating Olmesartan Medoxomil Using Quality by Design. J. Chromatogr. Sci. 2015, 53, 1048–1059. [Google Scholar] [CrossRef]
  23. Parab, G.V.; Mannur, V.K.; Hullatti, K. Quality assessment and Analytical Quality by Design-based RP-HPLC method development for quantification of Piperine in Piper nigrum L. Future J. Pharm. Sci. 2022, 8, 16. [Google Scholar] [CrossRef]
  24. Panda, S.S.; Bera, R.K.; Beg, S.; Mandal, O. Analytical Quality by Design (AQbD)-Oriented RP-UFLC Method for Quantification of Lansoprazole with Superior Method Robustness. J. Liq. Chromatogr. Rel. Technol. 2017, 40, 479–485. [Google Scholar] [CrossRef]
  25. Khalid, M.; Ahmad, S. Box–Behnken Design Used to Optimize the Simultaneous Quantification of Amitriptyline and Propranolol in Tablet Dosages by RP-HPLC-DAD Method and Their Stability Tests. Separations 2022, 9, 421. [Google Scholar] [CrossRef]
  26. ICH Guideline. Validation of analytical procedures: Text and methodology. In Proceedings of the International Conference on Harmonization, Topic Q2 (R1), Geneva, Switzerland, 1–13 November 2005. [Google Scholar]
  27. FDA; CDER; Beers, D. Analytical Procedures and Methods Validation for Drugs and Biologics Guidance for Industry; FDA: Silver Spring, MD, USA, 2015. [Google Scholar]
  28. Mittal, A.; Parmar, S.; Gilani, S.J.; Imam, S.S.; Taleuzzaman, M. Optimization and Validation for Simultaneous Estimation of Citicoline and Piracetam in Bulk and Tablet Formulations Using RP-HPLC Method: Analytical Quality by Design Approach. Asian J. Research Chem. 2017, 10, 198–205. [Google Scholar] [CrossRef]
  29. ICH Guidelines. Q1A (R2): Stability Testing of New Drug Substances and Products (Revision 2), International Conference on Harmonization. 2003. Available online: http://www.fda.gov/downloads/RegulatoryInformation/Guidances/ucm128204.pdf (accessed on 30 January 2023).
Figure 1. The chemical structure of rilpivirine (RLVN) and dolutegravir (DTGR).
Separations 10 00185 g001
Figure 2. Linearity of RLVN (6.25–37.5 µg/mL) and DTGR (12.5–75 µg/mL).
Separations 10 00185 g002
Figure 3. Value of retention time of RLVN in color points; green color is optimized value.
Separations 10 00185 g003
Figure 4. Retention times of the BBD trials and inbuilt 3D surface design points of RLVN.
Separations 10 00185 g004
Figure 5. Value of theoretical plate number of RLVN in color points; green color is optimized value.
Separations 10 00185 g005
Figure 6. Theoretical plate of the BBD trials and inbuilt 3D surface design points of RLVN.
Separations 10 00185 g006
Figure 7. Value of retention time of DTGR in color points; green color is optimized value.
Separations 10 00185 g007
Figure 8. Retention times of BBD trials and inbuilt 3-D surface design points of DTGR.
Separations 10 00185 g008
Figure 9. Value of theoretical plate number of DTGR in color points; green color is optimized value.
Separations 10 00185 g009
Figure 10. Theoretical plate of BBD trials and inbuilt 3D surface design points of DTGR.
Separations 10 00185 g010
Figure 11. Chromatogram of standard, blank, and placebo.
Separations 10 00185 g011
Figure 12. Chromatogram of degradation studies in acid (A) and alkali (B) conditions.
Separations 10 00185 g012
Figure 13. Chromatogram of degradation studies in dry heat (A) and photo stability (B) conditions.
Separations 10 00185 g013
Figure 14. Chromatogram of degradation studies in neutral (A) and oxidation (B) conditions.
Separations 10 00185 g014
Table 1. Box–Behnken design summary.
S. No.F1F2F3R1R2R3R4
1390.92592.14530722.5995482
2430.92582.18631792.6795467
3371.22612.19231542.8995555
4411.22592.18231942.7815672
5370.92582.13531222.8485313
6451.12582.14731122.4585396
7361.22622.14331722.8585447
8430.92582.19831752.7215456
9420.82581.98530022.7915478
10370.92612.18930712.3565475
11420.82622.12931872.5915494
12371.22621.97530752.8865454
13 *4012602.16730922.7165484
14 *4012602.16730922.7165484
15 *4012602.16730922.7165484
16 *4012602.16730922.7165484
17 *4012602.16730922.7165484
(F1 = %ACN, F2 = flow rate, F3 = ʎmax, R1 = retention time of RLVN, R2 = plate no. of RLVN, R3 = retention time for DTGR and R4 = plate no. for DTGR). * = Factors and response value are same.
Table 2. Calibration curve details.
RLVNDTGR
Linearity range (µg/mL)6.25–37.512.5–75
Calibration curve equationy = 13,776x + 6429.4y = 14,212x + 10,001
Correlation coefficient (R)0.99930.9999
Determination coefficient (R2)0.99870.9999
LOD (µg/mL)0.451.27
LOQ (µg/mL)1.373.86
Table 3. Model summary statistics and lack-of-fit test.
Dependent VariableStd. Dev.R2Adjusted R2Predicted R2F-Valuep-ValueSequential p-ValueSource
RLVNRT0.00590.99460.99180.81135.860.0489<0.0001Quadratic
Plate number2.740.99880.99730.926813.970.0090<0.0001Quadratic
DTGRRT0.00650.99550.98970.79127.610.0304<0.0001Quadratic
Plate number6.270.99660.99210.80878.890.0226<0.0001Quadratic
Table 4. System suitability test.
RLVNDTGR
S. No.SamplePlate CountTailing FactorResolutionPlate CountTailing FactorResolution
1STD-131151.34NA55871.313.5
2STD-230601.35NA55951.323.4
3STD-330911.36NA54871.313.4
4STD-431451.36NA55171.333.4
5STD-530781.35NA54951.343.5
6STD-631981.34NA55981.313.5
AVG3114.51.35 5546.51.323.45
SD46.110.01 47.800.010.05
%RSD1.480.60 0.860.871.45
Calibration curve, LOD, and LOQ.
Table 5. Precision studies.
Precision
RLVN DTGR
QC SamplesIntradayInter-Day IntradayInter-Day
SD%RSDSD%RSD SD%RSDSD%RSD
LQC (6.25 µg/mL)549.280.63201.220.23LQC (12.5 µg/mL)596.450.32596.450.32
MQC (25 µg/mL)99.970.03230.70.06MQC (50 µg/mL)682.380.09682.320.09
HQC (37.5 µg/mL)1168.620.2246.550.01HQC (75 µg/mL)7976.220.741814.180.17
Table 6. Accuracy of the developed method.
RLVNDTGR
% Excess Drug Added Avg.% RecoveredSD%RSDAvg.% RecoveredSD%RSD
0100.520.940.93101.510.980.97
50101.020.640.63101.280.690.69
10099.950.680.68100.941.121.11
150100.620.270.26100.611.041.03
Table 7. Robustness of the developed method.
RLVNDTGR
Mean AreaSD%RSDMean AreaSD%RSD
Flow rate at 0.9 mL min−1357,324.5285.430.08728,369848.530.12
Flow rate at 1.1 mL min−1357,416.7233.090.07727,869787.40.11
0.1%OPA (38%) + ACN (62%)357,226275.420.08728,769989.950.14
0.1%OPA (42%) + ACN (58%)357,382.7416.970.12727,802.3956.850.13
Wavelength 258 nm357,492.7458.930.13728,535.71053.040.14
Wavelength 262 nm357,716883.730.25727,7691349.070.19
Table 8. Forced degradation studies.
%Degradation of RLVN%Degradation of DTGR
Acid degradation studies5.965.67
Alkali degradation studies4.794.44
Dry heat degradation studies3.274.09
Photo stability studies2.361.81
Neutral degradation studies0.990.43
Oxidation4.354.28
Disclaimer/Publisher’s Note: The statements, opinions and data contained in all publications are solely those of the individual author(s) and contributor(s) and not of MDPI and/or the editor(s). MDPI and/or the editor(s) disclaim responsibility for any injury to people or property resulting from any ideas, methods, instructions or products referred to in the content.

