Article

Development and Validation of UPLC–MS/MS Method for Quantitative Analysis of 5-Fluorouracil in Aqueous Humor of Rabbits

by
Mohd Abul Kalam
1,†,
Sulaiman S. Alhudaithi
1,†,
Adel Ali Alhowyan
1,
Muzaffar Iqbal
2,
Mohammad Raish
1,
Abdullah K. Alshememry
1,
Musaed Alkholief
1,
Aliyah A. Almomen
2 and
Aws Alshamsan
1,*
1
Department of Pharmaceutics, College of Pharmacy, King Saud University, Riyadh 11451, Saudi Arabia
2
Department of Pharmaceutical Chemistry, College of Pharmacy, King Saud University, Riyadh 11451, Saudi Arabia
*
Author to whom correspondence should be addressed.
These authors contributed equally to this work.
Separations 2023, 10(6), 343; https://doi.org/10.3390/separations10060343
Submission received: 18 May 2023 / Revised: 29 May 2023 / Accepted: 30 May 2023 / Published: 2 June 2023

Abstract

:
5-Fluorouracil (5-FU) is now used in eye drops for the management of conjunctival malignant melanoma, intraepithelial neoplasia, and corneal and conjunctival squamous cell carcinoma. The previously used methods for 5-FU quantification in AqH were time-consuming and less sensitive. Herein, a highly perceptive bioanalytical UPLC–MS/MS method was developed for the quantitative determination of 5-FU in the aqueous humor (AqH) of rabbits using allopurinol as the internal standard (IS). The 5-FU and IS were well separated in an Acquity™ HILIC column. Acetonitrile and 10 mM of ammonium acetate at 95:5 (v/v) were isocratically pumped at a 0.3 mL/min flow rate with a total runtime of 2.5 min. AqH samples were processed with a liquid–liquid extraction method in ethyl acetate. The 5-FU and IS were identified in the negative mode with electrospray ionization. The parent to daughter ion transitions for the 5-FU and IS occurred at m/z 128.92→41.68 and 134.80→64.10, respectively, as quantified using the multiple reaction monitoring mode. The developed method was validated with the ICH-Harmonized Guideline for Bioanalytical Method Validation, and the parameters were within acceptable limits. The calibration curve was linear at the 10.5–2000 ng/mL concentration range, with a correlation coefficient (R2) of 0.9946, and the lower limit of detection was 3.55 ng/mL. The developed and validated method was rapid, sensitive, accurate and robustly able to quantify 5-FU in rabbit AqH. The method was effectively applied to establish the ocular pharmacokinetics of 5-FU following the topical instillation of 5-FU-containing preparations in rabbits.

1. Introduction

The IUPAC name of 5-fluorouracil (5-FU) is 5-fluoro-1H-pyrimidine-2,4-dione (Figure 1a). It is an antimetabolitic, cytotoxic chemotherapeutic agent. It is broadly used to treat esophageal, stomach, pancreatic, breast and colorectal cancers through the intravenous route of administration. As a cream or ointment, 5-FU is also applied to treat some skin conditions that may become cancer (solar and multiple actinic keratoses) and some superficial basal cell skin cancers. The inhibition of thymidylate synthase occurs through the formation of a stable ternary complex system, and the incorporation of its metabolites into RNA and DNA exerts anticancer activity to 5-FU [1,2,3]. Co-treatment with methotrexate and leucovorin enhances these anticancer effects [4]. Extemporaneous formulations and solutions of 5-FU as eye drops are used to treat conjunctival malignant melanoma, conjunctival intraepithelial neoplasia, and squamous cell carcinoma of the cornea and conjunctiva, among others [5,6]. Treatment for these disorders entails applying topical 5-FU (1%, w/v) up to four times daily for a number of treatment cycles spaced out by one month. However, a lesion might re-occur, and retreatment might be needed even after an excisional biopsy; therefore, prolonged follow-up might be requisite for such patients [5,7,8]. Generally, the solutions and extemporaneous formulations of 5-FU are stable for up to 7 days, with only limited bioavailability [9].
A mucoadhesive nanocarrier called an amino-functionalized mesoporous silica nanoparticle (AMSN) encapsulated with 5-FU was prepared in a previous study, and its surface was further functionalized with carboxy methyl chitosan (CMC), which was then combined with Carbopol gel to increase the bioavailability of 5-FU in the eyes [10]. An AMSN has hydroxyl (-OH) and amine (-RNH2) functional groups; the -OH groups form H-bonds with the mucin layer (negatively charged) on ocular mucosa and positively charged amino groups form an ionic complex with the mucin layer. Both of these phenomena could enhance the ocular retention of these formulations, sustain the release of 5-FU in a controlled way, increase transcorneal permeation, and improve the ocular availability of 5-FU.
To ensure the efficacy of 5-FU in the abovementioned eye conditions, the drug concentrations in eye structures must be determined. Accordingly, this study used anterior chamber fluid (for easy sampling and drug analysis purposes) and developed an ultra-performance liquid chromatography mass spectrometry (UPLC–MS/MS) method for the quantification of 5-FU in the aqueous humor (AqH) of rabbits.
A number of HPLC methods are available for the quantification of 5-FU in simulated colon media [11], biological fluids such as blood plasma [12,13,14], and aqueous humor [15,16]. An LC–MS/MS method for 5-FU determination is available, but this is for analytical purposes only, not bioanalysis [17]. Most of the available analytical/bioanalytical methods for 5-FU are used to identify the drug in plasma where adequately high sample volumes are needed. Until now, no rapid, sensitive, and reliable bioanalytical UPLC–MS/MS techniques for 5-FU quantification in AqH have been available. The available LC methods for 5-FU determination in AqH are either time-consuming, require high retention times (i.e., 7 min [12]), or are less sensitive due to a high limit of detection (5 ng/mL) [14].
As the drug amounts reached in the AqH remain low by default (due to the anatomy of the eye and strong defensive, physiological ocular barriers), their quantification with common bioanalytical methods is challenging. Therefore, in this study, for the quantification of 5-FU (even in very small quantities of AqH), a sensitive, repeatable, robust, and consistent UPLC–MS/MS method was developed and validated using allopurinol as the internal standard (Figure 1b) [18]. This validated method was successfully applied in the quantitative analysis of 5-FU in AqH after the topical ocular application of 5-FU-containing preparations in rabbits to establish the ocular pharmacokinetics of the drug.

2. Experimental Section

2.1. Chemicals and Animals

5-Fluorouracil (5-FU) powder of ≥99% purity, allopurinol of ≥98% purity, ammonium–acetate (CH3CO2NH4; MW: 77.08 g/mol; CAS No. 631-61-8) and ethyl acetate (CH3COOC2H5; MW: 88.11 g/mol; CAS No.141-78-6) were purchased from Sigma Aldrich (St. Louis, MO, USA), now owned by Merck KGaA (Darmstadt, Germany). Chemically, 5-FU (C4H3FN2O2; MW: 130.08 g/mol) is 2,4-Dihydroxy-5-fluoropyrimidine (CAS No. 51-21-8) and allopurinol (C5H4N4O; MW: 136.11 g/mol) is 1H-Pyrazolo (3,4-d) pyrimidin-4-ol, 4-Hydroxypyrazolo (3,4-) pyrimidine (CAS No. 315-30-0). Methanol and acetonitrile of HPLC grade were purchased from HiPer-Solv® (Poole, England). Purified water was obtained in house with a Milli-Q® water purifier (Millipore, Paris, France). All other solvents and chemicals were of HPLC and analytical grade, respectively.
To ascertain the ocular bioavailability of 5-FU, we obtained New Zealand albino rabbits (2–3 kg in body weight) from the Animal Care and Use Center of the College of Pharmacy at King Saud University (KSU), Riyadh, Saudi Arabia. The research ethics committee (REC) at KSU approved the protocol that was followed during the animal study (protocol approval number: SE-21-80; 9 December 2021). Following the Guide for the Care and Use of Laboratory Animals, the animals were permitted to reside in air-conditioned, light-controlled rooms. All of the rabbits were fed a regular pellet diet and were given access to unlimited amounts of water.

2.2. Mass Spectrometric and Chromatographic Conditions

A triple quadrupole mass spectrometer (TQD) with an electrospray ionization interface for the simultaneous detection of 5-FU and allopurinol was used in the negative mode. Nitrogen (N2) was used as the desolvation and cone gas, and argon served as the collision gas. The TQD settings were as follows: 150 °C for the source, 350 °C for the desolvation, 0.93 kV for the capillary voltage, 0.245 s for the dwell period, 600 L/h for the desolvation gas, 50 L/h for the cone gas, and 0.2 mL/min for the collision gas. Cone voltages of 32 V and 40 V for 5-FU and allopurinol (IS), respectively, were set as the MS/MS conditions. The collision energies were 14 and 20 eV for 5-FU and allopurinol (IS), respectively. The quantification of 5-FU and allopurinol, which had parent-to-daughter ion transitions (m/z) of 128.92→41.68 and 134.80→64.10, respectively, was conducted using the multiple reaction monitoring (MRM) approach. MassLynx software (V4.1, SCN 714, Waters® Corp., Milford, MA, USA) was used to automate the UPLC–MS/MS system, and the Target Lynx program was used to process the data [18].
An Acquity™ UPLC system coupled with a TQD (Waters® Corp., Milford, MA, USA) was used for elution and analysis. An Acquity UPLC BEHTM HILIC column (2.1 i.d. 100 mm, 1.7 m) coupled with a 0.2 m stainless steel fritted filter (Waters® Corp., Milford, MA, USA) was used to achieve the chromatographic separation of 5-FU and allopurinol (IS). The column oven had a temperature of 40 °C. A 95:5 (v/v) combination of acetonitrile and 10 mM ammonium acetate served as the mobile phase. The runtime for the mobile phase was 2.5 min, with a flow rate of 0.3 mL/min and an injection volume of 5 μL. At retention times (Rt) of 1.13 and 1.47 min, respectively, the elutions of 5-FU and allopurinol (IS) were well separated.

2.3. Making Stock Solutions, Calibration Standards, and Quality Control Samples

A standard stock solution of 5-FU (500 μg/mL) was prepared by dissolving a precisely weighed quantity of 5-FU in ethanol. A stock solution of the IS (500 μg/mL) was prepared by dissolving the allopurinol in ethyl acetate. In order to prepare the working calibration samples (10.5, 300, 900, 1750, 3500, 7000, 14,000, and 20,000 ng/mL), the standard stock solution of 5-FU was further diluted with ethanol. Among these working calibration samples, a few dilutions (105, 300, 3500 and 14,000 ng/mL) were selected as the standard working quality control (QC) samples. The working IS solution (1000 ng/mL) was prepared from its stock solution via dilution with ethyl acetate. The aqueous humor (AqH) samples used for the calibration curve were prepared by spiking appropriate volumes of the working calibration samples into AqH to obtain the final AqH calibration samples at concentrations of 10.5, 30, 90, 175, 350, 700, 1400, and 2000 ng/mL. The selected calibration standard samples that served as the working quality control (QC) samples were 10.5 ng/mL (low limit of quantitation, LLOQ), 30 ng/mL (low-quality control, LQC), 350 ng/mL (medium-quality control, MQC) and 1400 ng/mL (high-quality control, HQC). All calibration standards and prepared QC samples were stored at −80 °C until analysis.

2.4. Aqueous Humor (AqH) Sample Preparations

The working IS solution (1000 ng/mL of allopurinol, IS) and 100 μL of ethyl acetate were added to the 25 μL AqH samples, mixed, and vortexed for 30 s in Eppendorf tubes. Thereafter, all samples were centrifuged for 10 min at 13,500 rpm and 4 °C. After centrifugation, the supernatant (organic layer) was placed into different fresh Eppendorf tubes and dried under a nitrogen (N2) stream at ambient temperature. The N2-dried samples were reconstituted in a 100 μL 95:5 (v/v) mixture of acetonitrile:10 mM ammonium acetate and placed into UPLC vials. Then, for the quantification of 5-FU, the reconstituted samples (5 μL) were automatically injected into the UPLC–MS/MS apparatus.

2.5. Development and Validation of Method

The bioanalytical UPLC–MS/MS method used to analyze 5-FU in the AqH was developed and validated by following the ICH-Harmonized Guideline for Bioanalytical Method Validation and Study Sample Analyses [19]. The validation parameters were linearity, selectivity, accuracy, precision, robustness, recovery, the stability of the samples, and matrix effects.

2.5.1. Calibration Curve and Limits of Detection (LOD) and Quantitation (LOQ)

By processing the calibration curves using the least squares linear regression approach, the linearity of this method was examined. The concentration levels for the three sets of calibration samples were 10.5, 30, 90, 175, 350, 700, 1400, and 2000 ng/mL in blank AqH. The calibration curves were prepared by plotting the different concentrations of 5-FU on the x axis against the 5-FU/IS area ratios on the y axis. As a function of weighing factor optimization, weighing factors (W)—none, 1/X, and 1/X2—were used to approximate any deviation in the studied concentration levels. Additionally, for each calibration curve, the sum of squares (SS), correlation coefficient (R2), sum of absolute values, and percentage of relative error (% RE) statistical parameters were calculated. In order to compare the back-calculated concentrations estimated using the regression equation obtained for each weighing factor (W), the % RE was further plotted against the studied concentrations. The best W is the one that has the smallest total % RE and results in a small band of randomly distributed % RE around the x axis. W was additionally chosen based on the R2 value that was closest to 1 and the smallest value of SS.
The lowest concentration (LOD) at which the analytical method is able to detect an analyte of interest and the limit of quantitation (LOQ) were calculated as per the work of Hartmann et al. [20] following Equations (1) and (2), respectively:
L O D = 3.3 σ S
L O Q = 10 σ S
where “σ” and “S” are the standard deviation of the response and the slope of the calibration curve, respectively.

2.5.2. Selectivity

In the presence of wanted or unwanted components, a chosen analytical method should be able to unequivocally measure the concentration of the analytes, which is termed the selectivity of a method. By comparing the chromatograms generated from the aspirated rabbit AqH samples after 2 h of treatment with the 5-FU-containing formulations with those generated from the blank AqH, the spiked AqH samples at the LLOQ level (10.5 ng/mL), and the spiked AqH samples with the IS (250 ng/mL), the selectivity of the current UPLC–MS/MS method was confirmed. The retention times (Rt) of the 5-FU and IS were then monitored for any interventions occurring at or close to those times.

2.5.3. Precision, Accuracy and Robustness

The percentage relative standard deviation (% RSD) and percentage relative error (% RE) of the theoretical concentrations, respectively, were used to evaluate the precision and accuracy of the devised approach. To determine the precision and accuracy of this method, quality control (QC) samples such as 10.5 ng/mL (LLOQ), 30 ng/mL (LQC), 350 ng/mL (MQC) and 1400 ng/mL (HQC) were analyzed in triplicate using the obtained calibration curve on different days (interday) and the same day (intraday). Deviances in the values of precision (% RSD) and accuracy (% RE) were presumed to be ≤15% for the QC samples except for 10.5 ng/mL (LLOQ, where it was assumed to be ±20%). To analyze the MQC sample (350 ng/mL), the isocratic flow rate of the mobile phase (0.30 ± 0.02 mL/min) and slight purposeful changes in the ratio of the mobile phase composition (95: 5 ± 2, v/v) were used to test the robustness of the method. The deviance in the % RSD was presumed to be ≤10% for the purpose of checking the robustness of the method.

2.5.4. Recovery

First, 25 μL of pre-spiked LQC (30 ng/mL), MQC (350 ng/mL) and HQC (1400 ng/mL) AqH samples were defrosted, vortexed, spiked with 25 μL of a working allopurinol (IS) solution (1000 ng/mL), and vortexed again for 1 min in Eppendorf tubes. The mixtures were centrifuged at 13,500 rpm for 10 min at 4 °C (pre-extracted sample of AqH, “X”). Subsequently, the supernatant (organic layer) was taken into other fresh Eppendorf tubes and dried under a nitrogen (N2) stream at ambient temperature. The samples (N2-dried) were reconstituted in 100 μL of a 95:5 (v/v) mixture of the mobile phase (post-extracted AqH samples, “Y”) allocated into UPLC vials. Thereafter, 5 μL of these samples were injected into the UPLC–MS/MS apparatus. The ratio of the peak areas of the 5-FU and allopurinol (IS) were noted as “X”. The recovery of 5-FU was determined as the ratio of the peak areas of pre-extracted/post-extracted samples in triplicate, and it is expressed as (X/Y) × 100. In the same way, the recovery of the IS (at 250 ng/mL) was also calculated.

2.5.5. Matrix Effect

A post-extraction method was followed to determine the matrix effect using three concentration levels of the QC solutions in triplicate [21,22]. Briefly, at room temperature, the blank AqH was thawed and vortexed (for 30 s). In Eppendorf tubes, the thawed blank AqH (25 μL) was mixed with 125 μL of ethyl acetate, vortexed, and centrifuged for 10 min at 4 °C and 13,500 rpm. The supernatants were collected in separate tubes, and proper volumes of LQC, MQC, HQC and allopurinol (IS) solutions were added and vortexed (designated as extracted AqH samples), dried under a nitrogen (N2) stream, reconstituted, and analyzed as described above. The ratio of the peak areas of 5-FU and allopurinol (IS) were obtained and termed “X”. Likewise, the working QC and allopurinol (IS) solutions were mixed with Mill-Q water (25 μL) (rather than blank AqH) and 125 μL of ethyl acetate, vortexed, and centrifuged. The rest of the procedures were the same as described above (designated as unextracted AqH samples). Here, the ratio of the peak areas of 5-FU and allopurinol (IS) were termed “Y”. Finally, the absolute matrix effect (%) was estimated with the following expression: (X/Y) × 100.

2.5.6. Stability

The stability of the drug (5-FU) in the spiked AqH samples kept at different storage conditions was determined in triplicate using LLQC (10.5 ng/mL) and HQC (1400 ng/mL) solutions. The processed QC samples were kept in an autosampler for 48 h at 10 °C and analyzed to determine the autosampler stability of the drug. The short-term stability of 5-FU was determined by keeping the processed AqH samples at 25 ± 1 °C for 8 h. The spiked and processed AqH samples were subjected to three freeze–thaw cycles from −80 °C to 25 °C, and the drug was analyzed to determine its freeze–thaw stability. The prolonged stability of the spiked QC samples was determined by analyzing the samples stored for 3 months at −80 °C. The 5-FU in the AqH was supposed to be stable when the % RSD was restricted to ≤15% and the accuracy was limited to ±15% (% RE) relative to that of the theoretical concentrations of the drug.

2.6. Application of the UPLC–MS/MS Method

The developed method was applied to determine the ocular pharmacokinetics of 5-FU in rabbit eyes, in which the concentration of 5-FU in the AqH was determined to assess its ocular availability after the single topical application of 5-FU formulations in the cul-de-sac. Six animals were divided into two groups, each containing three rabbits. Group I was for the 5-FU Carbopol gel, and Group II was for the AMSN-CMC 5-FU Carbopol gel. The development and characterization of these products were previously reported [10]. Forty microliters (40 μL) of the sterilized formulations of 5-FU (each containing an equivalent amount of 100 μg of 5-FU) were topically applied in the eyes (right) of all the rabbits of the two groups [23]. The rabbits were then given an intravenous injection of a mixture of Ketamine hydrochloride and Xylazine (15 and 3 mg/kg of body weight, respectively) 1 h after receiving their dose [10,22,23,24]. Thereafter, approximately 50 μL of the AqH was aspirated using an insulin syringe attached to 29-gauge needle at predetermined time intervals (up to 24 h). The collected AqH samples were stored in a deep freezer, and the quantitation of 5-FU in the collected AqH samples was performed by using the proposed validated method. The real samples were spiked with 25 μL of the working allopurinol (IS) solution (1000 ng/mL) along with the QC and calibration curve samples before being processed as stated in Section 2.4. The processed samples were automatically injected (5 μL each) into the LC–MS apparatus intended for the quantification of 5-FU. A software program called PK-Solver, Nanjing, China, in MS Excel 2013 was used to calculate the pharmacokinetic (PK) parameters through a non-compartmental approach [25]. The PK parameters included the half-life (t1/2), maximum 5-FU concentration in AqH (Cmax), Cmax in AqH at a given time (Tmax), mean residence time (MRT0-inf), maximum 5-FU concentration versus time curve at a given time (AUC0-t and AUC0-inf), and rate of clearance (Cl/F), where “F” stands for the maximum 5-FU availability in the eye. The AUC can be defined as the plasma/AqH drug concentration (ng/mL) × time (h).

2.7. Statistical Analysis of Data

Except where otherwise stated, all data are presented as the average of three readings with standard deviation (SD) or, in some cases, as the mean with the standard error of the mean (SEM). GraphPad Prism: V5.0 (GraphPad Software, Inc., San Diego, CA, USA) was used to generate the statistical analyses and graphs. After determining that p < 0.05 was statistically significant, the results were also compared using the Student’s t-test.

3. Results and Discussion

3.1. Method Development

UPLC–MS/MS is considered one of the best advanced bioanalytical methods for the quantification of drugs in body fluids. The objective of our method development and optimization was to create a sensitive, reproducible, and reliable LC–MS method to analyze 5-FU in aqueous humor (AqH) samples. Therefore, the processes of chromatography and mass spectrometry were carefully and systemically optimized to achieve suitable settings for 5-FU analysis.

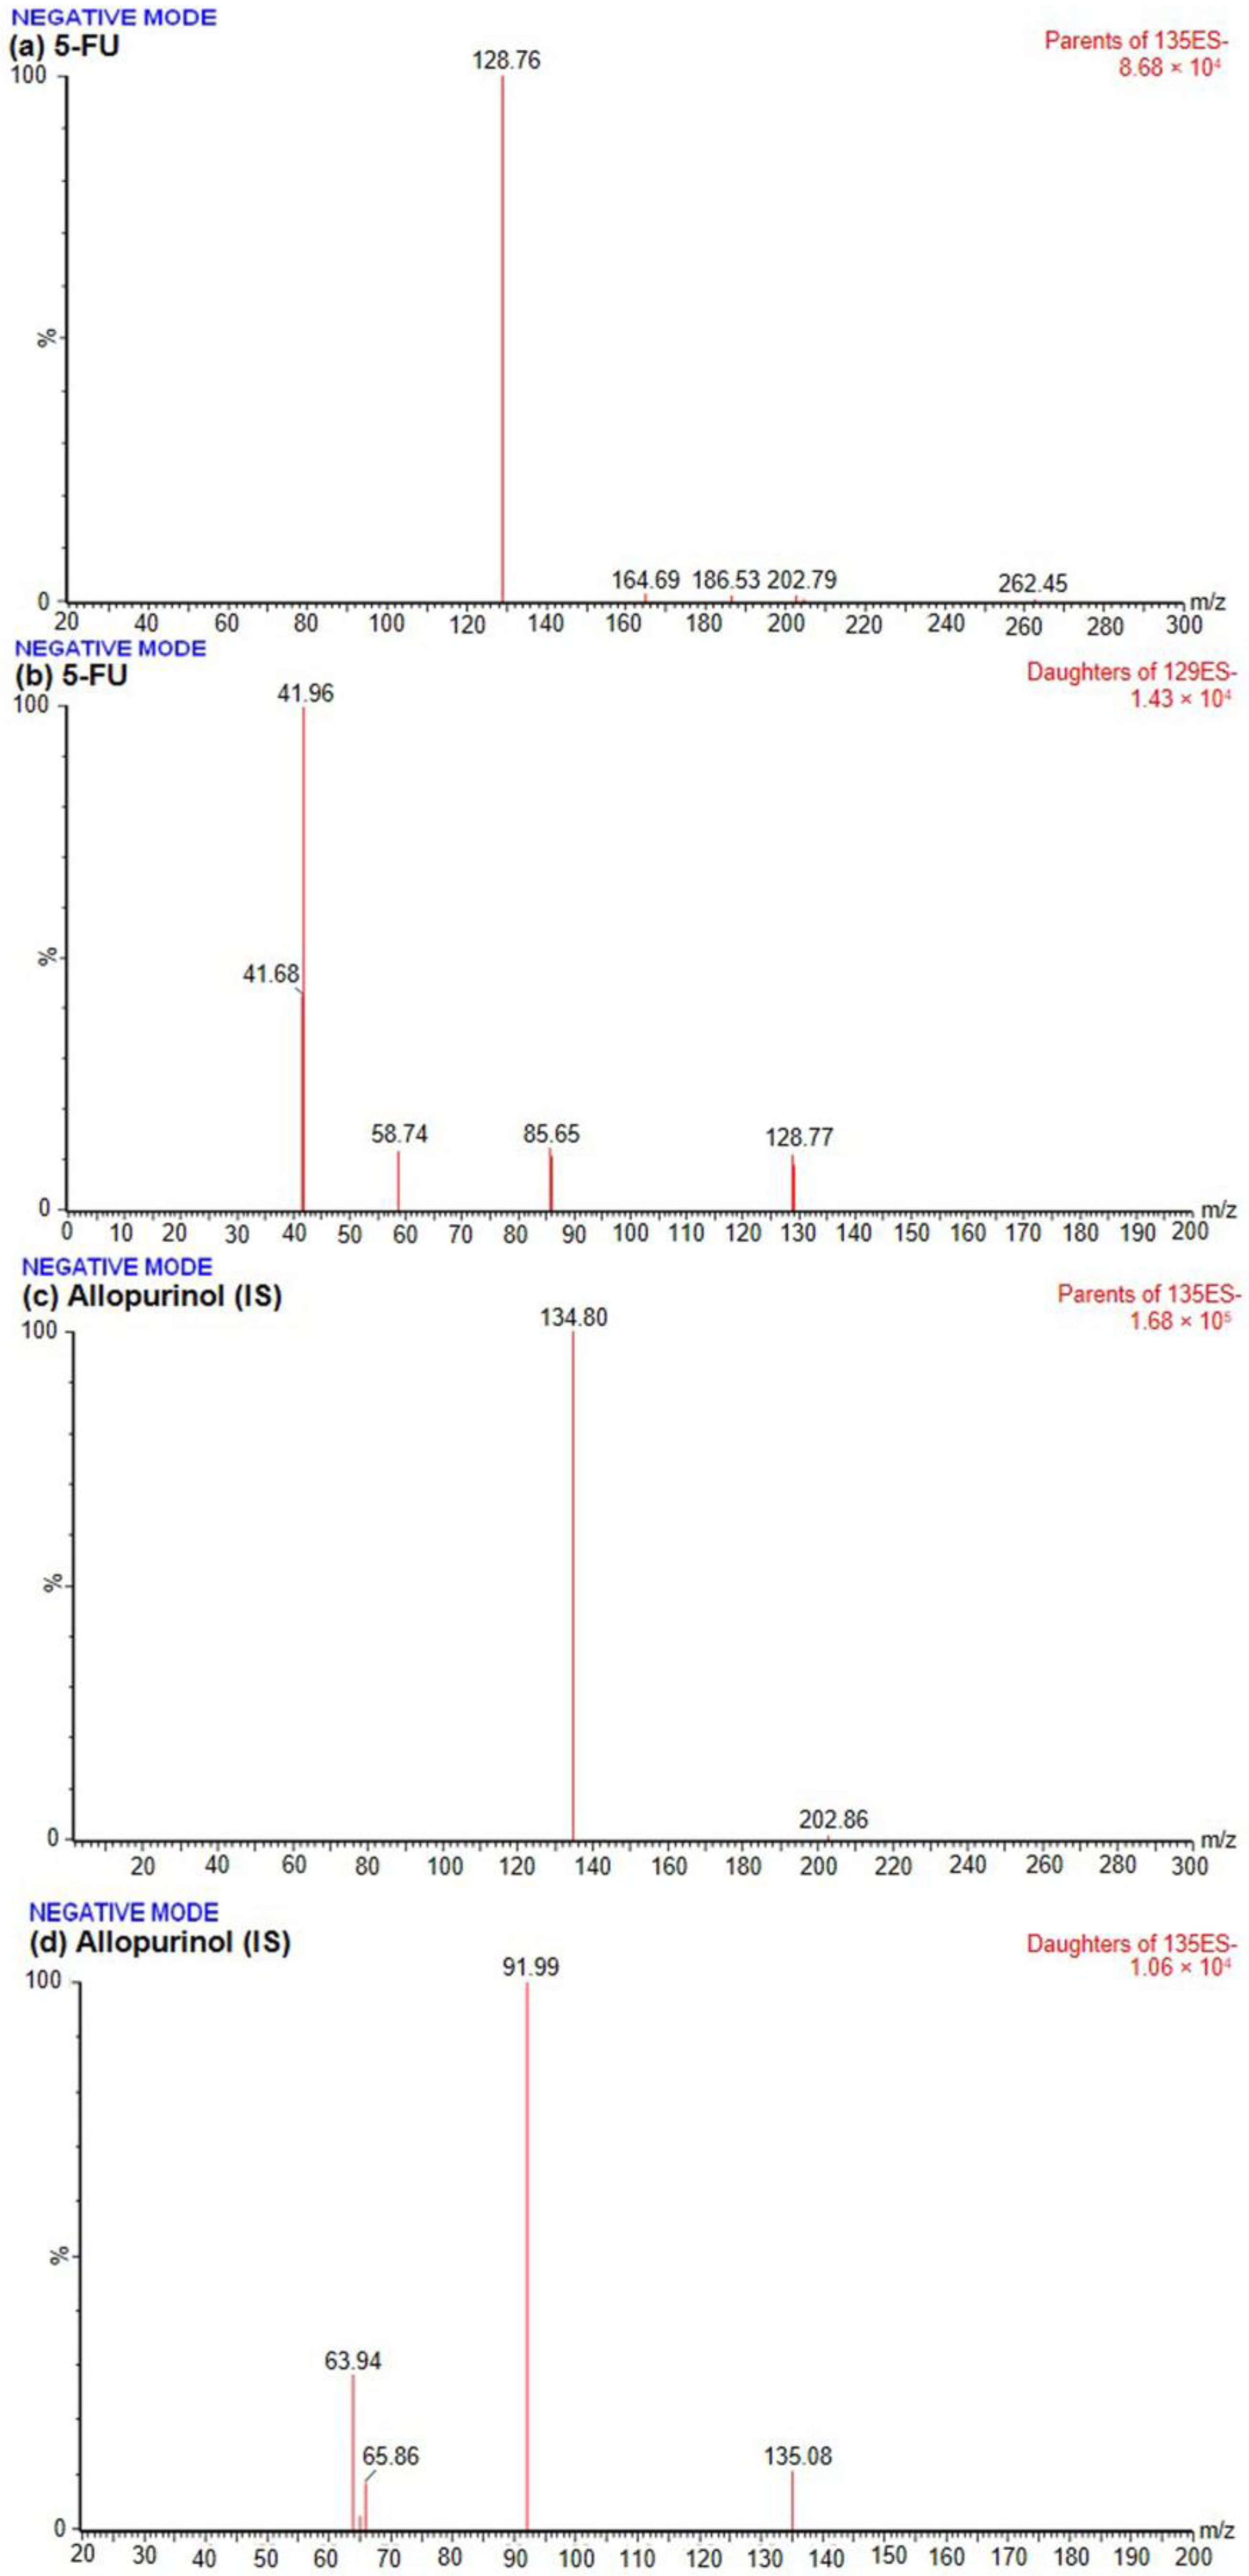
3.2. Optimization of the Conditions of Chromatography and Mass Spectrometry

The conditions for liquid chromatography, such as the aqueous phase (volatile buffer), organic modifiers, components, proportion, and the flow rate of the mobile phase, were optimized to obtain well-separated, regular, symmetric, and highly resolved peaks of the 5-FU and IS. Organic modifiers such as methanol and acetonitrile were isocratically pumped with ammonium–formate, ammonium–acetate, and formic and acetic acids (as volatile buffers) in variable proportions and flow rates (0.2 to 0.5 mL/min). We found that 5-FU and allopurinol were separated well by acetonitrile as the organic phase at a flow rate of 0.3 mL/min. Nobile phase additives in LC–MS/MS separation are used to improve the peak shape and ionization efficiency of analytes. Accordingly, acidic compounds have superior ionization at neutral and slightly basic pH conditions [26,27]. In the present investigation, the target analyte (5-FU) was a weak acid, so it had the potential to produce the most ionization with the 7.8 pH 10 mM ammonium acetate buffer [28,29,30]. The ammonium acetate additive in combination with acetonitrile could have resulted in the high deprotonation of the target molecule. Therefore, ammonium acetate was used to provoke the ionization of the target molecule. Due to the weakly acidic nature of 5-FU, acetonitrile in combination with ammonium–acetate or ammonium–formate led to the greater ionization of 5-FU. Finally, the mobile phase selected for the chromatographic separation of the 5-FU and IS consisted of acetonitrile: 10 mM ammonium acetate (95:5, v/v) at a 0.3 mL/min flow rate, which was used with minimal intervention due to the endogenous materials present in the AqH. Due to the polar nature of 5-FU, analytical columns of different sizes (50 mm and 100 mm) were used, and the best elution and separation of 5-FU and allopurinol (IS) were found with the UPLC HILIC column (Acquity™, 2.1 mm of i.d. × 100 mm, 1.7 μm) at a 40 °C column oven temperature. The special separation materials of the HILIC column showed good selectivity and reproducibility for the separation of polar compounds, so they were selected for the separation of 5-FU in the present work.
A methanolic solution of 5-FU (300 ng/mL) was permeated in the mass spectrometer to tune in the negative and positive electrospray ionization modes in order to optimize the mass spectrometry (MS) parameters. Being weakly acidic in nature, the signal intensity of the 5-FU parent molecular ion was most intense at m/z 128.76 in the negative mode compared with the positive mode (Figure 2a). Consequently, the 5-FU parent ion (m/z of 128.76) produced different daughter ions at m/z values of 128.77, 85.65, 58.74, 41.96 and 41.68, as shown in Figure 2b. Among these, the signal for daughter ion with an m/z of 41.96 was the most prominent, abundant, stable and reproducible. Therefore, it was selected for the multiple reaction monitoring (MRM) transition. In the same way, for allopurinol, the parent ion with an m/z of 134.80 produced more signal intensity during negative mode ionization (Figure 2c). The parent ion of the IS at an m/z of 138.40 produced a more abundant and prominent daughter ion, with an m/z of 91.99, but it was not stable. Therefore, the other daughter ion of m/z 64.1 was selected for MRM transitions, as shown in Figure 2d. As a result, the m/z values of 128.76→41.68 and 134.80→64.10 for 5-FU and allopurinol (IS), respectively, were utilized for the conversion of parent ions into daughter ions. Additionally, the temperature, gas, and compound-specific parameters (for instance, 30–40 V cone voltages and 12–20 eV of collision energy) were optimized to have the lowest quantifiable limits. Finally, the cone voltages for the 5-FU and IS were fixed at 32 V and 40 V, respectively, and the collision energies were set at 14 eV and 20 eV for the 5-FU and IS, respectively.

3.3. Sample Preparation Optimization

In order to obtain tidy and clean samples, the sample preparation technique was adjusted. This prevented any unintentional potential interference from endogenous substances/chemicals in the AqH from being found during the process of UPLC–MS/MS analysis. Initially, the acetonitrile- and methanol-based direct protein precipitation method was used to prepare the samples, but no intense and sensitive 5-FU and IS peaks were discovered when the AqH samples were analyzed (Figure S1a,b). Therefore, the liquid–liquid extraction method was used with various amounts of AqH in ethyl acetate, n-hexane, diethyl ether, and dichloromethane (DCM) as organic solvents for sensitivity and effectiveness with good recovery and low matrix effects. Of these, ethyl acetate produced high recovery and low matrix effects, so it was used as the extracting agent for sample preparation (Figure S2). After the complete evaporation and drying (with the N2 stream) of the organic solvents, the samples were reconstituted in the 95:5 (v/v) mixture of the mobile phase (acetonitrile: 10 mM ammonium acetate) for analysis. The 5:1 (v/v) ratio of ethyl acetate and AqH was found to be the most effective for complete 5-FU extraction from AqH samples spiked with allopurinol (IS), with a high sensitivity, maximum recovery, and negligible matrix effects without any significant intervention for 5-FU and allopurinol (IS) elution and chromatographic separation.

3.4. Method Validation

3.4.1. Calibration Curve, Linearity, and Limits of Detection and Quantification
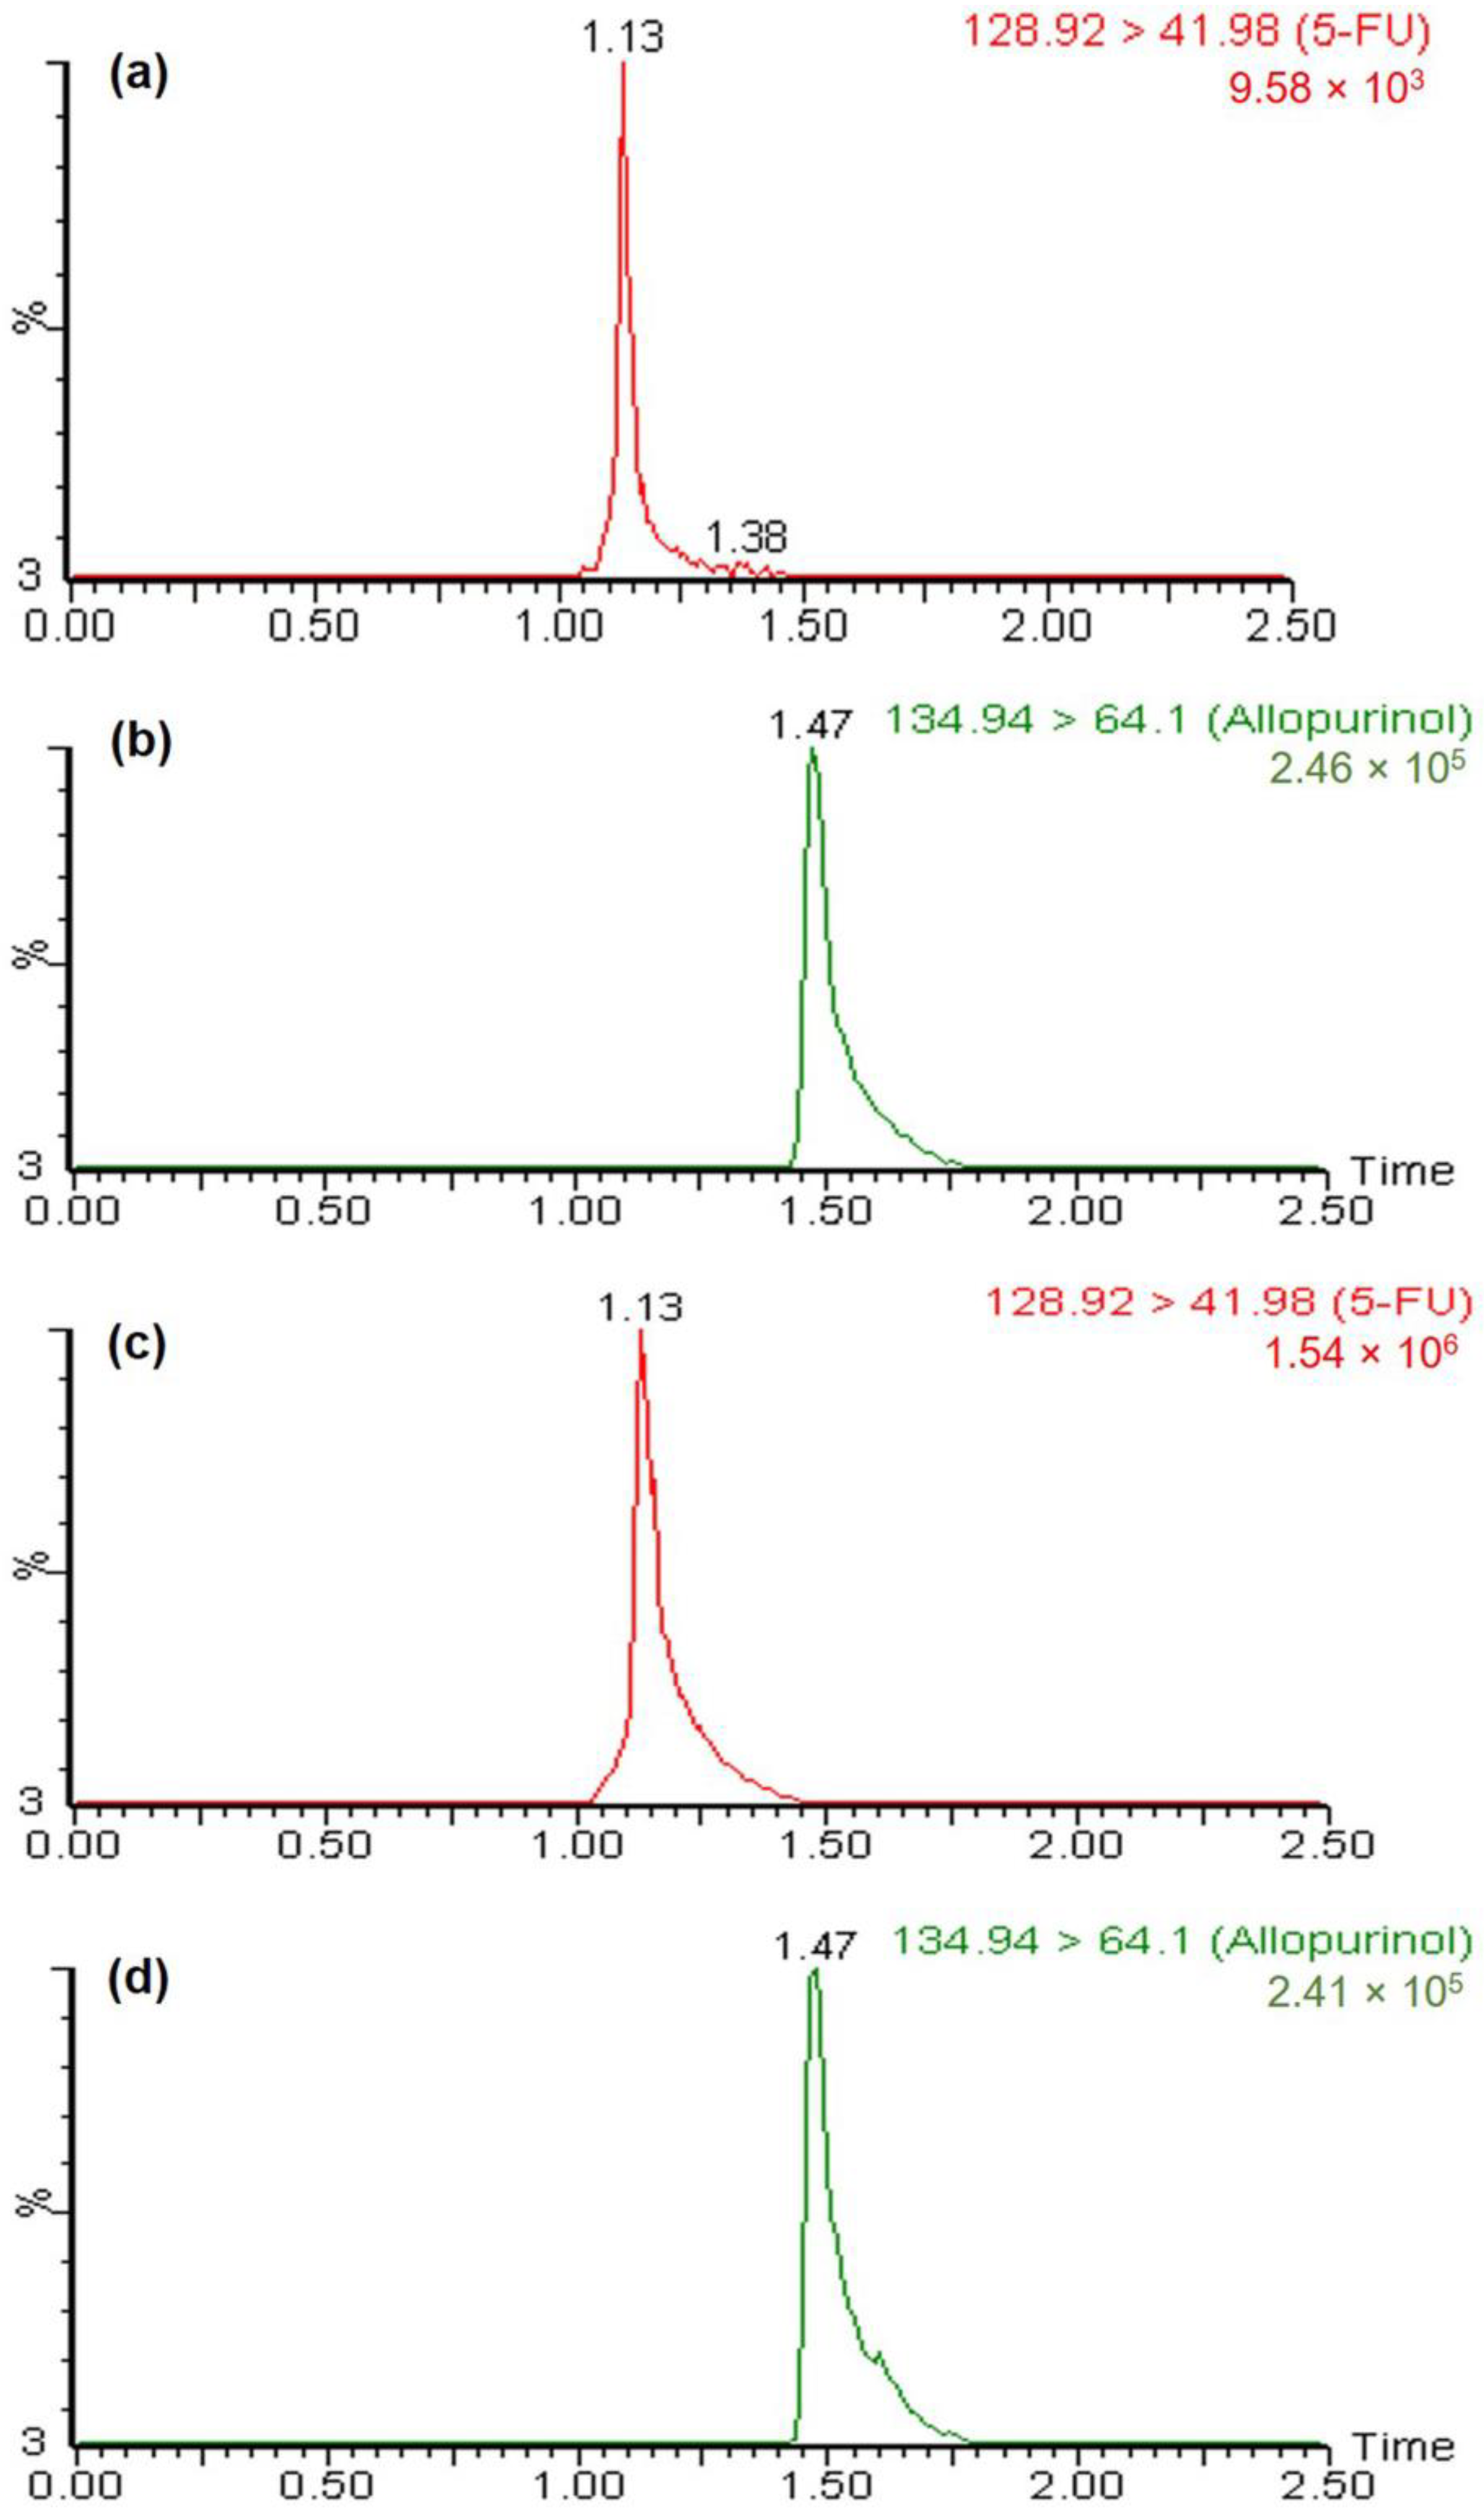
To obtain calibration curves, the ratios of the peak regions of the mass spectra of allopurinol (IS) and 5-FU were plotted against the concentrations of 5-FU on the x axis. At concentration levels from 10.5 ng/mL to 2000 ng/mL, the calibration curves showed excellent linearity, as indicated by the values obtained for the parameters (Table 1). The weighted least squares (1/X2) method was used to perform linear regression to obtain the linear equation (y = mx + c). The slopes of the calibration curves did not show any significant (p < 0.05) differences. The obtained linear equation was y = (1.667 ± 0.121) × 10−3x+ (3.096 ± 0.104) × 10−2, with a correlation coefficient (R2) of 0.9946 ± 0.0023. Here, “x” represents the 5-FU concentration in the AqH and “y” represents the ratio of the 5-FU and IS peak regions. The slope, intercept, and coefficient of correlation had percentage relative standard deviations (% RSD) and standard errors of means (SEM) of 12.49% and 0.121 × 10⁻³, 5.8% and 0.104 × 10⁻², and 0.4% and 0.23 × 10⁻³, respectively.

3.4.2. Selectivity

Figure 3a,b show typical chromatograms of the blank AqH for 5-FU and allopurinol (IS), respectively. Representative chromatograms of AqH spiked with 10.5 ng/mL of 5-FU (LLOQ) and 250 ng/mL of allopurinol (IS) are shown in Figure 4a,b, respectively. Typical chromatograms of the AqH samples taken from the treated rabbit eyes 2 h after the instillation of the AMSN-CMC 5-FU Carbopol gel are shown in Figure 4c (for 5-FU) and Figure 4d (for the IS). The chromatograms in Figure 4c,d show that the peaks of 5-FU and allopurinol (IS) were symmetrical in their shape and time of elution. The retention times (Rt) were 1.13 min and 1.47 min for 5-FU and allopurinol (IS), respectively, when the runtime was 2.5 min. Since the calculated void volume and dead time for the used column were 0.24 mL and 0.81 min, respectively, the abovementioned retention time was sufficient for the separation of the analyte and matrix. The developed UPLC–MS/MS method was very selective, as evidenced by the absence of any noise or interfering peak during the analysis (due to the matrix or any endogenous chemicals, metabolites, or formulation ingredients).

3.4.3. Precision, Accuracy and Robustness

Table 2 provides an overview of the precision (intraday and interday), recovery, and accuracy of the 5-FU measurements at various concentrations of the QC samples (10.5, 30, 350, and 1400 ng/mL) in rabbit AqH. The percentage recovery ranged from 93.07% to 101.24%, the precision (intraday) ranged from 0.48% to 8.68%, and the accuracy (as percentage relative error, % RSD) ranged from −6.93% to 1.25%. In the same way, the precision (interday) in terms of % RSD was in the range of 0.69% to 6.63%. The percentage recovery ranged from 90.88% to 98.52%, and the accuracy in terms of percentage relative error (% RE) ranged from −9.12% to −1.48%. The changes in these data were slightly higher at lower concentrations compared with the higher concentrations of the QC samples. The non-significant variations in the calculated data indicated the reproducibility, accuracy and reliability of the method developed for 5-FU determination in AqH samples obtained from rabbits.
To check the robustness of the method, we performed deliberate alterations (±2 mL for each) of the mobile phase composition. The developed method proved to be reliable because there were no significant changes (p < 0.05) in the peak regions and shifting of the retention time (Rt) of the analyte (5-FU at the MQC level). Likewise, no significant (p < 0.05) changes in the peak area and shifting of the Rt were noted following moderate alterations of the flow rate of the mobile phase (±0.02 mL/min). Table 3 presents a summary of the average values of peak area and Rt (as mean ± SD), SEM, and % RSD following the intentional modifications. Our findings showed that the mathematical values of the parameters fell within the estimated acceptable limits for precision and accuracy, as mentioned in the ICH-Harmonized Guideline for Bioanalytical Method Validation [19].

3.4.4. Recovery and Matrix Effect

The extraction recovery data of the AqH and endogenous substance (matrix) effects at the LQC, MQC and HQC levels of the 5-FU and IS (250 ng/mL) are summarized in Table 4. The extraction recovery ranged from 77.06 ± 4.49% to 89.01 ± 4.72% with RSDs from 5.31% to 6.82% at the three selected QC concentration levels for 5-FU, and the extraction recovery was 78.73 ± 1.61% with an RSD of 2.04% for allopurinol (IS). With an overall average accuracy of 83.05 ± 5.97% and an RSD of 7.19%, the recovery of 5-FU using the liquid–liquid extraction technique with ethyl acetate as the organic solvent was good. The total matrix effects for 5-FU at the three selected QC concentrations were 92.67 ± 2.06% with an RSD of 2.22%, whereas for allopurinol (IS), they were 95.67 ± 2.78% with an RSD of 2.91%. Very small variations in such findings suggest that the endogenous substances present in the rabbit AqH (matrix) did not cause any significant ion-suppression effects, so the target analytes were successfully quantified [31,32].

3.4.5. Stability

5-FU was stable in the rabbit AqH samples at the abovementioned storage conditions. The measured and theoretical concentrations of 5-FU were in agreement with each other, as can be seen by observing the values summarized in Table 5. Under all storage stability conditions, the values for precision (% RSD), percentage recovery (%), and accuracy (% RE) were satisfactory compared with the established restrictions.

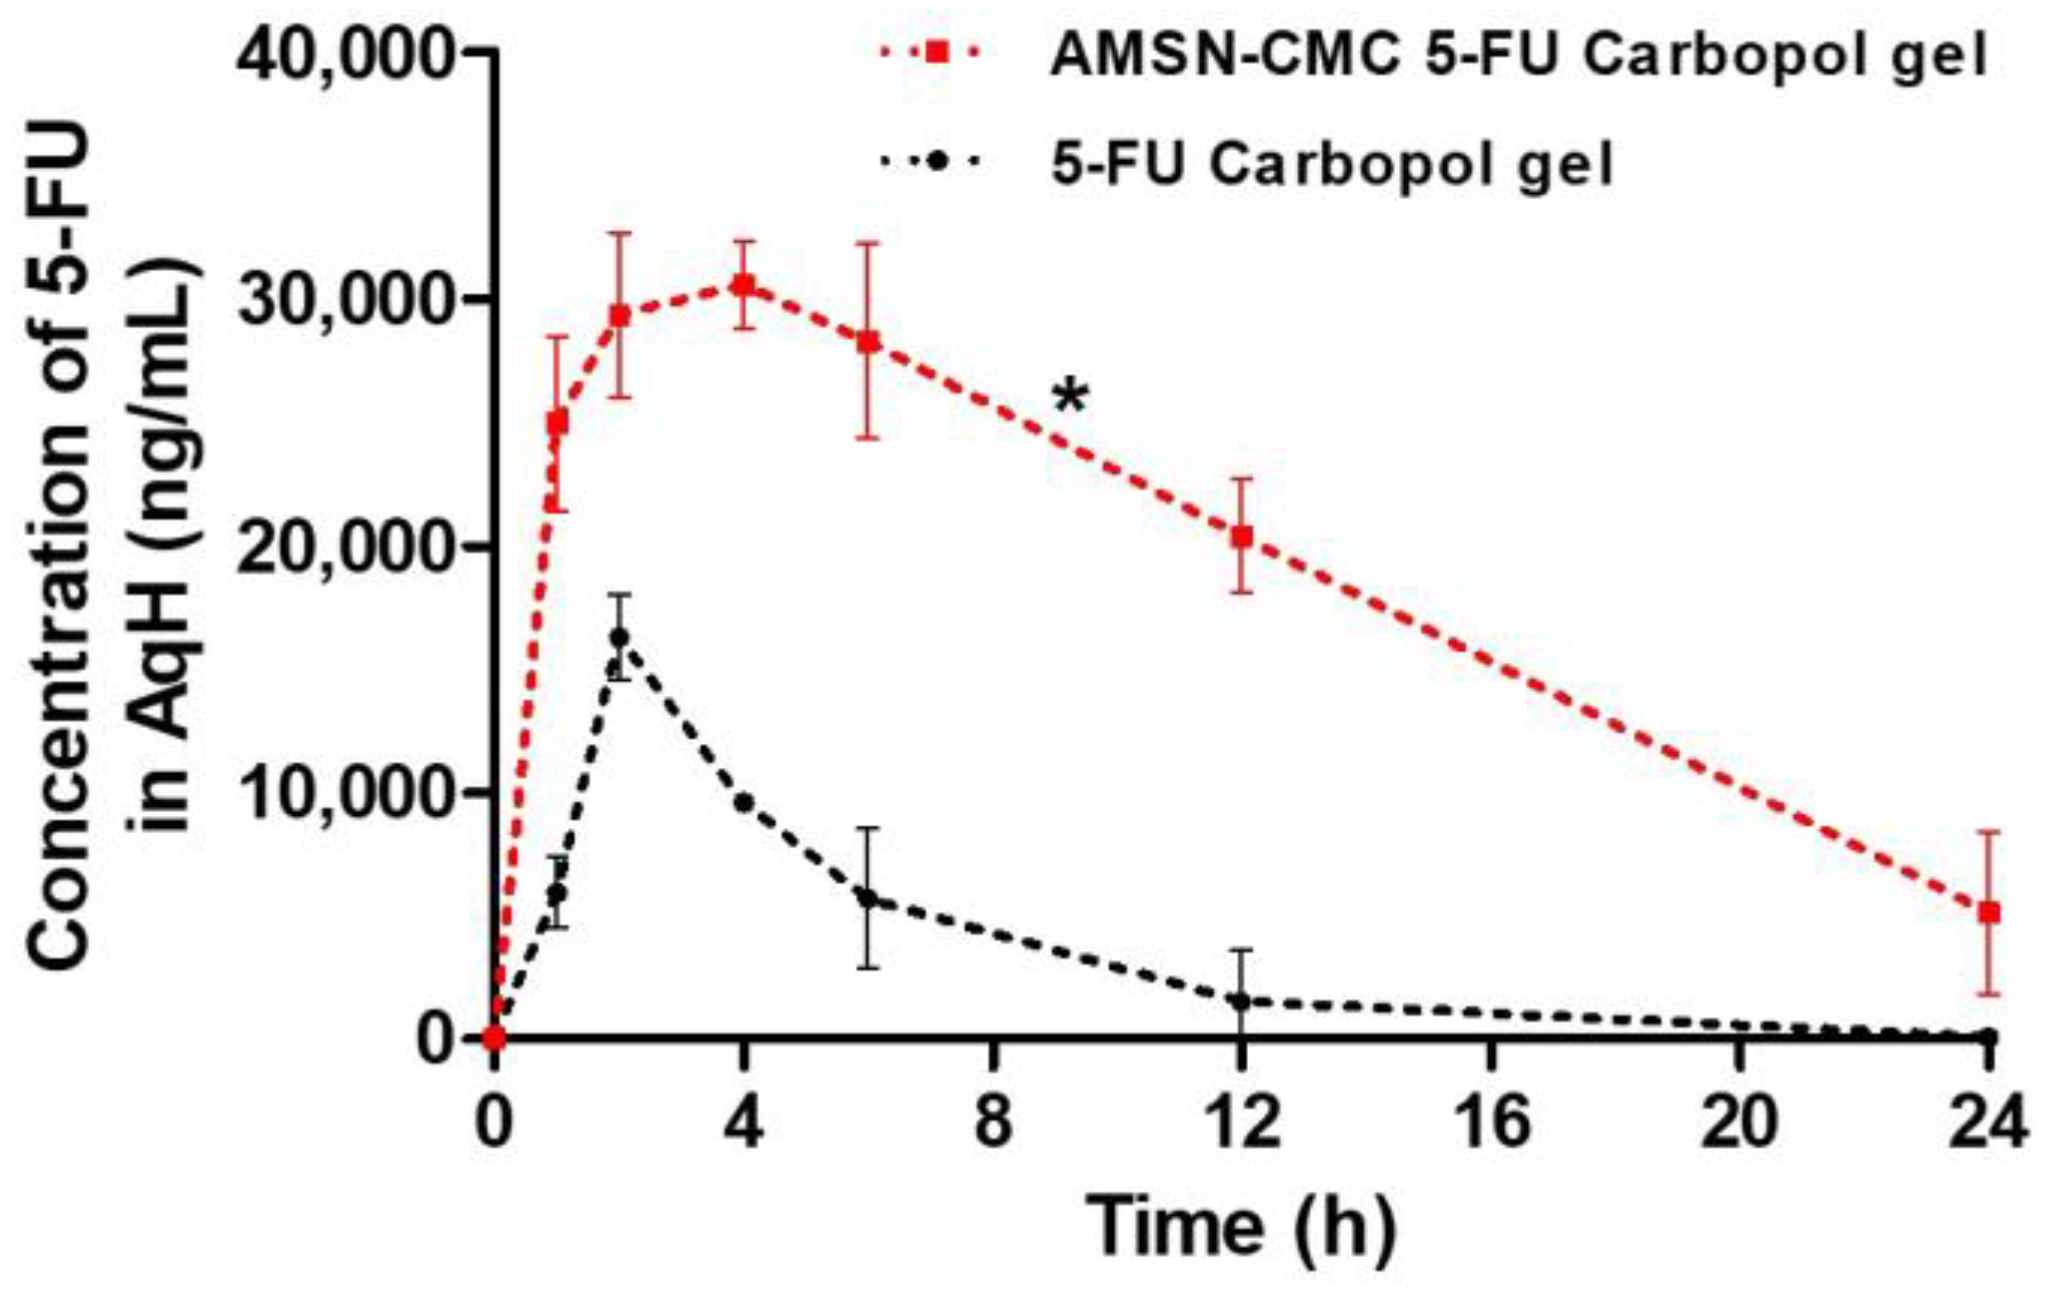
3.5. Application of the Method

After the topical application of formulations containing 5-FU (5-FU Carbopol gel and AMSN-CMC gel), the developed LC–MS method was effectively used for the quantitative detection of 5-FU in the AqH samples collected from rabbit eyes. The average 5-FU concentrations in the collected AqH samples were calculated and plotted against time at various time intervals (1, 2, 4, 6, 12, and 24 h) (Figure 5). The pharmacokinetic data were computed using the PK-Solver software following a non-compartmental, linear trapezoidal approach to the AqH concentration–time profiles.
According to the comparative pharmacokinetic data of the two 5-FU-containing formulations, the AMSN CMC FU-Carbopol gel had a significantly (p < 0.05) higher ocular availability of 5-FU compared with the 5-FU Carbopol gel. The AMSN-CMC 5-FU Carbopol gel showed statistically significant (p < 0.05) increases in t1/2, Tmax, and Cmax (2.4-, 2.3-, and 1.8-fold, respectively) compared with the 5-FU Carbopol gel. Comparatively, significantly (p < 0.05) improved (5.3, 5.9, and 13.1 times, respectively) AUC0-24, AUC0-inf and AUMC0-inf were found for the AMSN-CMC 5-FU Carbopol gel. Additionally, the mean ocular residence (MRT0-inf) of the AMSN-CMC 5-FU Carbopol gel was 2.2 times higher.
Overall, the pharmacokinetic parameters of 5-FU in the 5-FU Carbopol gel were less favorable than those of the AMSN CMC 5-FU Carbopol gel. This may have been related to the relatively quick loss of 5-FU from the simple Carbopol gel preparation in the cornea and precorneal region, which was also supported by its relatively quick clearance (Cl/F was 1.17 ± 0.12 mL/h) and comparably shorter MRT (5.21 ± 0.63 h). A higher ocular bioavailability of 5-FU was revealed by the PK values for the AMSN-CMC 5-FU Carbopol gel. This was explained by the extended ocular retention brought on by the cationic and mucoadhesive features of amino-functionalized mesoporous silica nanoparticles, which in turn improved the cellular uptake of the nanocarriers and raised the ocular bioavailability of 5-FU.
Our successful quantification of 5-FU for up to 24 h in rabbit AqH indicates the suitability of the developed method for the ocular pharmacokinetic study of 5-FU. The selectivity and robustness of the method were tested, and the concentration range used to obtain calibration curves was applied to experimentally evaluate the ocular pharmacokinetics of 5-FU. Generally, large populations of animals are used to obtain ocular tissues from the AqH or vitreous humor for ocular pharmacokinetic studies, and individual variances among animals could be the source of experimental errors. Here, the developed method was successfully used to quantify 5-FU in a limited number of AqH samples. We extracted AqH samples from the treated eyes of identical rabbits at regular time intervals.

4. Conclusions

To assess 5-FU in the AqH of rabbits, we developed and validated a UPLC–MS/MS method that is easy to use, sensitive, quick, selective, exact and accurate. Our assay for 5-FU was found to be more sensitive (LLOQ of 10.5 ng/mL) and less time-consuming (total run time was 2.5 min) than previously used methods. Our method can be utilized for the 5-FU analysis of other clinical or biological samples. Storage conditions did not affect the analyte concentrations in the spiked AqH samples, and even in our limited number of AqH samples, the validated method was successfully and efficiently used to determine the ocular pharmacokinetics of 5-FU following the topical application of 5-FU-containing preparations. Because the AqH samples were aspirated in a small number of sedated animals, further research should apply this method for the 5-FU quantification of AqH samples in a larger number of awake rabbits.

Supplementary Materials

The following supporting information can be downloaded at: https://www.mdpi.com/article/10.3390/separations10060343/s1, Figure S1. Representative LLOQ chromatograms of the 5-FU and IS in AqH in samples prepared with the protein precipitation method. Figure S2. The comparative extraction recovery (%) and matrix effects (%) data of the different extracting solvents obtained during sample preparation and optimization.

Author Contributions

Conceptualization, M.R., M.A., A.A.A. (Aliyah A. Almomen) and A.A.; Data curation, S.S.A., A.A.A. (Adel Ali Alhowyan), M.R., A.K.A. and A.A.A. (Aliyah A. Almomen); Formal analysis, M.A.K., S.S.A., A.A.A. (Adel Ali Alhowyan) and A.A.A. (Aliyah A. Almomen); Funding acquisition, M.A.K. and A.A.; Investigation, M.A.K., A.A.A. (Adel Ali Alhowyan), M.I. and A.K.A.; Methodology, M.A.K., S.S.A., A.A.A. (Adel Ali Alhowyan), M.I., A.K.A. and A.A.A. (Aliyah A. Almomen); Project administration, M.A. and A.A.; Resources, A.A.A. (Aliyah A. Almomen) and A.A.; Software, M.I. and M.A.; Supervision, A.A.; Validation, M.A.K., A.A.A. (Adel Ali Alhowyan) and M.I.; Visualization, S.S.A., M.R., A.K.A. and M.A.; Writing—original draft, M.A.K., M.I., M.R. and A.K.A.; Writing—review & editing, M.A. and A.A. All authors have read and agreed to the published version of the manuscript.

Funding

This work was funded by the Researchers Supporting Project number (RSPD2023R726), King Saud University, Riyadh, Saudi Arabia.

Institutional Review Board Statement

The protocol for animal use was approved by the Research Ethics Committee (REC) at King Saud University (protocol approval number: SE-21-80; 9 December 2021).

Informed Consent Statement

Not applicable.

Data Availability Statement

The data presented in this study are available on request from the corresponding author.

Acknowledgments

The authors extend their appreciation to the Researchers Supporting Project number (RSPD2023R726), King Saud University, Riyadh, Saudi Arabia.

Conflicts of Interest

We declare that we have no known competing financial interests or personal relationships that could have appeared to influence the work reported in this paper.

References

  1. Hartmann, J.T.; Kohne, C.H.; Schmoll, H.J.; Daikeler, T.; Kanz, L.; Bokemeyer, C. Is continuous 24-hour infusion of 5-fluorouracil plus high-dose folinic acid effective in patients with progressive or recurrent colorectal cancer? A phase II study. Oncology 1998, 55, 320–325. [Google Scholar] [CrossRef] [PubMed]
  2. Noordhuis, P.; Holwerda, U.; Van der Wilt, C.; Van Groeningen, C.; Smid, K.; Meijer, S.; Pinedo, H.; Peters, G. 5-Fluorouracil incorporation into RNA and DNA in relation to thymidylate synthase inhibition of human colorectal cancers. Ann. Oncol. 2004, 15, 1025–1032. [Google Scholar] [CrossRef] [PubMed]
  3. Zhang, N.; Yin, Y.; Xu, S.-J.; Chen, W.-S. 5-Fluorouracil: Mechanisms of resistance and reversal strategies. Molecules 2008, 13, 1551–1569. [Google Scholar] [CrossRef] [PubMed] [Green Version]
  4. Longley, D.B.; Harkin, D.P.; Johnston, P.G. 5-fluorouracil: Mechanisms of action and clinical strategies. Nat. Rev. Cancer 2003, 3, 330–338. [Google Scholar] [CrossRef] [PubMed]
  5. Al-Barrag, A.; Al-Shaer, M.; Al-Matary, N.; Al-Hamdani, M. 5-Fluorouracil for the treatment of intraepithelial neoplasia and squamous cell carcinoma of the conjunctiva, and cornea. Clin. Ophthalmol. 2010, 4, 801–808. [Google Scholar] [CrossRef] [PubMed] [Green Version]
  6. Yeatts, R.P.; Engelbrecht, N.E.; Curry, C.D.; Ford, J.G.; Walter, K.A. 5-Fluorouracil for the treatment of intraepithelial neoplasia of the conjunctiva and cornea. Ophthalmology 2000, 107, 2190–2195. [Google Scholar] [CrossRef]
  7. Venkateswaran, N.; Mercado, C.; Galor, A.; Karp, C.L. Comparison of topical 5-fluorouracil and interferon alfa-2b as primary treatment modalities for ocular surface squamous neoplasia. Am. J. Ophthalmol. 2019, 199, 216–222. [Google Scholar] [CrossRef]
  8. Patel, U.; Karp, C.L.; Dubovy, S.R. Update on the management of ocular surface squamous neoplasia. Curr. Ophthalmol. Rep. 2021, 9, 7–15. [Google Scholar] [CrossRef]
  9. Fuhrman, L.C.; Godwin, D.A.; Davis, R.A. Stability of 5-Fluorouracil in an extemporaneously compounded ophthalmic solution. Int. J. Pharm. Compd. 2000, 4, 320–323. [Google Scholar]
  10. Alhowyan, A.A.; Kalam, M.A.; Iqbal, M.; Raish, M.; El-Toni, A.M.; Alkholief, M.; Almomen, A.A.; Alshamsan, A. Mesoporous silica nanoparticles coated with carboxymethyl chitosan for 5-fluorouracil ocular delivery: Characterization, in vitro and in vivo studies. Molecules 2023, 28, 1260. [Google Scholar] [CrossRef]
  11. Alanazi, F.K.; Eldeen Yassin, A.; El-Badry, M.; Mowafy, H.A.; Alsarra, I.A. Validated high-performance liquid chromatographic technique for determination of 5-fluorouracil: Applications to stability studies and simulated colonic media. J. Chromatogr. Sci. 2009, 47, 558–563. [Google Scholar] [CrossRef] [Green Version]
  12. Pi, C.; Wei, Y.; Yang, H.; Zhou, Y.; Fu, J.; Yang, S.; Ye, Y.; Zhao, L. Development of a HPLC method to determine 5-fluorouracil in plasma: Application in pharmacokinetics and steady-state concentration monitoring. Int. J. Clin. Pharmacol. Ther. 2014, 52, 1093–1101. [Google Scholar] [CrossRef]
  13. Alsarra, I.A.; Alarifi, M.N. Validated liquid chromatographic determination of 5-fluorouracil in human plasma. J. Chromatogr. B 2004, 804, 435–439. [Google Scholar] [CrossRef]
  14. Nassim, M.A.; Shirazi, F.H.; Cripps, C.M.; Veerasinghan, S.; Molepo, M.J.; Obrocea, M.; Redmond, D.; Bates, S.; Fry, D.; Stewart, D.J. An HPLC method for the measurement of 5-fluorouracil in human plasma with a low detection limit and a high extraction yield. Int. J. Mol. Med. 2002, 10, 513–516. [Google Scholar] [CrossRef]
  15. Cui, L.-j.; Sun, N.-x.; Li, X.-h.; Huang, J.; Yang, J.-g. Subconjunctival sustained release 5-fluorouracil for glaucoma filtration surgery. Acta Pharmacol. Sin. 2008, 29, 1021–1028. [Google Scholar] [CrossRef] [Green Version]
  16. Bernatchez, S.a.F.; Tabatabay, C.; Gurny, R. Sodium hyaluronate as a vehicle for an improved tolerance of 5-fluorouracil administered subconjunctivally to rabbits. Int. J. Pharm. 1994, 106, 161–166. [Google Scholar] [CrossRef]
  17. Jeronimo, M.; Colombo, M.; Astrakianakis, G.; Hon, C.-Y. A surface wipe sampling and LC–MS/MS method for the simultaneous detection of six antineoplastic drugs commonly handled by healthcare workers. Anal. Bioanal. Chem. 2015, 407, 7083–7092. [Google Scholar] [CrossRef]
  18. Iqbal, M.; Ezzeldin, E.; Herqash, R.N.; Alam, O. Ultra-performance hydrophilic interaction liquid chromatography coupled with tandem mass spectrometry for simultaneous determination of allopurinol, oxypurinol and lesinurad in rat plasma: Application to pharmacokinetic study in rats. PLoS ONE 2019, 14, e0213786. [Google Scholar] [CrossRef] [Green Version]
  19. Guideline, ICH Harmonised. Bioanalytical Method Validation and Study Sample Analysis M10; ICH Harmonised Guideline: Geneva, Switzerland, 2022. [Google Scholar]
  20. Hartmann, C.; Smeyers-Verbeke, J.; Massart, D.; McDowall, R. Validation of bioanalytical chromatographic methods. J. Pharm. Biomed. Anal. 1998, 17, 193–218. [Google Scholar] [CrossRef]
  21. Tang, Z.; Wang, L.; Xia, Z.; Shi, M.; Wang, Q.; Zhan, Z. HPLC–MS/MS-based analysis of everolimus in rabbit aqueous humor: Pharmacokinetics of in situ gel eye drops of suspension. Bioanalysis 2019, 11, 267–278. [Google Scholar] [CrossRef]
  22. Kalam, M.A.; Iqbal, M.; Alshememry, A.; Alkholief, M.; Alshamsan, A. UPLC-MS/MS assay of Tedizolid in rabbit aqueous humor: Application to ocular pharmacokinetic study. J. Chromatogr. B 2021, 1171, 122621. [Google Scholar] [CrossRef] [PubMed]
  23. Kalam, M.A. The potential application of hyaluronic acid coated chitosan nanoparticles in ocular delivery of dexamethasone. Int. J. Biol. Macromol. 2016, 89, 559–568. [Google Scholar] [CrossRef] [PubMed]
  24. Furrer, P.; Plazonnet, B.; Mayer, J.; Gurny, R. Application of in vivo confocal microscopy to the objective evaluation of ocular irritation induced by surfactants. Int. J. Pharm. 2000, 207, 89–98. [Google Scholar] [CrossRef] [PubMed]
  25. Zhang, Y.; Huo, M.; Zhou, J.; Xie, S. PKSolver: An add-in program for pharmacokinetic and pharmacodynamic data analysis in Microsoft Excel. Comput. Methods Programs Biomed. 2010, 99, 306–314. [Google Scholar] [CrossRef]
  26. Ji, Q.C.; Reimer, M.T.; El-Shourbagy, T.A. 96-Well liquid–liquid extraction liquid chromatography-tandem mass spectrometry method for the quantitative determination of ABT-578 in human blood samples. J. Chromatogr. B 2004, 805, 67–75. [Google Scholar] [CrossRef]
  27. Rousu, T.; Hokkanen, J.; Pelkonen, O.R.; Tolonen, A. Applicability of generic assays based on liquid chromatography–electrospray mass spectrometry to study in vitro metabolism of 55 structurally diverse compounds. Front. Pharmacol. 2010, 1, 10. [Google Scholar] [CrossRef] [Green Version]
  28. Sanli, N.; Sanli, S.; Alsancak, G.l. Determination of dissociation constants of folinic acid (leucovorin), 5-fluorouracil, and irinotecan in hydro-organic media by a spectrophotometric method. J. Chem. Eng. Data 2010, 55, 2695–2699. [Google Scholar] [CrossRef]
  29. Wielinska, J.; Nowacki, A.; Liberek, B. 5-Fluorouracil-Complete Insight into Its Neutral and Ionised Forms. Molecules 2019, 24, 3683. [Google Scholar] [CrossRef] [Green Version]
  30. Privat, E.J.; Sowers, L.C. A proposed mechanism for the mutagenicity of 5-formyluracil. Mutat. Res. 1996, 354, 151–156. [Google Scholar] [CrossRef]
  31. Matuszewski, B.K.; Constanzer, M.; Chavez-Eng, C. Strategies for the assessment of matrix effect in quantitative bioanalytical methods based on HPLC−MS/MS. Anal. Chem. 2003, 75, 3019–3030. [Google Scholar] [CrossRef]
  32. Volmer, D.; Jessome, L.L. Ion suppression: A major concern in mass spectrometry. LCGC N. Am. 2006, 24, 498–510. [Google Scholar]
Figure 1. Chemical structures of 5-fluorouracil (a) and allopurinol (b).
Separations 10 00343 g001
Figure 2. The mass spectra of 5-FU parent ion (a); 5-FU daughter ion (b) and allopurinol (as the IS) parent ion (c) and allopurinol daughter ion (d).
Separations 10 00343 g002
Figure 3. Representative chromatograms of 5-FU (a) and allopurinol as the IS (b) in blank aqueous humor (AqH).
Separations 10 00343 g003
Figure 4. Representative chromatograms of 5-FU and the IS in AqH spiked with the LLOQ level (10.5 ng/mL) of 5-FU (a) and 250 ng/mL of the IS (b); in AqH aspirated at 2 h after the ocular instillation of the AMSN-CMC 5-FU Carbopol gel (equivalent to 100 μg of 5-FU) in rabbit eyes for (c,d) 5-FU and the IS, respectively.
Separations 10 00343 g004
Figure 5. 5-FU AqH concentration versus time profile following topical 5-FU Carbopol gel and AMSN-CMC gel application in rabbit eyes. The averages of three measurements, with standard deviations (mean ± SD, n = 3, three animals in each group), constitute the results. * signifies p < 0.05 against the 5-FU Carbopol gel.
Separations 10 00343 g005
Table 1. Calibration curve parameters of 5-fluorouracil (5-FU).
Calibration ParametersValues (Mean ± SEM, n = 3)
Linearity
Concentration range10.5–2000 ng/mL
Slope (mean ± SEM) with % RSD(1.667 ± 0.121) × 10−3 with 12.49%
Intercept (mean ± SEM) with % RSD(3.096 ± 0.104) × 10−2 with 5.80%
Coefficient of correlation, R2 (mean ± SEM) with % RSD0.9946 ± 0.0023, with 0.40%
Calibration equation Y = 0.001667x + 0.030967
LOD3.55 ng/mL
LOQ10.77 ng/mL
x” represents the 5-FU concentration in the AqH and “Y” represents the ratio of the 5-FU and IS peak regions.
Table 2. Intra- and inter-day precision and accuracy for the determination of 5-fluorouracil (5-FU) with the proposed analytical method.
Spiked Concentration of 5-FU in AqH (ng/mL)Measured Concentration, Mean ± SD, n = 3 (ng/mL)SEM% RSD Recovery (%)Accuracy (% RE) *
Intraday precision
10.5 (LLOQ)9.77 ± 0.310.173.0293.07−6.93
30 (LQC)29.03 ± 2.521.458.6896.75−3.25
350 (MQC)353.99 ± 5.763.331.63101.141.14
1400 (HQC)1417.47 ± 6.823.940.48101.241.25
Interday precision
10.5 (LLOQ)9.54 ± 0.110.0631.1490.88−9.12
30 (LQC)27.99 ± 1.861.0726.6393.32−6.67
350 (MQC)344.74 ± 2.981.7200.8698.50−1.50
1400 (HQC)1379.30 ± 9.565.5220.6998.52−1.48
* % RE: percentage of relative error.
Table 3. Robustness of the method checked at a 350 ng/mL concentration of 5-FU (MQC). Results are the means of three measurements with standard deviations (mean ± SD, n = 3).
Mobile Phase (Acetonitrile: 10 mM Ammonium Acetate)Peak Area of MQC Sample (AU)Concentration of MQC Sample (ng/mL)Retention Time (Rt) (min)
Mean ± SDSEM% RSDMean ± SDSEM% RSDMean ± SDSEM% RSD
Composition of the mobile phase
93:7 (v/v)26,767.0 ± 843.9487.273.15347.24 ± 5.773.331.661.14 ± 0.030.012.21
95:5 (v/v)29,302.7 ± 1009.5582.863.44350.14 ± 3.812.201.081.13 ± 0.020.022.23
97:3 (v/v)28,546.6 ± 518.8299.561.82348.71 ± 1.210.690.341.12 ± 0.020.011.35
Rate of flow of the mobile phase
0.28 mL/min27,313.0 ± 715.4413.042.61350.31 ± 4.472.581.281.14 ± 0.030.022.69
0.30 mL/min28,605.3 ± 1651.8953.725.77349.74 ± 5.813.351.661.13 ± 0.010.011.02
0.32 mL/min28,951.3 ± 916.3529.013.16350.31 ± 3.231.860.921.15 ± 0.020.011.33
Table 4. Relative matrix effects and extraction recovery for three QC samples of 5-FU and allopurinol (as the IS, 250 ng/mL) in the AqH of rabbits. The averages of three measurements, with standard deviations (mean ± SD, n = 3), constitute the results.
SamplesTheoretical Concentration (ng/mL)Matrix Effect (%)Extraction Recovery (%)
Mean ± SD% RSDMean ± SD% RSD
LQC of 5-FU3090.45 ± 4.294.7477.06 ± 4.495.83
MQC of 5-FU35093.04 ± 3.874.1683.09 ± 5.676.82
HQC of 5-FU140094.52 ± 3.093.2789.01 ± 4.725.31
Overall92.67 ± 2.062.2283.05 ± 5.977.19
Allopurinol (as the IS)25095.67 ± 2.782.9178.73 ± 1.612.04
Table 5. Stability of 5-FU under various conditions in spiked aqueous humor (AqH). The averages of three measurements, with standard deviations (mean ± SD, n = 3), constitute the results.
Theoretical Concentration (ng/mL)Measured Concentration (ng/mL), Mean ± SDSEM% RSDRecovery (%)Accuracy (% RE)
Short-term (for 8 h at 25 ± 1 °C)
10.5 (LLQC)9.73 ± 1.120.6411.5592.68−7.32
1400 (HQC)1365.51 ± 37.5721.692.7597.54−2.46
Freeze–thaw (−80 °C to 25 °C)
10.5 (LLQC)9.98 ± 1.420.8214.2195.01−4.99
1400 (HQC)1373.36 ± 43.2424.963.1598.09−1.90
Autosampler (for 48 h at 10 °C)
10.5 (LLQC)9.74 ± 1.350.7813.9192.767.24
1400 (HQC)1372.98 ± 17.9110.331.3098.07−1.93
Long-term (for 3 months at −80 °C)
10.5 (LLQC)9.53 ± 1.170.6812.2890.74−9.26
1400 (HQC)1370.59 ± 18.4110.621.3497.90−2.10
Disclaimer/Publisher’s Note: The statements, opinions and data contained in all publications are solely those of the individual author(s) and contributor(s) and not of MDPI and/or the editor(s). MDPI and/or the editor(s) disclaim responsibility for any injury to people or property resulting from any ideas, methods, instructions or products referred to in the content.

