

Influence of Chemical Pretreatment on the Adsorption of N2 and O2 in Ca-Clinoptilolite
 ,
,  and
and
Abstract
:1. Introduction
2. Materials and Methods
2.1. Materials
2.2. Methodology
Dealumination of Clinoptilolite
2.3. Experimental Measurement Techniques
2.4. Adsorption of N2 and O2
2.5. Calculation Methods
3. Results
3.1. X-ray Analysis
3.2. SEM
3.3. The Chemical-Composition, EDS
3.4. N2 Adsorption
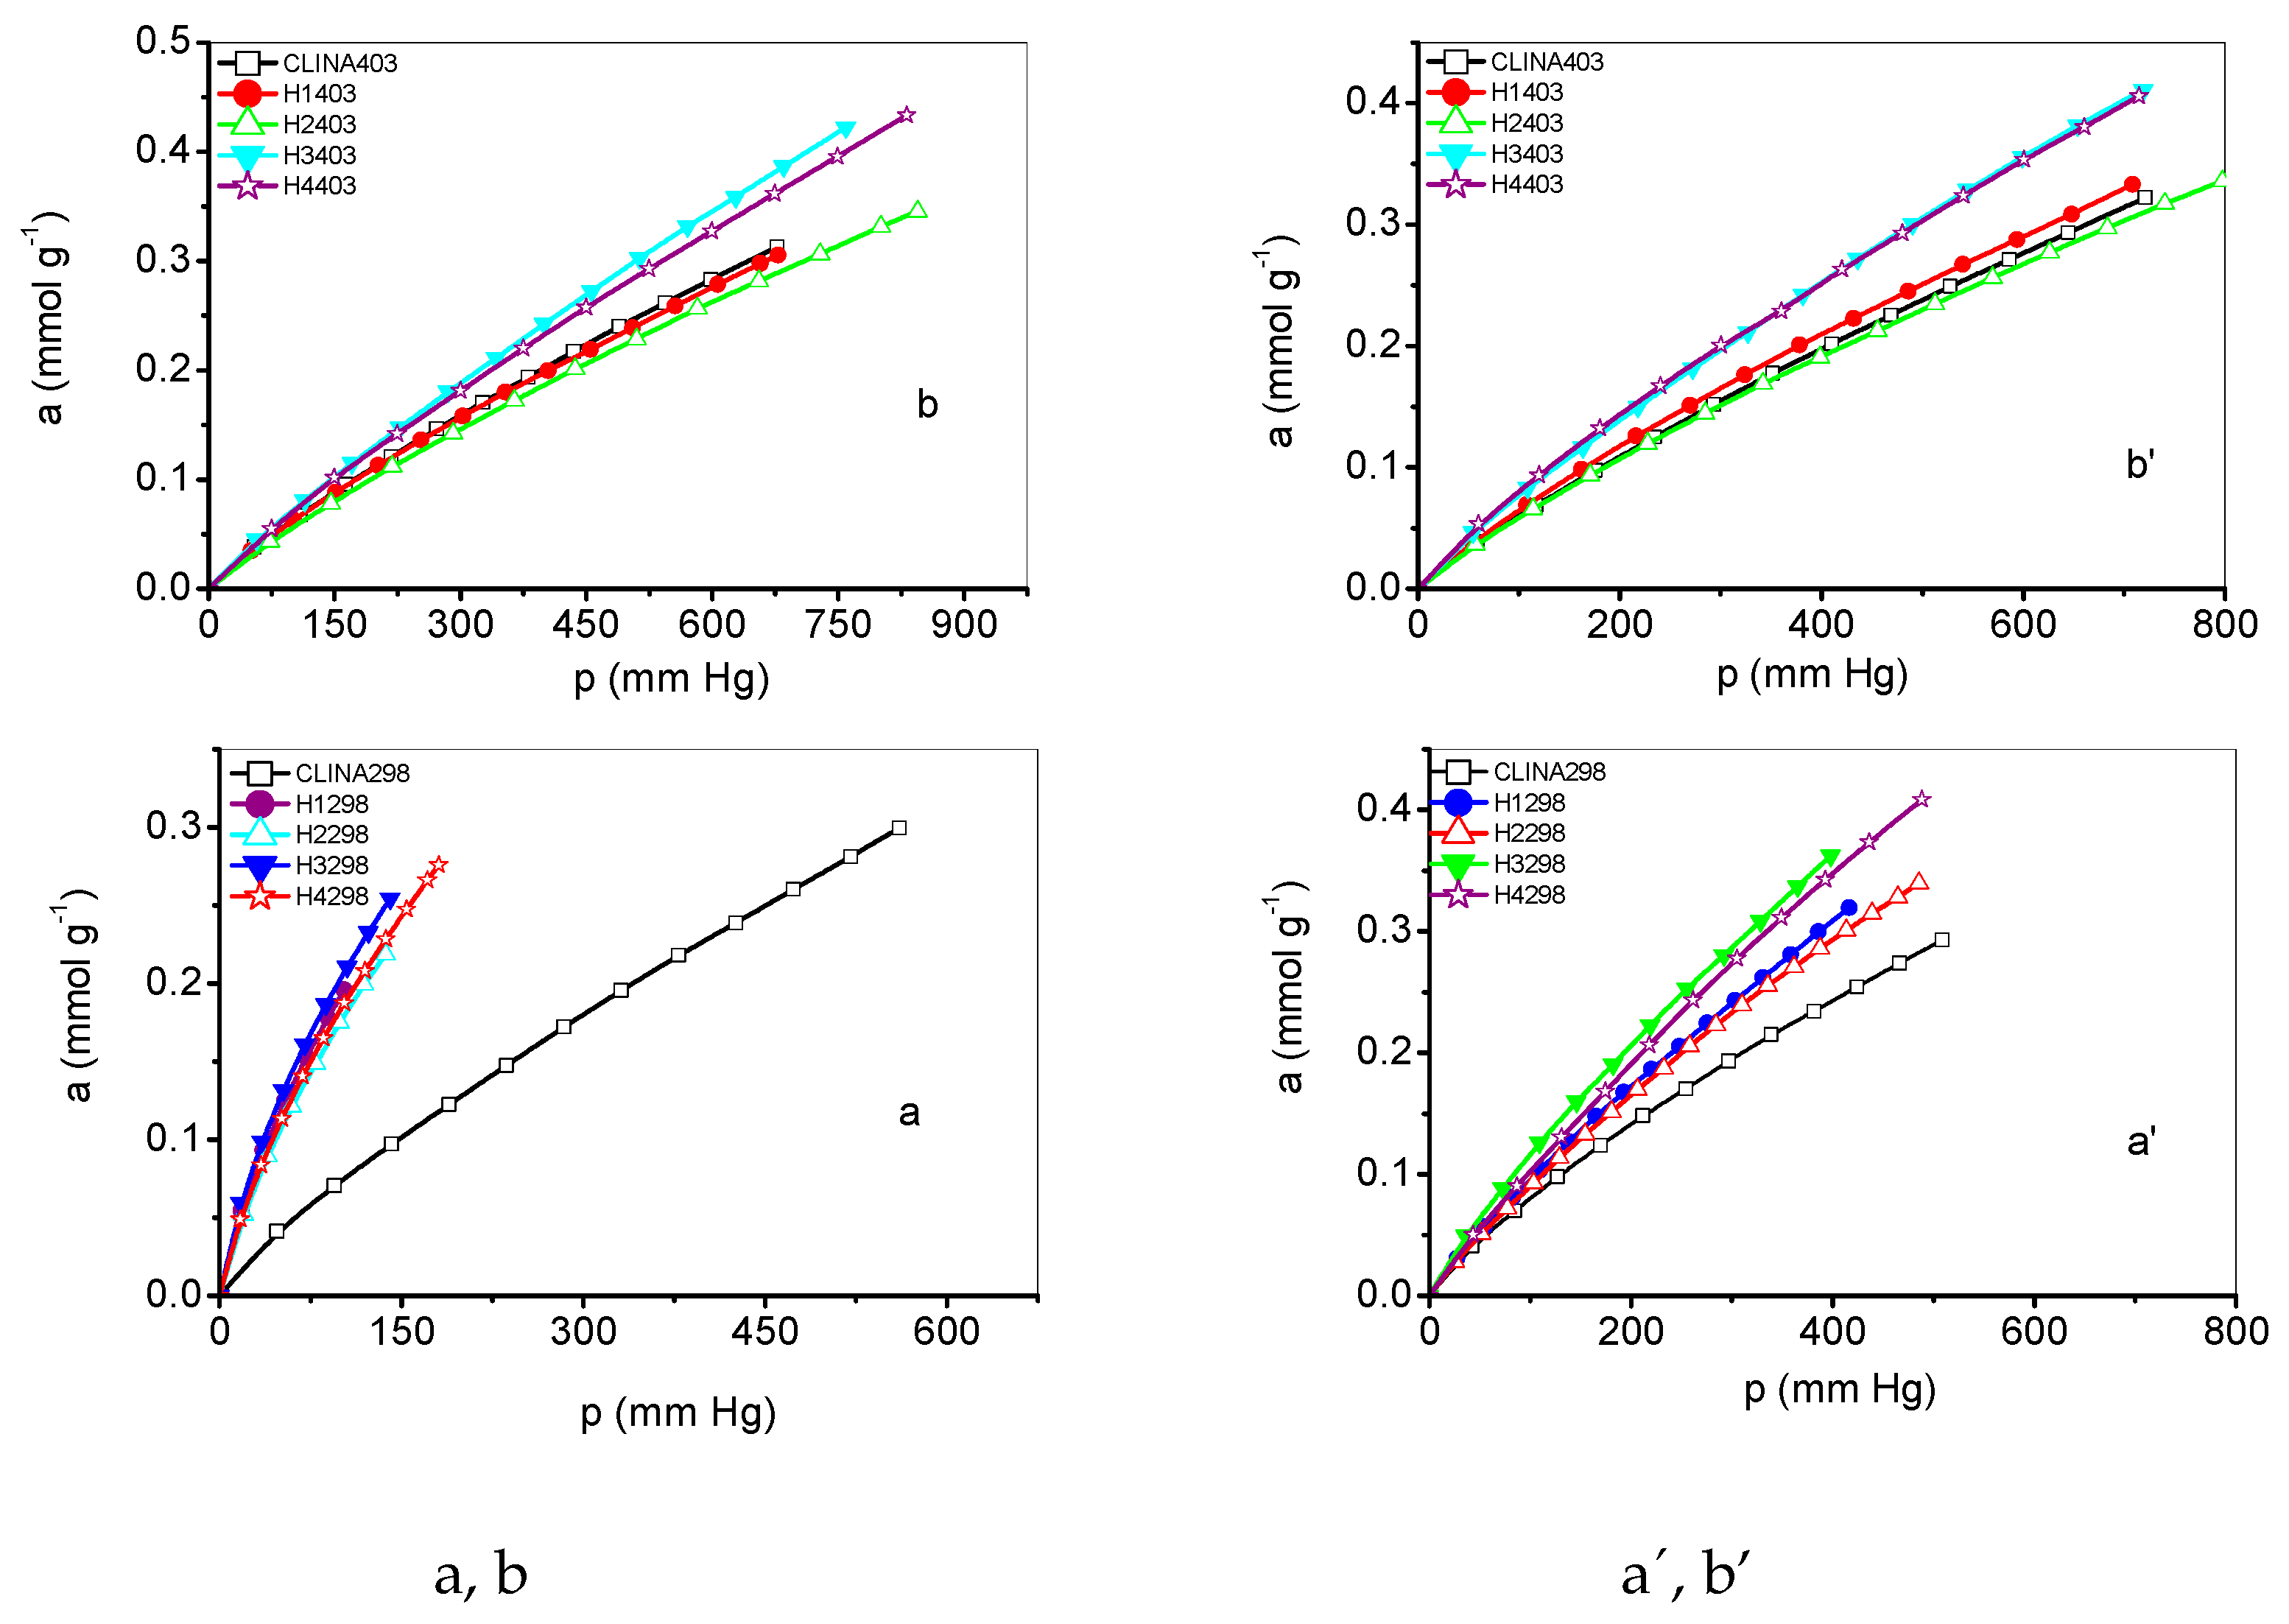
3.5. Adsorption of O2, and N2 on Clinoptilolite at Low Degrees of Coverage
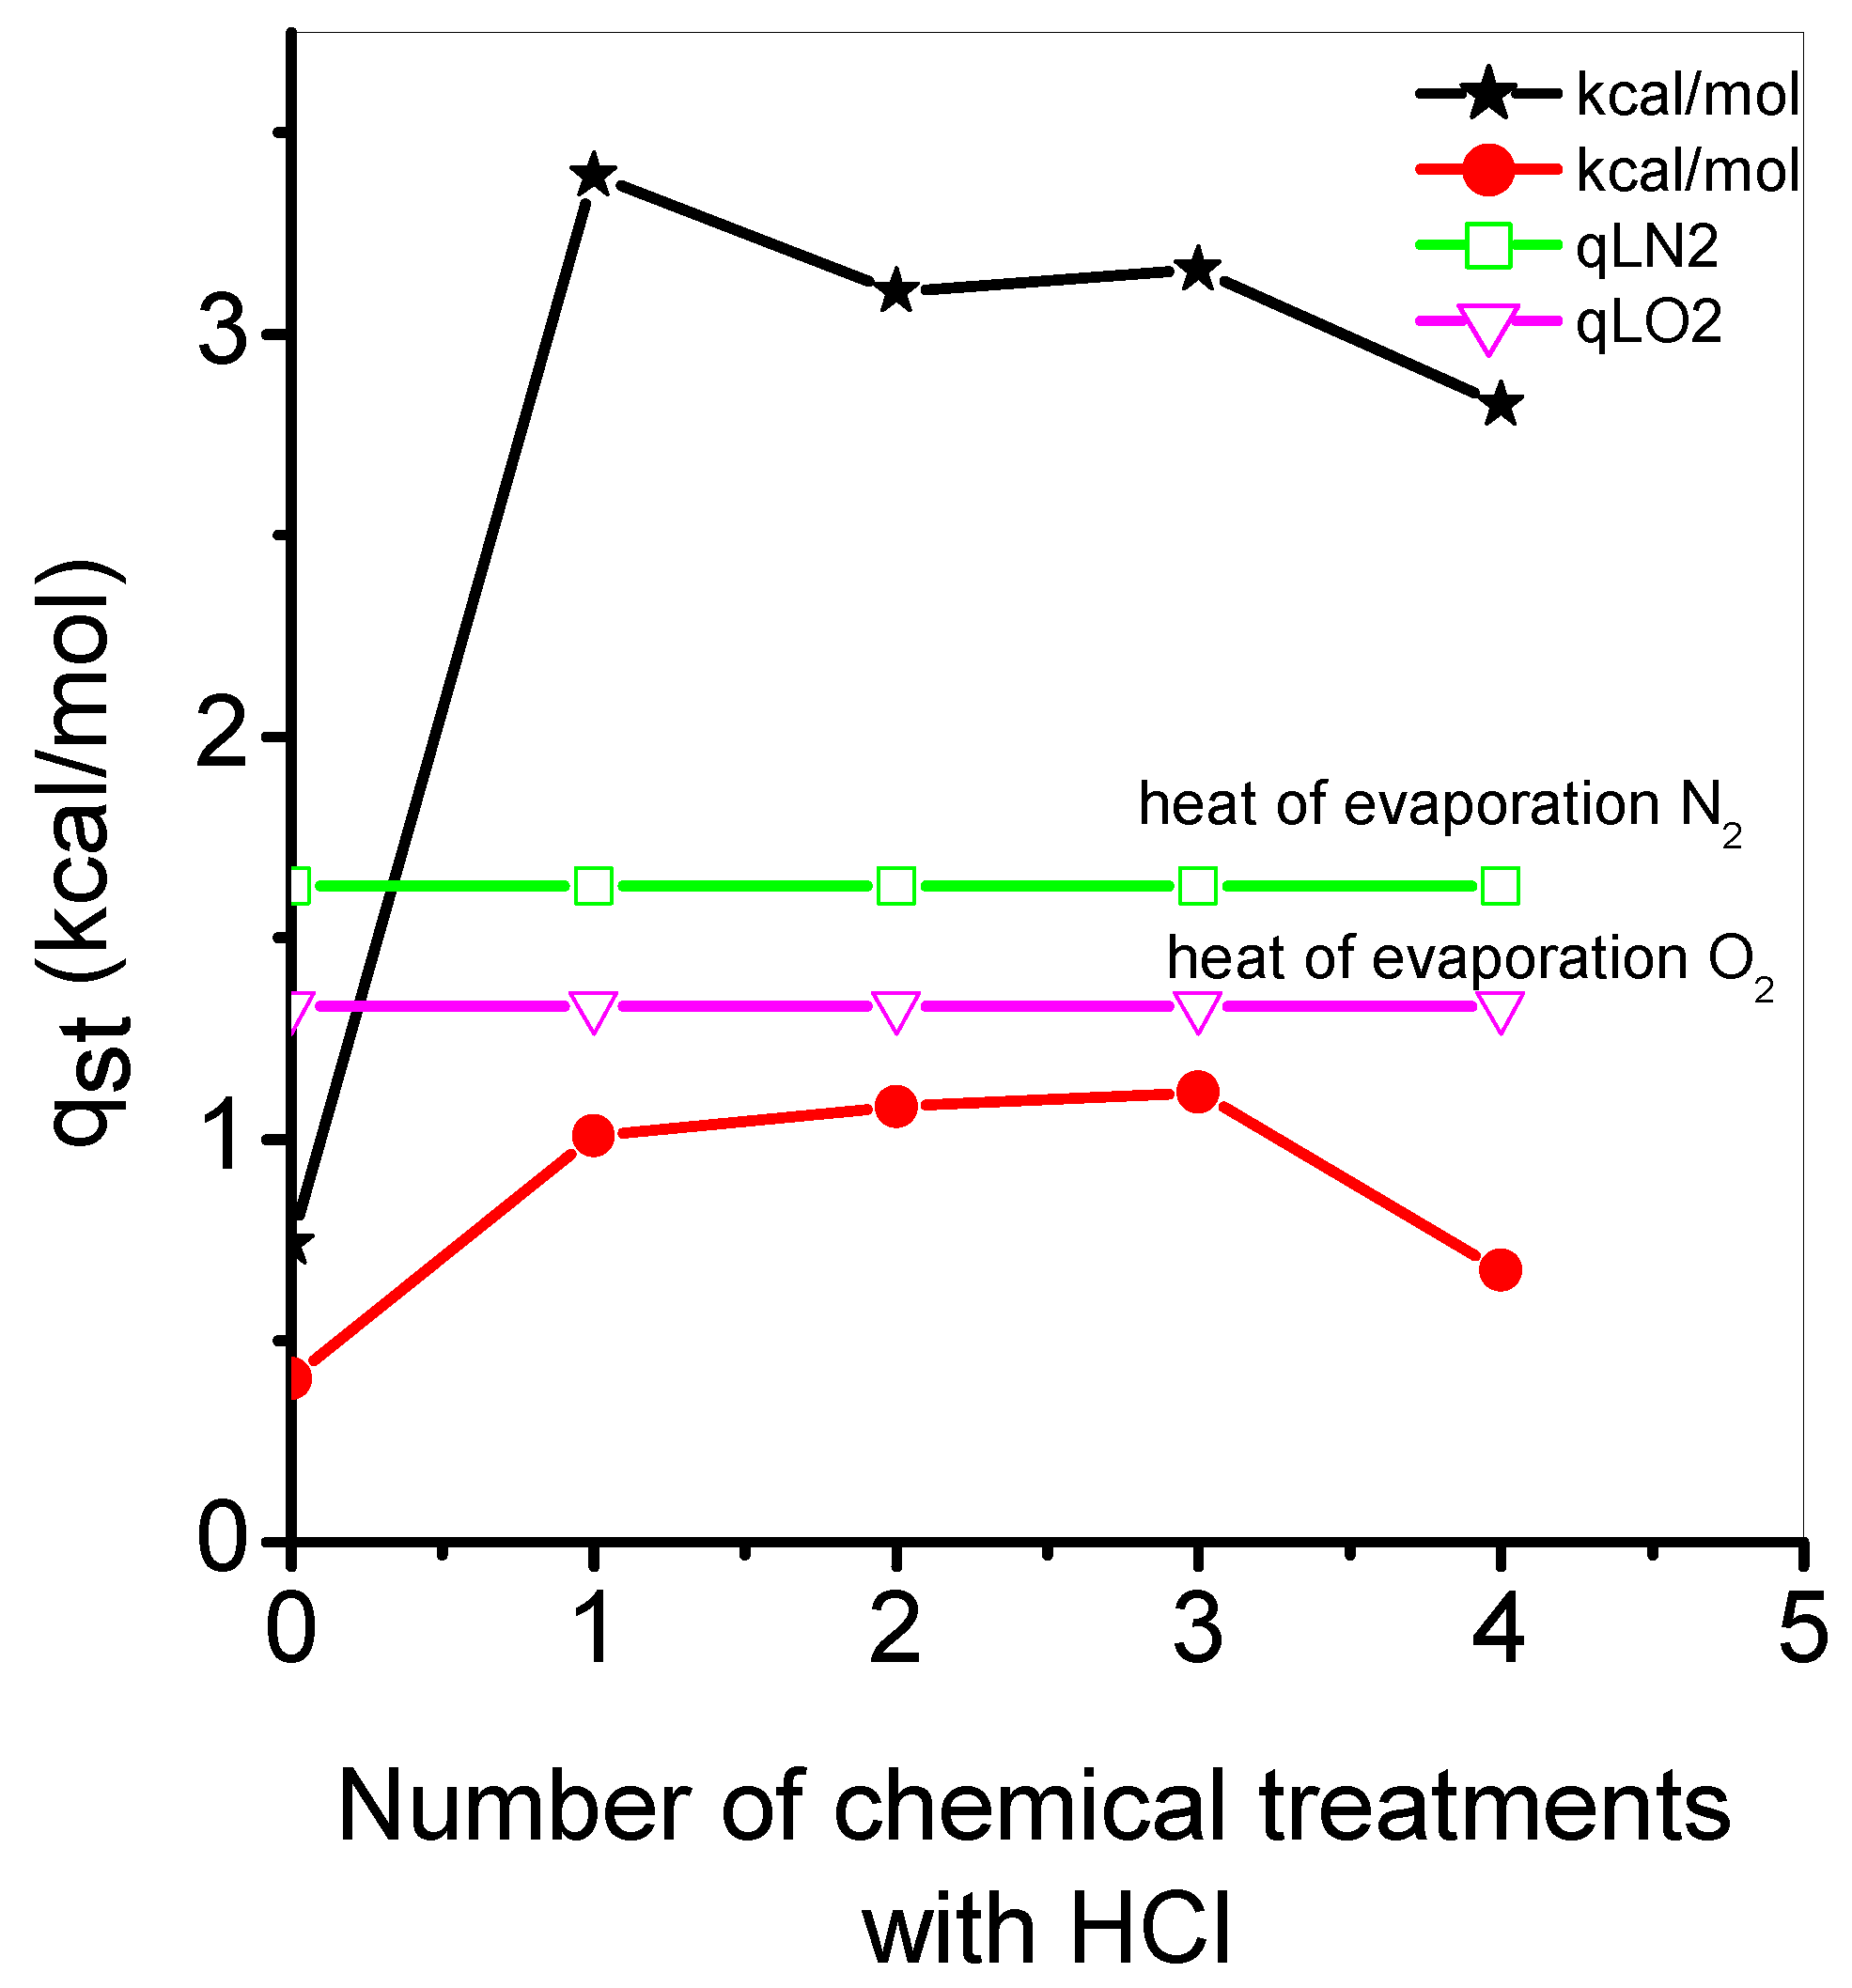
3.6. Isosteric Enthalpy of Adsorption and Selectivity Coefficients (α4)
4. Discussion
4.1. X-ray Analysis
4.2. EDS
4.3. SEM
4.4. Adsorption of N2
4.5. Adsorption of O2 and N2 on Clinoptilolite at Low Degrees of Coverage
4.6. Isosteric Enthalpy of Adsorption and Selectivity Coefficients (α4)
5. Conclusions
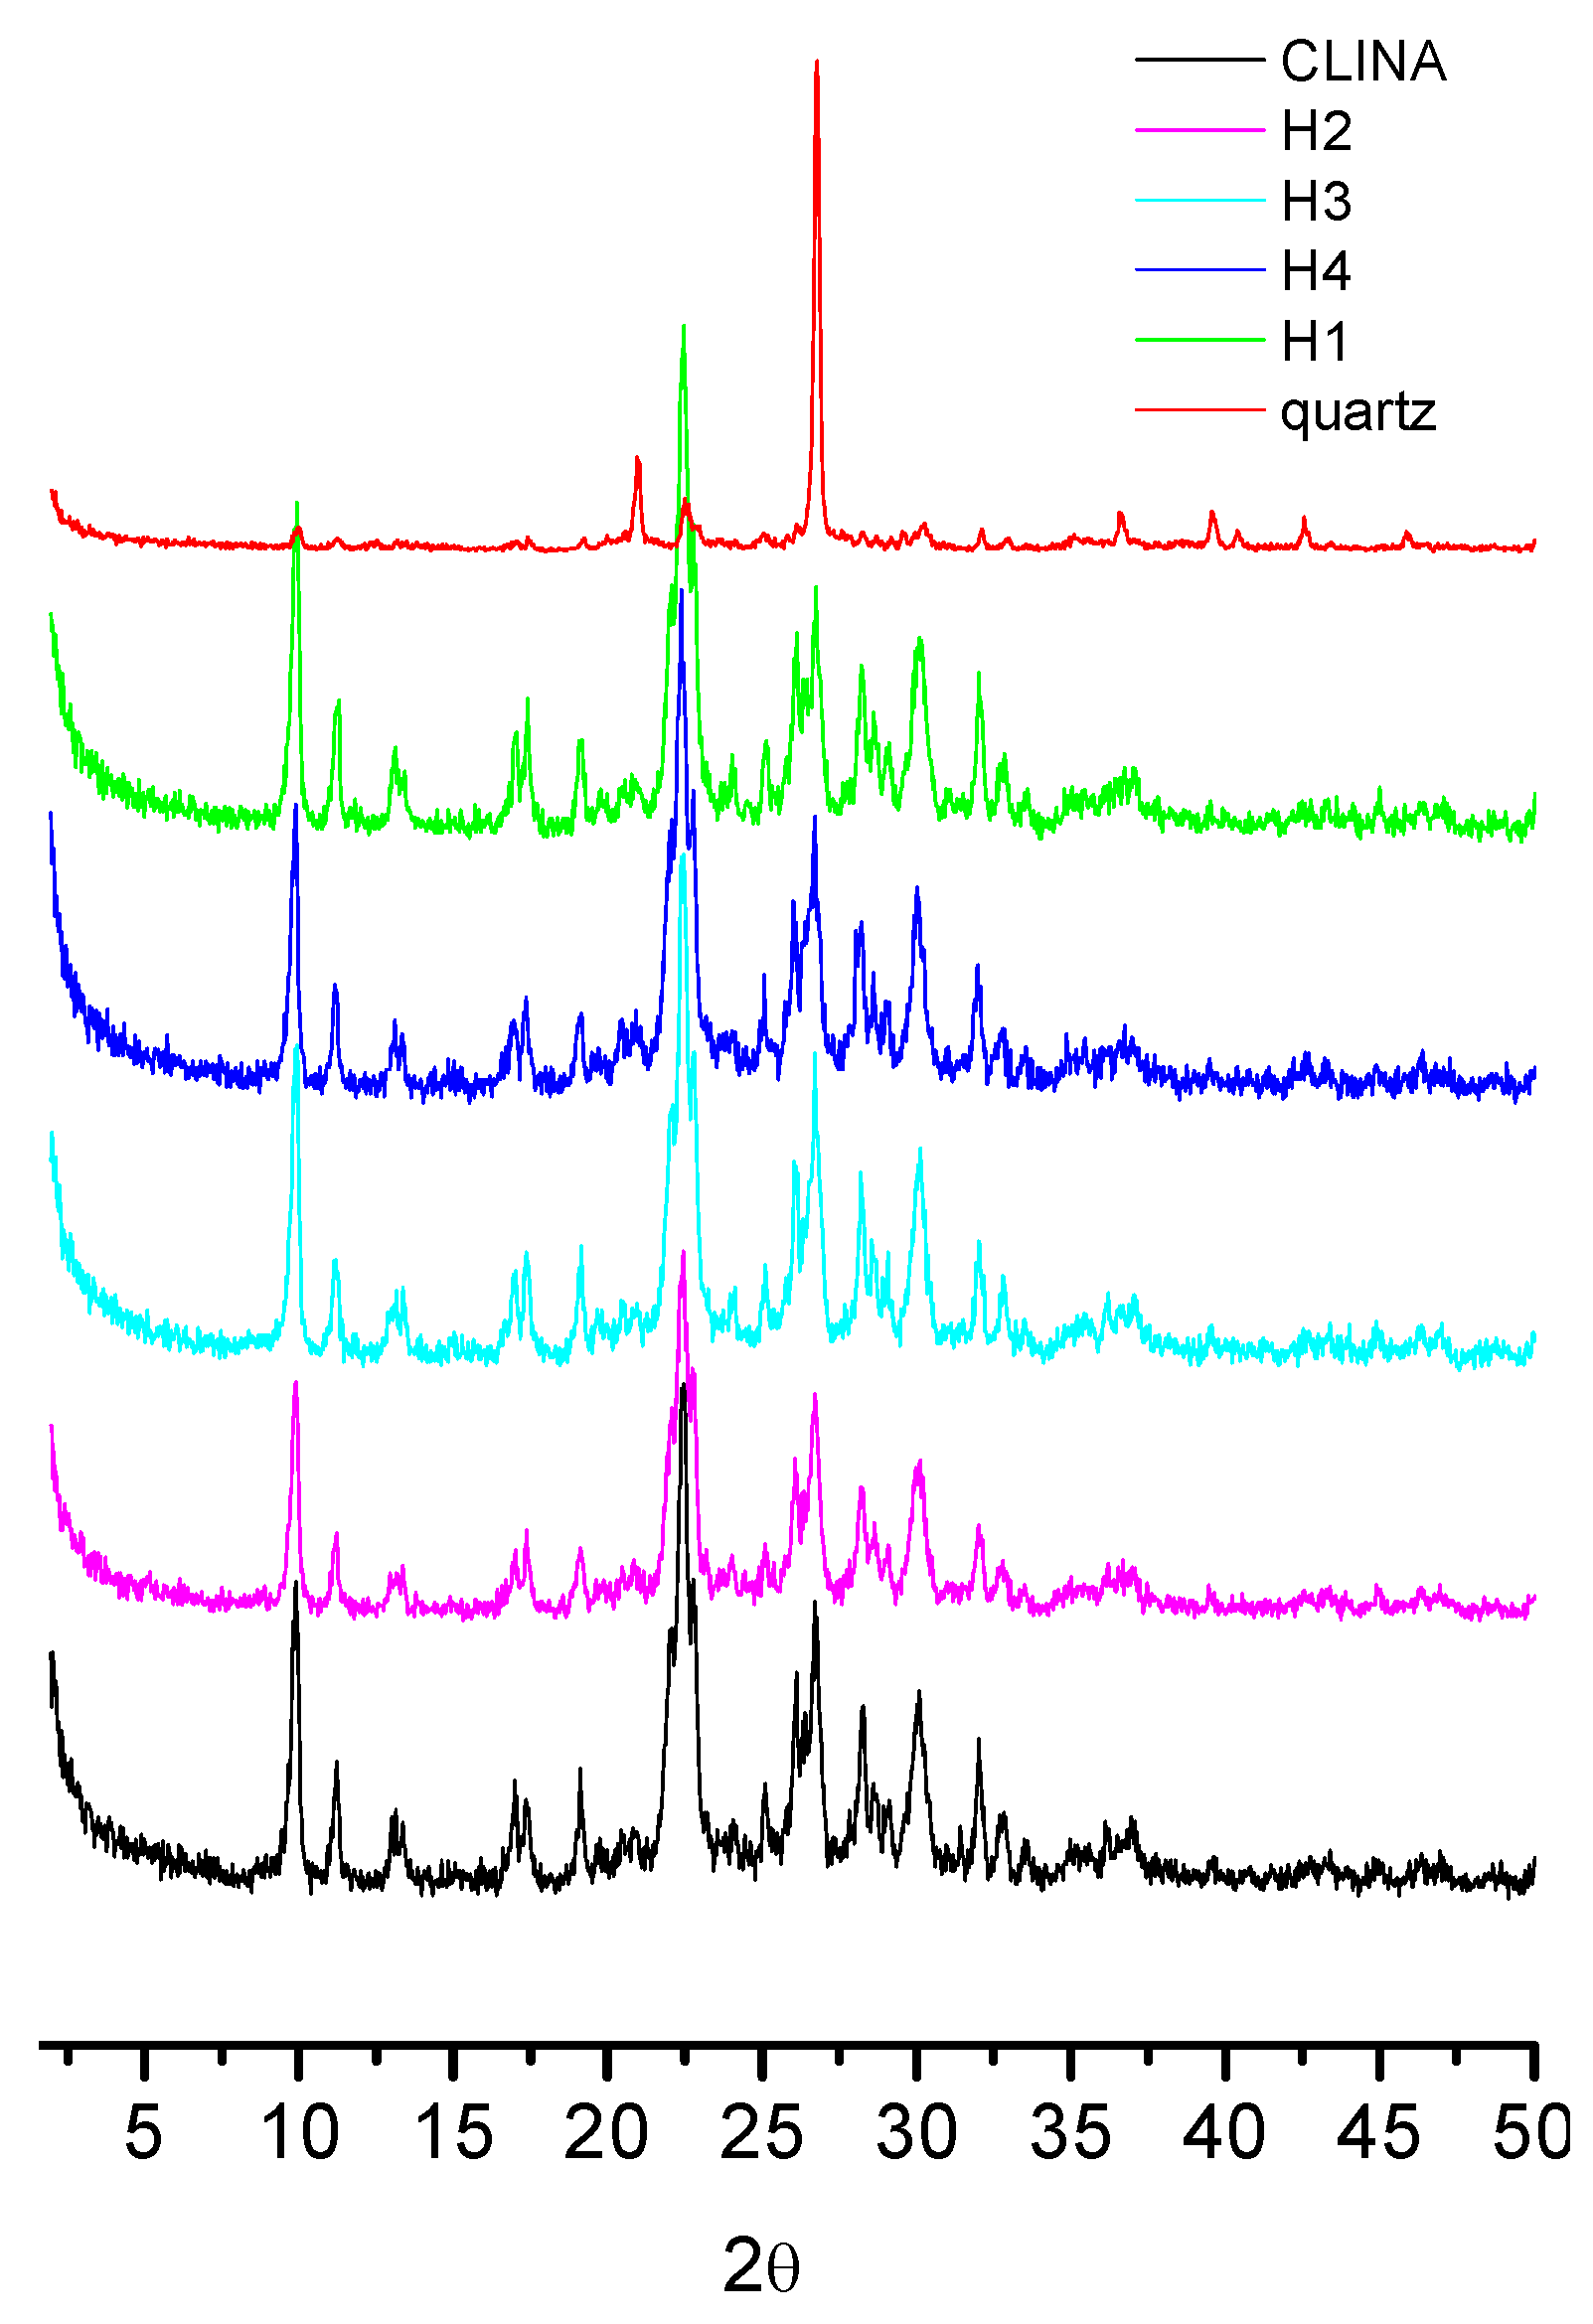
- The results shown indicate that the acid-modification procedure of zeolitic samples yielded an increase in the intensity of the peak corresponding to quartz. This behavior can be related to the progressive dealumination that the crystalline structure suffered as the number of acid treatments increased, while quartz moieties remained mostly unaffected by the HCl leaching action.
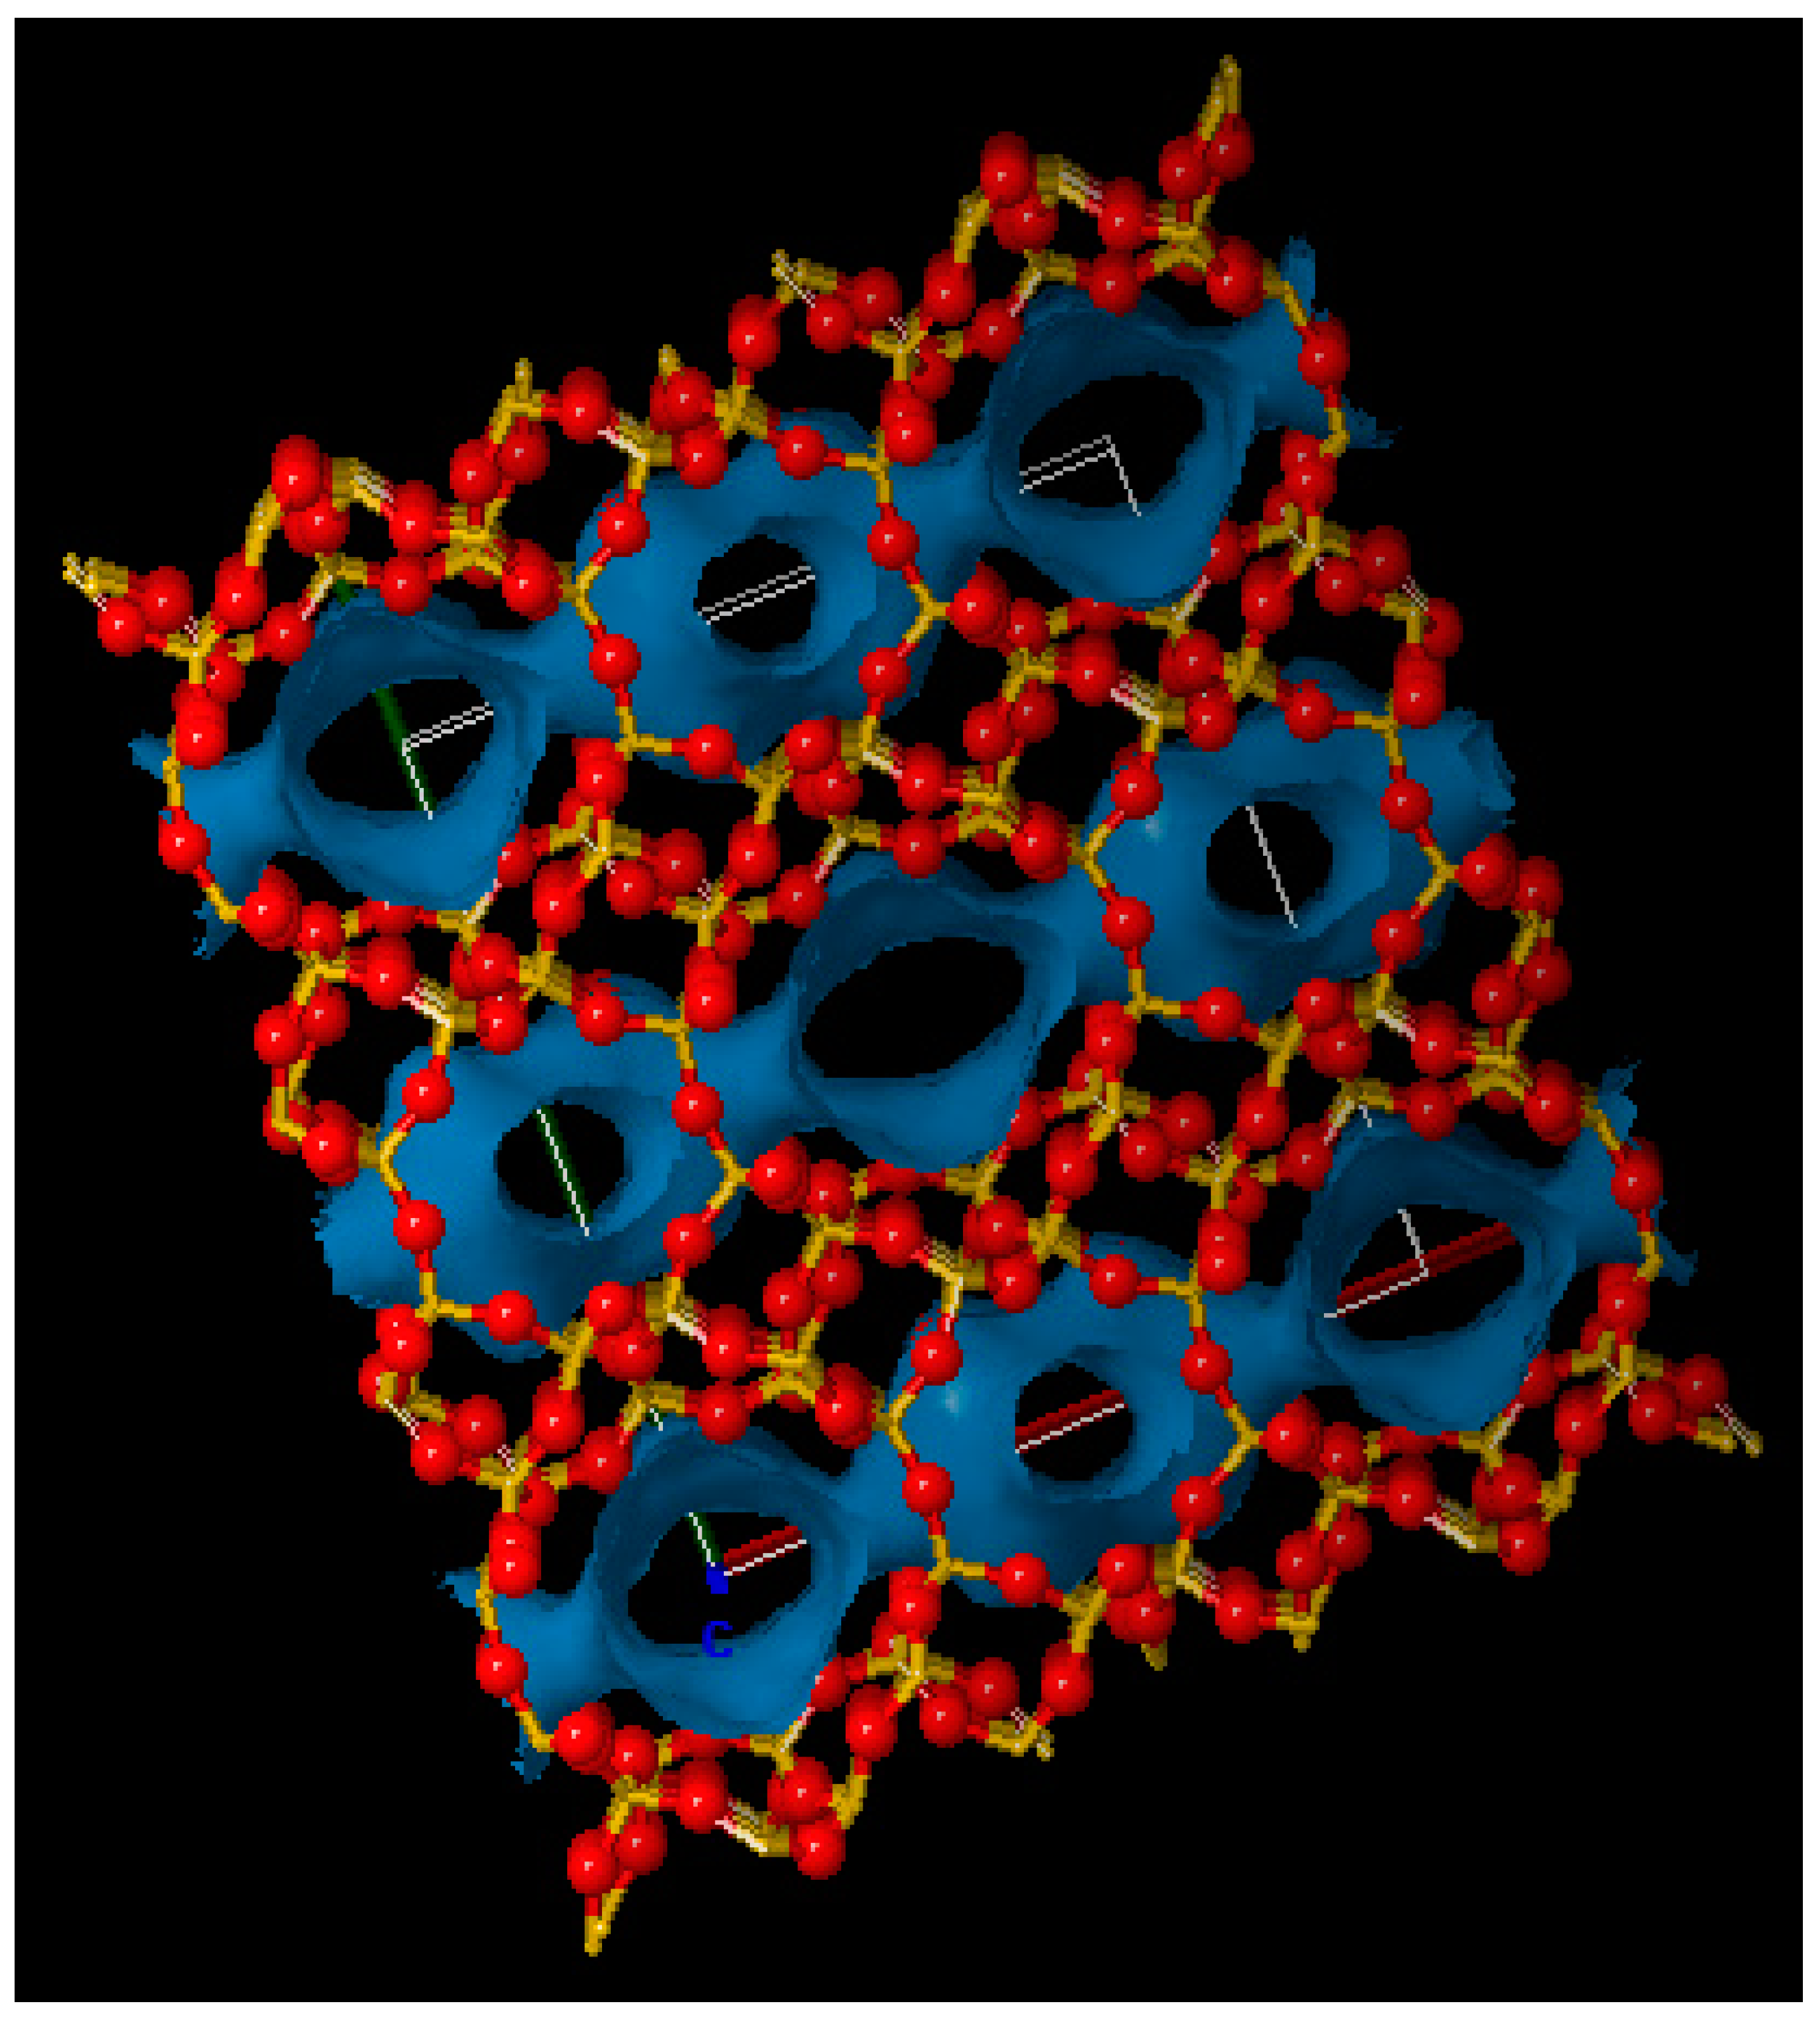
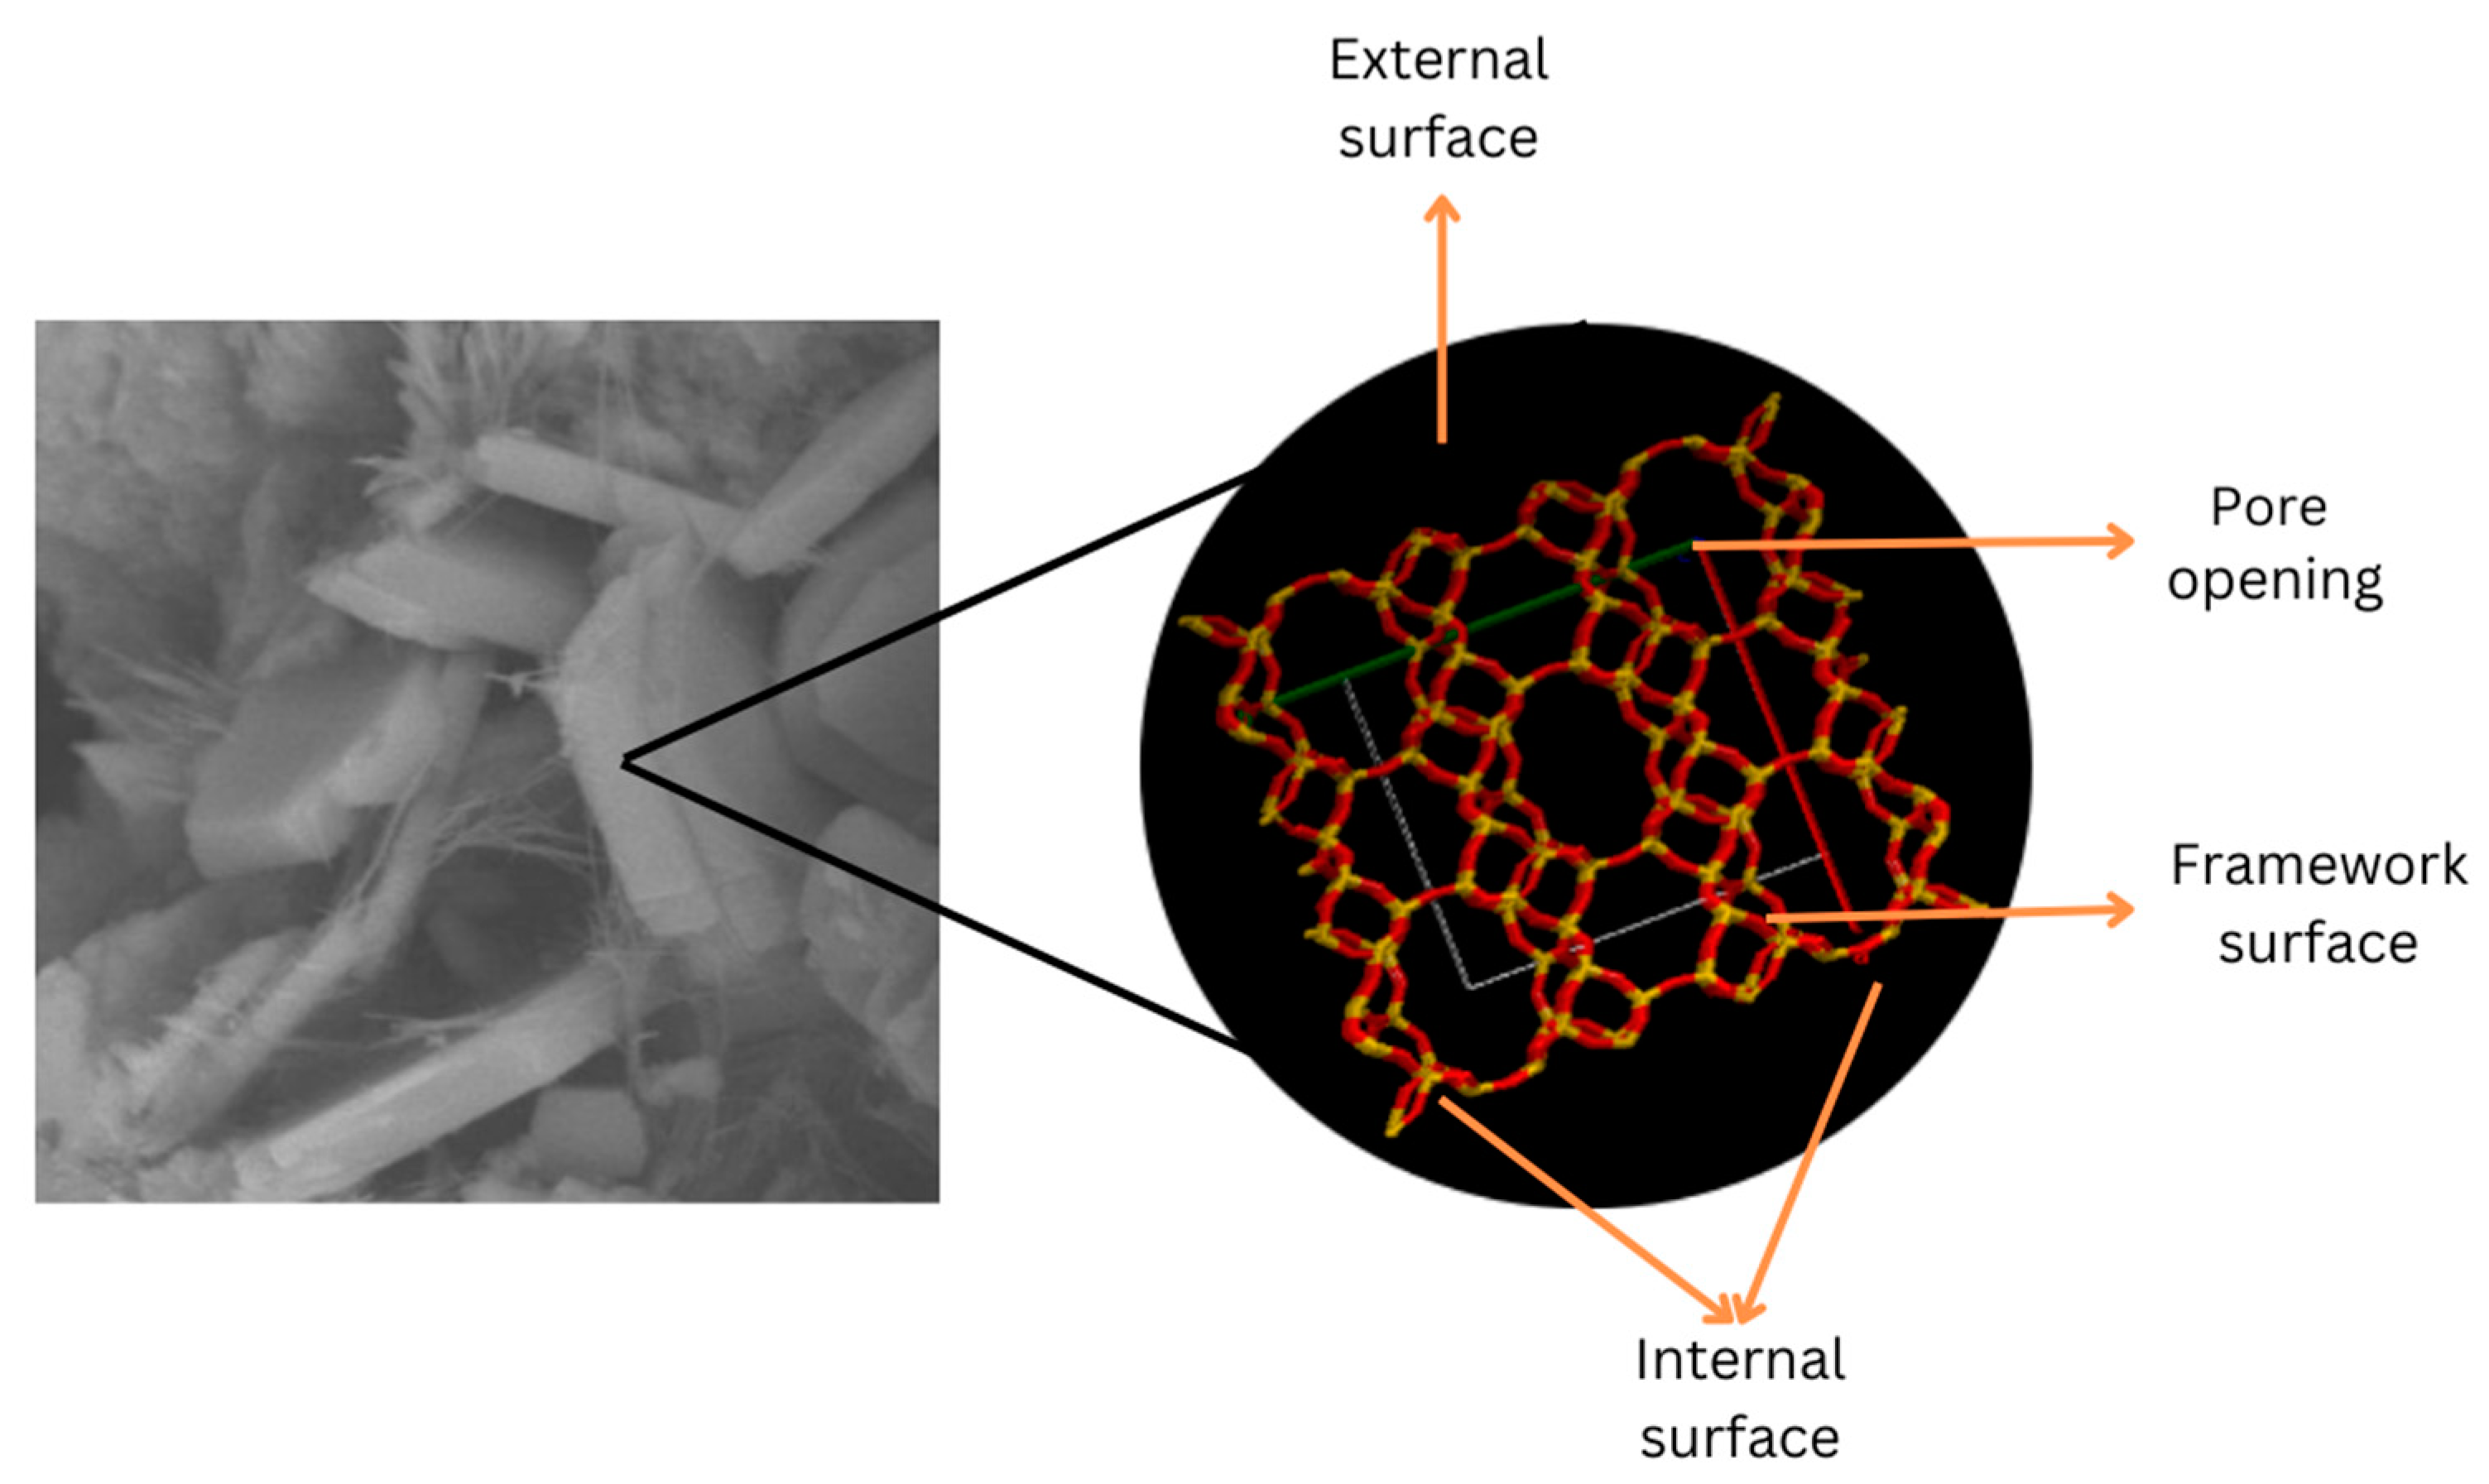
- Acid treatment of these high-silica natural clinoptilolites has rendered improved adsorbents via the mechanism of decationation and dealumination, and also by dissolution of any amorphous silica blocking the channels A, B and C of the clinoptilolite structure. The dealumination process is favored to a greater extent in sample H2.
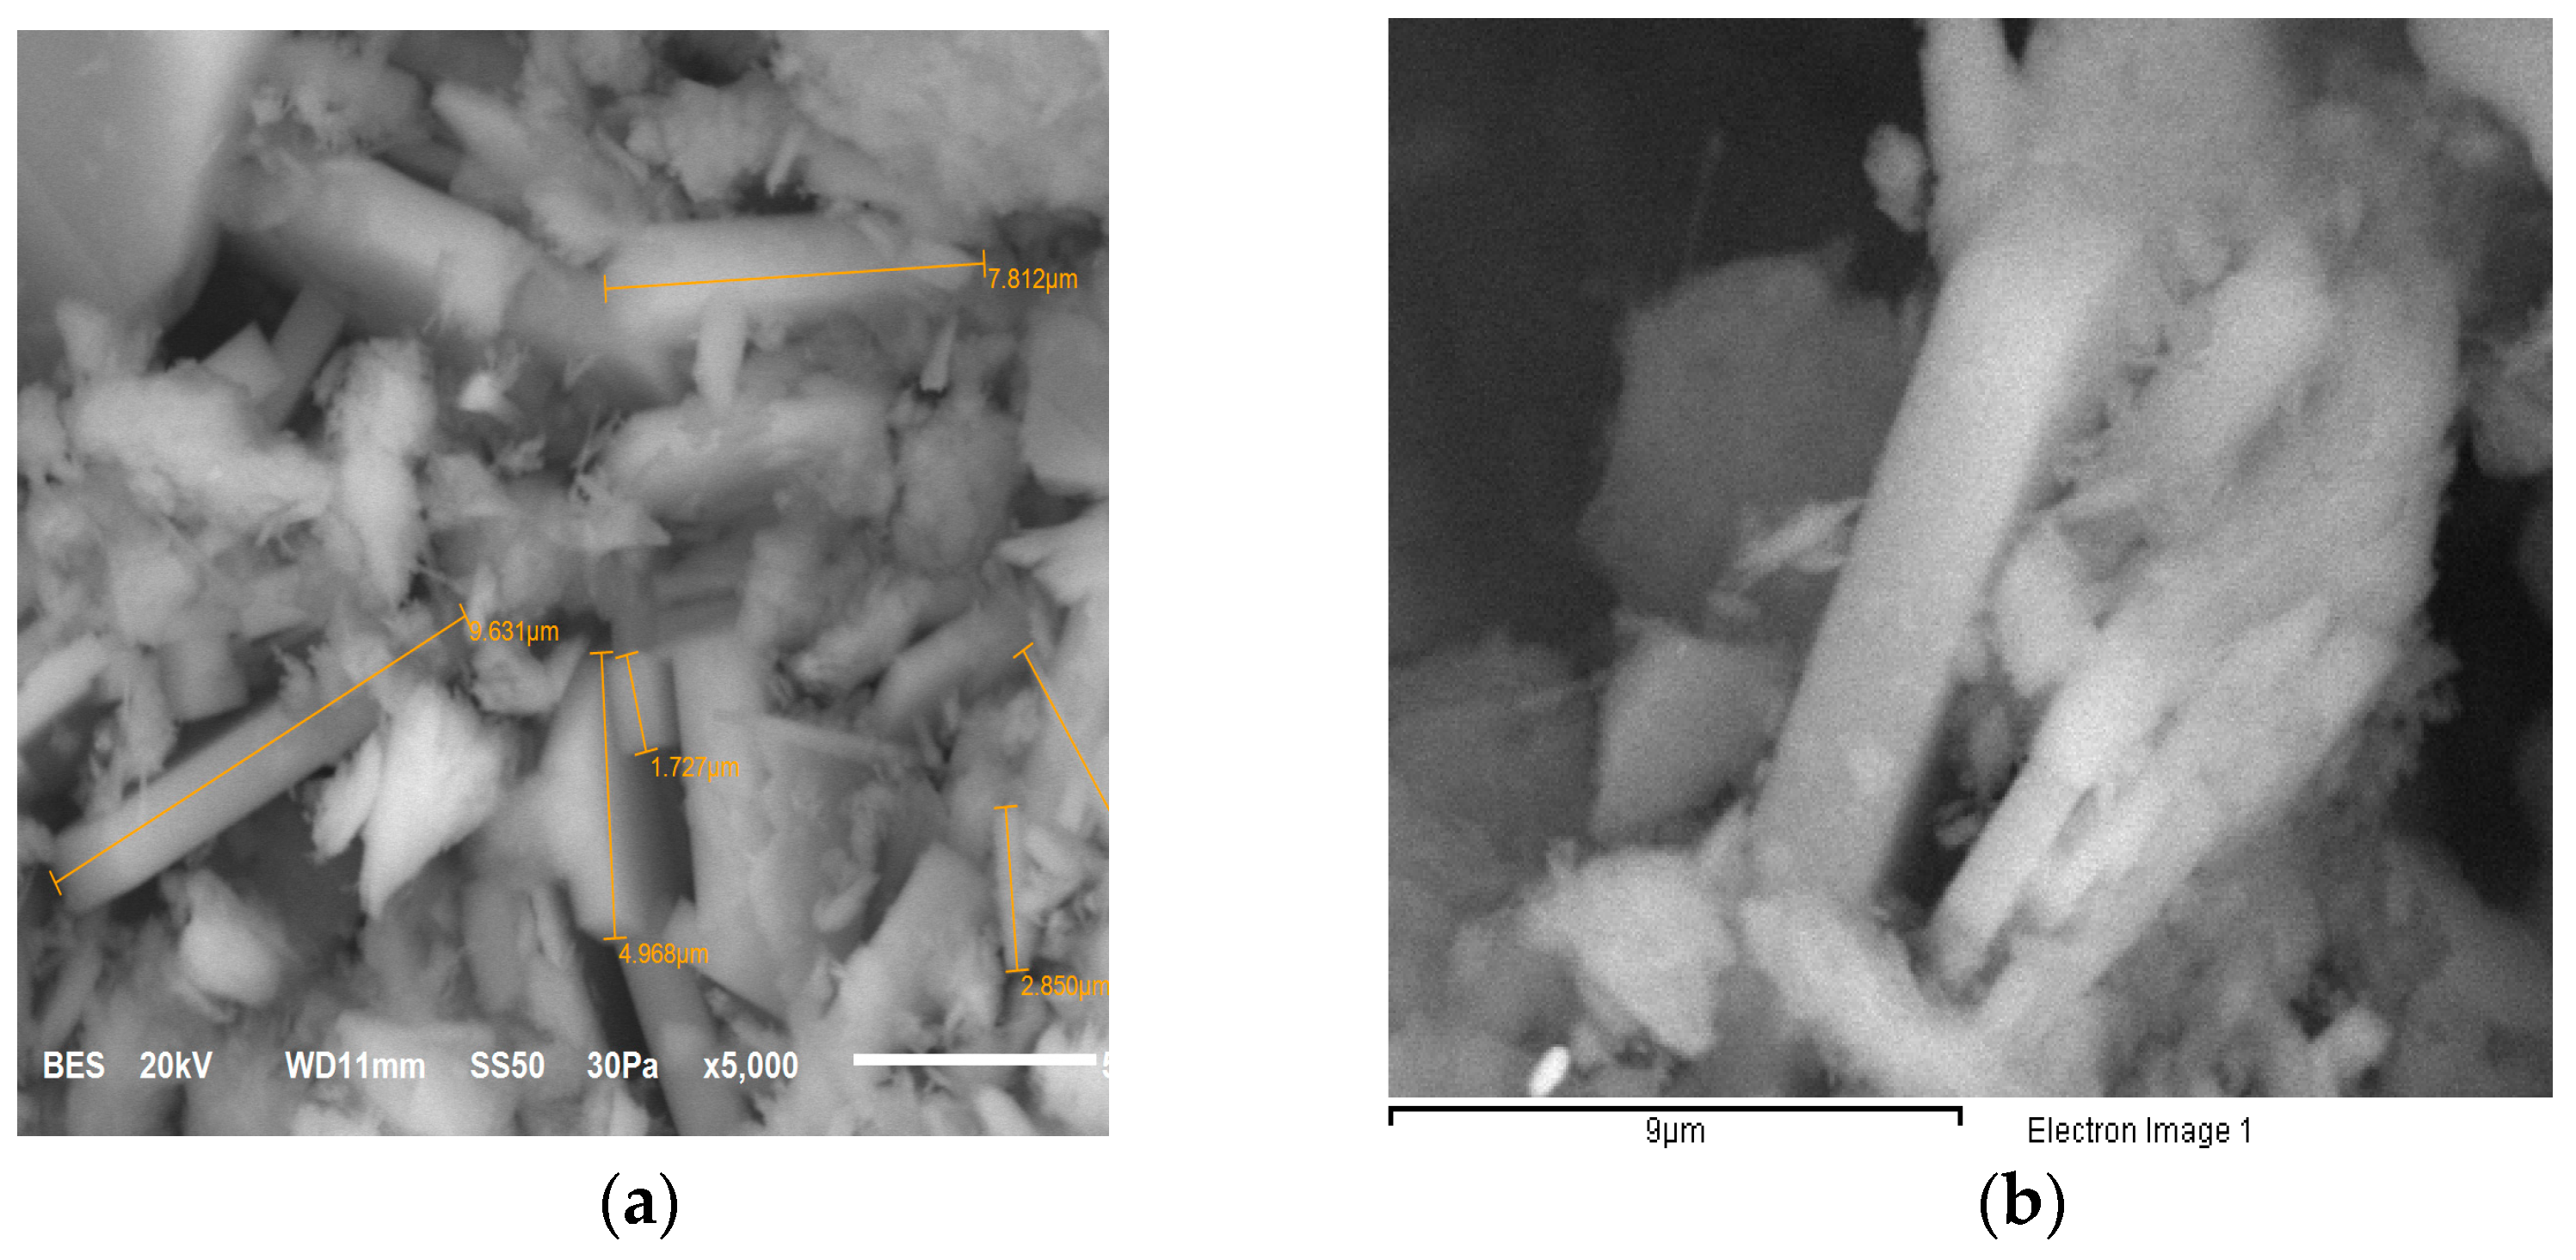
- The SEM of these zeolites shows us that the form of the obtained glasses of the CLINA zeolite presents a cubic symmetry with defined edges, and the crystals possess dimensions near to 2 µm.
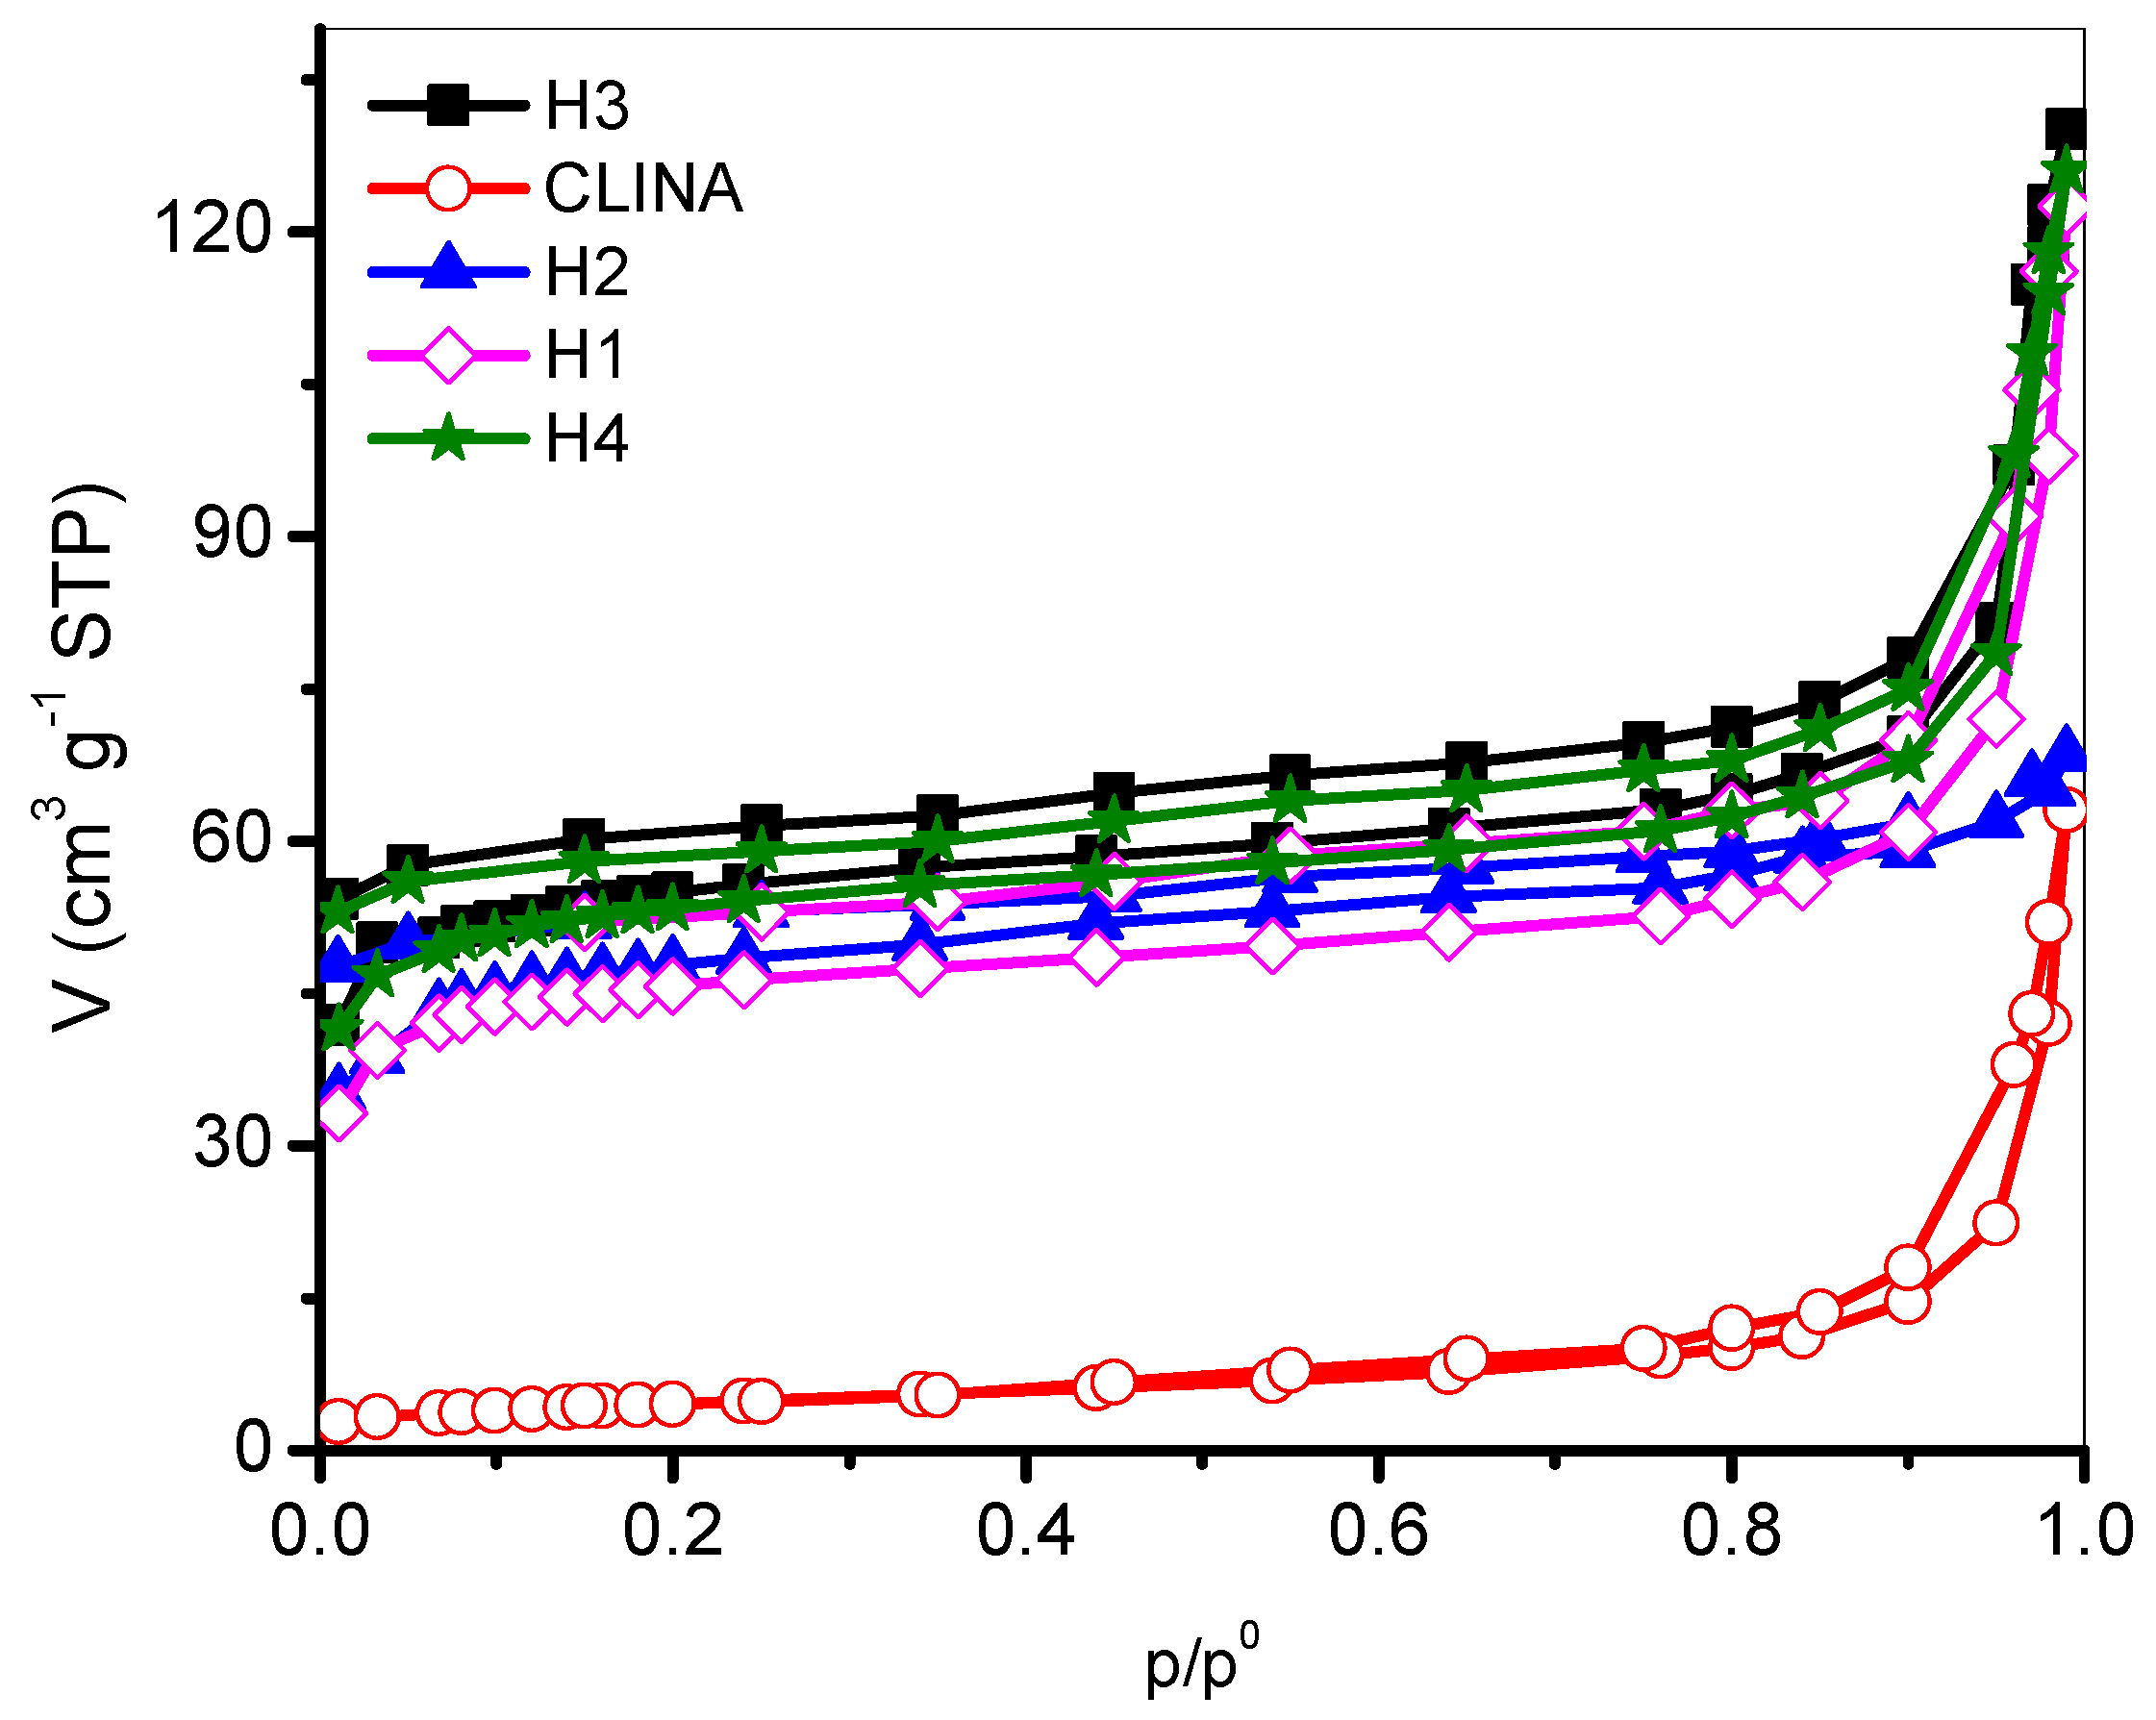
- The N2 adsorption isotherms at 77 K on CLINA and H zeolites tells us the evolution of the shapes of the N2 isotherms with respect to the number of HCl washings. Porosity studies indicate the formation of adsorption isotherms of mixed type I-IV isotherms with hysteresis cycles of type H3, which are characteristic of lamellar pores for decationated clinoptilolite, while an isotherm type II-IV is characteristic of natural zeolites. The isotherms for the decationated zeolites show low-pressure hysteresis, which indicates an irreversible intercalation of molecules in pores of comparable size to the adsorbate molecules, or a pore-blocking effect.
- The separation of these gases (in pure form and in a mixture) was studied and confronted, based on different models, establishing that in some cases inconsistencies occur due to diffusion and the size of the crystallites. When evaluating the degree of interaction of N2 and O2 in pure form by means of the Clausius–Clapeyron relation, results which were like those previously reported in zeolites of these characteristics were found.
Author Contributions
Funding
Acknowledgments
Conflicts of Interest
References
- Yang, X.; Epiepang, F.E.; Li, J.; Wei, Y.; Li, Y.; Yang, R.T. Sr-LSX zeolite for air separation. Chem. Eng. J. 2019, 362, 482–486. [Google Scholar] [CrossRef]
- Shokroo, E.J.; Farsani, D.J.; Meymandi, H.K.; Yadollahi, N. Comparative study of zeolite 5A and zeolite 13X in air separationby pressure swing adsorption. Korean J. Chem. Eng. 2016, 33, 1391–1401. [Google Scholar] [CrossRef]
- Bacsika, Z.; Cheunga, O.; Vasiliev, P.; Hedina, N. Selective separation of CO2 and CH4 for biogas upgrading on zeolite NaKA and SAPO-56. Appl. Energy 2016, 15, 613–621. [Google Scholar] [CrossRef]
- Tsitsihvili, G.V.; Andronikashvili, T.G.; Kirov, G.N.; Filizova, L.D. Natural Zeolites; Ellis Horwood Ltd.: Brighton, UK, 1992; pp. 100–120. [Google Scholar]
- Database of Zeolite Structures. Available online: http://www.iza-structure.org/databases/ (accessed on 13 November 2022).
- Mastinu, A.; Kumar, A.; Maccarinelli, G.; Bonini, S.A.; Premoli, M.; Aria, F.; Gianoncelli, A.; Memo, M. Zeolite clinoptilolite: Therapeutic virtues of an ancient mineral. Molecules 2019, 24, 1517. [Google Scholar] [CrossRef] [Green Version]
- Pavelic, S.K.; Simovic, J.; Gumbarevic, D.; Filoševic, A.; Pržulj, N.; Pavelic, K. Critical Review on Zeolite Clinoptilolite Safety and Medical Applications in vivo. Front. Pharmacol. 2018, 9, 1350. [Google Scholar] [CrossRef]
- Thommes, M.; Kaneko, K.; Neimark, A.; Olivier, J.; Rodríguez, F.; Rouquerol, J.; Sing, K. Physisorption of gases, with special reference to the evaluation of surface area and pore size distribution (IUPAC technical report). Pure Appl. Chem. 2015, 57, 1051–1069. [Google Scholar] [CrossRef] [Green Version]
- Rouquerol, F.; Rouquerol, J. Adsorption by Powders and Porous solids: Principles, Methodology and Applications, 2nd ed.; Academic Press: Amsterdam, The Netherlands, 2014; pp. 626–632. [Google Scholar]
- Chen, S.G.; Yang, R.T. Theoretical basis for the potential theory adsorption isotherms. The Dubinin-Radushkevich and Dubinin-Astakhov equations. Langmuir 1994, 10, 4244–4249. [Google Scholar] [CrossRef]
- Hernandez, M.A. El ABC de las Zeolitas Naturales en Mexico; Sextil Online; Publica por Gandhi: México, 2020; pp. 26–39. [Google Scholar]
- Mumpton, F.A. Reported occurrence of zeolites in sedimentary rocks of Mexico. Am. Mineral. 1960, 58, 287–290. [Google Scholar]
- Quiroz, K.; Hernandez, M.A.; Portillo, R.; Rojas, F.; Rubio, E.; Petranovskii, V. Comparación de la capacidad de secuestro de CO2 en Clinoptilolita, Epistilbita, Erionita, Mordenita y Caolinita como constituyentes del suelo. Superf. Y Vacío 2016, 29, 55–61. [Google Scholar]
- Hernandez, G.; Hernandez, M.A.; Portillo, R.; Salgado, M.A.; Rojas, F.; Petranovskii, V. Properties of Nano porosity of Clinoptilolite, Erionite, Epistilbite and Mordenite, natural zeolites from Mexico. In Proceedings of the 18th IZA Conference, Rio de Janeiro, Brazil, 19–24 June 2016; CD edition. pp. 84–85. [Google Scholar]
- Hernandez, G.I.; Hernandez, M.A.; Portillo, R.; Petranovskii, V.; Pestryakov, A.; Rubio, E. Hierarchical structure of nanoporosity of Mexican natural zeolites of clinoptilolite type. Bull. Tomsk. Polytech. Univ. Geo Assets Eng. 2018, 329, 107–117. [Google Scholar]
- Hernández, M.A.; Rojas, F.; Portillo, R.; Salgado, M.A. Nanoporosity and differential adsorption curves in clinoptilolite zeolites from Mexico. In Proceedings of the 10th International Conference on the Occurrence, Properties and Utilization of Natural Zeolites, Kracovia, Poland, 24–29 June 2018; pp. 47–49. [Google Scholar]
- Hernandez, V.A.; Hernandez, M.A.; Quiroz, K.F. Evaluation of nanopore size distribution by adsorption differential curves of clinoptilolite zeolites chemically modified. Mex. J. Mat. Sci. Eng. 2016, 3, 49–53. [Google Scholar] [CrossRef]
- Diaz, E.; Ordoñez, S.; Vega, A.; Coca, L. Adsorption characterization of different volatile organic compounds over alumina, zeolites and activated carbon using gas chromatography. J. Chromatogr. A 2009, 1049, 139–146. [Google Scholar] [CrossRef] [PubMed]
- Burton, A.W.; Ong, K.; Rea, T.; Chan, Y.I. On the estimation of average crystallite of zeolites from Sherrer’s equation: A critical evaluation of its application to zeolites with one-dimensional pore system. Microporous Mesoporous Mater. 2009, 117, 75–90. [Google Scholar] [CrossRef]
- Sprynskyy, M.; Golembiewski, R.; Trykowski, G.; Buszewski, B. Heterogeneity, and hierarchy of clinoptilolita porosity. J. Phys. Chem. Solids 2010, 71, 1269–1277. [Google Scholar] [CrossRef]
- Breck, D.W. Zeolite Molecular Sieves: Structure, Chemistry and Use; John Wiley & Sons Inc.: New York, NY, USA, 1984; pp. 77–78. [Google Scholar]
- Storch de Gracia, J.M. Fundamentos de la Cromatografía de Gases; Alhambra: Madrid, Spain, 1975. [Google Scholar]
- Reid, R.C.; Prausnitz, J.M.; Sherwood, T.K. The Properties of Gases and Liquids; McGraw-Hill: New York, NY, USA, 1977. [Google Scholar]
- Ackley, M.W.; Rege, S.U.; Saxena, H. Application of natural zeolites in the purification and separation of gases. Microporous Mesoporous Mater. 2003, 61, 25–42. [Google Scholar] [CrossRef]
- Quiroz, K.; Hernandez, M.A.; Mendoza, C.F.; Santamaría, D.; Petranovskii, V. Critical pore admission temperature through nanopores of exchanged ERI zeolites at low levels of coverage. Nanomaterials 2019, 9, 160. [Google Scholar] [CrossRef] [PubMed] [Green Version]
- Hernández, M.A.; Corona, L.; Gonzalez, A.I.; Rojas, F.; Lara, V.H.; Silva, F. Quantitative Study of the Adsorption of Aromatic Hydrocarbons (Benzene, Toluene, and p-Xylene) on Dealuminated Clinoptilolites. Ind. Eng. Chem. Res. 2005, 44, 2908–2916. [Google Scholar] [CrossRef]
- Wong-Nga, W.; Kaduk, J.A.; Huang, Q.; Espinal, L.; Lid, L.; Burresse, J.W. Investigation of NaY Zeolite with adsorbed CO2 by neutron powder diffraction. Microporous Mesoporous Mater. 2013, 172, 95–104. [Google Scholar] [CrossRef]
- Hernandez, M.A.; Rojas, F.; Lara, V.H. N2 adsorption Nitrogen-Sorption Characterization of the Microporous Structurof Clinoptilolite-Type Zeolites. J. Porous Mater. 2000, 7, 443–454. [Google Scholar] [CrossRef]


| Gas | B. P. °C | Crit. Temp. °C | Quadrupole A3 | Polarizability A3 | Ion. Pot. Volts | Length Å | Width Å | σ-Kinetic Diameter, Å |
|---|---|---|---|---|---|---|---|---|
| O2 | −183 | −118.8 | 0.10 | 1.2 | 12.5 | 2 | 1.4 | 3.46 |
| N2 | −195.8 | −147.1 | 0.31 | 1.4 | 15.5 | 2.1 | 1.5 | 3.64 |
| Samples | Size of the Crystal nm |
|---|---|
| CLINA | 25.86 |
| H1 | 12.41 |
| H2 | 15.66 |
| H3 | 15.12 |
| H4 | 12.41 |
| Sample | SiO2 | Al2O3 | Fe2O3 | CaO | MgO | Na2O | K2O | TiO2 | CrO2 | Si/Al |
|---|---|---|---|---|---|---|---|---|---|---|
| CLINA | 67.07 | 11.31 | 1.21 | 3.75 | 0.68 | 2.90 | 0.52 | ------ | ----- | 5.22 |
| H1 | 38.59 | 9.63 | 6.51 | 0.853 | 1.84 | ----- | 1.83 | ------ | ----- | 4.00 |
| H2 | 72.27 | 13.46 | 10.43 | 3.106 | 1.85 | 3.34 | 4.79 | 0.63 | ----- | 5.36 |
| H3 | 40.27 | 7.66 | 4.57 | 3.106 | 1.85 | ------- | 2.24 | 1.36 | ----- | 5.25 |
| H4 | 82.95 | 8.99 | 2.59 | 0.783 | 1.42 | ------- | 3.37 | 0.91 | 0.29 | 9.22 |
| Zeolite | AsL m2/g | AsB m2/g | CB | VΣ cm3 g−1 |
|---|---|---|---|---|
| CLINA | 27 | 18 | 201 | 0.035 |
| H1 | 32 | 21 | 147 | 0.084 |
| H2 | 62 | 46 | −200 | 0.105 |
| H3 | 149 | 97 | −51 | 0.153 |
| H4 | 183 | 120 | −45 | 0.154 |
| Sample | am (N2) | am(O2) | KL(N2) | KL(O2) | KH(N2) | KH(O2) | α0 |
|---|---|---|---|---|---|---|---|
| H1 | 0.4799 | 0.7358 | 6.61 | 1.52 | 3.172 | 1.118 | 2.837 |
| H2 | 0.5416 | 0.668 | 4.87 | 1.61 | 2.637 | 1.075 | 2.453 |
| H3 | 0.5407 | 0.842 | 6.14 | 1.63 | 3.319 | 1.373 | 2.417 |
| H4 | 0.647 | 0.858 | 4.026 | 1.505 | 2.605 | 1.292 | 2.016 |
| Sample | N2 | O2 | Y1 | Y2 | α1 |
|---|---|---|---|---|---|
| H1 | 0.194 | 0.094 | 0.493 | 0.506 | 2.39 |
| H2 | 0.176 | 0.091 | 0.523 | 0.476 | 2.12 |
| H3 | 0.201 | 0.115 | 0.543 | 0.456 | 1.96 |
| H4 | 0.183 | 0.100 | 0.543 | 0.456 | 1.96 |
| Sample | α0 | α1 | α2 | α3 |
|---|---|---|---|---|
| H1 | 2.837 | 2.39 | 2.864 | 2.111 |
| H2 | 2.453 | 2.12 | 2.58 | 2.769 |
| H3 | 2.417 | 1.96 | 2.42 | 2.182 |
| H4 | 2.016 | 1.96 | 2.36 | 2.20 |
| Sample | qst (N2) | qst (O2) | qN (N2) | qN (O2) | α4 |
|---|---|---|---|---|---|
| N | 0.406 | 0.741 | −0.927 | −0.889 | 0.547 |
| H1 | 3.395 | 1.009 | 2.062 | −0.621 | 3.364 |
| H2 | 3.105 | 1.081 | 1.772 | −0.549 | 2.872 |
| H3 | 3.160 | 1.118 | 1.827 | −0.512 | 2.826 |
| H4 | 2.824 | 0.675 | 1.491 | −0.955 | 4.183 |
Disclaimer/Publisher’s Note: The statements, opinions and data contained in all publications are solely those of the individual author(s) and contributor(s) and not of MDPI and/or the editor(s). MDPI and/or the editor(s) disclaim responsibility for any injury to people or property resulting from any ideas, methods, instructions or products referred to in the content. |
© 2023 by the authors. Licensee MDPI, Basel, Switzerland. This article is an open access article distributed under the terms and conditions of the Creative Commons Attribution (CC BY) license (https://creativecommons.org/licenses/by/4.0/).
Share and Cite
Hernández, M.Á.; Hernández, G.I.; Portillo, R.I.; Velasco, M.d.l.Á.; Santamaría-Juárez, J.D.; Rubio, E.; Petranovskii, V. Influence of Chemical Pretreatment on the Adsorption of N2 and O2 in Ca-Clinoptilolite. Separations 2023, 10, 130. https://doi.org/10.3390/separations10020130
Hernández MÁ, Hernández GI, Portillo RI, Velasco MdlÁ, Santamaría-Juárez JD, Rubio E, Petranovskii V. Influence of Chemical Pretreatment on the Adsorption of N2 and O2 in Ca-Clinoptilolite. Separations. 2023; 10(2):130. https://doi.org/10.3390/separations10020130
Chicago/Turabian StyleHernández, Miguel Ángel, Gabriela I. Hernández, Roberto Ignacio Portillo, Ma de los Ángeles Velasco, Juana Deisy Santamaría-Juárez, Efraín Rubio, and Vitalii Petranovskii. 2023. "Influence of Chemical Pretreatment on the Adsorption of N2 and O2 in Ca-Clinoptilolite" Separations 10, no. 2: 130. https://doi.org/10.3390/separations10020130