
The Potential of Membrane Contactors in the Pre-Treatment and Post-Treatment Lines of a Reverse Osmosis Desalination Plant

Abstract
:
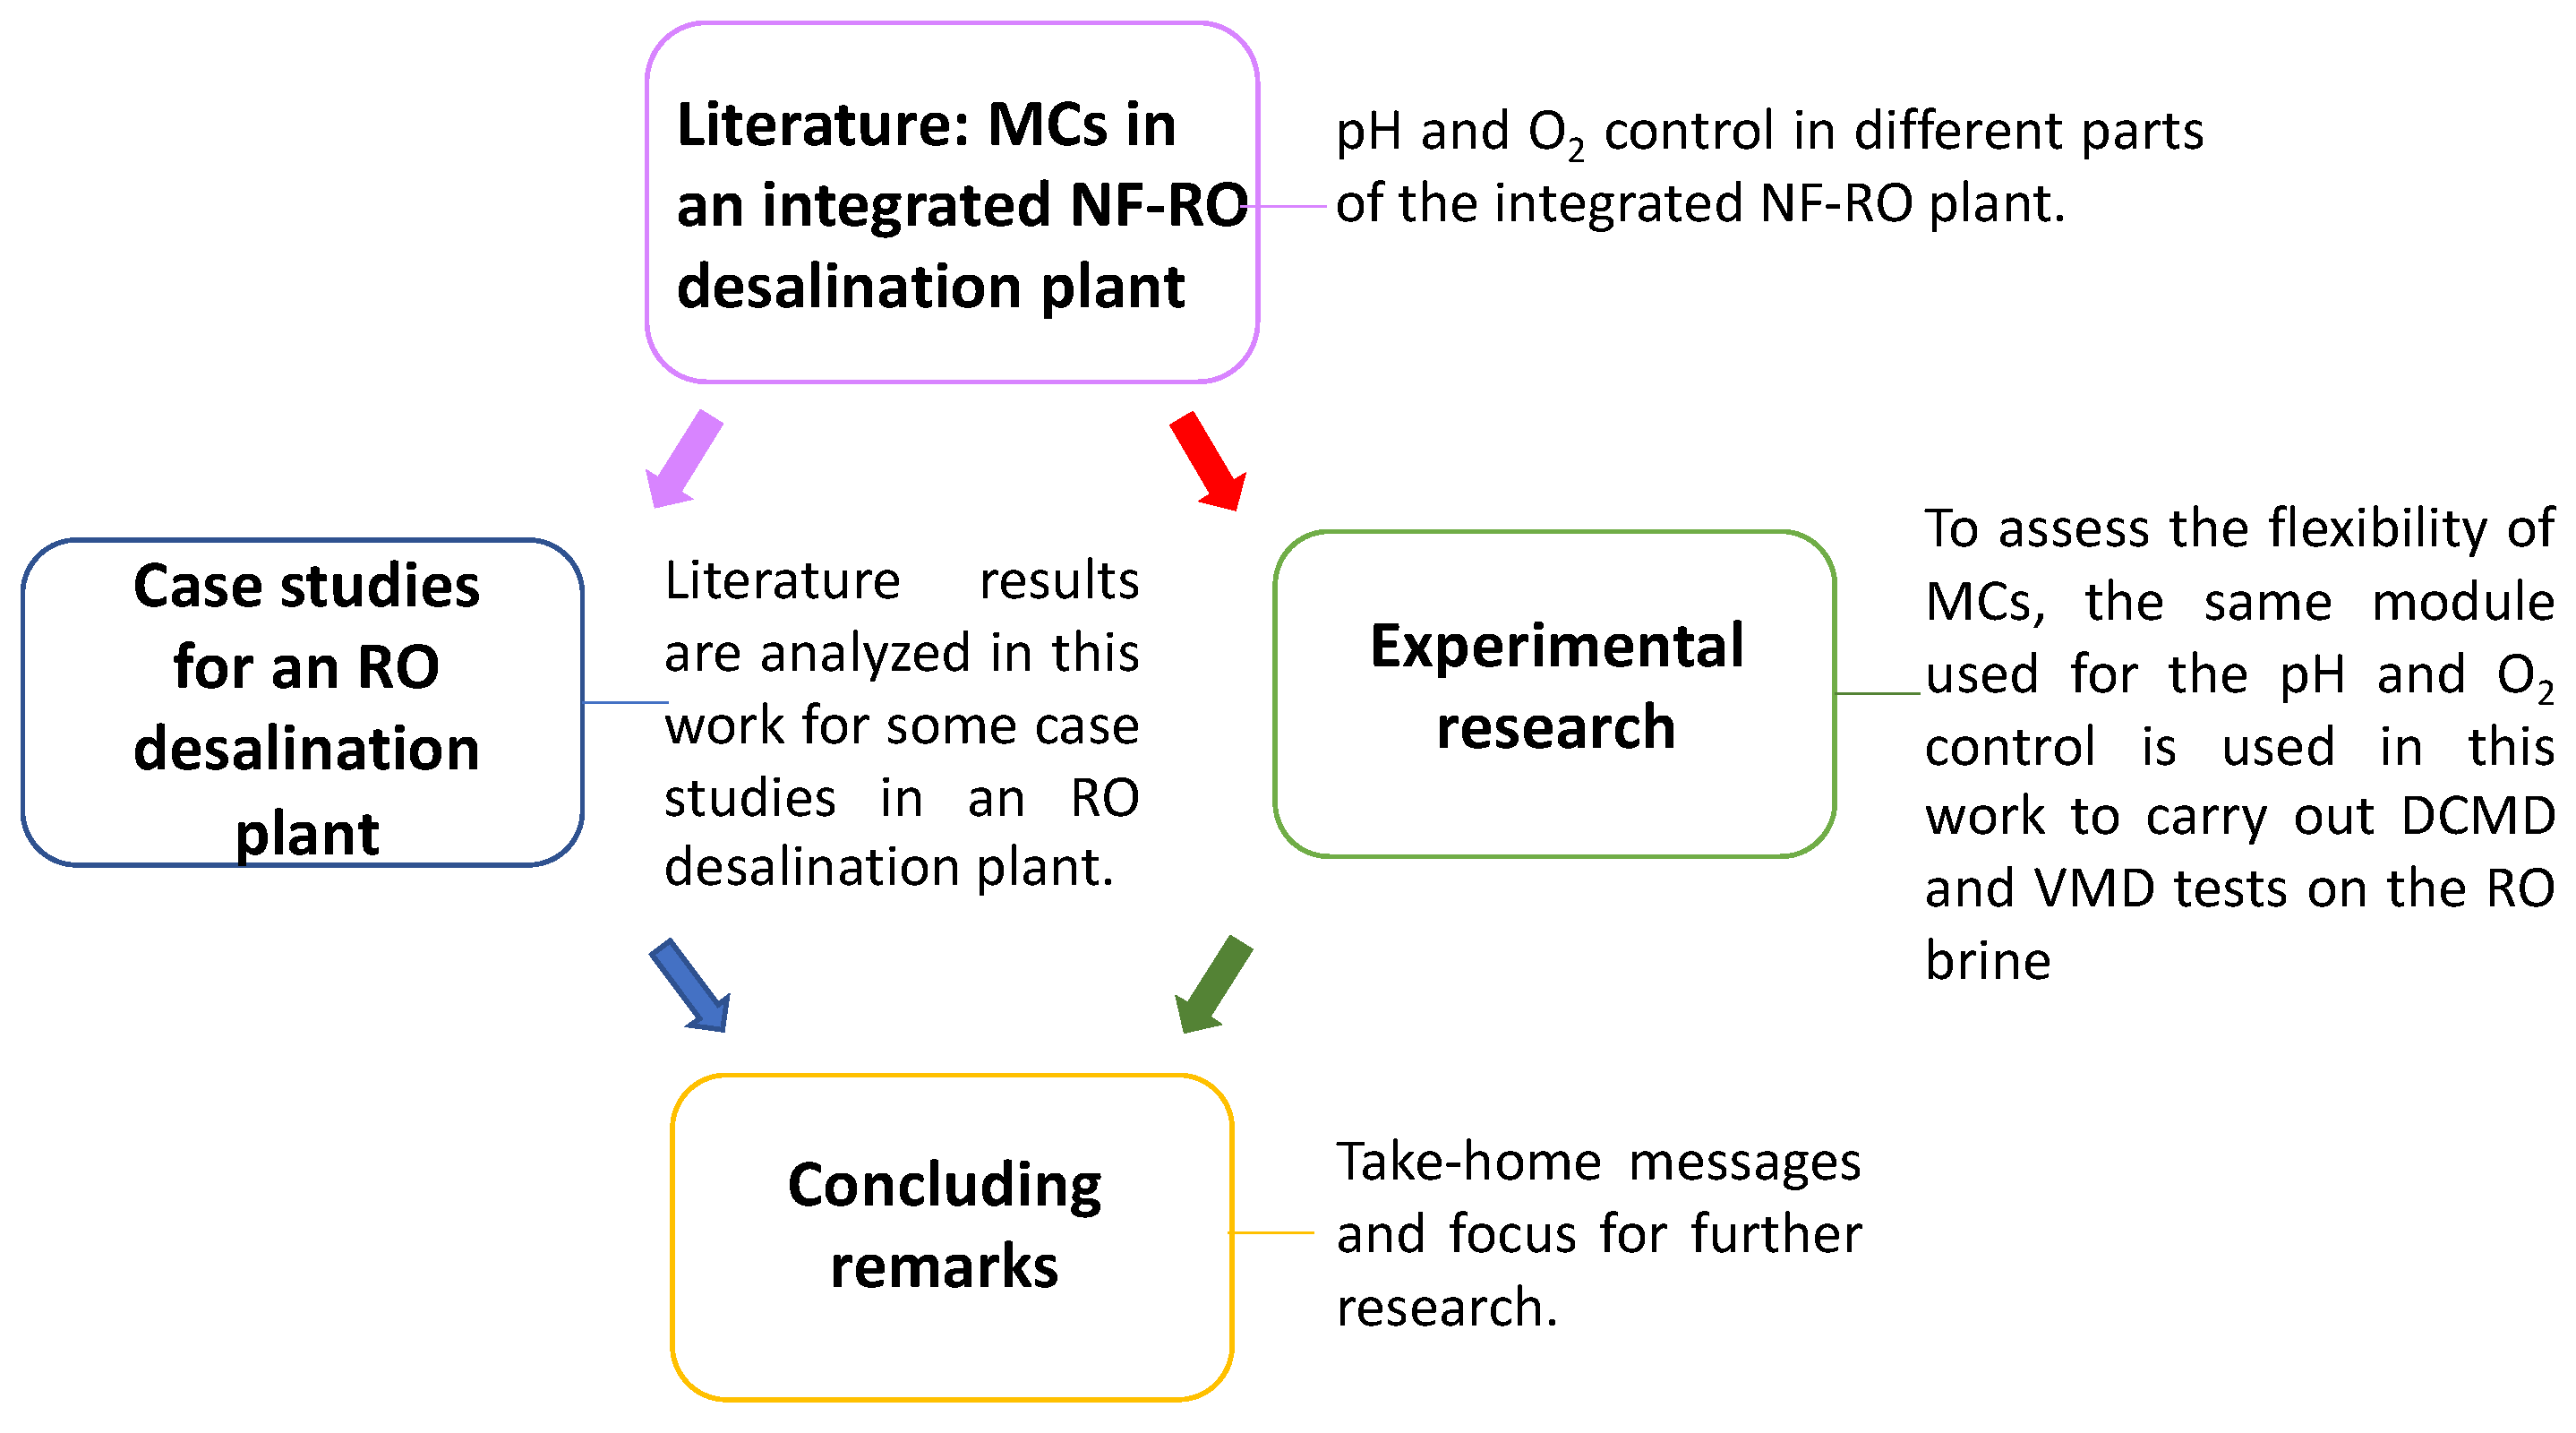
1. Introduction
2. Materials and Methods
2.1. Gas-Liquid Operation
2.1.1. Gas-Liquid Set-Up
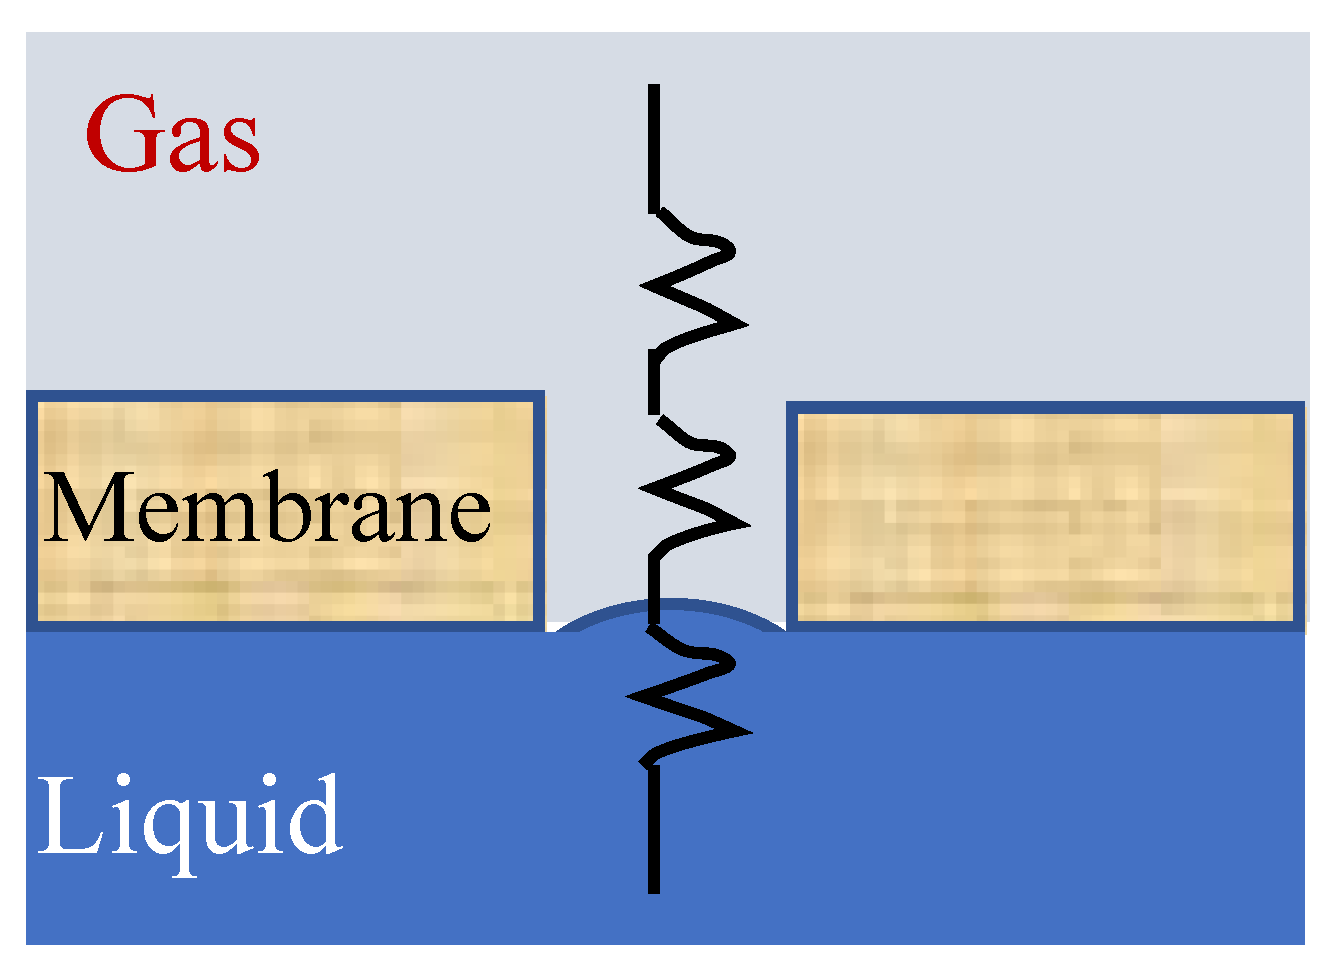
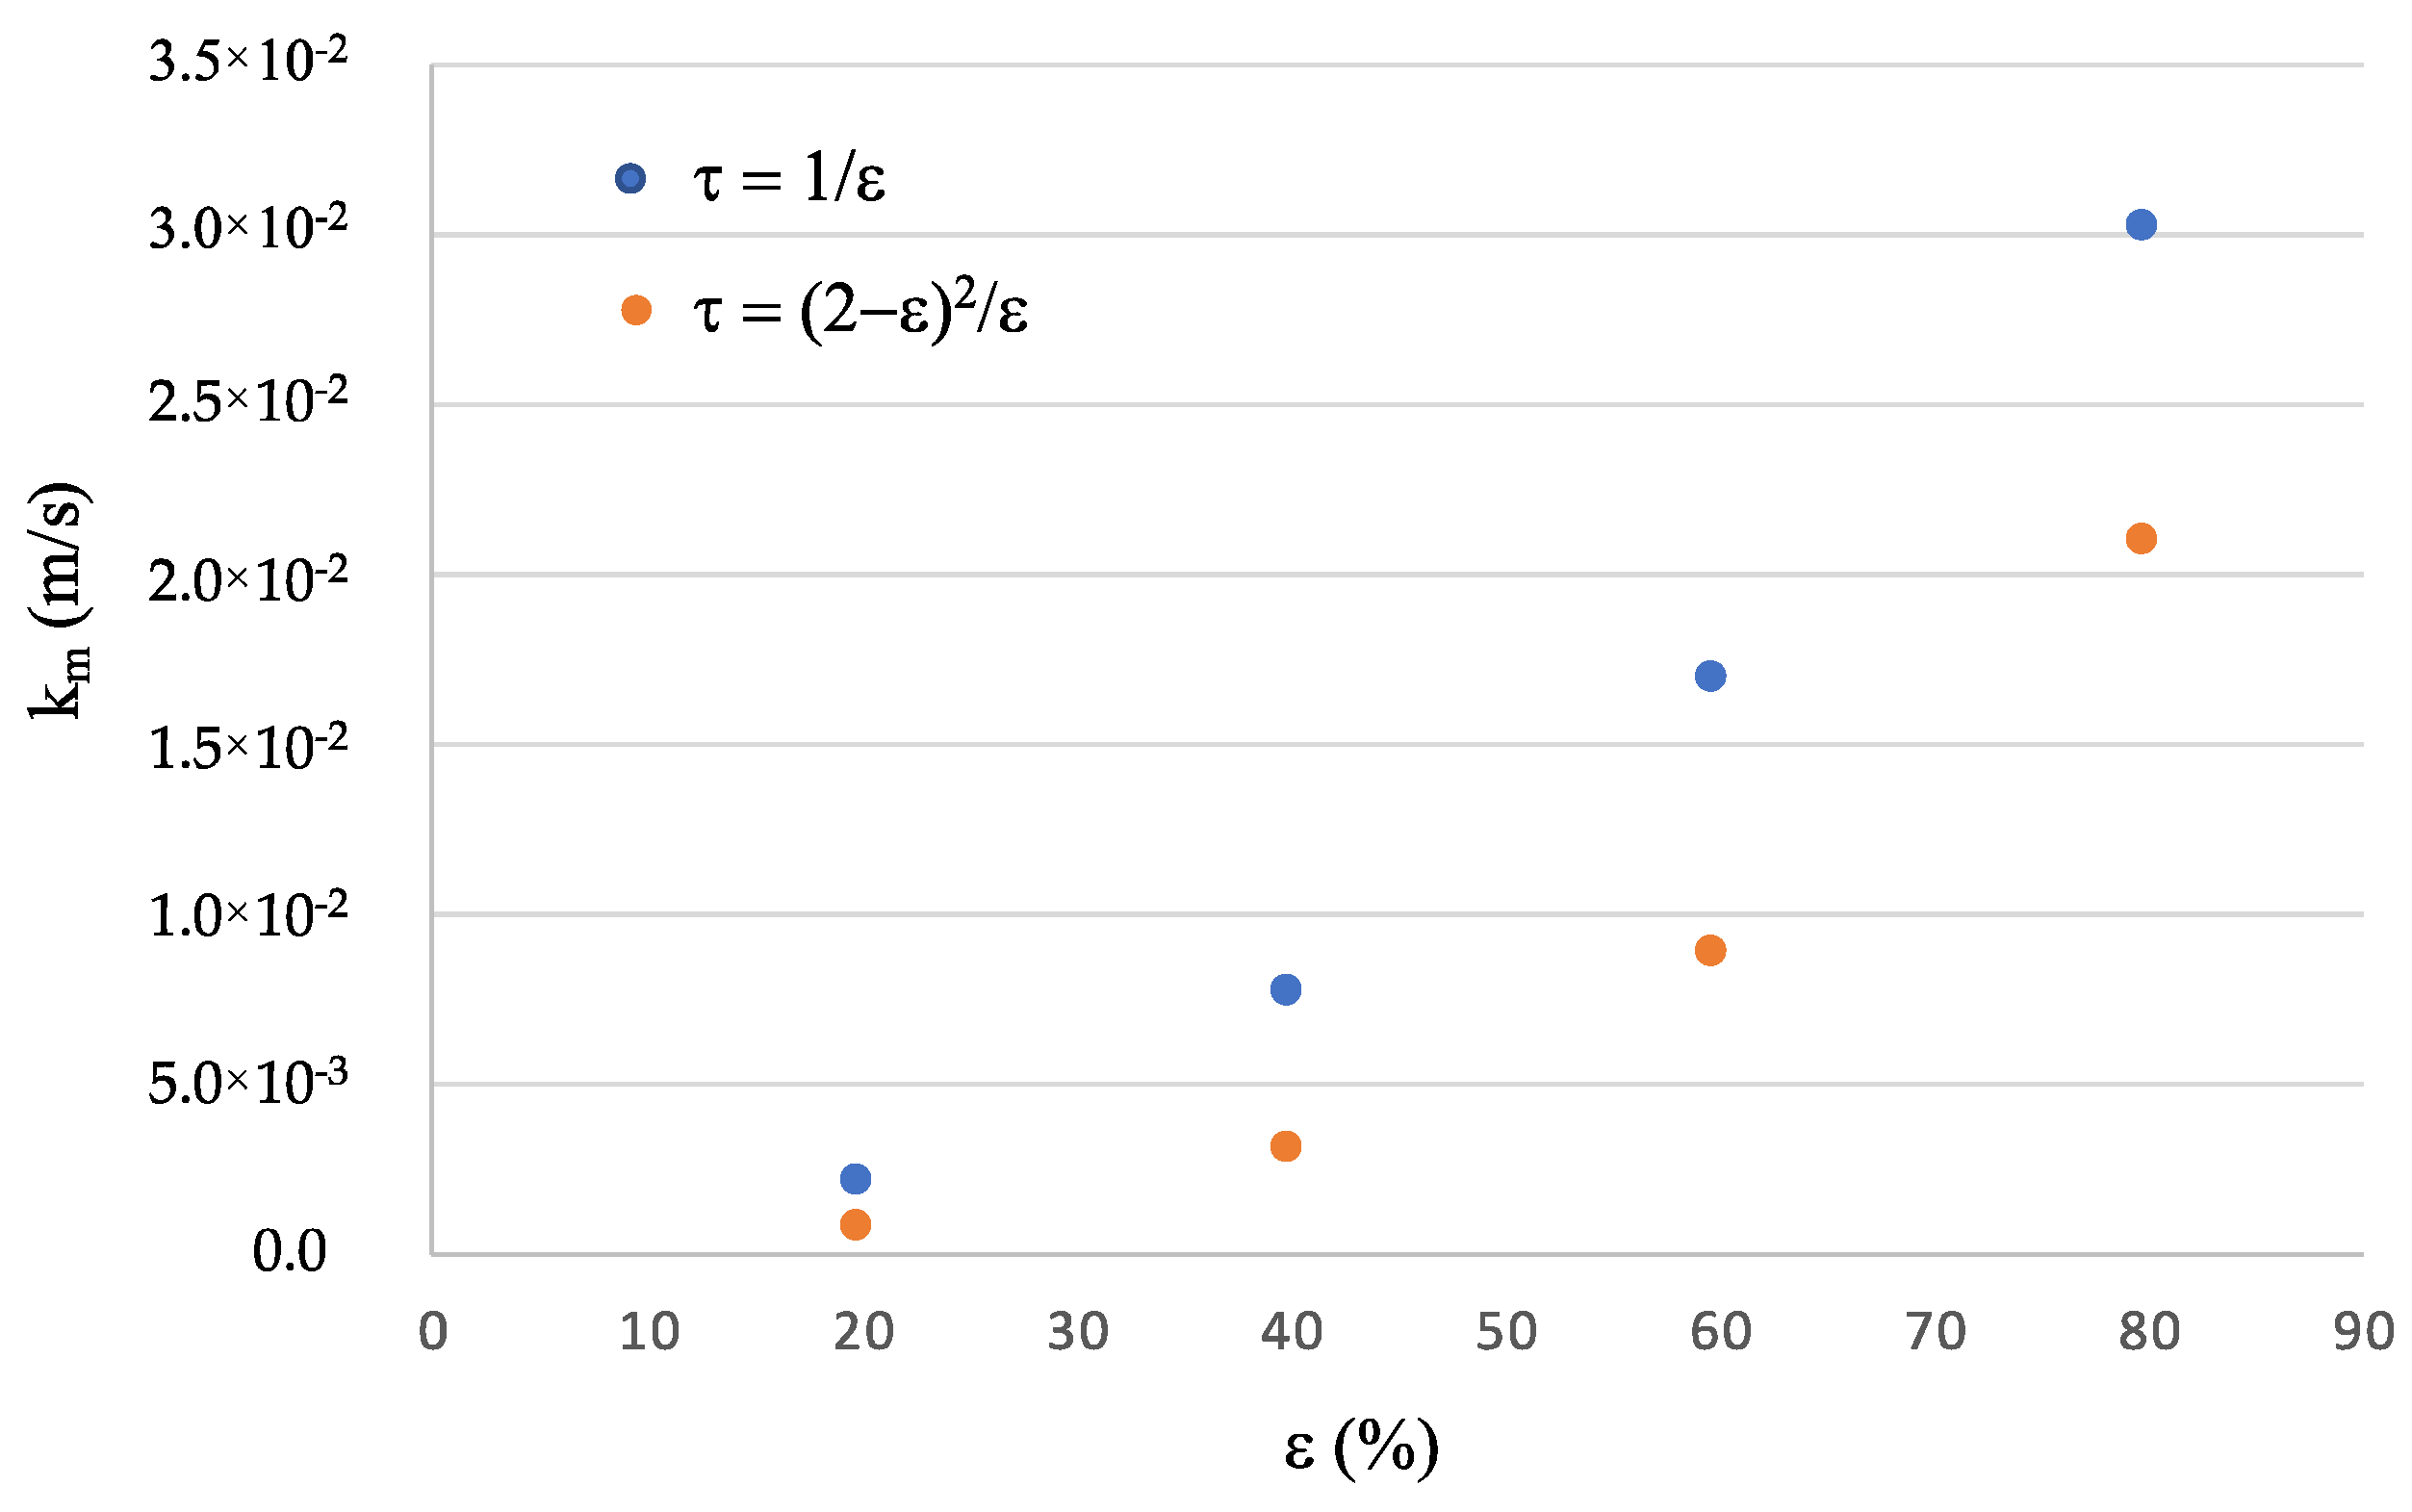
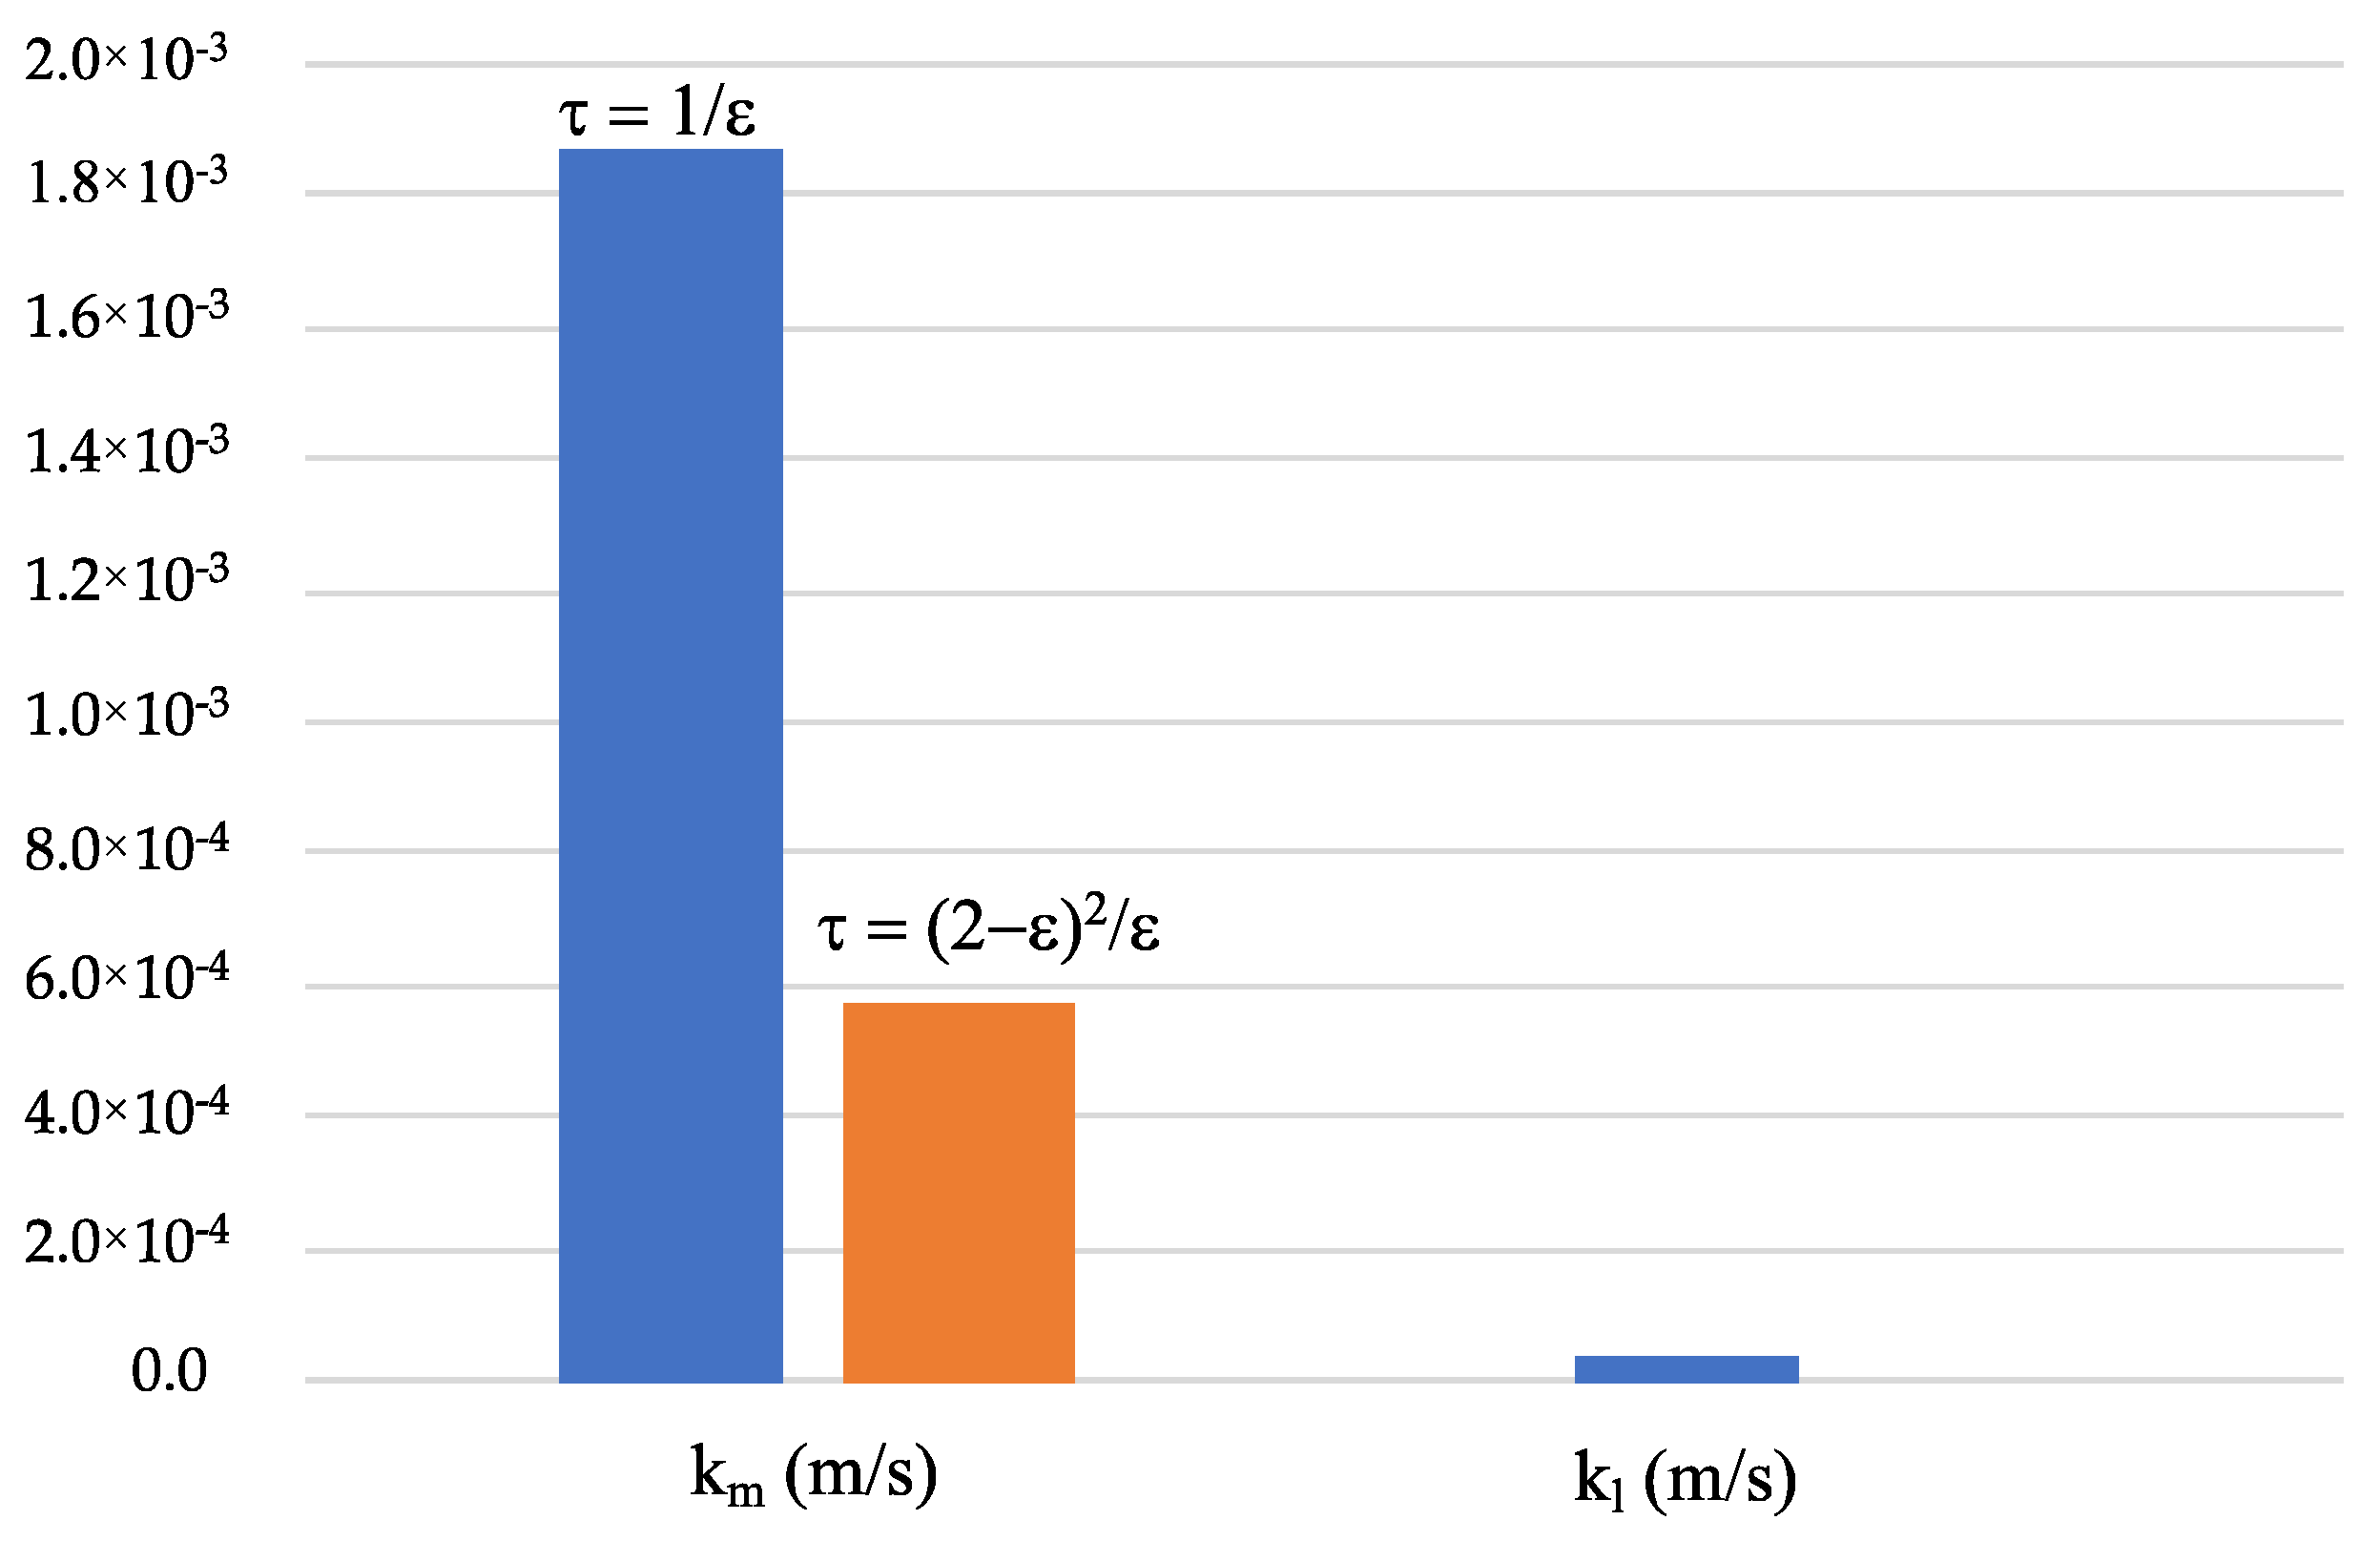
2.1.2. Theoretical Section: Mass Transfer Resistances Involved in Gas-Liquid Membrane Contactors
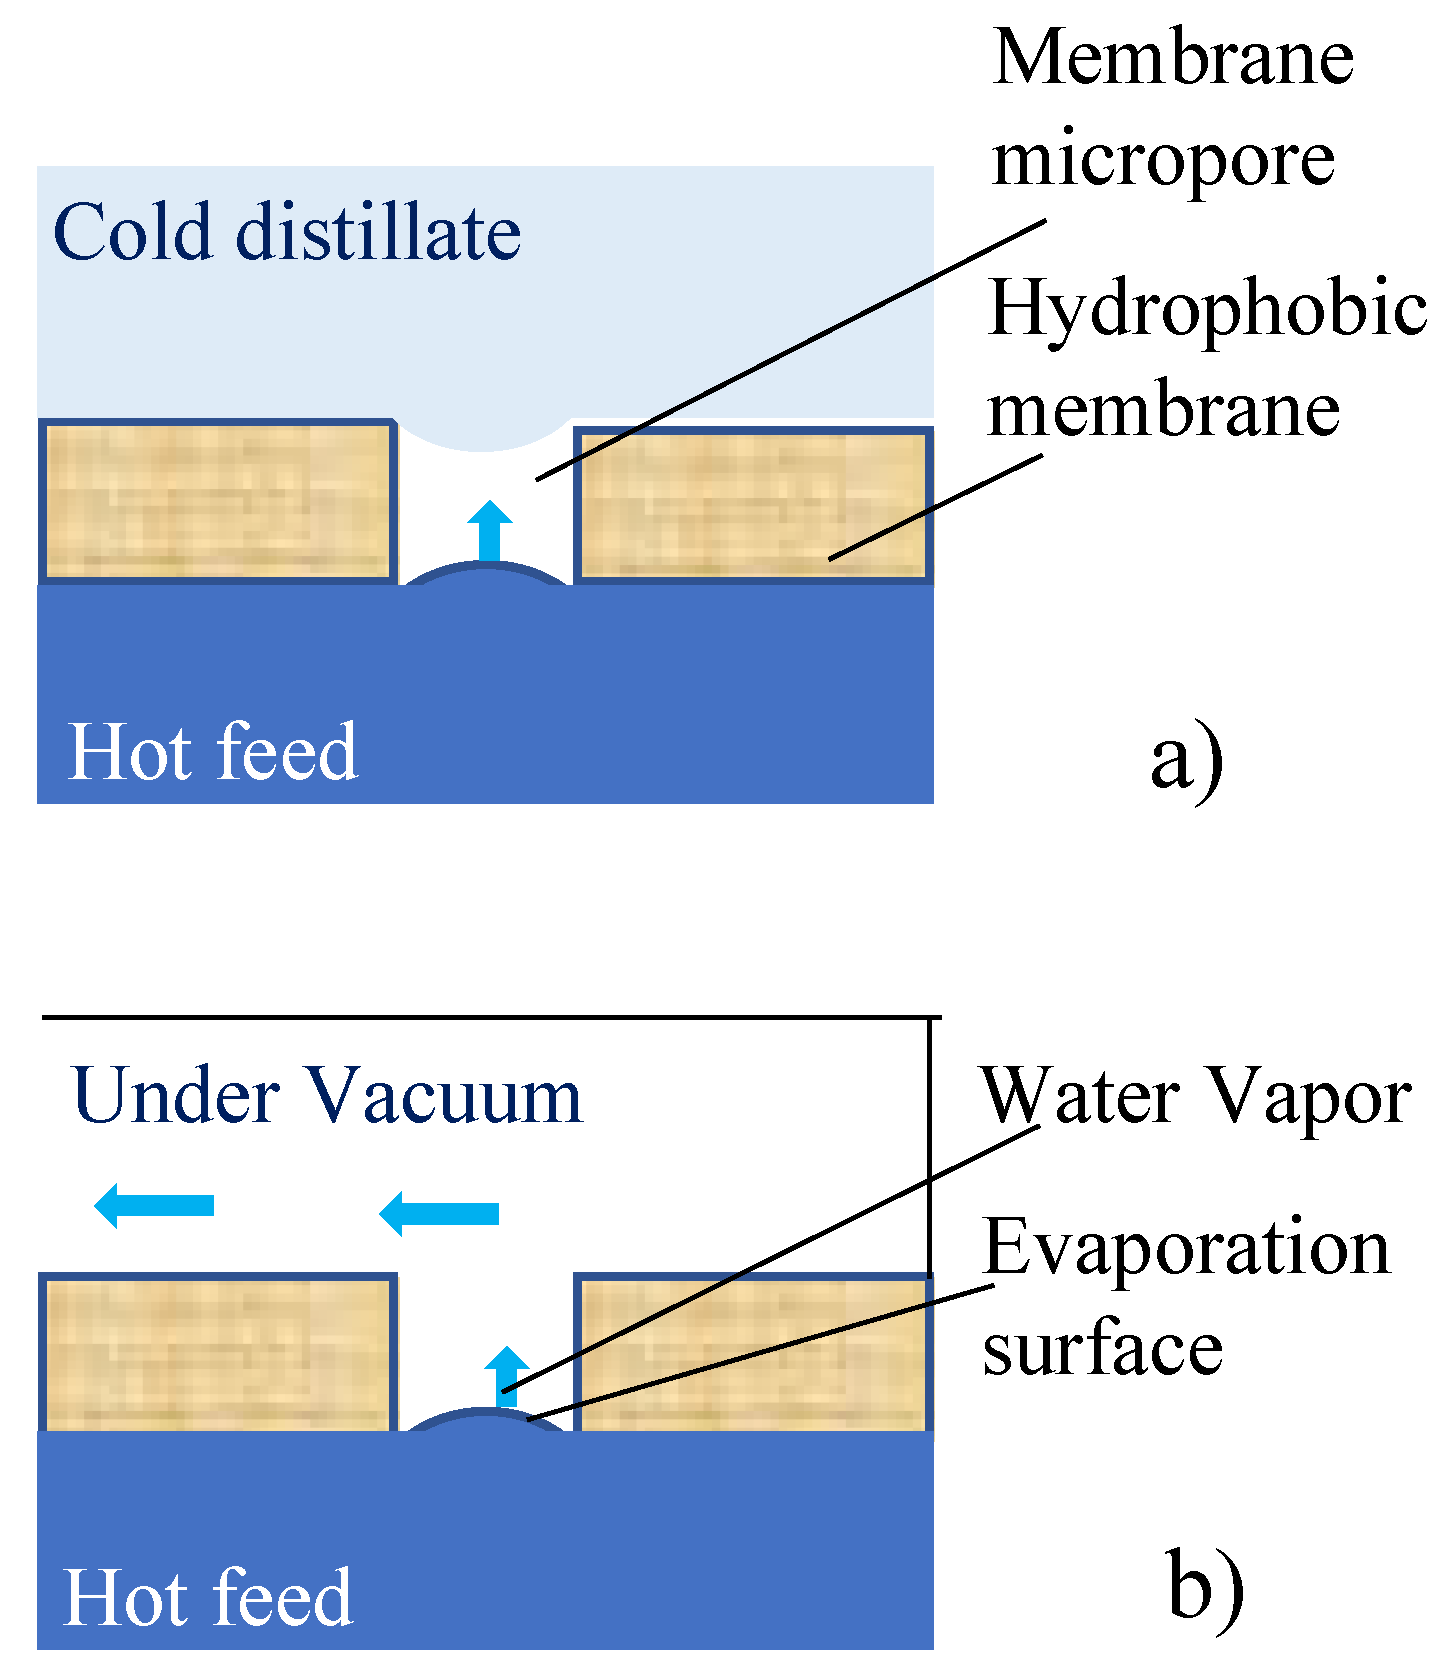
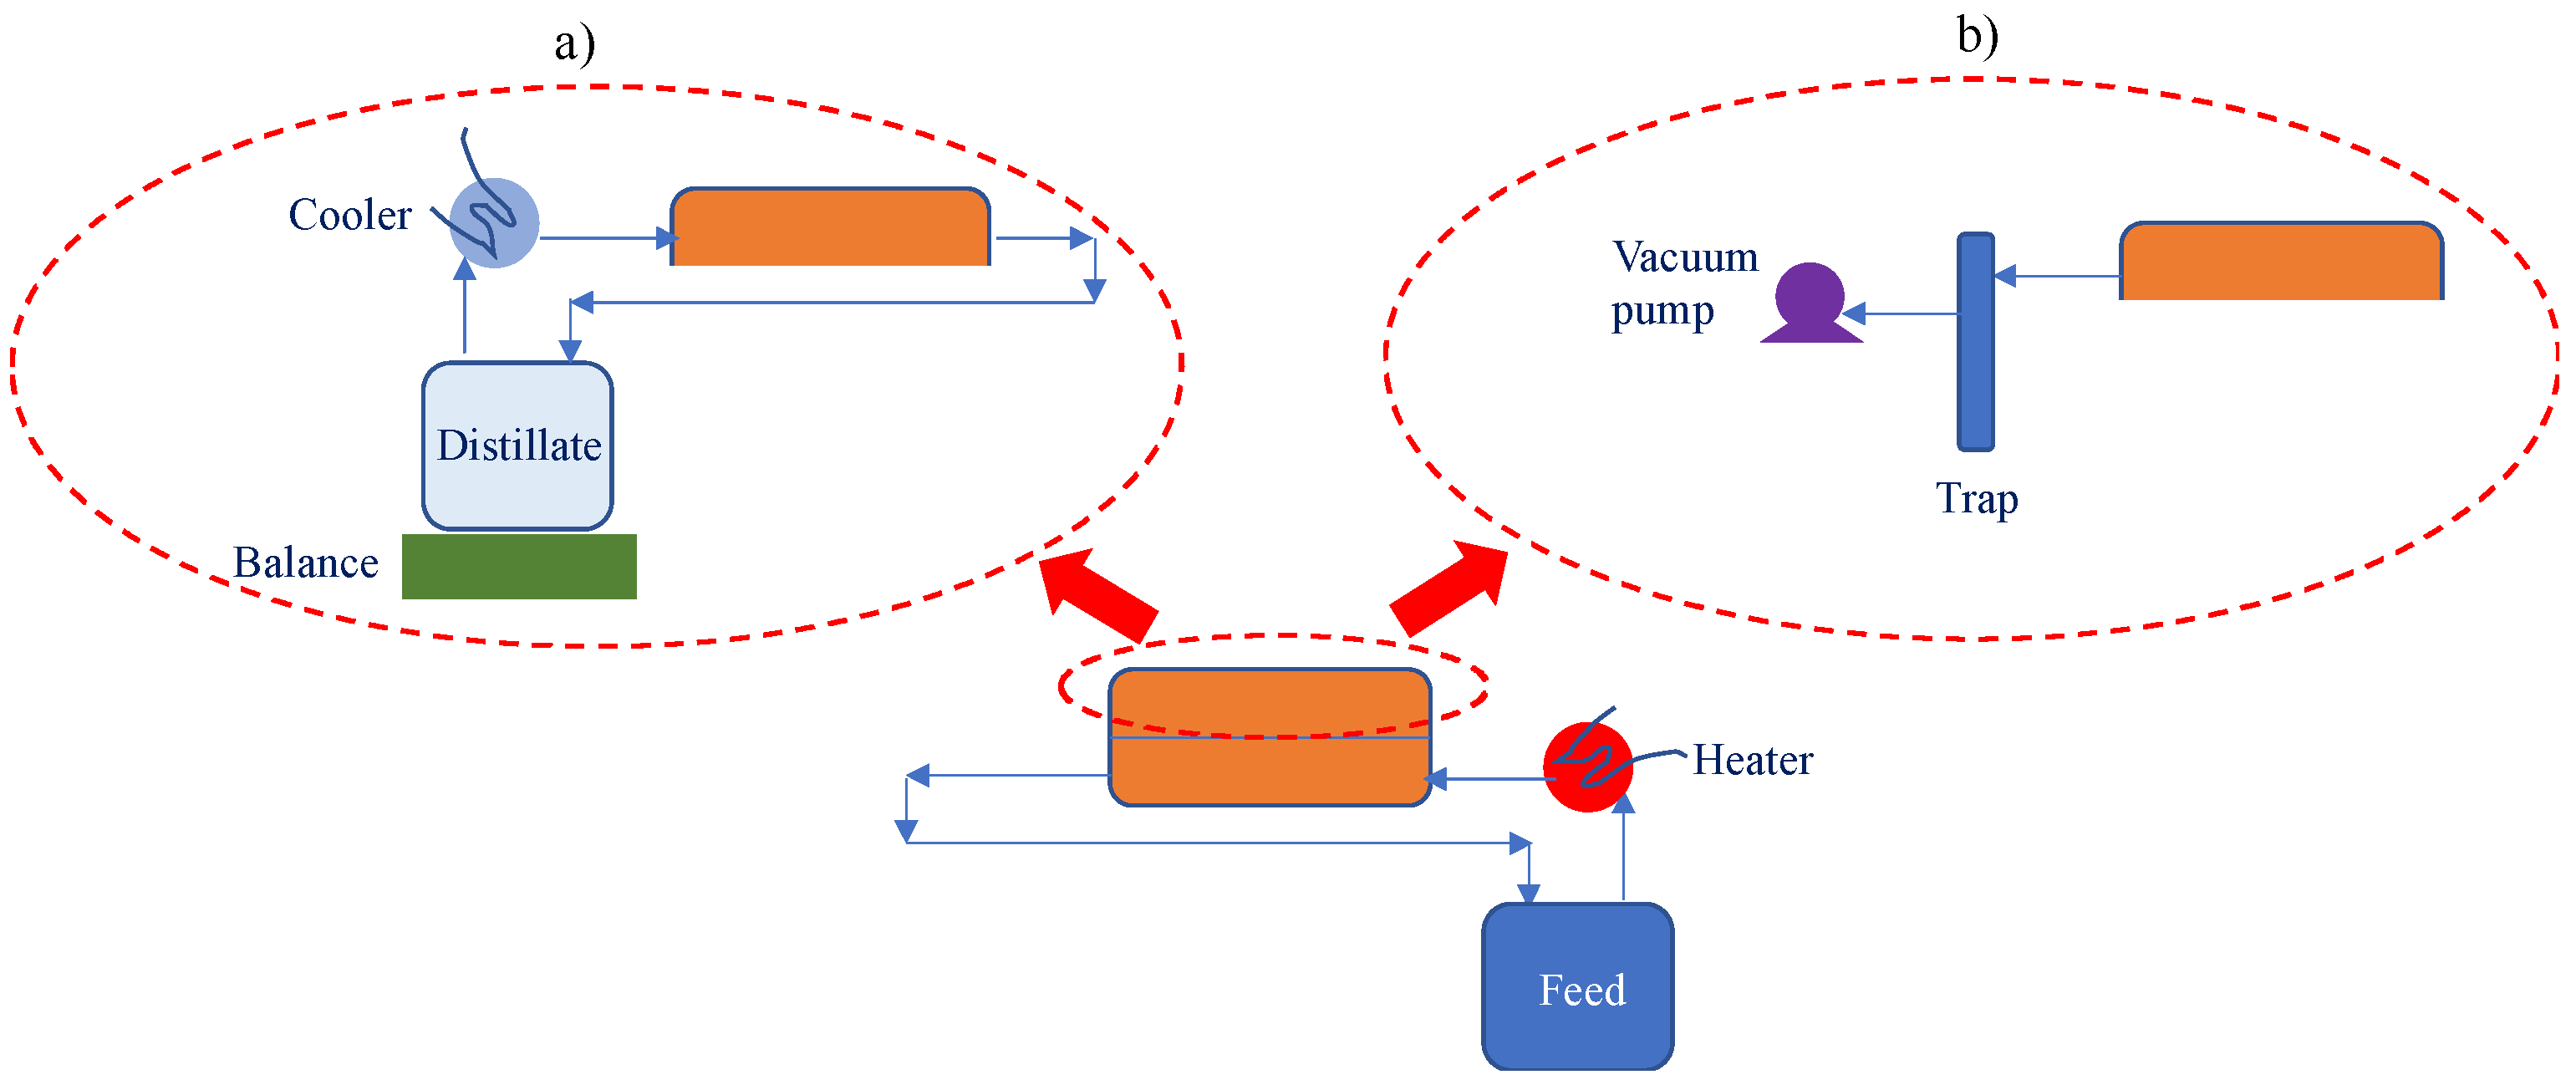
2.2. MD Set-Up
3. Results and Discussion
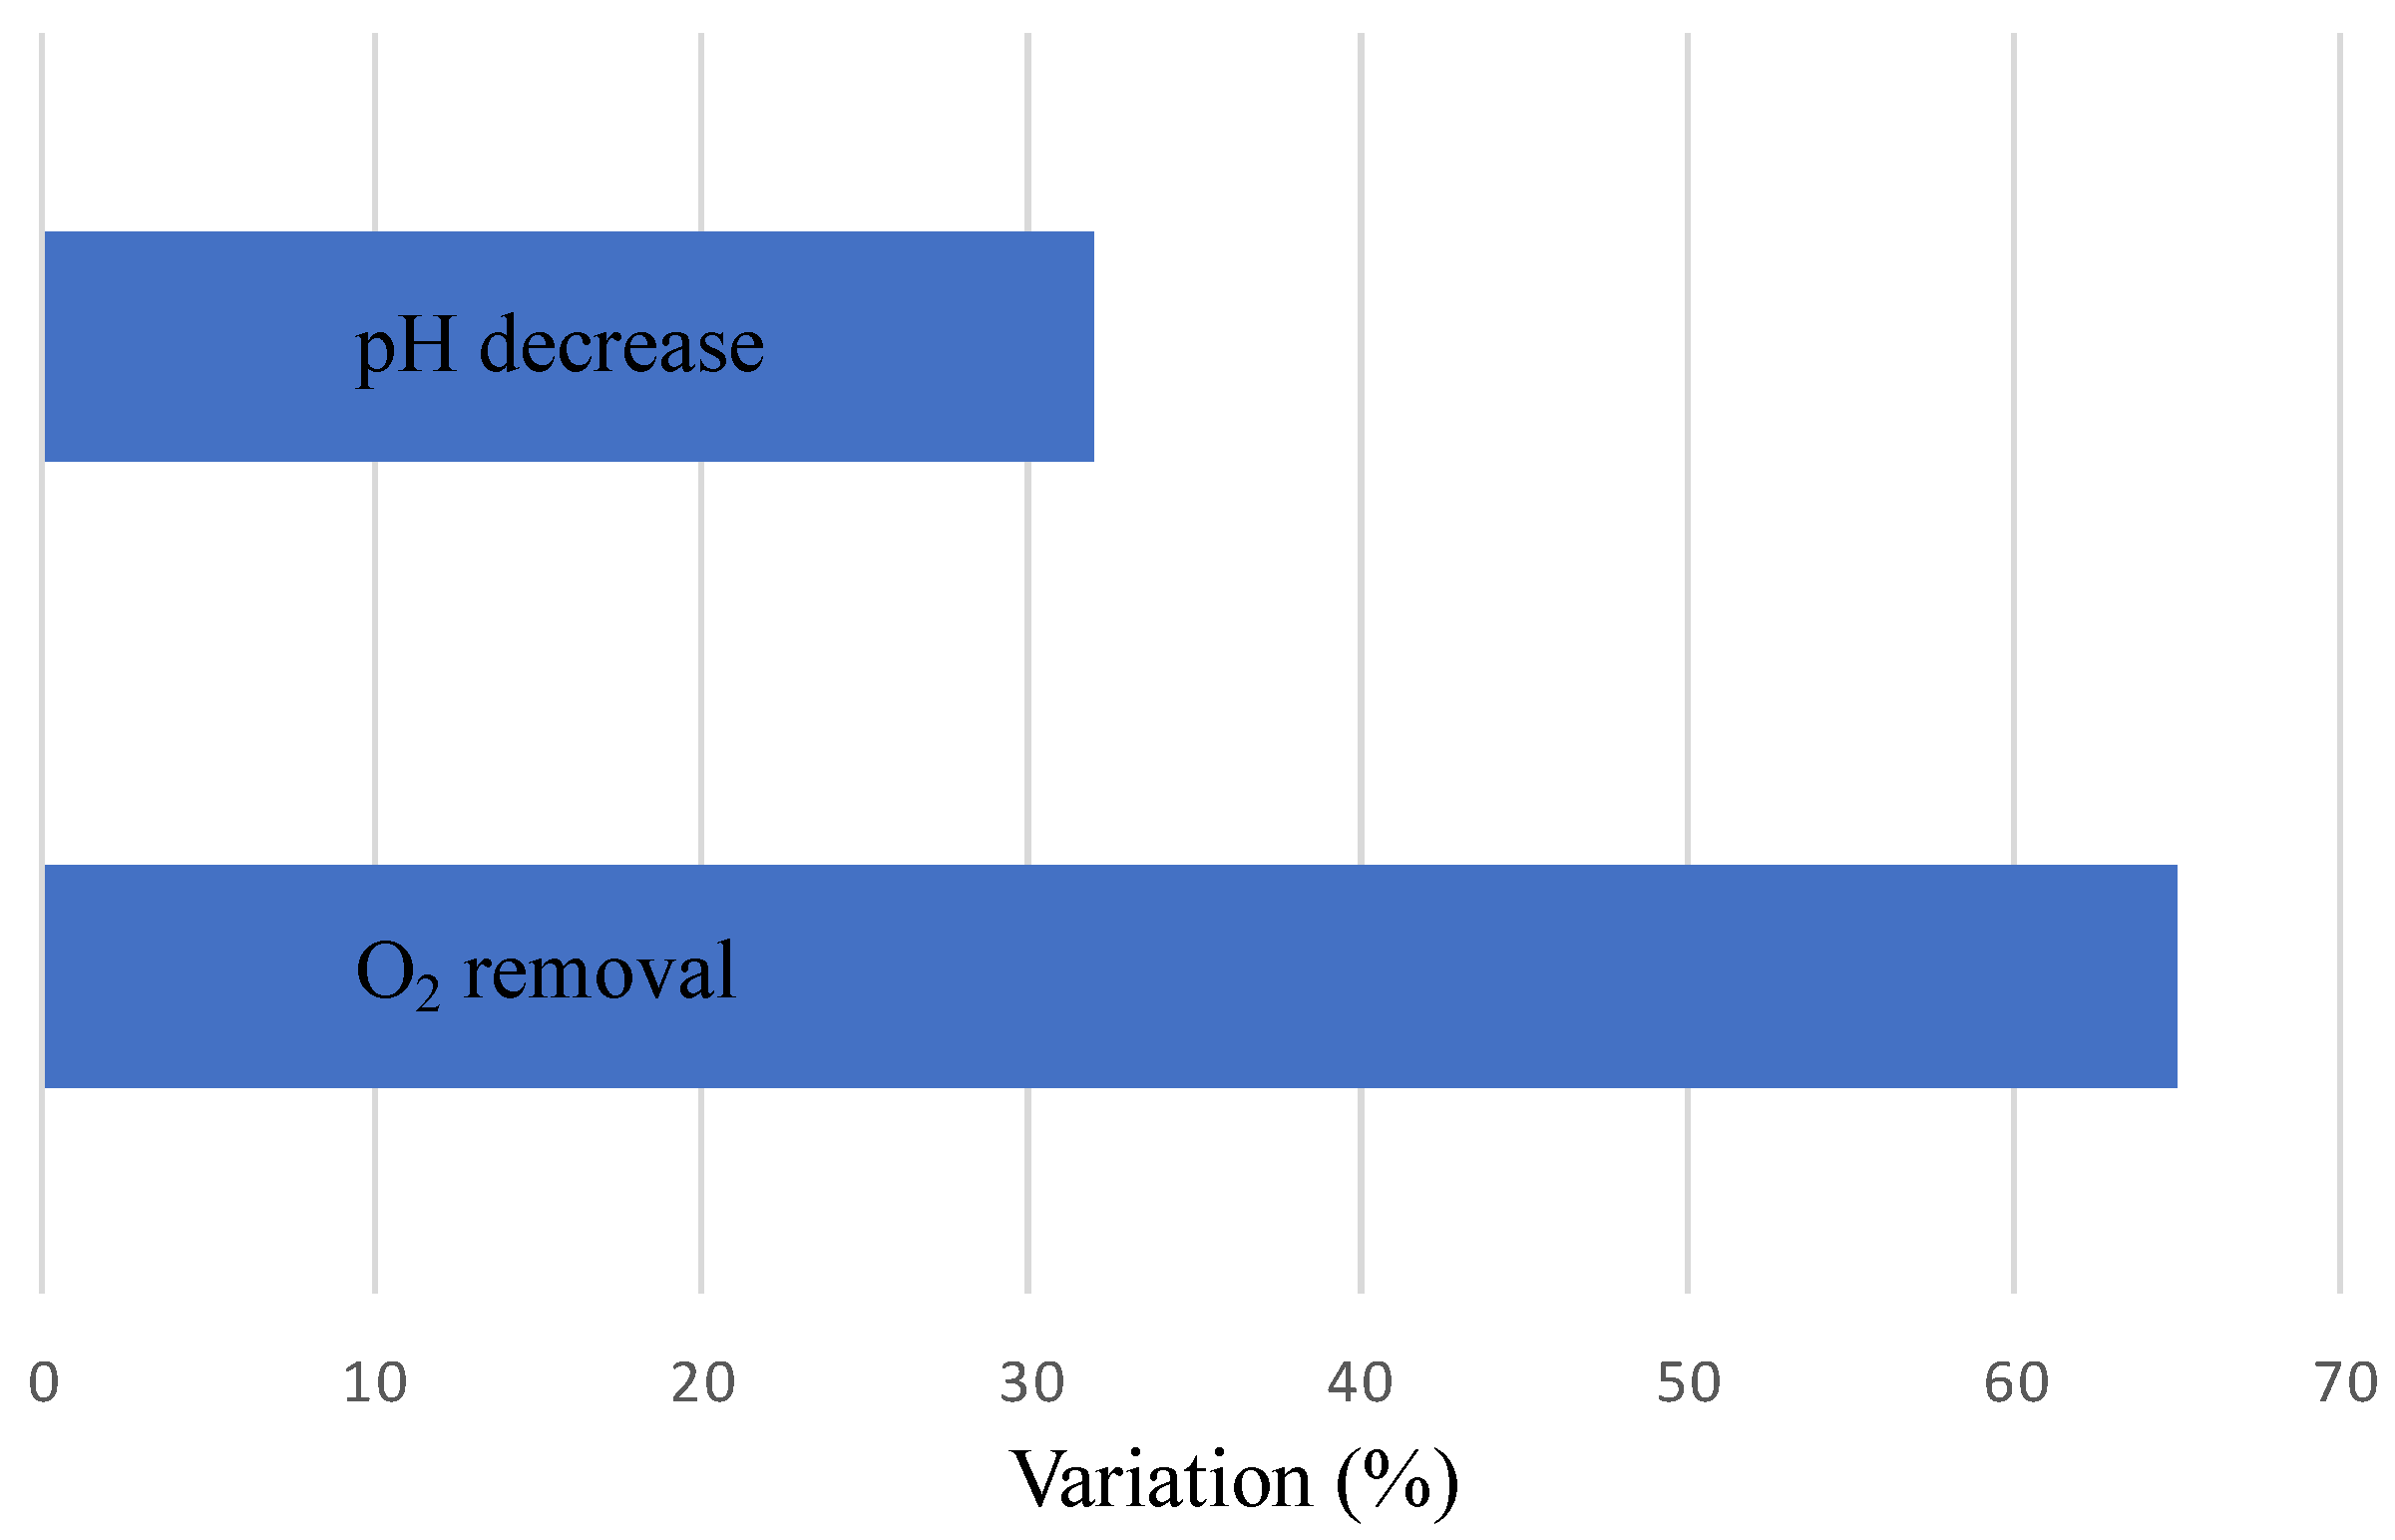
3.1. Oxygen Removal and pH Control
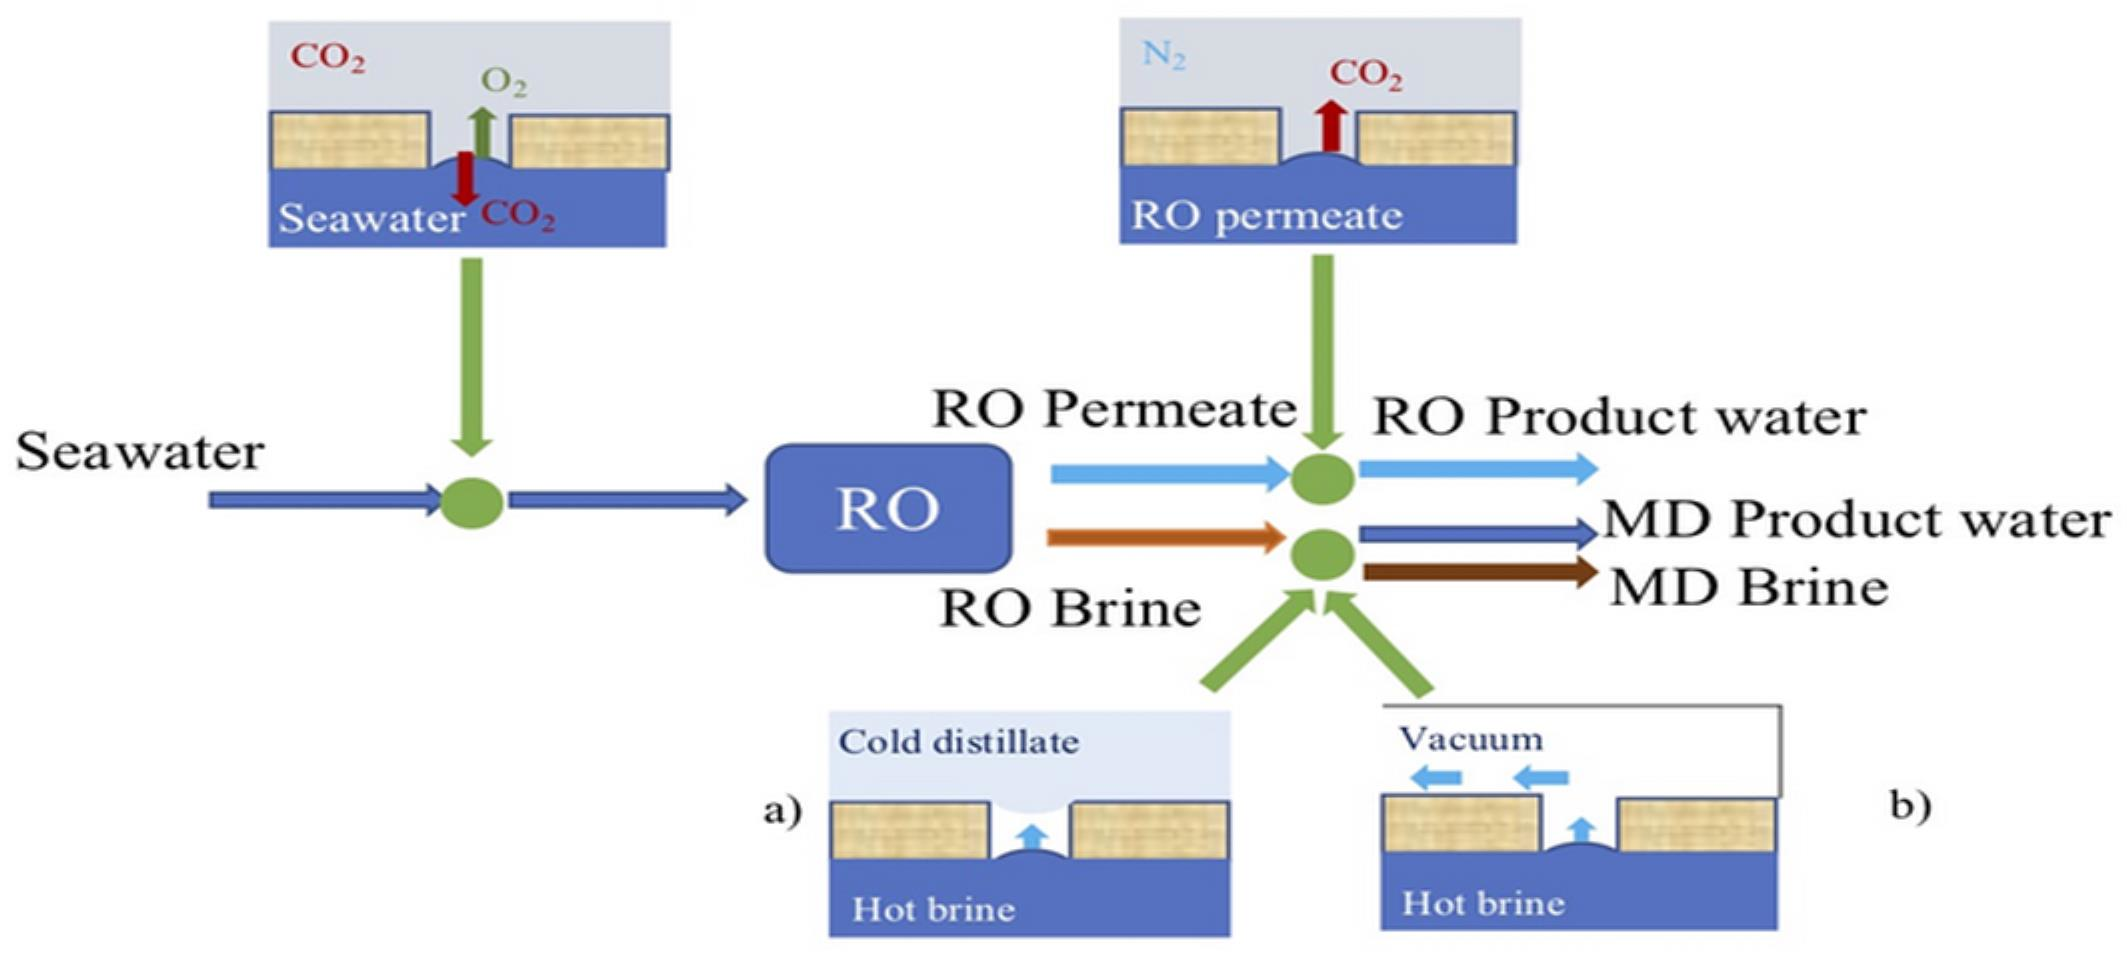
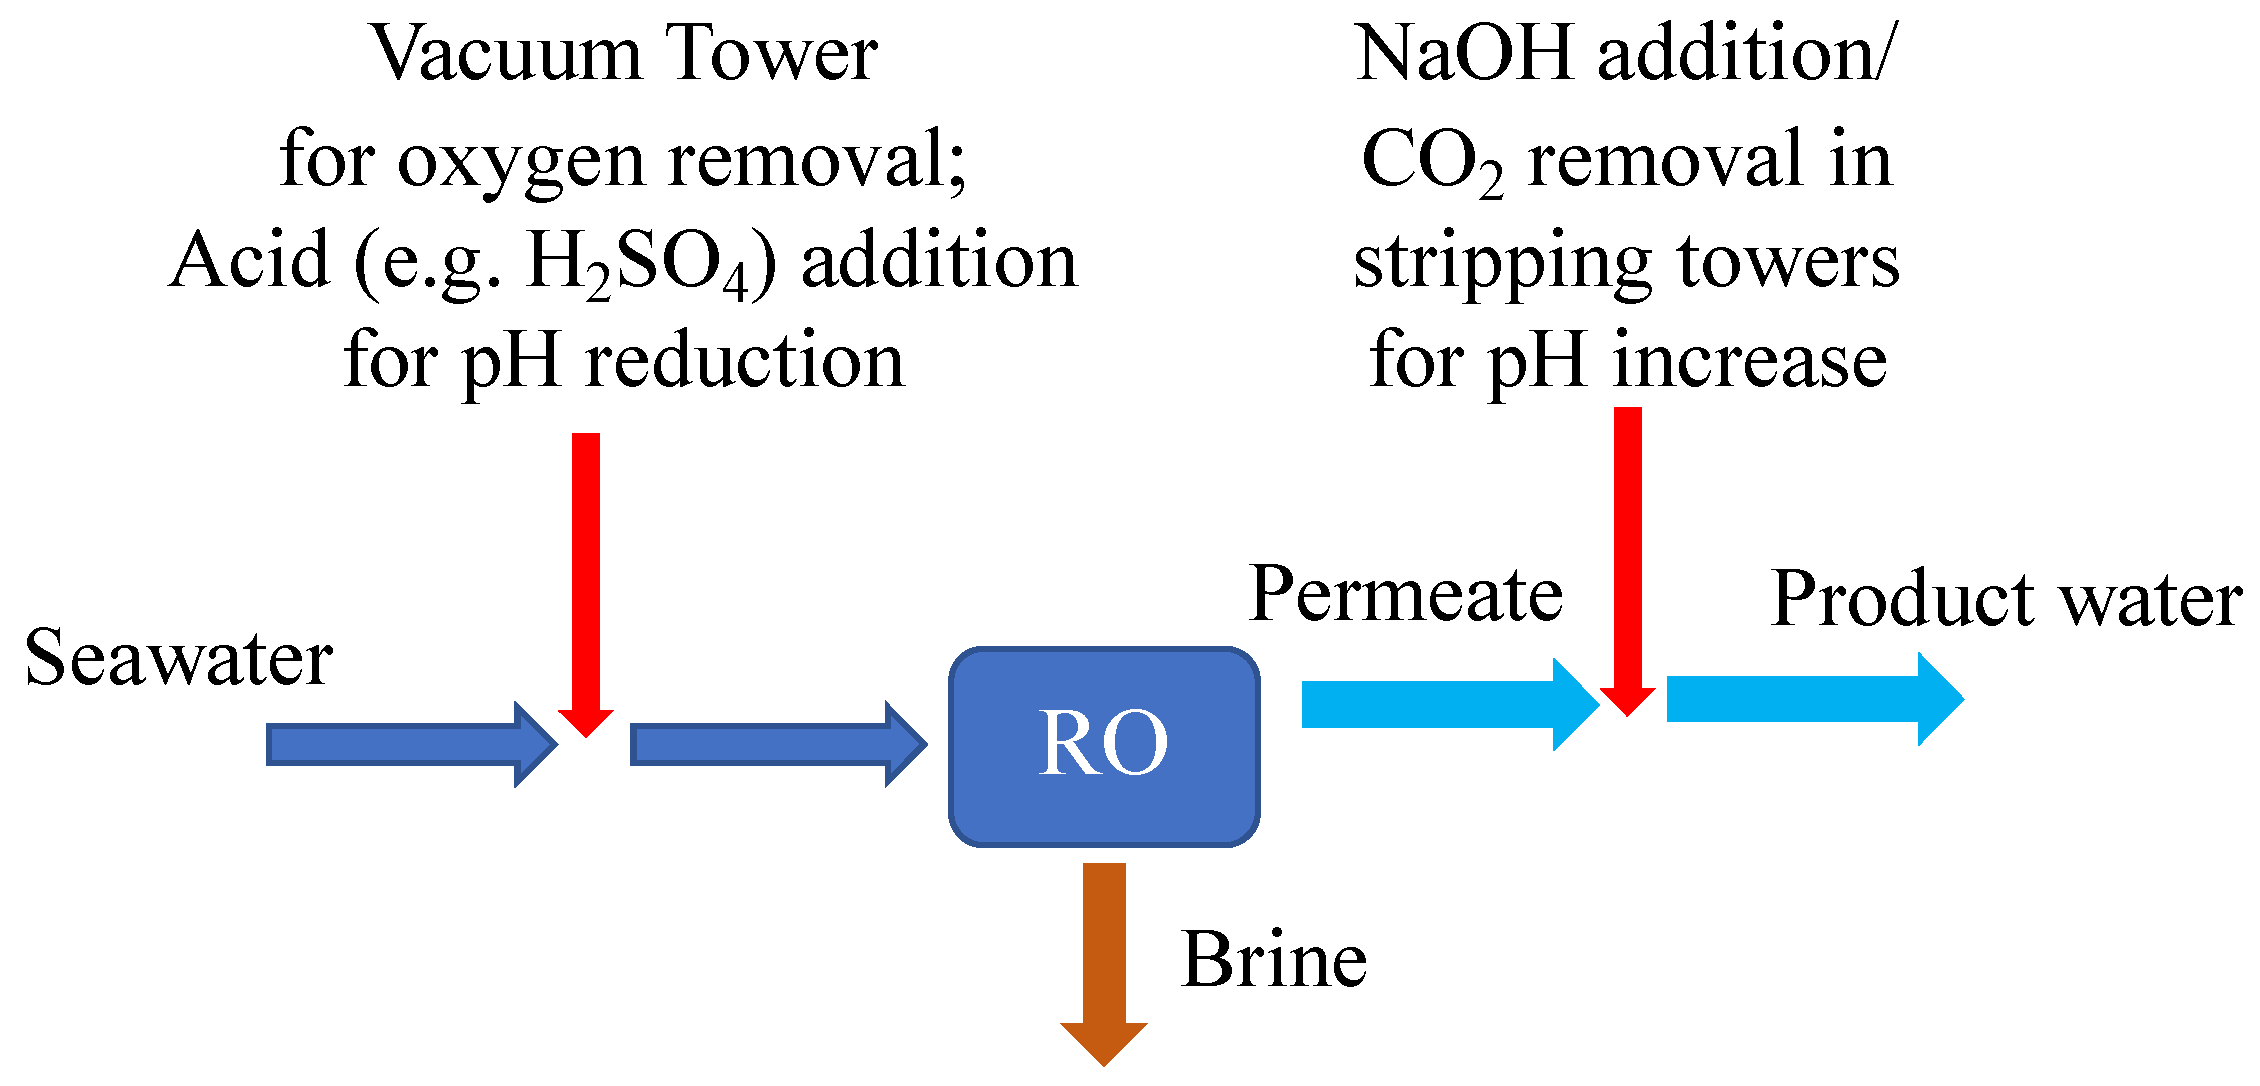
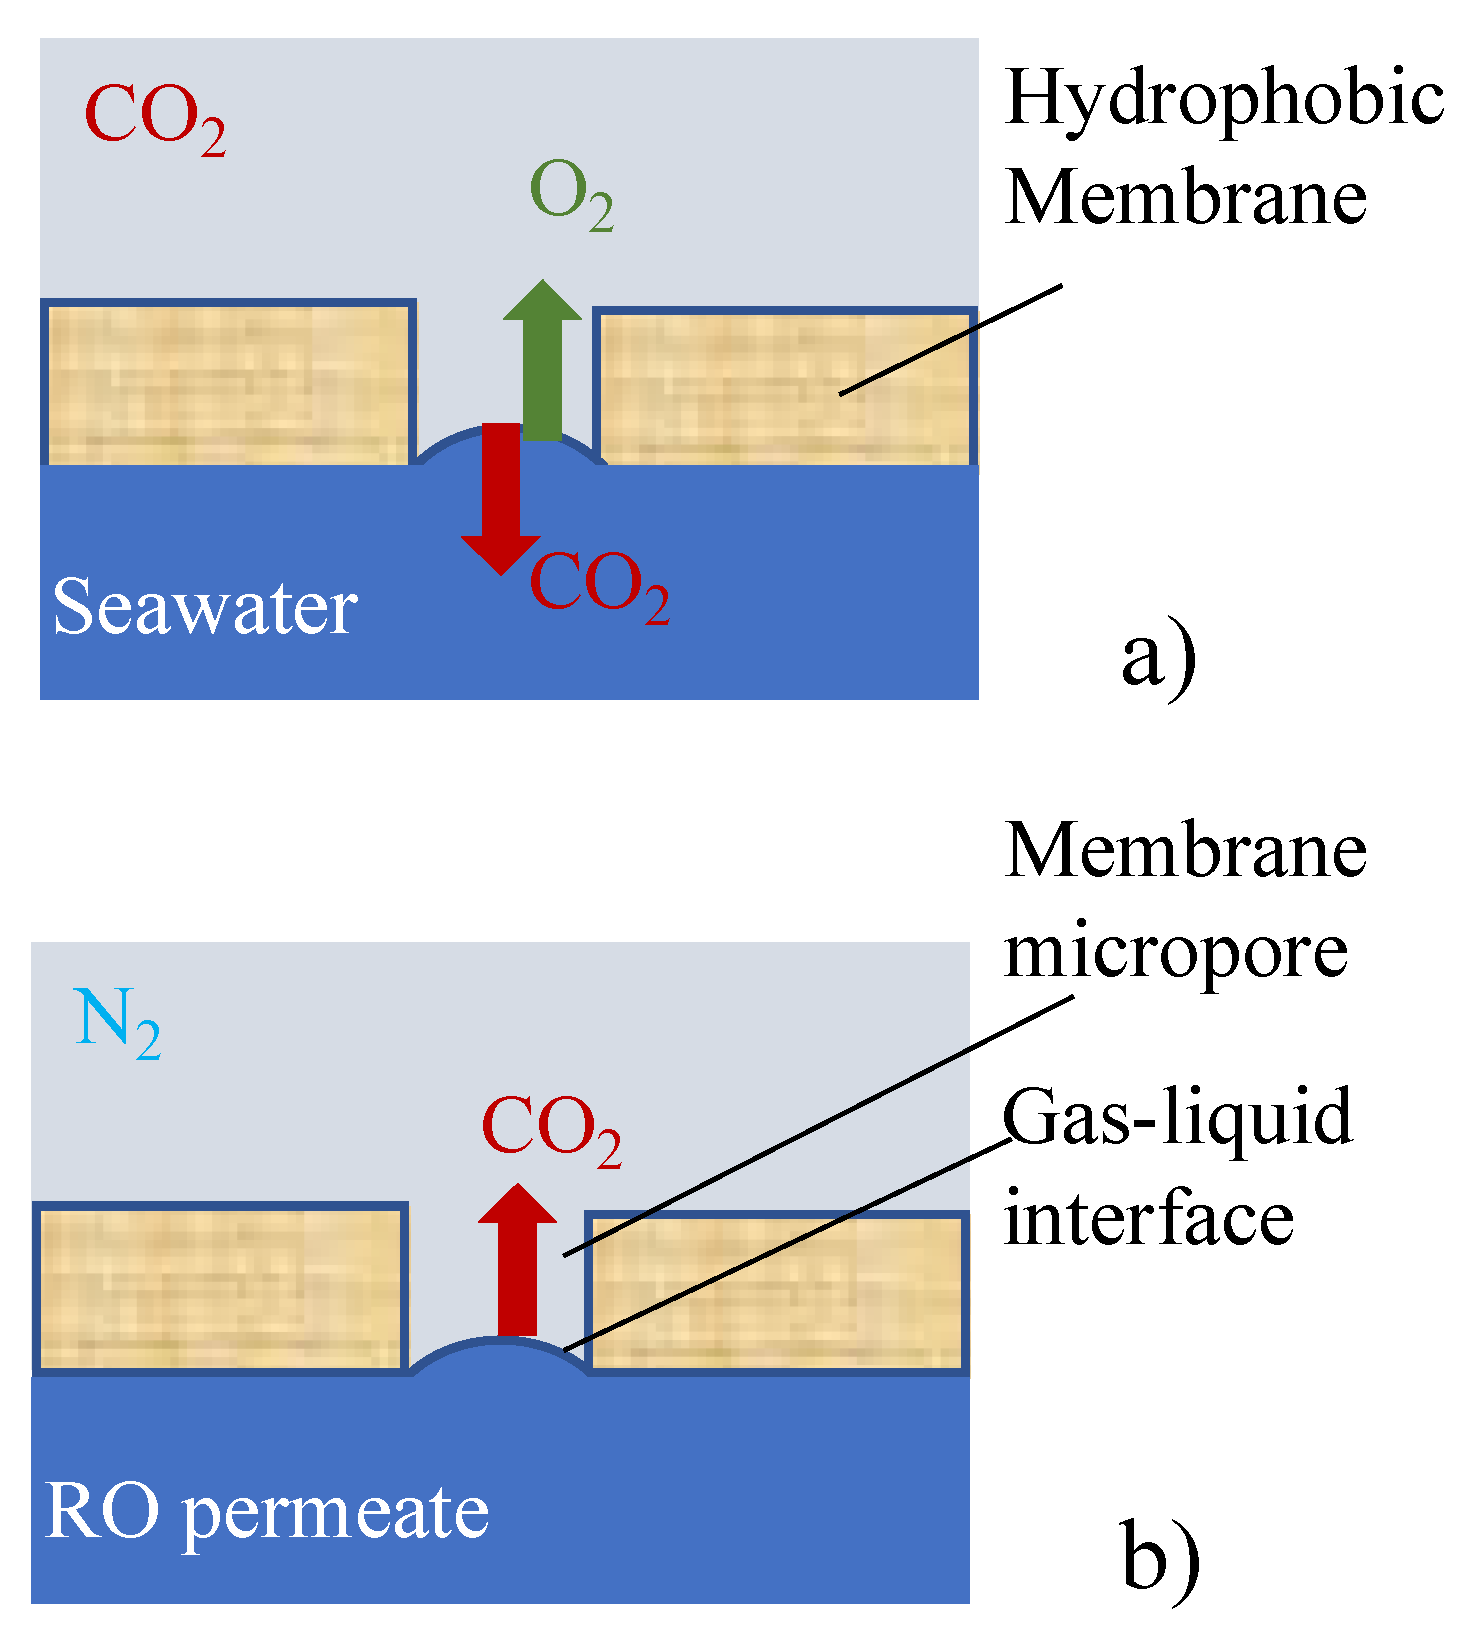
3.1.1. Case Study 1: The Pre-Treatment of Seawater to Remove Dissolved Oxygen and to Reduce the pH
3.1.2. Case Study 2: The Post-Treatment of the RO Permeate to Increase the pH
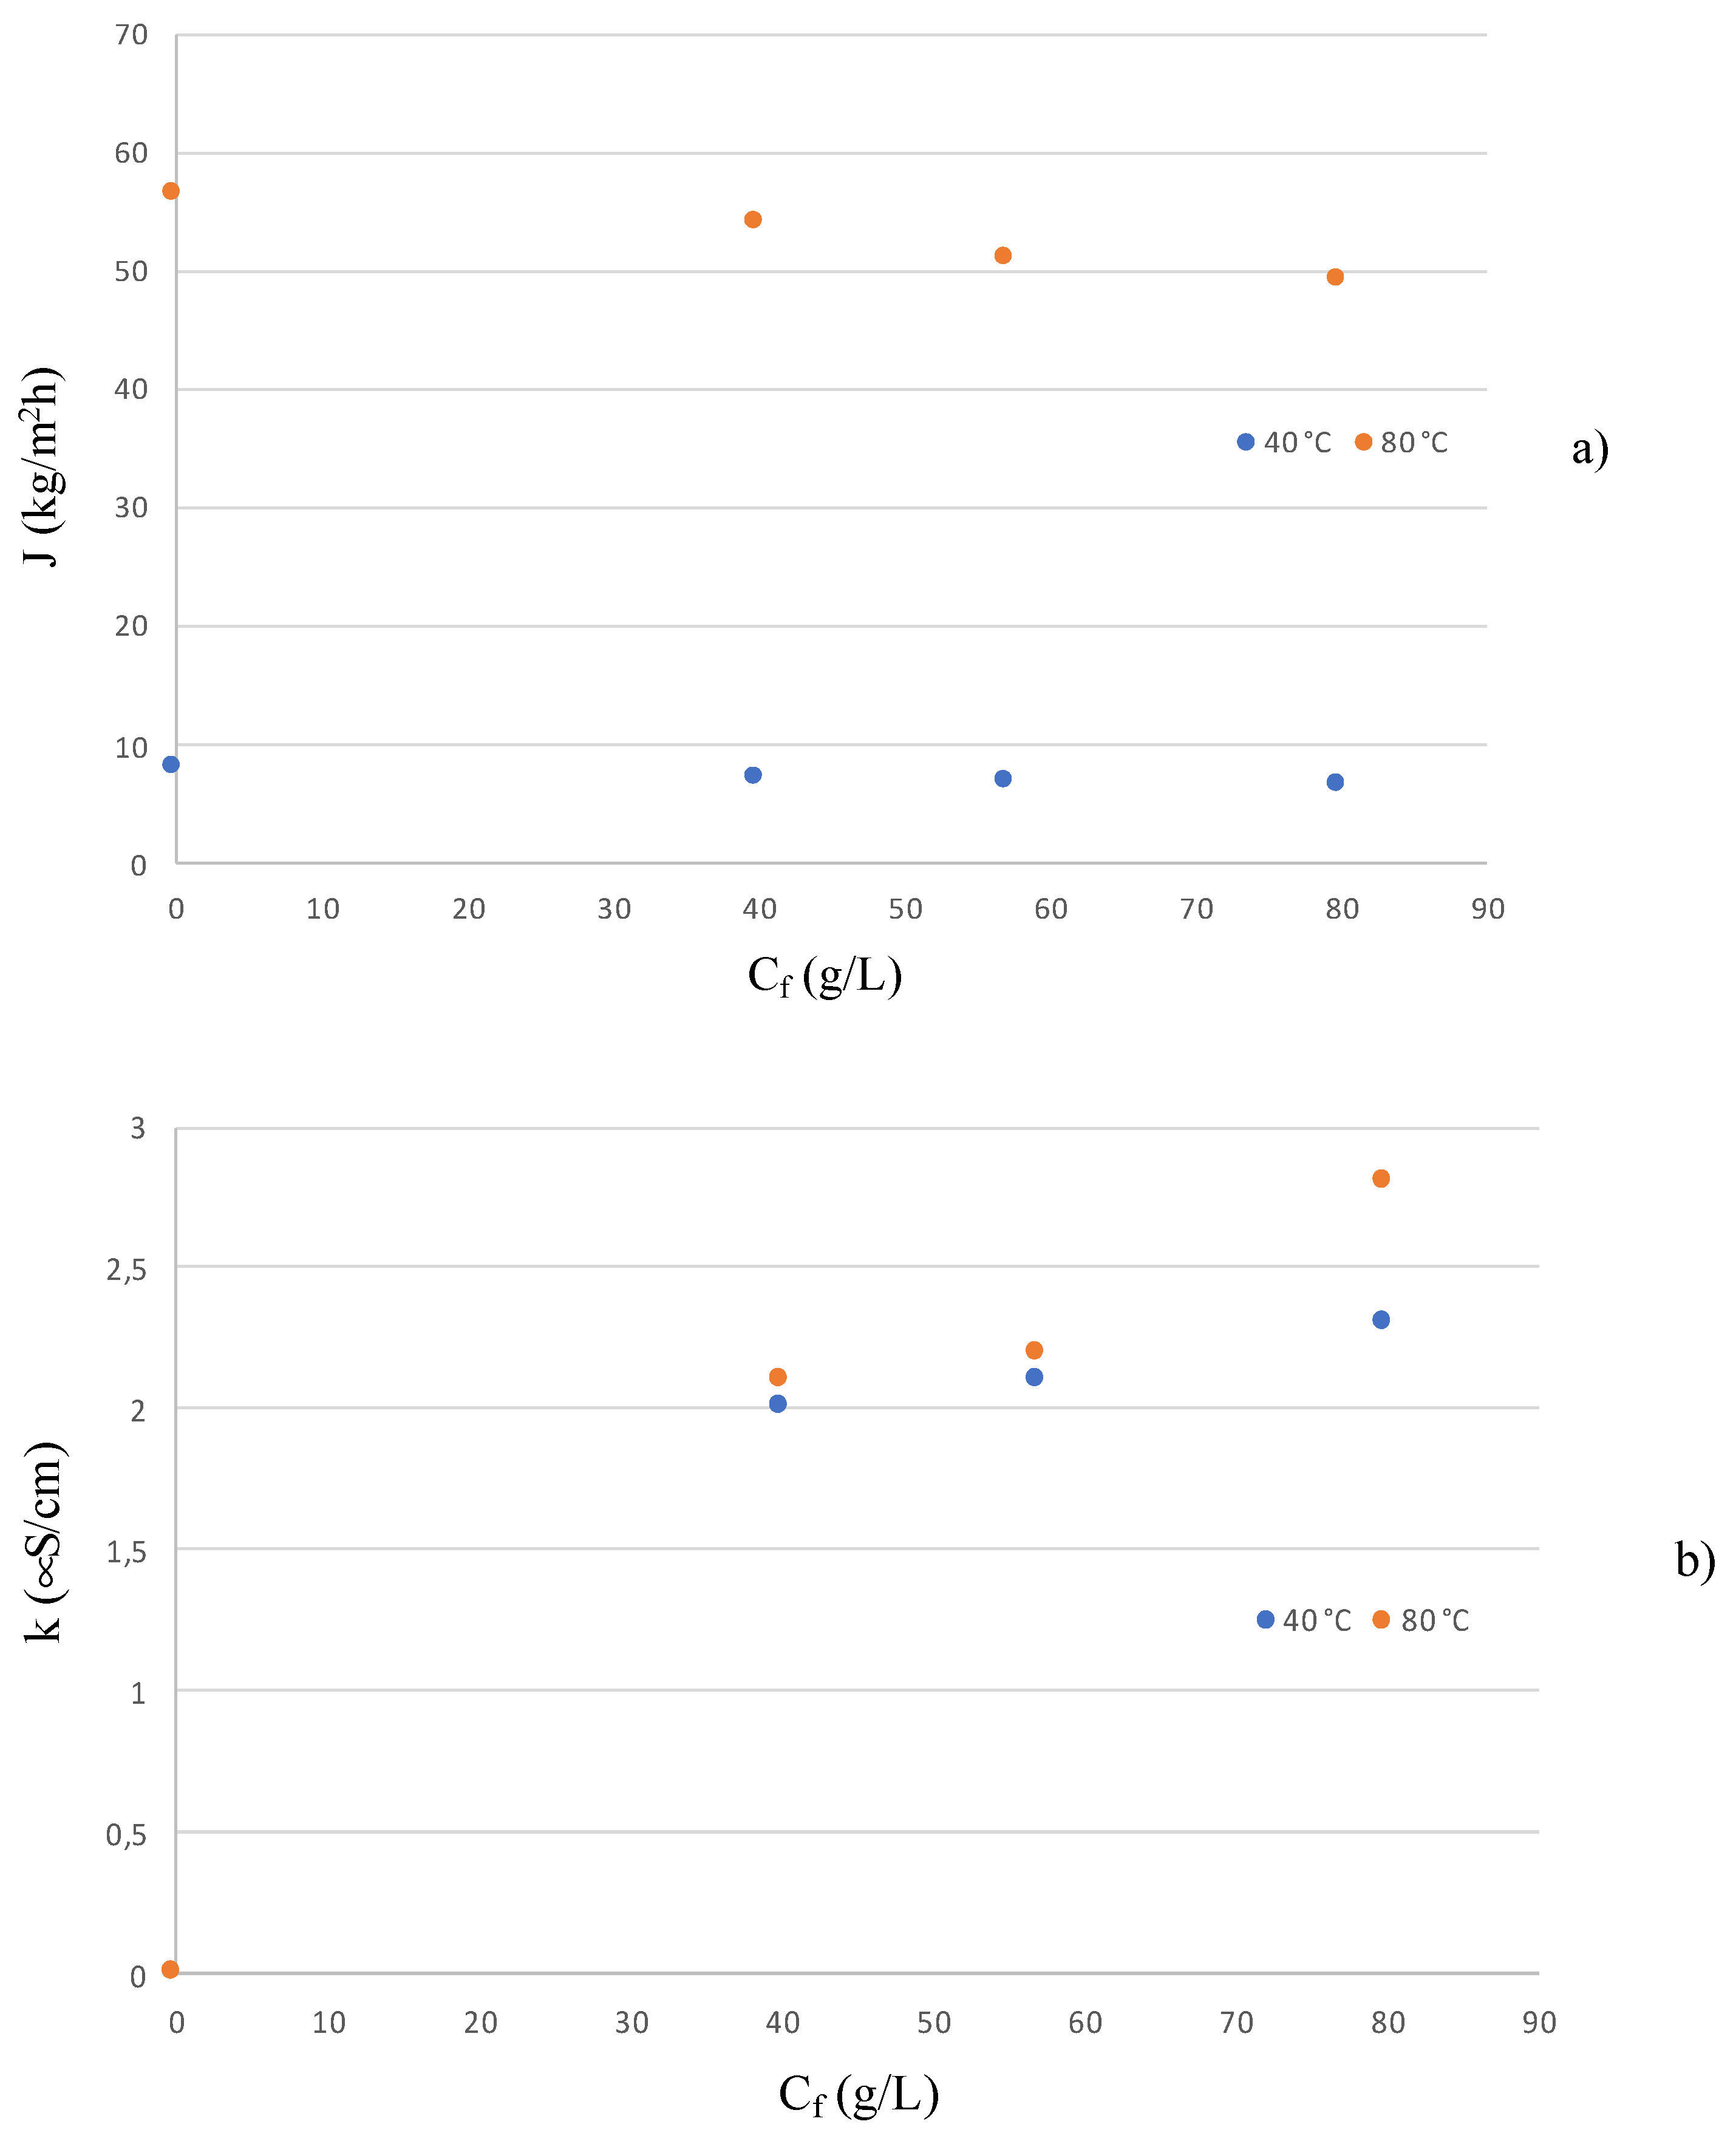
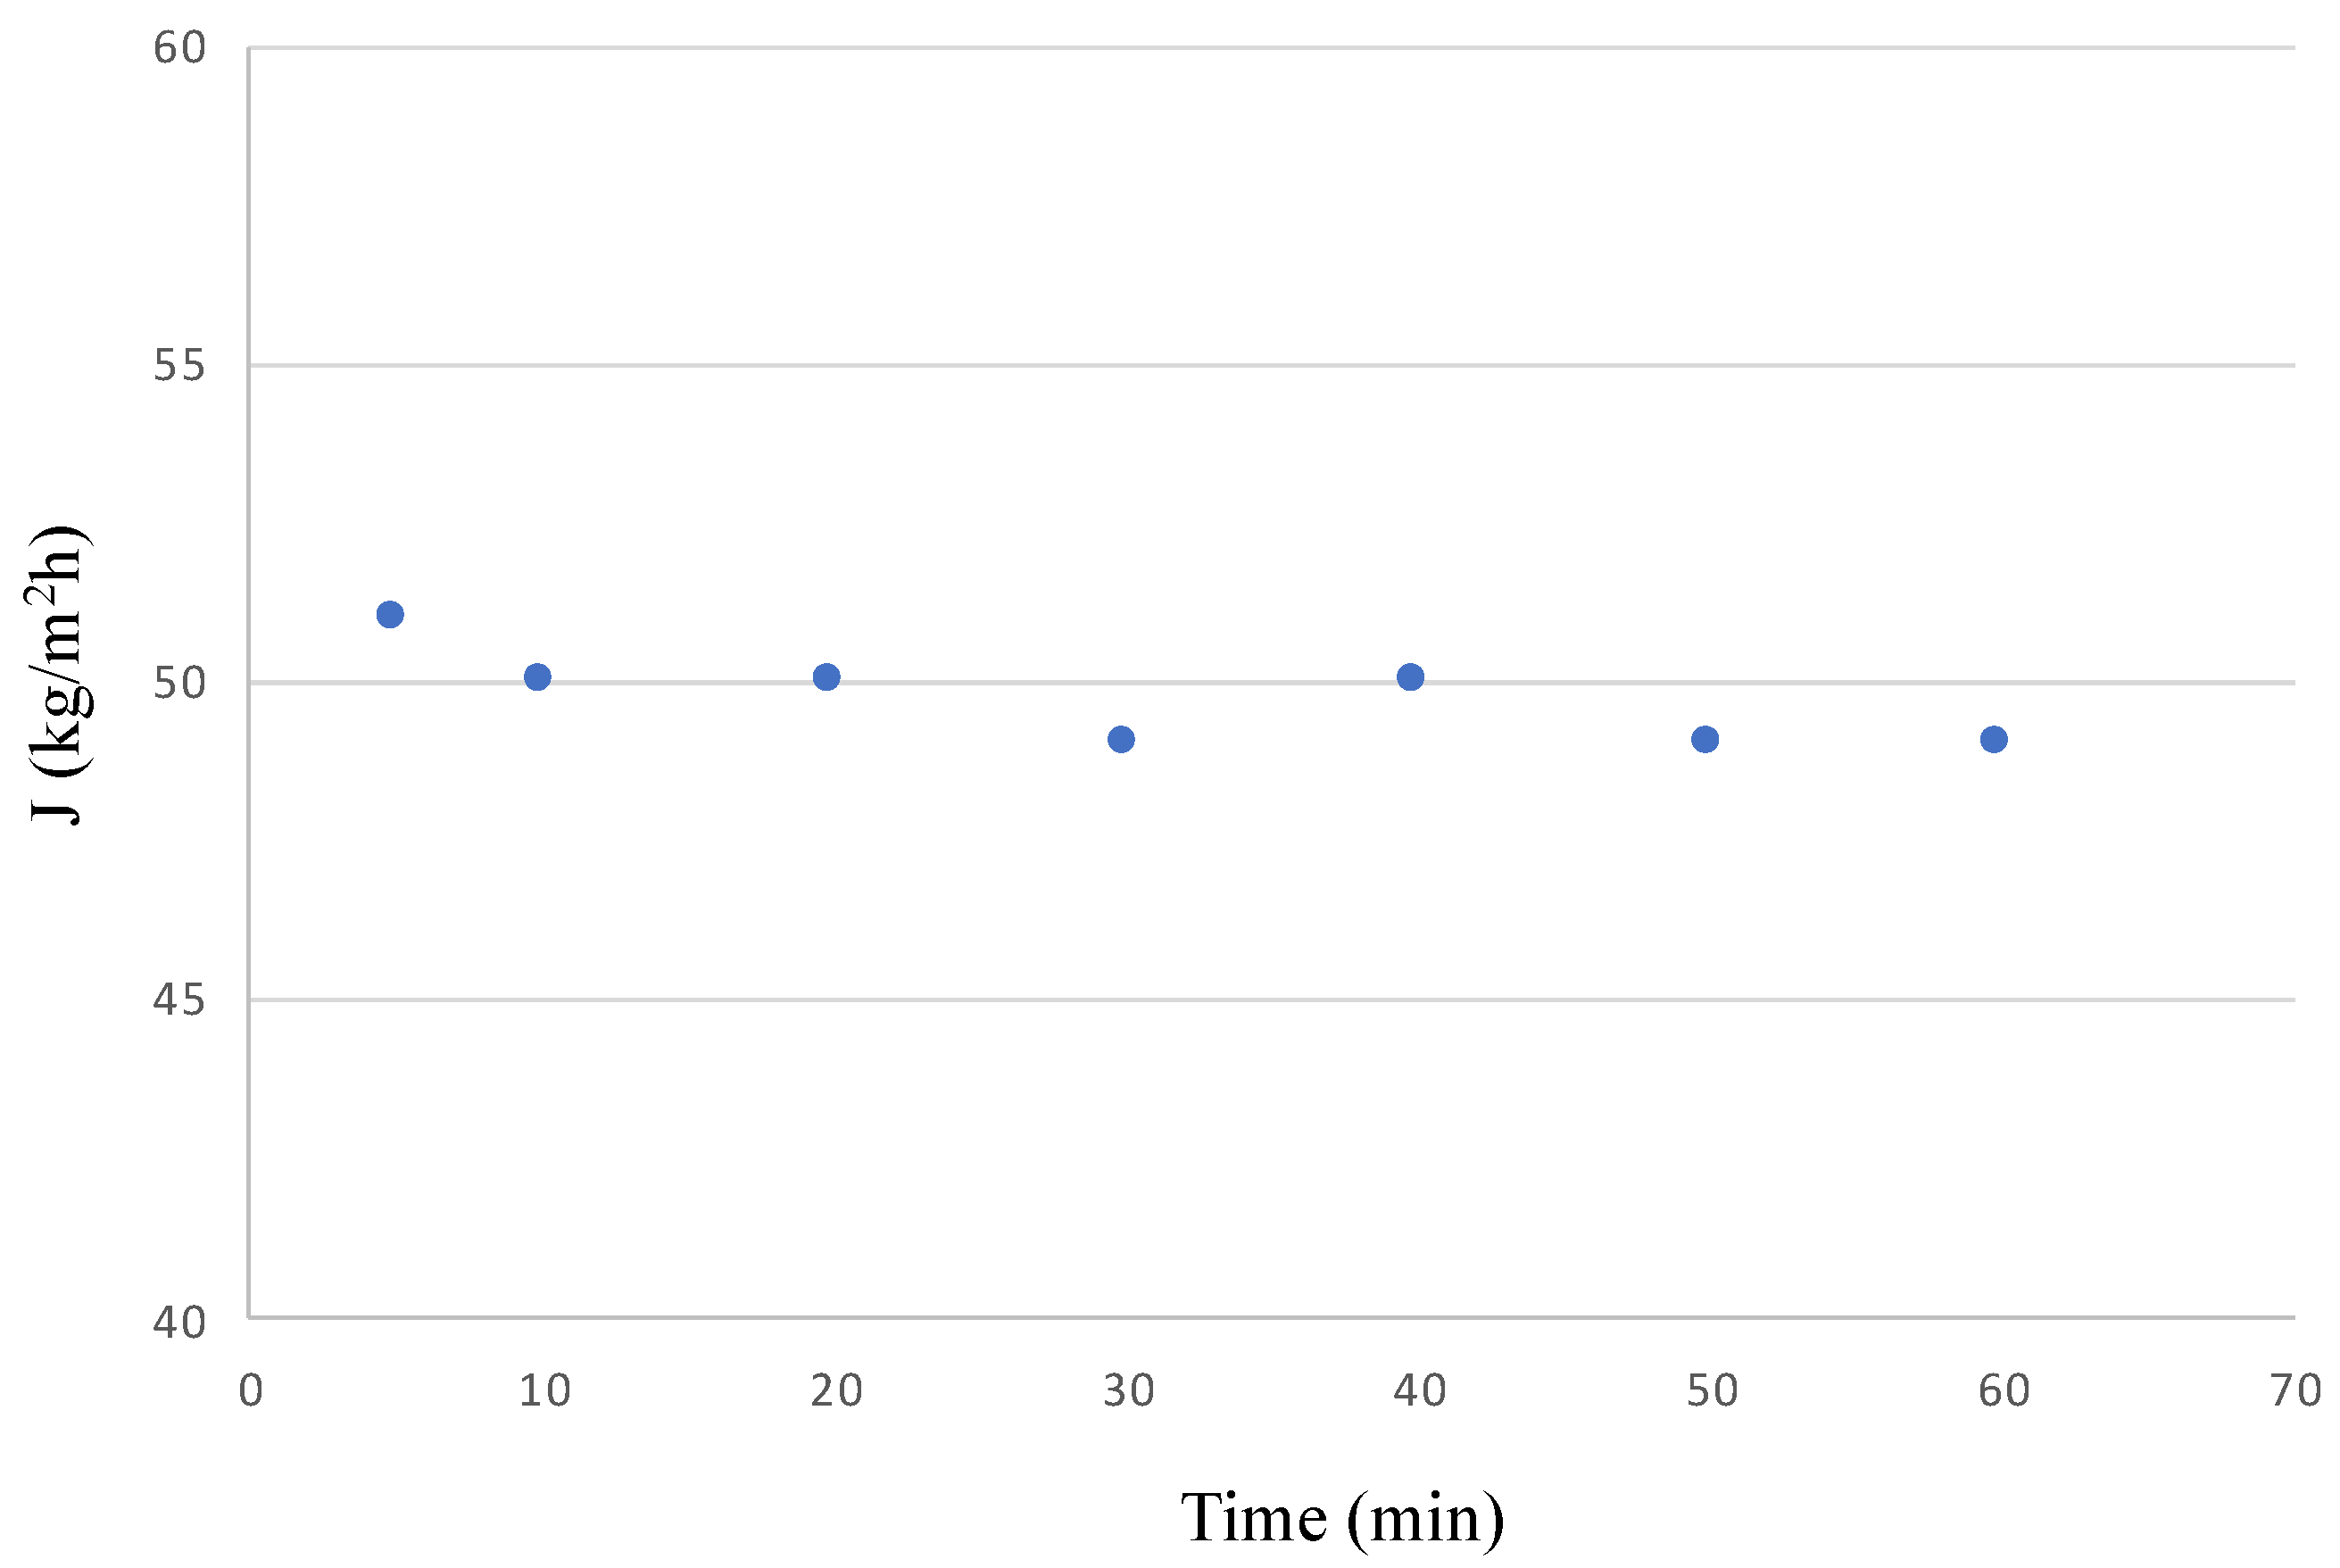
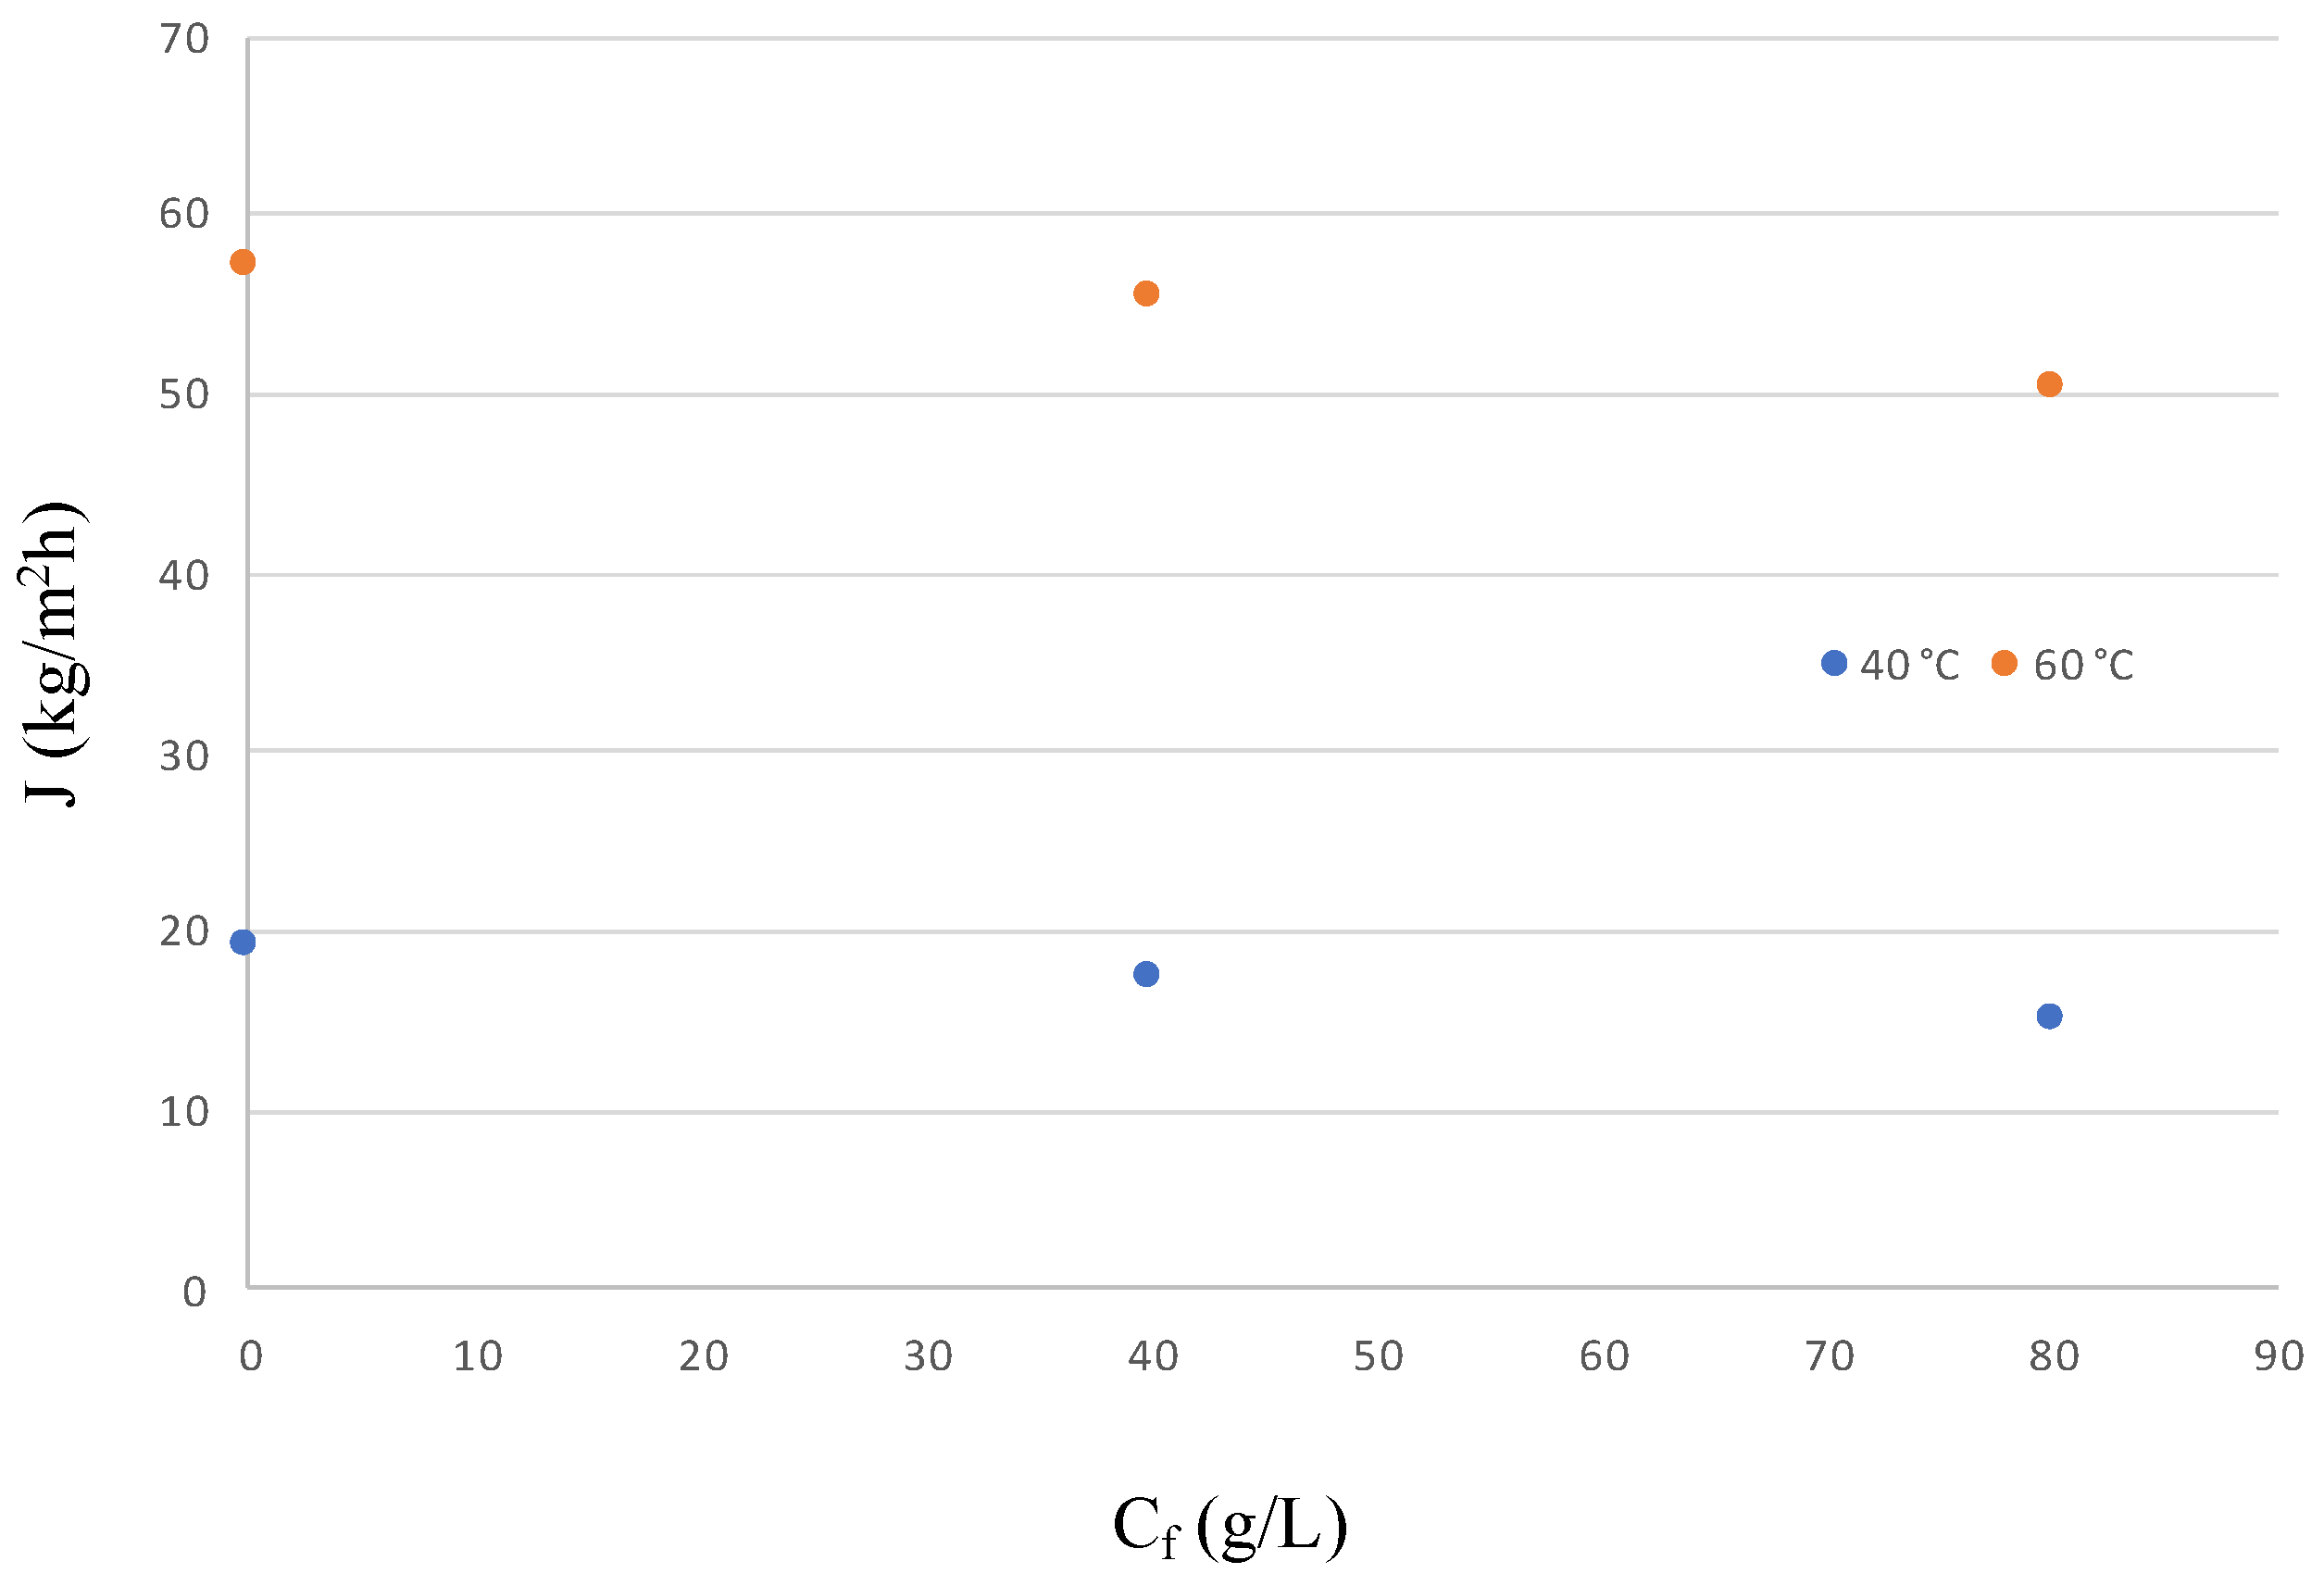
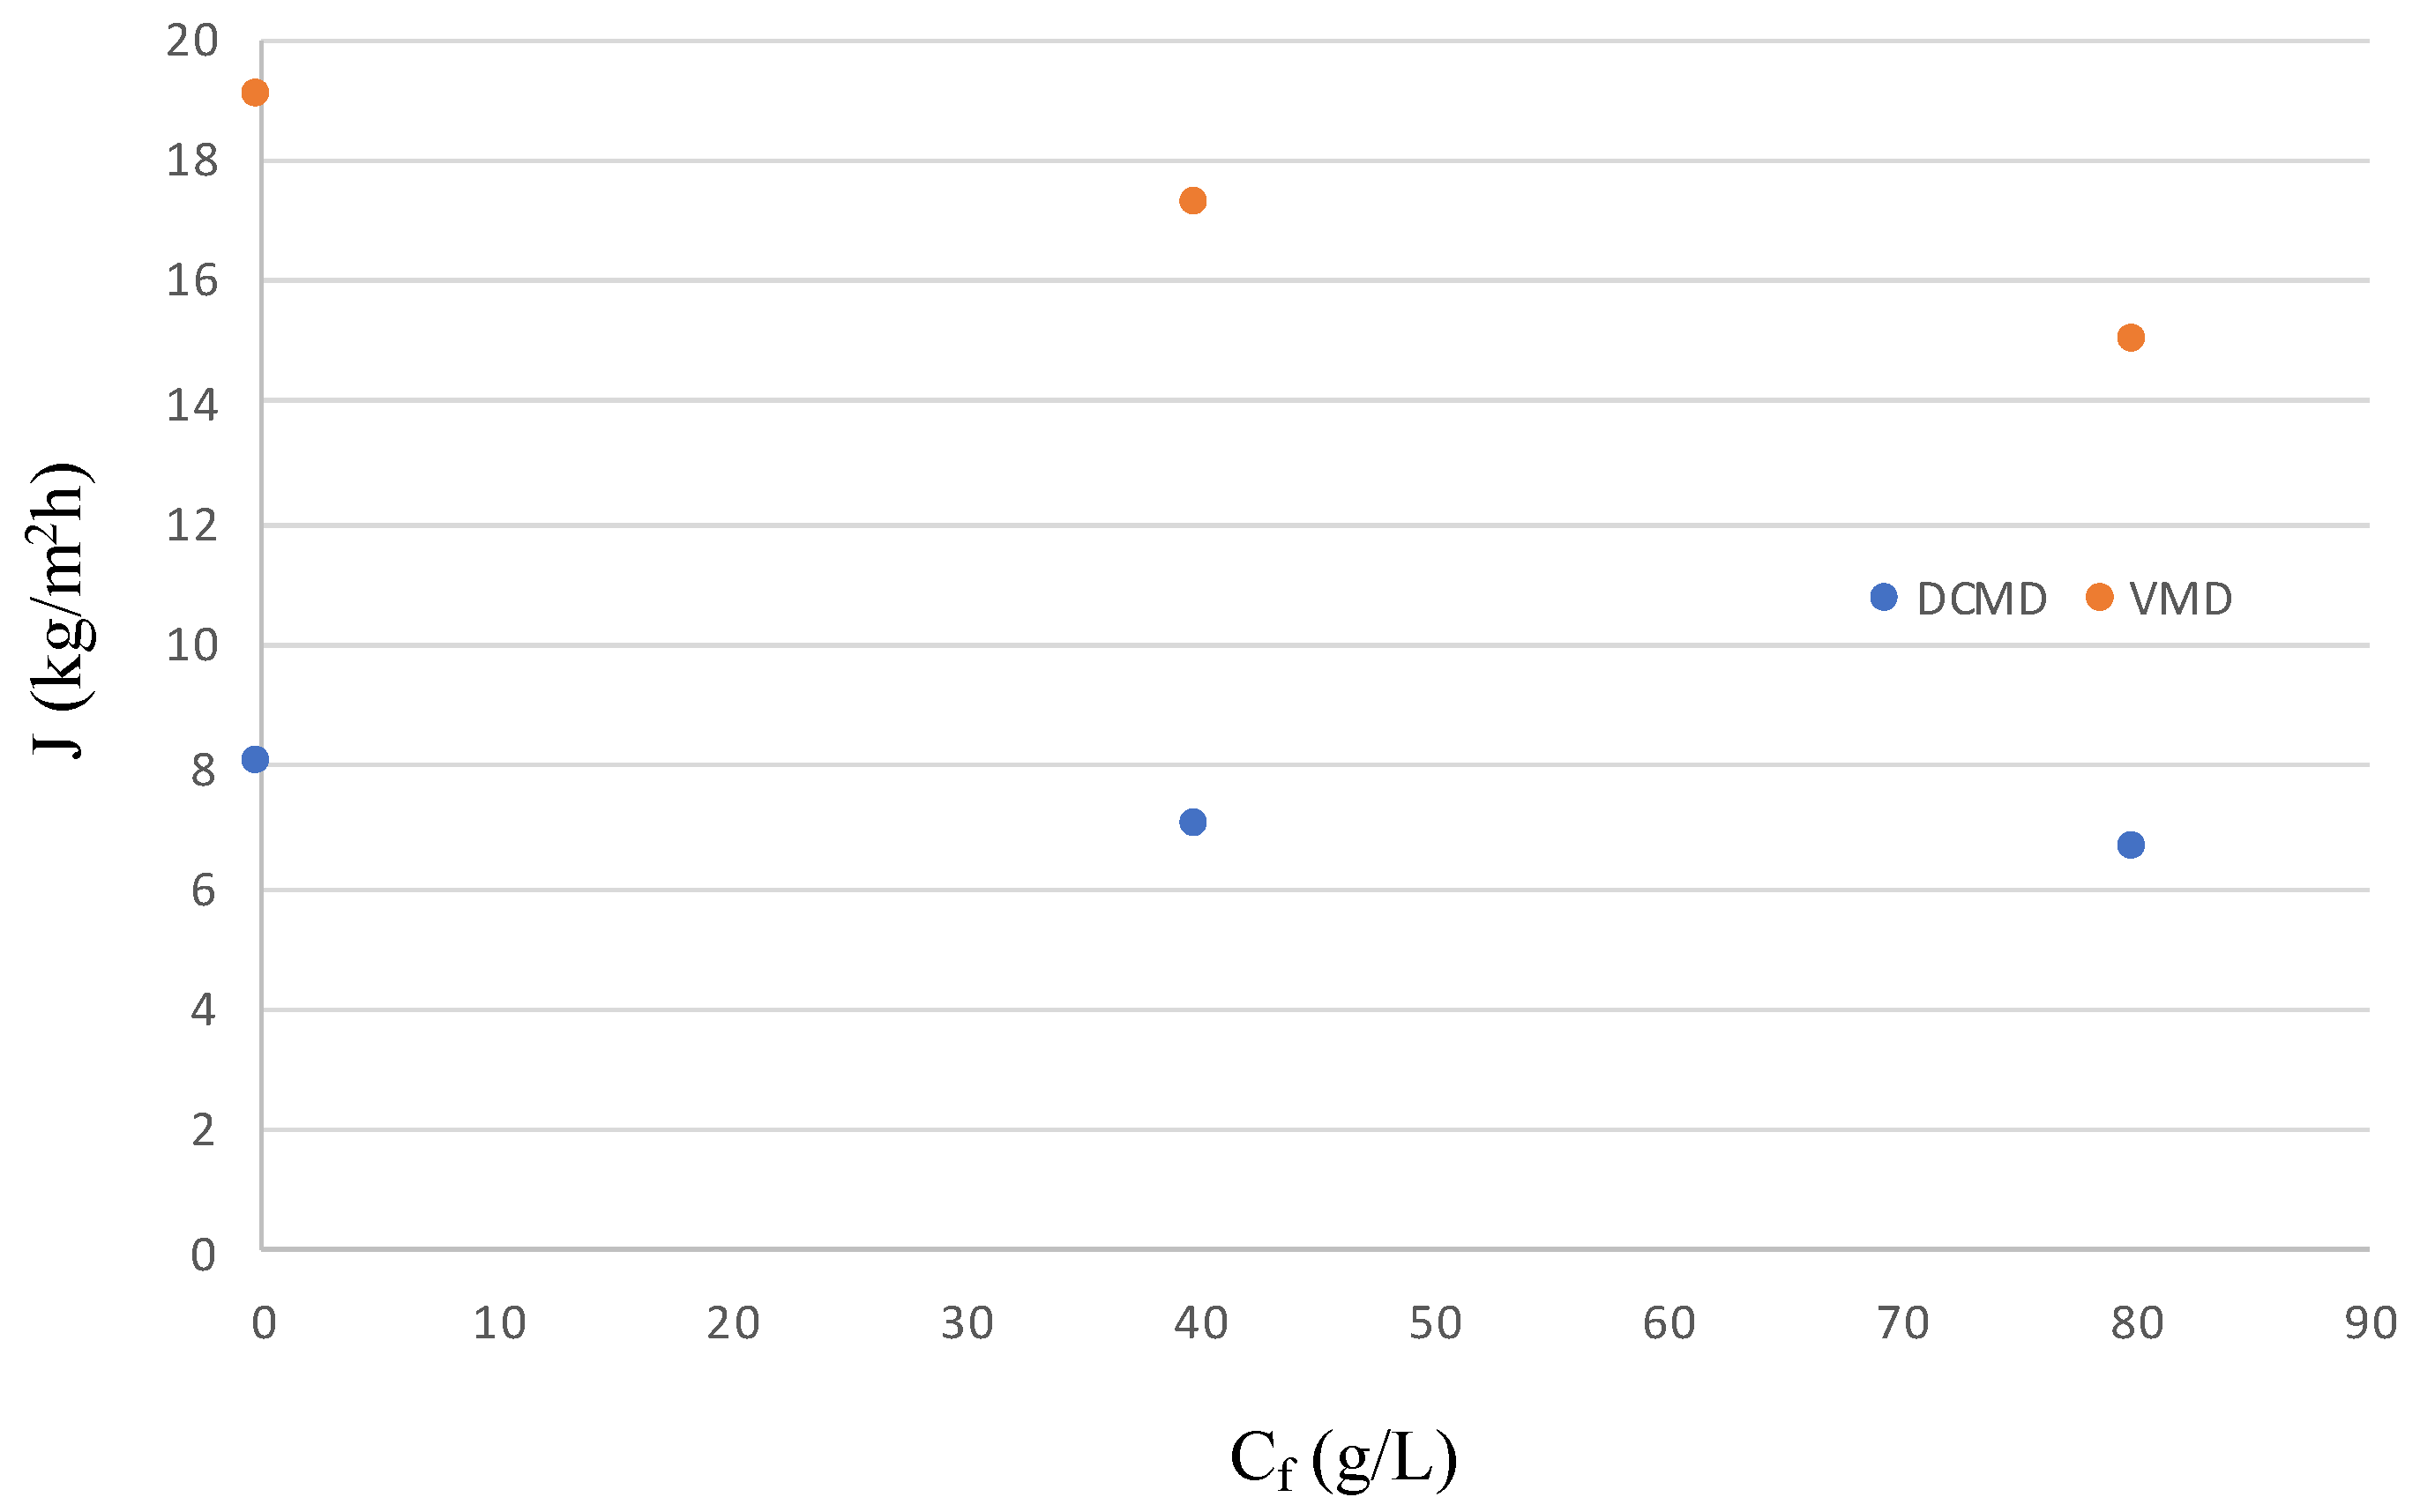
3.2. RO Brine Treatment
4. Conclusions
Supplementary Materials
Funding
Data Availability Statement
Conflicts of Interest
References
- Voutchkov, N. Re-Mineralization of Desalinated Water. Available online: www.SunCam.com (accessed on 9 December 2022).
- Roberts, D.A.; Johnston, E.L.; Knott, N.A. Impacts of desalination plant discharges on the marine environment: A critical review of published studies. Water Res. 2010, 44, 5117–5128. [Google Scholar] [CrossRef] [PubMed]
- van der Merwe, R.; Bleninger, T.; Scevedo-Feliz, D.; Lattemann, S.; Amy, G. Combining autonomous underwater vehicle missions with velocity and salinity measurements for the evaluation of a submerged offshore SWRO concentrate discharge. J. Appl. Water Eng. Res. 2014, 2, 118–139. [Google Scholar] [CrossRef]
- Heck, N.; Lykkebo Petersen, K.; Potts, D.C.; Haddad, B.; Paytan, A. Predictors of coastal stakeholders’ knowledge about seawater desalination impacts on marine ecosystems. Sci. Total Environ. 2018, 639, 785–792. [Google Scholar] [CrossRef] [PubMed]
- Petersen, K.L.; Paytan, A.; Rahav, E.; Levy, O.; Silverman, J.; Barzel, O.; Bar-Zeev, E. Impact of brine and antiscalants on reef-building corals in the Gulf of Aqaba—Potential effects from desalination plants. Water Res. 2018, 144, 183–191. [Google Scholar] [CrossRef] [PubMed]
- Gabelman, A.; Hwang, S.-T. Hollow fiber membrane contactors. J. Membr. Sci. 1999, 158, 61–106. [Google Scholar] [CrossRef]
- Drioli, E.; Criscuoli, A.; Curcio, E. Membrane Contactors: Fundamentals, Applications and Potentialities, 1st ed.; Elsevier: Amsterdam, The Netherlands, 2006; pp. 1–502. [Google Scholar]
- 3MTM Liqui-CelTM Membrane Contactor Technology Being Evaluated for Dissolved Gas Removal from Water in Many Hydrocarbon Processes. Available online: https://multimedia.3m.com/mws/media/1412629O/technology-evaluated-dissolved-gas-removal-hydrocarbon-proc.pdf (accessed on 9 December 2022).
- Degassing Sea Water Has Never Been This Compact, Efficient, and Adaptable. Available online: https://multimedia.3m.com/mws/media/1412627O/3m-liqui-cel-membrane-contactors-degassing-sea-water.pdf (accessed on 9 December 2022).
- Oxygen Removal from Injection Seawater in Offshore Platforms: Vacuum Tower Versus Membrane Deaeration Technology. Available online: www.cannonartes.com (accessed on 9 December 2022).
- Qu, D.; Wang, J.; Fan, B.; Luan, Z.; Hou, D. Study on concentrating primary reverse osmosis retentate by direct contact membrane distillation. Desalination 2009, 247, 540–550. [Google Scholar] [CrossRef]
- Safavi, M.; Mohammadi, T. High-salinity water desalination using VMD. Chem. Eng. J. 2009, 149, 191–195. [Google Scholar] [CrossRef]
- Mericq, J.P.; Laborie, S.; Cabassud, C. Vacuum membrane distillation of seawater reverse osmosis brines. Water Res. 2010, 44, 5260–5273. [Google Scholar] [CrossRef]
- Basha, K.S.A.; Dolfe, H.; Aslin, M.; El-Gabry, L. Membrane Distillation Test for Concentration of RO Brine at WESSCO, Jeddah. In Proceedings of the IDA World Congress, Perth, WA, Australia, 4–9 September 2011. [Google Scholar]
- Alkhudhiri, A.; Darwish, N.; Hilal, N. Treatment of high salinity solutions: Application of air gap membrane distillation. Desalination 2012, 287, 55–60. [Google Scholar] [CrossRef]
- Guan, Y.; Li, J.; Chen, F.; Zhao, J.; Wang, X. Influence of salt concentration on DCMD performance for treatment of highly concentrated NsCl, KCl, MgCl2 and MgSO4 solutions. Desalination 2015, 355, 110–117. [Google Scholar] [CrossRef]
- Sanmartino, J.A.; Khayet, M.; Garcia-Payo, M.C.; El-Bakouri, H.; Riaza, A. Treatment of reverse osmosis brine by direct contact membrane distillation: Chemical pretreatment approach. Desalination 2017, 420, 79–90. [Google Scholar] [CrossRef]
- Yan, Z.; Yang, H.; Qu, F.; Yu, H.; Liang, H.; Li, G.; Ma, J. Reverse osmosis brine treatment using direct contact membrane distillation: Effects of feed temperature and velocity. Desalination 2017, 423, 149–156. [Google Scholar] [CrossRef]
- Yan, Z.; Yang, H.; Yu, H.; Qu, F.; Liang, H.; Van der Bruggen, B.; Li, G. Reverse osmosis brine treatment using direct contact membrane distillation (DCMD): Effect of membrane characteristics on desalination performance and the wetting phenomenon. Environ. Sci. Water Res. Technol. 2018, 4, 428–437. [Google Scholar] [CrossRef]
- Schwantes, R.; Bauer, L.; Chavan, K.; Ducher, D.; Felsmann, C.; Pfafferott, J. Air gap membrane distillation for hypersaline brine concentration: Operational analysis of a full-scale module-New strategies for wetting mitigation. Desalination 2018, 444, 13–25. [Google Scholar] [CrossRef]
- Al-Furaihi, M.; Arena, J.T.; Ren, J.; Benes, N.; Nijmeijer, A.; McCutcheon, J.R. Triple-layer nanofiber membranes for treating high salinity brines using direct contact membrane distillation. Membranes 2019, 9, 60. [Google Scholar] [CrossRef]
- Abdelrazeq, H.; Khraisheh, M.; Hassan, M.K. Long-term treatment of highly saline brine in a direct contact membrane distillation (DCMD) pilot unit using polyethylene membranes. Membranes 2022, 12, 424. [Google Scholar] [CrossRef]
- Criscuoli, A.; Carnevale, M.C.; Mahmoudi, H.; Gaeta, S.; Lentini, F.; Drioli, E. Membrane contactors for the oxygen and pH control in desalination. J. Membr. Sci. 2011, 376, 207–213. [Google Scholar] [CrossRef]
- Criscuoli, A.; Drioli, E.; Moretti, U. Membrane contactors in beverage industry for controlling the water gas composition. Ann. N. Y. Acad. Sci. 2003, 984, 1–16. [Google Scholar] [CrossRef]
- Lawson, K.W.; Lloyd, D.R. Membrane distillation. J. Membr. Sci. 1997, 124, 1–25. [Google Scholar] [CrossRef]
- Hashemifard, S.A.; Ismail, A.F.; Matsuura, T.; Rezaei DashtArzhandi, M. Performance of silicon rubber coated polyetherimide hollow fibers for CO2 removal via a membrane contactor. RSC Adv. 2015, 5, 48442–48455. [Google Scholar] [CrossRef]
- Iversen, S.B.; Bhatia, V.K.; Dam-Johansen, K.; Jonsson, G. Characterization of microporous membranes for use in membrane contactors. J. Membr. Sci. 1997, 130, 205–217. [Google Scholar] [CrossRef]
- Tang, Y.; Li, N.; Liu, A.; Ding, S.; Yi, C.; Liu, H. Effect of spinning conditions on the structure and performance of hydrophobic PVDF hollow fiber membranes for membrane distillation. Desalination 2012, 287, 326–339. [Google Scholar] [CrossRef]
- Fan, H.; Peng, Y. Application of PVDF membranes in desalination and comparison of the VMD and DCMD processes. Chem. Eng. Sci. 2012, 79, 94–102. [Google Scholar] [CrossRef]
- Drioli, E.; Ali, A.; Simone, S.; Macedonio, F.; AL-Jlil, S.A.; Al Shabonah, F.S.; Al-Romaih, H.S.; Al-Harbi, O.; Figoli, A.; Criscuoli, A. Novel PVDF hollow fiber membranes for vacuum and direct contact membrane distillation applications. Sep. Pur. Technol. 2013, 115, 27–38. [Google Scholar] [CrossRef]
- Zhang, J.W.; Fang, H.; Wang, J.W.; Hao, L.Y.; Xu, X.; Chen, C.S. Preparation and characterization of silicon nitride hollow fiber membranes for seawater desalination. J. Membr. Sci. 2014, 450, 197–206. [Google Scholar] [CrossRef]
- Carnevale, M.C.; Gnisci, E.; Hilal, J.; Criscuoli, A. Direct Contact and Vacuum Membrane Distillation application for the olive mill wastewater treatment. Sep. Purif. Technol. 2016, 169, 121–127. [Google Scholar] [CrossRef]
- Ramlow, H.; Machado, R.A.F.; Bierhalz, A.C.K.; Marangoni, C. Influence of dye class on the comparison of direct contact and vacuum membrane distillation applied to remediation of dyeing wastewater. J. Environ. Sci. Health Part A 2019, 54, 1337–1347. [Google Scholar] [CrossRef]
- Schnittger, J.; McCutcheon, J.; Hoyer, T.; Weyd, M.; Fischer, G.; Puhlfürß, P.; Halisch, M.; Voigt, I.; Lerch, A. Hydrophobic ceramic membranes in MD processes—Impact of material selection and layer characteristics. J. Membr. Sci. 2021, 618, 118678. [Google Scholar] [CrossRef]
- Sparenberg, M.-C.; Hanot, B.; Molina-Fernández, C.; Luis, P. Experimental mass transfer comparison between vacuum and direct contact membrane distillation for the concentration of carbonate solutions. Sep. Pur. Technol. 2021, 275, 119193. [Google Scholar] [CrossRef]
- Guan, G.; Yang, X.; Wang, R.; Field, R.; Fane, A.G. Evaluation of hollow fiber-based direct contact and vacuum membrane distillation systems using aspen process simulation. J. Membr. Sci. 2014, 464, 127–139. [Google Scholar] [CrossRef]


| Salt | Seawater | Low RO Brine | High RO Brine |
|---|---|---|---|
| NaCl | 23.27 | 33.24 | 46.54 |
| Na2SO4 | 3.99 | 5.71 | 8.00 |
| MgCl2 6H2O | 11.28 | 16.11 | 22.56 |
| KBr | 0.095 | 0.136 | 0.19 |
| CaCl2 2H2O | 1.47 | 2.1 | 2.94 |
| NaHCO3 | 0.1932 | 0.276 | 0.3864 |
| KCl | 0.6635 | 0.948 | 1.327 |
| Na2CO3 H2O | 0.0072 | 0.0103 | 0.0144 |
| MD Configuration | Flux (kg/m2h) | Permeate Conductivity (μS/cm) |
|---|---|---|
| DCMD (80 °C) | 49 | 2.8 |
| VMD (60 °C) | 50.3 | 3.0 |
| MD Configuration | Module (Area) | Membrane (dp; ε, δ) | Feed (g/L) | Flux (kg/m2h) | Ref. |
|---|---|---|---|---|---|
| VMD (55 °C) | Flat (9.1 cm2) | 0.2 μm; 75%.; 163 μm | 100 | 14.4 | [12] |
| VMD (50 °C) | Flat (57.8 cm2) | 0.22 μm; 40%.; 175 μm | 64 | 17 | [13] |
| AGMD (62 °C) | Flat (2.8 m2) | 0.05–0.2 μm; n.a.; n.a. | 39.5 | 2 | [14] |
| AGMD (50 °C) | Flat (143.5 cm2) | 0.2 μm; n.a.; 175 μm | 80 | 0.15 | [15] |
| DCMD (50 °C) | Flat (14.4 cm2) | 0.22 μm; 82%.; 35 μm | 88 | 17 | [16] |
| DCMD (75 °C) | Flat (39.4 cm2) | 0.33 μm; 78%.; 107 μm | 55 | 52.3 | [17] |
| DCMD (70 °C) | Flat (25 cm2) | 0.45 μm; 73%.; 113 μm | 49.6 | 72.3 | [18] |
| AGMD (80 °C) | Spiral wound (8.34 m2) | 0.2 μm; 80%.; 76 μm | 80 | 1.5 | [20] |
| DCMD (50 °C) | Flat (n.a.) | n.a.; 88.6%.; 115 μm | 292 | 8 | [21] |
| DCMD (70 °C) | Flat (100 cm2) | 0.3–0.7 μm; n.a.; 15.5 μm | 75.5 | 120 | [22] |
| DCMD (73 °C) | Flat (26.4 cm2) | 0.49 μm; 78%.; 82 μm | 70 | 16 | [29] |
| DCMD (80 °C) | Flat (40 cm2) | 0.2 μm; 70%; 91 μm | 80 | 49 | This work |
| VMD (60 °C) | Flat (40 cm2) | 0.2 μm; 70%; 91 μm | 80 | 50.3 | This work |
Disclaimer/Publisher’s Note: The statements, opinions and data contained in all publications are solely those of the individual author(s) and contributor(s) and not of MDPI and/or the editor(s). MDPI and/or the editor(s) disclaim responsibility for any injury to people or property resulting from any ideas, methods, instructions or products referred to in the content. |
© 2023 by the author. Licensee MDPI, Basel, Switzerland. This article is an open access article distributed under the terms and conditions of the Creative Commons Attribution (CC BY) license (https://creativecommons.org/licenses/by/4.0/).
Share and Cite
Criscuoli, A. The Potential of Membrane Contactors in the Pre-Treatment and Post-Treatment Lines of a Reverse Osmosis Desalination Plant. Separations 2023, 10, 129. https://doi.org/10.3390/separations10020129
Criscuoli A. The Potential of Membrane Contactors in the Pre-Treatment and Post-Treatment Lines of a Reverse Osmosis Desalination Plant. Separations. 2023; 10(2):129. https://doi.org/10.3390/separations10020129
Chicago/Turabian StyleCriscuoli, Alessandra. 2023. "The Potential of Membrane Contactors in the Pre-Treatment and Post-Treatment Lines of a Reverse Osmosis Desalination Plant" Separations 10, no. 2: 129. https://doi.org/10.3390/separations10020129