Article

Synthesis and Characterization of Mesoporous Silica Modified with Purpald and Its Application in the Preconcentration of Cu2+ and Cd2+ from Aqueous Samples through Solid-Phase Extraction

by
Marcos Henrique Pereira Wondracek
1,
Alexandre de Oliveira Jorgetto
2,
Adrielli Cristina Peres da Silva
3,*,
José Fabián Schneider
4,
Valber de Albuquerque Pedrosa
3,
Margarida Juri Saeki
3 and
Gustavo Rocha de Castro
3
1
Faculty of Science and Technology, University of Grande Dourados, Rodovia Dourados-Itahum, km 12, Dourados 79804-970, MS, Brazil
2
Interdisciplinary Laboratory of Nanostructures and Semiconductors (LINSE-IQ-UNESP), Rua Francisco Degni, 55, Araraquara 14800-060, SP, Brazil
3
Chemistry and Biochemistry Department, Institute of Biosciences of Botucatu-UNESP, C.P. 510, Botucatu 18618-000, SP, Brazil
4
Instituto de Física de São Carlos (IFSC), Universidade de São Paulo (USP), São Carlos 13566-590, SP, Brazil
*
Author to whom correspondence should be addressed.
Separations 2023, 10(2), 108; https://doi.org/10.3390/separations10020108
Submission received: 13 December 2022 / Revised: 16 January 2023 / Accepted: 19 January 2023 / Published: 3 February 2023

Abstract

:
The synthesis of an organofunctionalized mesoporous silica was accomplished by a two-step process involving (1) the co-condensation of a silylant agent at the surface of silica, followed by (2) the immobilization of Purpald (ligand) at the organic termination of the silytant agent. The characterization of the organofunctionalized material indicated the presence of NH2 groups, and the immobilization of the ligand was confirmed by 29Si- and 13C-nuclear magnetic resonance. The material’s surface area was determined as 370 m2 g−1. Batch adsorption experiments enabled the determination of optimum pH conditions for the adsorption of Cu(II) and Cd(II). Under optimal pH, the pseudo-second-order kinetic model and Langmuir model provided the best correlations to describe the materials adsorption behavior, suggesting a chemisorption mechanism. When tested in continuous-flow preconcentration experiments, the flow rate and eluent concentration demonstrated to affect the removal of Cu(II) and Cd(II), while the buffer concentration had an effect only over the adsorption of Cu(II). Under optimized preconcentration conditions, it was possible both to determine the concentrations of Cu(II) and Cd(II) in samples such as mineral water, ground water, tap water and river water. Ions commonly found in drinking and natural waters (Na+, K+, Ca2+, Mg2+, Fe3+, Ba2+, Cl, SO42−, HCO3, and H2PO4) did not affect the preconcentration of any of the studied analytes. Reutilization experiments indicated that the adsorbent material can withstand at least 40 adsorption/desorption preconcentration cycles with no efficiency loss.

Graphical Abstract

1. Introduction

Some metals play an important role in physiological processes. For instance, cobalt, trivalent chrome, cooper, iron, manganese and selenium are essential micronutrients within a given concentration range; however, these species may be toxic if their concentrations exceed an optimal range (potentially toxic metals). However, other metal species have no known biological function for any organism, such as cadmium, lead, mercury, and arsenic (toxic metals) [1]. In contrast to the case of harmful organic pollutants, toxic and potentially toxic metal species cannot be degraded to non-toxic products. Furthermore, once they are emitted to the environment, these species begin to participate in global eco-biological processes in which waters are the main distribution vectors, causing accumulation in microorganisms, plants and animals throughout their life [1]. In this sense, the development of simple, effective and sensitive methods to monitor metal concentrations in waters and wastewaters is of particular importance for public health and environmental pollution control.
Several instrumental techniques, such as atomic absorption spectrometry (FAAS), graphite furnace electrothermal absorption spectrometry (GFAAS), atomic fluorescence spectrometry (AFS), inductively-coupled plasma optical emission spectrometry (ICP-OES) and inductively coupled plasma mass spectrometry (ICP-MS), have been widely used in the determination of metals in water and environmental samples. However, such techniques are very often associated with high installation and operation costs, and require experience and high qualification of the analyst to collect data and interpret the results. Thus, the use of low-cost analytical techniques, preceded by a preconcentration procedures can be an economically viable alternative to overcome the low intrinsic sensitivity of equipment with low detection power. In this context, FAAS appears as a relatively low-cost, simple and fairly widely distributed analytical technique to be used in the determination of metal contents at low concentrations, provided that preconcentration procedures are applied to the samples prior to analysis. By following this approach, one can compensate for the lower detection and quantification limits of FAAS technique (compared to those of ICP-MS, ICP-OES and GFAAS techniques) and determine trace levels of toxic and potentially toxic metals in aqueous media.
In the literature, we can find several methods to extract and preconcentrate metal ions from aqueous samples, such as: Cloud-point extraction [2], precipitation/coprecipitation [3], liquid-liquid extraction (LLE) [4] and solid-phase extraction (SPE) [5]. The SPE technique has become more popular than the LLE technique due to several of its advantages, e.g., lower waste production, lower matrix effect, possibility of solid-phase reuse, higher enrichment factors, lower consumption of organic solvents, possibility of coupling SPE with different analytical techniques and minimized environmental impacts [5]. However, it has as the main disadvantage a lack of selectivity, since coexisting metal species in the sample may interfere in the determination of the analyte. Thus, the development of more selective adsorbent materials for the determination of metal contents has received special attention from the scientific community [6,7,8,9,10,11,12,13]. In this regard, silica has been widely used as an adsorbent for the extraction of metals by SPE because of its hydrophilicity, the possibility of obtaining highly porous types of silica through mild synthesis routes (such as sol-gel) and the ease of chemically modifying its surface to obtain greater selectivity towards different analytes. Due to these reasons, many studies using chemically-modified silica as solid phase have already been reported [14,15,16,17].
The present work describes the synthesis of a SBA-15-type mesoporous silica, its surface functionalization with the ligand 4-amino-3-hydrazino-5-mercapto-1,2,4-triazole (Purpald) and its application as an adsorbentin SPE, aiming at the development of a preconcentration method for Cu(II) and Cd(II) extraction from aqueous medium. It is also worth pointing out that the application of our material in SPE allowed using FAAS for the determination of trace levels of Cu(II) and Cd(II), thus evidencing the high enrichment factor of the proposed method. Moreover, our method presented high analytical frequency and low cost.

2. Materials and Methods

2.1. Solvents, Solutions, and Reactants

All reagents were of high purity or at least of analytical grade. Aqueous solutions were prepared with high-purity deionized water exhibiting a resistivity of 18.2 MΩ cm−1, as collected from a Direct-Q system (Millipore, France). The stock solutions (1000 mg L−1) were prepared by dissolving appropriate amounts of high-purity salts (Cu(NO3)2 and Cd(NO3)2; (VETEC, Brazil)) in deionized water.
Silica synthesis and organofunctionalization were carried out with tetraethylorthosilicate (TEOS; marca; 99%), 3-chloropropyltriethoxysilane (CPTS; Aldrich; 95%), NH4OH (VETEC, 28%), 4-amino-3-hydrazino-5-mercapto-1,2,4-triazole (Purpald®; Aldrich; 99%), N,N-dimethylformamide (DMF; Sigma-Aldrich 99.8%) and triethylamine (Sigma-Aldrich; 99%). Pluronic P123 (Basf) was employed as a template for the mesoporous structure of the silica particles. Ethyl alcohol (Synth; 99.8%) was used to wash the synthesized material. The calibration curves of the metal ions under study were prepared by diluting 1000 mg L−1 atomic absorption spectroscopy standard solutions (Specsol) within linear concentration ranges. The eluent solutions were prepared by diluting appropriate amounts of concentrated HCl (Carlo Erba, 37%) or HNO3 (Carlo Erba, 56%), or a mixture of HCl and Thiourea (Carlo Erba). The pH of the solutions was adjusted by adding diluted HNO3 or NaOH (Sigma-Aldrich) solutions. All vessels were washed with HNO3 (10%; v/v) for at least 24 h, rinsed with deionized water, and dried at room temperature before use.

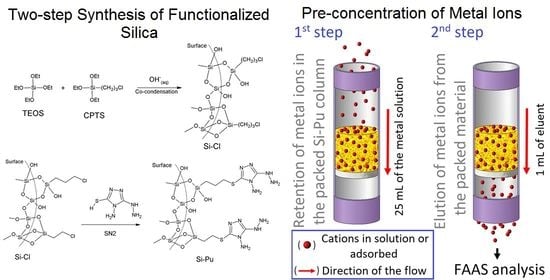
2.2. Synthesis of the Silica by Co-Condensation

80 mL of ultrapure water, 40 mL of NH4OH (28%) and 4.0 g of Pluronic were mixed in an Erlenmeyer flask, and then the mixture was heated up to 40 °C under stirring until the complete dissolution of Pluronic. Then, 5.0 mL of TEOS and 2.05 mL of CPTS were added to the reaction flask, keeping the agitation for 24 h. Afterwards, this mixture was transferred to a sealed vessel and aged in an oven at 100 °C for 24 h. The precipitated mesoporous silica was then filtered, dried in oven, milled, washed in a Sohxlet system with an ethanol-water solution (1:1, v:v) for 24 h and stored in a desiccator before use. The material produced in this step was called Si-Cl. The steps of this reaction are depicted in Figure 1.

2.3. Characterization of the Material

The modified silica was characterized by infrared spectroscopy using a FTIR spectrometer (Nicolet Nexus 670; Thermo, Waltham, MA, USA). The materials were scanned 200 times at a resolution of 4 cm−1 through transmittance mode using KBr pellets (200 mg) containing 1 mass % of the sample. Specific surface area measurements were carried out in a Micromeritics ASAP2010 apparatus (Micromeritics Instrument Corp.) using 0.5 g of material. Elemental analysis was performed in a Thermo Finnigan Flash 1112 Series EA CHN elemental analyzer with 2.0 mg of the materials. The quantification of Cu(II) and Cd(II) was performed using a flame atomic absorption spectrophotometer (240FS; Agilent, Santa Clara, CA, USA). Scanning electron microscopy (SEM) images were collected in a Quanta 200 SEM (FEI Co.). High-resolution nuclear magnetic resonance (NMR) spectra of the solid materials were obtained in an Agilent DD2 by applying a magnetic field of 5.9 T. The samples were packed in zirconium rotators of 4 mm in diameter. For the 13C-NMR analyses, rotation of magical angle spinning was applied with a frequency of 5 kHz and cross-polarization 1H → 13C. The Hartmann-Hahn contact time was 1 ms, and π/2 pulse of 1H had a duration of 6 µs. During the acquisition of the 13C signal, 1H heteronuclear decoupling was applied with a nutation of 100 kHz. For each spectrum, 20,000 signals were collected for a duration of 5 s. The chemical deviation of 13C was obtained in comparison with tetramethylsilane (TMS), using a solid sample of adamantane as a secondary standard, whose CH2 resonance was observed in 38.6 ppm/TMS. In the 29Si-NMR analyses, a Hahn echo series of π/2-Tr-π with a pulse of π/2 of 7.5 µs, Tr = 200 µs (one period of rotation), and 14,800 acquisitions for a duration of 30 s were applied.

2.4. Functionalization of the Material

The modification of the material’s surface was performed in a double-necked reaction flask. The mixture consisted of 20 mL of DMF, 0.34 g of Purpald, and 0.5 mL of triethylamine, which was stirred and heated to 150 °C. After the dissolution of Purpald, 0.6 g of the activated Si-Cl material was added to the reaction flask and the mixture was stirred for 72 h. Afterwards, the material was filtered under vacuum and washed in DMF at 100 °C for 30 min to remove the excess of ligand molecules. This procedure was repeated twice. Residual DMF was then removed by washing the modified silica in a Soxhlet system for 24 h with an ethanol–water mixture (1:1, v:v), being finally dried at 50 °C for 24 h. The material obtained from this synthesis was named Si-Pu. The synthesis steps are schematically shown in Figure 2.

2.5. Point of Zero Charge (PZC) Experiment

A PZC experiment was accomplished to uncover at which pH the surface of the Si-Pu material exhibited a neutral global charge. In such experiment, 20.0 mg of this material were agitated with 10.0 mL of solutions whose pH varied from 1 to 12. The solutions had their pH adjusted by the addition of HCl or NaOH solutions, and the material samples were agitated for 24 h before measuring the final pH [18].

2.6. Adsorption and Reutilization Experiments

Conventional batch experiments consisted of agitating 20.0 mg of the material with 1.80 mL of metal solution in 2 mL Eppendorf flasks, which were later centrifuged and had the supernatant collected to have its metal content analyzed via FAAS. Parameters such as contact time, pH and metal concentration were varied independently in each experiment. Contact times from 1 to 240 min were studied, and the pH of the solutions was varied from 1 to 6. The effect of the metal concentration was investigated within the range from 1 to approximately 400 mg L−1.

2.7. Off-Line Flow Pre-Concentration System

The experiments in continuous flow were carried out using a peristaltic pump (Minipulse 3, Gilson, France). The material Si-Pu was packed between two Frit disks in commercial SPE cartridges with 9.5 mm of internal diameter to obtain the pre-concentration columns.
The continuous-flow pre-concentration process was carried out in three steps: First, a metal solution aliquot was percolated through the column at a constant flow rate with the aid of the peristaltic pump to have its metal content adsorbed by the packed material. Subsequently, the eluent was also percolated through the column to release the adsorbed metal species from the solid phase. In the next step, the column was washed by percolating abundant deionized water, then to remove residues of the eluent impregnated in the packed material. Once these processes were finished, a new adsorption-desorption cycle was initiated. The typical conditions employed in the experiments were: sample volume = 25.0 mL; analyte concentration = 0.10 mg L−1; mass of material = 50.0 mg for Cu(II) and 100 mg for Cd(II); and eluent volume = 1.0 mL. Preliminary experiments indicated that the most effective eluent for Cu(II) was a 1.0 mol L−1 HCl and 0.2 mol L−1 thiourea solution, whereas, for Cd(II), it was 1.0 mol L−1 nitric acid. In the study about the effect of the concentration of the eluent, the concentration of thiourea remained constant (0.2 mol L−1), whereas only the concentration of HCl varied.
A cyclic adsorption-desorption experiment was also carried out to determine the physical and chemical stability of the synthesized material. This experiment consisted of carrying out cycles of percolation and elution through a packed column containing 40 mg of Si-Pu. Thus, 100 mL aliquots of the Cu(II) (0.10 mg L−1) reference solutions were percolated through the column at a flow rate of 2.5 mL min−1, and the metal elution was performed with 1.0 mL of eluent (a binary solution of 1.0 mol L−1 HCl and 0.2 mol L−1 thiourea) at a flow rate of 1.0 mL min−1. The eluate was collected and had its metal content determined via FAAS. All experiments were accomplished at room temperature (approximately 25 °C).

3. Results and Discussion

3.1. Characterization of the Materials

3.1.1. C and N Elemental Analysis

Carbon and nitrogen elemental analysis were accomplished to quantify the amount of both, the silylant agent and the ligand attached to silica surface. The carbon composition of the material Si-Cl was 13.16 wt.%, and this value allowed determining the amount of attached silylant agent as 3.2 mmol g−1. In turn, the nitrogen composition provided 0.19 mmol g−1 as the amount of ligand anchored on the surface of the silica.

3.1.2. Fourier Transform Infrared Spectroscopy (FTIR) Analysis

FTIR was employed to identify the organic groups present in the materials obtained after each step of the synthesis. Their spectra can be seen in Figure 3.
In the spectra of the non-modified silica and the modified materials (Si-Cl and Si-Pu), the intense band centered at 3400 cm−1 corresponds to the stretching vibration of O-H bonds from silanol groups (Si-OH) and from water adsorbed onto silica [19]. It is also possible to observe other characteristic silica vibration bands at 1100 cm−1 for these very spectra, which are related to the stretching vibration of νSi-O-Si, and those at 805 and 457 cm−1, corresponding to the bending vibration of δSi-O-Si [19]. As we compare the spectrum of the non-modified silica and that of Si-Cl [Figure 3], it is possible to notice the appearance of threebands at 2950 cm−1, related to the stretching vibration of C-H bonds; at 645 cm−1, assigned to the vibration of Si-CH2 groups; and at 698 cm−1, associated to the vibration of C-Cl bonds [19]. These results support the occurrence of the organofunctionalization of silica with the silylant agent.
By comparing the spectra of Si-Cl and that of Si-Pu (Figure 3), we may observe a significant alteration of the spectrum for the material Si-Pu in the spectral region of 1635–1643 cm−1, which was associated to the symmetrical angular deformation of N-H bonds [19] from the ligand. Another noteworthy difference is the disappearance of the band attributed to the vibration of C-Cl bonds at 645 cm−1 for Si-Pu, indicating that the chlorine atoms on the surface of the material Si-Cl were substituted by the ligand molecules. Additionally, the strong stretching band of N-H groups, usually located in the spectral region of 3300–3500 cm−1, could not be detected. This probably occurred because the broad O-H stretching band of silica overlapped with those of the N-H bands at such a region.

3.1.3. Determination of the Specific Surface Area by the BET Method

The analysis of gas adsorption is an important technique to characterize the textural properties of the samples, since it provides information on the material’s surface area, pore volume and pore size distribution. This analysis indicated that the nitrogen adsorption onto the material Si-Pu have a type-IV isotherm, accompanied by a type-HI hysteresis. According to IUPAC, such features are characteristic of cylindrically-shaped mesopores [20].
To evaluate the contribution of the organic content to the surface features of the Si-Pu material, it was calcined and had its surface area measured for comparison. The values for the surface area obtained by the BET method, the average pore size determined by the BJH method and average pore volume of the modified (Si-Pu) and calcined (Si-Pucalcined) materials can be seen in Table 1.
The results expressed in Table 1 demonstrate that the surface area of the calcined material is significantly greater than that of the organofunctionalized silica. This observation was expected since the calcination process removed the organic coverage from this material, resulting in an increase in surface area and in average pore volume for the calcined material. Finally, we may also notice from Table 1 that the organofunctionalization process did not considerably affect the average pore diameter for Si-Pu, thus not restraining the access of metal ions to the internal adsorption sites residing inside the material’s pores.

3.1.4. Scanning Electron Microscopy (SEM)

In Figure 4, we can find a micrograph of the Si-Pu material collected by SEM. This image demonstrates that the particles of the material present neither regular particle sizes nor prevalent morphology. As can be noted from this figure, the particle sizes vary from few micrometers up to tens of micrometers.

3.1.5. 29Si- and 13C-NMR Analysis

The 29Si-NMR was employed to verify the effective formation of the intermediate material Si-Cl, and the collected spectrum is shown in Figure 5.
In the 29Si-NMR spectrum of Figure 5, it is possible to observe Q4-type resonances corresponding to SiO4 species (53%), Q3-type resonances of (SiO)3SiOH groups (21%) and T3-type resonances associated to (SiO)3SiR groups [21], which may also include not-well resolved T2-type resonances of (SiO)2SiR(OH) groups [21].
Both materials Si-Cl and Si-Pu underwent a 13C-NMR analysis to verify coupling of the ligand (Purpald) onto the surface of the intermediate hybrid material (Si-Cl). The collected spectra can be found in Figure 6.
Based on the collected spectra, it was possible to confirm the formation of the material organofunctionalized with the silylant agent, since the chemical shift at 9.8 ppm is characteristic for Si-C bonds. Additionally, chemical shifts associated to Si-Cl bonds were also observed at 45.7 and 53.6 ppm.
As we analyze the spectrum of the Si-Pu, resonances compatible with N=C–S bonds are observed. Despite the decrease of the C–Cl peak intensity, it cannot be neglected, since we can find peaks in the spectral region from 44 to 50 ppm. The broadening of the peaks in the spectrum is large and can correspond to CH2 groups. The signals between 1.0 and 10 ppm may correspond to Si–C. The peaks between 20 and 30 ppm could be assigned to CH2, and those between 30 and 40 ppm, to SCH2. Furthermore, whereas N=C–S could be found around 150 ppm, N2C=C was found around 170 ppm. These peaks demonstrated a good correspondence with those reported for Purpald [22].

3.2. Adsorption Experiments

3.2.1. pH Effect

The adsorption capacity of the material Si-Pu was determined through Equation (1), where Nf is the adsorption capacity of the material in mmol g−1 for a given condition, ni is the initial quantity of metal in the solution (mmol), nf is the final quantity of metal in the solution (mmol) and m is the mass of material (g).
N f = n i n f m
The material Si-Pu was tested for the adsorption of Cu(II) and Cd(II) under different pH conditions and the results are shown in Figure 7.
The adsorption of both metal species increased as the pH varied from 2 to 6. While Cu(II) ions reached a maximum adsorption at pH 5, Cd(II) ions reached maximum adsorption at pH 3, then retaining a nearly constant adsorption capacity up to pH 6. This behavior is commonly described for the adsorption of metal ions and it is explained in terms of the protonation of the material’s surface. At low pH, H+ species compete for the adsorption sites at the surface of the material, leading to the protonation of the material’s surface groups, which attribute them positive charges. This repels metal cations in the medium, hindering their adsorption at the surface of the adsorbent. Accordingly, this effect was further corroborated by the PZC experiment, which indicated that the surface of the material is neutrally charged at pH 6.17, and positively charged at pH < 6.17. Thus, as the pH approaches the PZC condition, the surface protonation becomes less pronounced, and metal cations can adsorb more effectively to the material’s adsorption sites, as noticed by the observed increase in adsorption (Figure 7).

3.2.2. Adsorption Kinetics

The study of the adsorption kinetics allows determining the minimum dynamic contact time for the metal adsorption to reach equilibrium as well as to infer the interfacial phenomena intrinsic to different kinetic models. To investigate the material’s kinetic adsorption behavior towards the different metal ions, the metal solutions had their pH adjusted to their respective optimum conditions, as presented in Section 3.2.1.
The isotherms collected in these experiments are shown in Figure 8. They indicated a slow adsorption kinetics, reaching equilibrium at ~120 min for both metal species.
To determine the mass transfer mechanisms and the nature of the adsorption reaction, the collected data was inserted in the linearized pseudo-first- and pseudo-second-order kinetic models [23], as expressed by Equations (2) and (3):
log ( N e N f ) = log N e k 1 t 2.303
t N f =   1 k 2 N e 2 + 1 N e t
where Ne and Nf t are the concentrations of metal ions adsorbed (mmol g−1) in equilibrium and at time t (min), respectively. k1 (min−1) corresponds to the pseudo-first-order kinetic model, while k2 is the pseudo-second-order-kinetic constant (mmol g−1 min−1). t is the contact time (min).
Whereas the pseudo-first-order kinetic model implies that the rate for the occupation of the adsorption sites is proportional to the number of unoccupied sites [24], the pseudo-second-order kinetic model indicates that the surface-adsorbate interaction occurs by means of chemisorption (covalent bonds are formed) [25]. By fitting the experimental data to each model, it was possible to calculate their respective correlation coefficients, kinetic constants and adsorption capacity at equilibrium, as shown in Table 2.
According to Table 2, the pseudo-second-order kinetic model provided very high correlation coefficients towards the adsorption of Cu(II) and Cd(II) metal ions, and the calculated adsorption capacity at equilibrium for this model [Ne (cal.)] demonstrated good agreement with the experimental adsorption capacities obtained at the greatest times for both metal ions. In contrast, the pseudo-first-order kinetic model provided neither high correlation coefficients, nor good agreement between calculated and experimental data. Therefore, the pseudo-second-order kinetic model best describes the kinetic adsorption behavior of the material Si-Pu. In addition, as mentioned previously, this model indicates that the metal-surface interaction occurs by means of chemisorption [26].

3.2.3. Determination of the Maximum Adsorption Capacity

Batch experiments were performed under optimized pH and contact time conditions to determine the maximum adsorption capacity of the material Si-Pu. The results are plotted in Figure 9.
We can notice a typical adsorptive behavior for the different isotherms of Figure 9, in which the adsorption capacity increases gradually until high metal concentrations saturate the material’s surface. Similarities apart, the adsorption capacities obtained for each metal ion was quite discrepant. While the Cu(II) reached a maximum adsorption capacity of nearly 0.06 mmol g−1, that obtained for Cd(II) provided less than 0.02 mmol g−1. This observation may be explained by the greater ionic radius of Cd(II), in comparison to that of Cu(II), therefore posing a greater steric hindrance to free Cd(II) cations to adsorb once a monolayer is nearly formed.
The linearized Langmuir and Freundlich equations were evaluated to find the most suitable adsorption model to describe the adsorptive performance of the material Si-Pu towards the different analytes. Whereas the Langmuir model considers that all the adsorption sites have identical energies, and that each site may accommodate only one adsorbate, thus giving rise to a monolayer at saturation condition, the Freundlich model involves a reversible adsorption process on a heterogeneous surface, associated to a non-uniform surface energy distribution and to the formation of multilayers [27]. For the linearized Langmuir and Freundlich equations (Equations (4) and (5), respectively), Nf is the amount of metal adsorbed at equilibrium (mmol g−1); Cs is the concentration of the metal at equilibrium (mmol L−1); Ns is the maximum adsorption capacity considering the formation of a monolayer (mmol g−1); b is an adsorption constant (L mmol−1) related to the surface’s affinity for a given adsorbate (higher values imply the formation of stronger bonds); and Kf and n are Freundlich constants associated to the adsorption capacity and adsorption intensity, respectively.
C s N f = C s N s + 1 b N s  
log N f = log K f + 1 n log C s
The results from fitting the experimental data into both models are expressed in Table 3. As can be noted from this table, both models exhibited high correlation coefficients for the adsorption of Cu(II), with the Langmuir model tending to present a slightly higher value. Furthermore, as we compare the maximum adsorption capacity for the adsorption of Cu(II) calculated by this model (Ns), with its respective experimental maximum adsorption capacity [Nf (max)], we can notice that the Langmuir model led to a good prediction. In the case of the adsorption of Cd(II), the Freundlich model provided a far greater correlation coefficient than that obtained from the Langmuir model. We propose an explanation for the diverging models obtained for each metal cation based on the interactions between hard and soft acids (cations) and hard and soft bases (N- or S-based adsorption sites from the ligand molecules), as proposed by Pearson [28]. According to Pearson, soft bases (such as sulfhydryl groups) would preferentially interact with soft acids [such as Cd(II)], whereas hard bases would interact preferentially with hard acids. This concept is also applied to intermediate bases (such as N-based groups) and intermediate acids [such as Cu(II)]. Thus, while the Cu(II) cations would be preferentially adsorbed by the nitrogenated groups of the ligand (intermediate acid-base pairs), Cd(II) would be preferentially adsorbed by its sulfhydryl group (soft acid-base pairs). As indicated in Figure 2, we believe that the anchoring of the ligand molecule is more likely to have occurred through the sulfhydryl group, nonetheless, this reaction may also have partially occurred via the nitrogenated groups of the ligand molecules. Considering that the ligand molecule possesses a greater amount of nitrogenated groups than sulfhydryl groups, it is reasonable to imagine that the sulfhydryl groups from distinct immobilized ligand molecules would be located at variable steric positions, depending on which nitrogenated group the anchoring of the ligand occurred. On the other hand, for the ligands anchored through the sulfhydryl group, a much more uniform orientation of these molecules is expected, since only one anchoring position is possible. Consequently, whereas Cd(II) ions find HS– adsorption sites heterogeneously distributed in the surface of the Si-Pu material, which exhibit distinct steric hindrances from site-to-site, Cu(II) ions find a more homogeneous and equivalent distribution of N based adsorption sites. Therefore, the adsorption of Cu(II) was best described by the Langmuir model, while Cd(II) adsorption exhibited a better correlation for the Freundlich model. We further believe that the different availability of soft and intermediate adsorption sites may also partly explain the greater adsorption capacity for Cu(II) ions, in comparison to that for Cd(II), besides the aforementioned discussion on the ionic radii.
The determination of the material’s maximum adsorption capacity for the metal ions enabled the comparison of its adsorptive performance with those of other silica-based adsorbents, as summarized in Table 4. According to this table, the Si-Pu material is not among the most efficient materials of the kind for the removal of Cu(II) and Cd(II), but it presents an adsorption capacity comparable to those of other silica-based materials.

3.3. Preconcentration Experiments

3.3.1. Optimization of the Parameters of the Preconcentration System for Cu(II) and Cd(II)

The parameters that may play important roles in off-line preconcentration systems for Cu(II) and Cd(II), individually, as well as their levels and analytical responses (absorbance average (duplicate) divided by the preconcentration time) yielded the complete 24 factorial planning, therefore encompassing 16 experiments, as summarized in Table 5.
On the basis on the analytical responses, the contributions from the different variables were evaluated in terms of the Analysis of Variance (ANOVA) and the level of significance observed from the p-values. The results expressed as a Pareto chart can be found in the Supporting Information (Figures S1 and S2), and indicated that the flow rate (SF) consists of significant parameters for both analytes, with positive effects for Cu(II) (20.17) and for Cd(II) (4.73). Such a result was expected, since the preconcentration time is inversely proportional to the flow, therefore an increase in the flow rate implies in an increase of the analytical throughput. Regarding the preconcentration of Cu(II), the parameter buffer concentration (BC) demonstrated to have a negative effect (−4.92), which indicated that the analytical response tend to increase as the buffer concentration decreases to the lower concentration used in this study. Contrastingly, this parameter was not significant in the case of Cd(II). The parameter of the eluent concentration (EC) also affected both analytes. It had a negative effect towards Cu(II) ions (−4.17) and positive towards Cd(II) ions (3.02). The positive result implies that the analytical response for Cd(II) tends to be greater as more concentrated is the eluent concentration, and the negative result indicated the opposite effect for the extraction of Cu(II) ions. Whereas the pH did not significantly affect the extraction of Cu(II), this parameter had a considerable effect in the case of Cd(II) (11.13). This happened because, at a pH greater than 7.0, the ligand is found deprotonated, thus favoring the interaction between Cd(II) and the adsorption sites at the material’s surface.
The aforementioned results enabled the optimization of the conditions (summarized in Table 6) to perform the preconcetration of Cu(II) and Cd(II) using the material Si-Pu in SPE.
During the experimental planning, an individual SPE column was used for each ion. The Si-Pu column demonstrated to be highly resistant to the sequential preconcentration-elution processes, since no significant loss of the analytical response was noticed for at least 40 cycles. The possibility of reusing the adsorbent material multiple times is also an interesting aspect, since it contributes for the reduction of costs and prevents the generation of residues.

3.3.2. Effect of Potentially-Interfering Ions for the Preconcentration of Cu(II) and Cd(II)

Considering that the proposed method aims its application for different sources of water, and that distinct matrices may contain a diversity of other ions at varied concentrations, a study to evaluate the effect of potentially-interfering metal ions coexisting in the medium was carried out, and the collected data may be found in Table 7. An interference is defined as a deviation of approximately ± 10% in the analytical response, when potentially-interfering ions coexist in the same medium as the analyte ions, in comparison to the response of the sole analyte. From the collected data, it is possible to observe that all the evaluated common ions found in water/natural waters do not affect the determination of any of the studied analyte species at any tested concentration.

3.3.3. Figure of Merit for the Cu(II) and Cd(II) Preconcentration System

The analytical performance of the proposed preconcentration method was evaluated under the optimized conditions expressed in Table 6. The equations of the analytical curves (established with and without the preconcentration procedure), the preconcentration factors (PF) and the detection (DL) and quantification limits (QL) are shown in Table 8.
The preconcentration factors were calculated from the ratio between the slopes of the analytical curves with (b′) and without preconcentration (b), as shown in Equation (6) [35]. They demonstrated a remarkable enhancement in the sensitivity of the method due to the implementation of the preconcentration step for both analytes.
P F = b b
Table 9 presents the analytical performances of different SPE methods applied in the preconcentration of Cu(II) and Cd(II), as well as the variables involved in the processes. As can be seen, the PFs obtained in this study were not among the highest values found in the literature, however high PFs are very frequently associated with the processing of high sample volumes, which significantly reduce the analytical throughput. Thus, taking into account the relatively small sample volumes used in our experiments and the high analytical throughput (10 adsorption-desorption cycles/h), it was possible to obtain excellent quantification and detection limits by the proposed method.

3.3.4. Determination of Metal Ions in Real Samples

The proposed method was applied to different water samples, which included river water, tap water, mineral water and well water. The exactitude of the method was evaluated by means of the addition and recovery of the analytes from the samples, and the results can be found in Table 10. As can be noted from this table, for most of the analyzed water samples, the quantification of Cu(II) and Cd(II) yielded results in good agreement between the two methods (with and without metal addition), indicating that the proposed preconcentration method is effective for a reliable determination of Cu(II) and Cd(II) in diverse sorts of water samples.

4. Conclusions

The production of a novel mesoporous-silica-based material by means of the co-condensation technique utilizing a silylant agent and the compound Purpald as ligant was accomplished. The produced material presents interesting characteristics for its application in SPE, such as high surface area, large average pore diameter and good organofunctionalization ratio. 29Si- and 13C-NMR analyses confirmed both the silanization and the organofunctionalization of the material’s surface with Purpald. The adsorption data demonstrated good agreement with the pseudo-second-order kinetic model, thus indicating that the analyzed metal species are chemisorbed onto the material. The modified material could be successfully applied for the quantification of Cu(II) and Cd(II) from different water samples through SPE. In addition, it was verified that a diversity of water contaminants does not affect the adsorption of Cu(II) and Cd(II). The adsorbent material also presented a remarkable reutilization resistance, enduring at least 40 preconcentration cycles with no evident loss in its metal extraction capacity. Therefore, the mesoporous silica modified with Purpald can find practical applications for the determination of metal species through SPE using less-expensive techniques, such as FAAS.

Supplementary Materials

The following supporting information can be downloaded at: https://www.mdpi.com/article/10.3390/separations10020108/s1, Figure S1: Pareto chart obtained from the 24 factorial design of Cu (II) when analyzed by the ratio absorbance/time of analysis. 95% confidence level.; Figure S2: Pareto chart obtained from the 24 factorial design of Cd (II) when analyzed by the ratio absorbance/time of analysis. 95% confidence level.

Author Contributions

Conceptualization, M.H.P.W. and G.R.d.C.; methodology, M.H.P.W. and A.C.P.d.S.; validation, M.J.S. and V.d.A.P.; formal analysis, J.F.S.; investigation, M.H.P.W.; resources, G.R.d.C.; data curation, M.H.P.W.; writing—original draft preparation, A.d.O.J.; writing—review and editing, A.d.O.J.; visualization, A.d.O.J.; supervision, G.R.d.C.; project administration, M.H.P.W.; funding acquisition, G.R.d.C. All authors have read and agreed to the published version of the manuscript.

Funding

This research was funded by Fapesp, grant numbers 2018/18787-0 and 2015/04791-8, and CNPq, grant number 312361/2021-1. The APC was funded by UNESP.

Data Availability Statement

Data available on request due to restrictions, e.g., privacy or ethical. The data presented in this study are available on request from the corresponding author.

Acknowledgments

This work was supported by São Paulo Research Foundation (Fapesp) [grant number 2018/18787-0 and 2015/04791-8] and the Brazilian National Council for Scientific and Technological Development (CNPq) [grant number 312361/2021-1].

Conflicts of Interest

The authors declare no conflict of interest.

References

  1. Mitra, S.; Chakraborty, A.J.; Tareq, A.M.; Emran, T.B.; Nainu, F.; Khusro, A.; Idris, A.M.; Khandaker, M.U.; Osman, H.; Alhumaydhi, F.A.; et al. Impact of Heavy Metals on the Environment and Human Health: Novel Therapeutic Insights to Counter the Toxicity. J. King Saud Univ.-Sci. 2022, 34, 101865. [Google Scholar] [CrossRef]
  2. Bezerra, M.d.A.; Arruda, M.A.Z.; Ferreira, S.L.C. Cloud Point Extraction as a Procedure of Separation and Pre-Concentration for Metal Determination Using Spectroanalytical Techniques: A Review. Appl. Spectrosc. Rev. 2005, 40, 269–299. [Google Scholar] [CrossRef]
  3. Qasem, N.A.A.; Mohammed, R.H.; Lawal, D.U. Removal of Heavy Metal Ions from Wastewater: A Comprehensive and Critical Review. Npj Clean Water 2021, 4, 36. [Google Scholar] [CrossRef]
  4. Sodia, T.Z.; David, A.A.; Chesney, A.P.; Perri, J.N.; Gutierrez, G.E.; Nepple, C.M.; Isbell, S.M.; Cash, K.J. Nanoparticle-Based Liquid–Liquid Extraction for the Determination of Metal Ions. ACS Sens. 2021, 6, 4408–4416. [Google Scholar] [CrossRef] [PubMed]
  5. Khan, W.A.; Arain, M.B.; Soylak, M. Nanomaterials-Based Solid Phase Extraction and Solid Phase Microextraction for Heavy Metals Food Toxicity. Food Chem. Toxicol. 2020, 145, 111704. [Google Scholar] [CrossRef]
  6. Jamali, A.; Tehrani, A.A.; Shemirani, F.; Morsali, A. Lanthanide Metal–Organic Frameworks as Selective Microporous Materials for Adsorption of Heavy Metal Ions. Dalt. Trans. 2016, 45, 9193–9200. [Google Scholar] [CrossRef] [PubMed]
  7. Cheng, S.Y.; Show, P.-L.; Lau, B.F.; Chang, J.-S.; Ling, T.C. New Prospects for Modified Algae in Heavy Metal Adsorption. Trends Biotechnol. 2019, 37, 1255–1268. [Google Scholar] [CrossRef] [PubMed]
  8. Xie, Y.; Wang, J.; Wang, M.; Ge, X. Fabrication of Fibrous Amidoxime-Functionalized Mesoporous Silica Microsphere and Its Selectively Adsorption Property for Pb2+ in Aqueous Solution. J. Hazard. Mater. 2015, 297, 66–73. [Google Scholar] [CrossRef]
  9. Shao, D.; Hou, G.; Li, J.; Wen, T.; Ren, X.; Wang, X. PANI/GO as a Super Adsorbent for the Selective Adsorption of Uranium(VI). Chem. Eng. J. 2014, 255, 604–612. [Google Scholar] [CrossRef]
  10. Monier, M.; Abdel-Latif, D.A.; Abou El-Reash, Y.G. Ion-Imprinted Modified Chitosan Resin for Selective Removal of Pd(II) Ions. J. Colloid Interface Sci. 2016, 469, 344–354. [Google Scholar] [CrossRef] [PubMed]
  11. Tahmasebi, E.; Yamini, Y. Polythiophene-Coated Fe3O4 Nanoparticles as a Selective Adsorbent for Magnetic Solid-Phase Extraction of Silver(I), Gold(III), Copper(II) and Palladium(II). Microchim. Acta 2014, 181, 543–551. [Google Scholar] [CrossRef]
  12. Shaheen, H.A.; Marwani, H.M.; Soliman, E.M. Selective Solid Phase Extraction and Determination of Trace Pd(II) Using Multi-Walled Carbon Nanotubes Modified with 8-Aminoquinoline. J. Mol. Liq. 2017, 232, 139–146. [Google Scholar] [CrossRef]
  13. Lee, Y.-R.; Yu, K.; Ravi, S.; Ahn, W.-S. Selective Adsorption of Rare Earth Elements over Functionalized Cr-MIL-101. ACS Appl. Mater. Interfaces 2018, 10, 23918–23927. [Google Scholar] [CrossRef] [PubMed]
  14. Kenawy, I.M.M.; Abou El-Reash, Y.G.; Hassanien, M.M.; Alnagar, N.R.; Mortada, W.I. Use of Microwave Irradiation for Modification of Mesoporous Silica Nanoparticles by Thioglycolic Acid for Removal of Cadmium and Mercury. Microporous Mesoporous Mater. 2018, 258, 217–227. [Google Scholar] [CrossRef]
  15. Losev, V.N.; Buyko, O.V.; Trofimchuk, A.K.; Zuy, O.N. Silica Sequentially Modified with Polyhexamethylene Guanidine and Arsenazo I for Preconcentration and ICP–OES Determination of Metals in Natural Waters. Microchem. J. 2015, 123, 84–89. [Google Scholar] [CrossRef]
  16. Mendil, D.; Demirci, Z.; Uluozlu, O.D.; Tuzen, M.; Soylak, M. A New Separation and Preconcentration Method for Selenium in Some Foods Using Modified Silica Gel with 2,6-Diamino-4-Phenil-1,3,5-Triazine. Food Chem. 2017, 221, 1394–1399. [Google Scholar] [CrossRef]
  17. Mori, M.; Suzuki, T.; Sugita, T.; Nagai, D.; Hirayama, K.; Onozato, M.; Itabashi, H. Heavy Metal Adsorptivity of Calcium-Alginate-Modified Diethylenetriamine-Silica Gel and Its Application to a Flow Analytical System Using Flame Atomic Absorption Spectrometry. Anal. Chim. Acta 2014, 840, 42–48. [Google Scholar] [CrossRef]
  18. Tan, W.; Lu, S.; Liu, F.; Feng, X.; He, J.; Koopal, L.K. Determination Of The Point-of-Zero Charge of Manganese Oxides with Different Methods Including An Improved Salt Titration Method. Soil Sci. 2008, 173, 277–286. [Google Scholar] [CrossRef]
  19. Silverstein, R.M.; Webster, F.X.; Kiemle, D. Spectrometric Identification of Organic Compounds, 7th ed.; Wiley: New York, NY, USA, 2005; ISBN 9781118311653. [Google Scholar]
  20. Sing, K.S.W.; Everett, D.H.; Haul, R.A.W.; Moscou, L.; Pierotti, R.A.; Rouquerol, J.; Siemieniewska, T. Reporting Physisorption Data for Gas/Solid Systems. In Handbook of Heterogeneous Catalysis; American Cancer Society: Atlanta, GA, USA, 2008; pp. 1217–1230. ISBN 9783527610044. [Google Scholar]
  21. Sindorf, D.W.; Maciel, G.E. Cross-Polarization Magic-Angle-Spinning Silicon-29 Nuclear Magnetic Resonance Study of Silica Gel Using Trimethylsilane Bonding as a Probe of Surface Geometry and Reactivity. J. Phys. Chem. 1982, 86, 5208–5219. [Google Scholar] [CrossRef]
  22. Gökce, H.; Ceylan, S.; Öztürk, N.; Sert, Y. Tautomeric, Spectroscopic, Electronic and NLO Analyses of Purpald (4-Amino-3-Hydrazino-5-Mercapto-1,2,4-Triazole). Mater. Today Commun. 2022, 32, 103862. [Google Scholar] [CrossRef]
  23. Revellame, E.D.; Fortela, D.L.; Sharp, W.; Hernandez, R.; Zappi, M.E. Adsorption Kinetic Modeling Using Pseudo-First Order and Pseudo-Second Order Rate Laws: A Review. Clean. Eng. Technol. 2020, 1, 100032. [Google Scholar] [CrossRef]
  24. Saeed, A.; Akhter, M.; Iqbal, M. Removal and Recovery of Heavy Metals from Aqueous Solution Using Papaya Wood as a New Biosorbent. Sep. Purif. Technol. 2005, 45, 25–31. [Google Scholar] [CrossRef]
  25. Ho, Y. Review of Second-Order Models for Adsorption Systems. J. Hazard. Mater. 2006, 136, 681–689. [Google Scholar] [CrossRef] [PubMed]
  26. Feng, N.; Guo, X.; Liang, S. Adsorption Study of Copper (II) by Chemically Modified Orange Peel. J. Hazard. Mater. 2009, 164, 1286–1292. [Google Scholar] [CrossRef] [PubMed]
  27. Spinelli, V.A.; Laranjeira, M.C.M.; Fávere, V.T.; Kimura, I.Y. Cinética e Equilíbrio de Adsorção Dos Oxiânions Cr (VI), Mo (VI) e Se (VI) Pelo Sal de Amônio Quaternário de Quitosana. Polímeros 2005, 15, 218–223. [Google Scholar] [CrossRef]
  28. Pearson, R.G. Hard and Soft Acids and Bases. J. Am. Chem. Soc. 1963, 85, 3533–3539. [Google Scholar] [CrossRef]
  29. De Oliveira Jorgetto, A.; Pereira, S.P.; Da Silva, R.I.V.; Saeki, M.J.; Martines, M.A.U.; De Albuquerque Pedrosa, V.; De Castro, G.R. Application of Mesoporous SBA-15 Silica Functionalized with 4-Amino-2-Mercaptopyrimidine for the Adsorption of Cu(II), Zn(II), Cd(II), Ni(II), and Pb(II) from Water. Acta Chim. Slov. 2015, 62, 111–121. [Google Scholar] [CrossRef]
  30. Memon, F.N.; Ayyilidiz, H.F.; Kara, H.; Memon, S.; Kenar, A.; Leghari, M.K.; Topkafa, M.; Sherazi, S.T.H.; Memon, N.A.; Durmaz, F.; et al. Application of Central Composite Design for the Optimization of On-Line Solid Phase Extraction of Cu2+ by Calix[4]Arene Bonded Silica Resin. Chemom. Intell. Lab. Syst. 2015, 146, 158–168. [Google Scholar] [CrossRef]
  31. Li, M.; Li, M.; Feng, C.; Zeng, Q. Preparation and Characterization of Multi-Carboxyl-Functionalized Silica Gel for Removal of Cu (II), Cd (II), Ni (II) and Zn (II) from Aqueous Solution. Appl. Surf. Sci. 2014, 314, 1063–1069. [Google Scholar] [CrossRef]
  32. Yang, W.; Ding, P.; Zhou, L.; Yu, J.; Chen, X.; Jiao, F. Preparation of Diamine Modified Mesoporous Silica on Multi-Walled Carbon Nanotubes for the Adsorption of Heavy Metals in Aqueous Solution. Appl. Surf. Sci. 2013, 282, 38–45. [Google Scholar] [CrossRef]
  33. El-Toni, A.M.; Habila, M.A.; Ibrahim, M.A.; Labis, J.P.; ALOthman, Z.A. Simple and Facile Synthesis of Amino Functionalized Hollow Core–Mesoporous Shell Silica Spheres Using Anionic Surfactant for Pb(II), Cd(II), and Zn(II) Adsorption and Recovery. Chem. Eng. J. 2014, 251, 441–451. [Google Scholar] [CrossRef]
  34. Lim, C.W.; Song, K.; Kim, S.H. Synthesis of PPy/Silica Nanocomposites with Cratered Surfaces and Their Application in Heavy Metal Extraction. J. Ind. Eng. Chem. 2012, 18, 24–28. [Google Scholar] [CrossRef]
  35. Tarley, C.R.T.; Corazza, M.Z.; de Oliveira, F.M.; Somera, B.F.; Nascentes, C.C.; Segatelli, M.G. On-Line Micro-Solid Phase Preconcentration of Cd2+ Coupled to TS-FF-AAS Using a Novel Ion-Selective Bifunctional Hybrid Imprinted Adsorbent. Microchem. J. 2017, 131, 57–69. [Google Scholar] [CrossRef]
  36. Samadi, A.; Amjadi, M. Magnetic Fe3O4@C Nanoparticles Modified with 1-(2-Thiazolylazo)-2-Naphthol as a Novel Solid-Phase Extraction Sorbent for Preconcentration of Copper (II). Microchim. Acta 2015, 182, 257–264. [Google Scholar] [CrossRef]
  37. Durduran, E.; Altundag, H.; Imamoglu, M.; Yıldız, S.Z.; Tuzen, M. Simultaneous ICP-OES Determination of Trace Metals in Water and Food Samples after Their Preconcentration on Silica Gel Functionalized with N-(2-Aminoethyl)-2,3-Dihydroxybenzaldimine. J. Ind. Eng. Chem. 2015, 27, 245–250. [Google Scholar] [CrossRef]
  38. Baytak, S.; Kasumov, V.T. Preconcentration and Determination of Copper(II) by Novel Solid-Phase Extraction and High-Resolution Continuum Source Flame Atomic Absorption Spectrometry. Anal. Lett. 2017, 50, 105–116. [Google Scholar] [CrossRef]
  39. Pourreza, N.; Rastegarzadeh, S.; Larki, A. Simultaneous Preconcentration of Cd(II), Cu(II) and Pb(II) on Nano-TiO2 Modified with 2-Mercaptobenzothiazole Prior to Flame Atomic Absorption Spectrometric Determination. J. Ind. Eng. Chem. 2014, 20, 2680–2686. [Google Scholar] [CrossRef]
  40. Soylak, M.; Erbas, Z. Vortex-Assisted Magnetic Solid Phase Extraction of Cd(II), Cu(II) and Pb(II) on the Nitroso–R Salt Impregnated Magnetic Ambersorb 563 for Their Separation, Preconcentration and Determination by FAAS. Int. J. Environ. Anal. Chem. 2018, 98, 799–810. [Google Scholar] [CrossRef]
  41. Pourjavid, M.R.; Arabieh, M.; Yousefi, S.R.; Akbari Sehat, A. Interference Free and Fast Determination of Manganese(II), Iron(III) and Copper(II) Ions in Different Real Samples by Flame Atomic Absorption Spectroscopy after Column Graphene Oxide-Based Solid Phase Extraction. Microchem. J. 2016, 129, 259–267. [Google Scholar] [CrossRef]
  42. Ozdes, D.; Duran, C. Preparation of Melon Peel Biochar/CoFe2O4 as a New Adsorbent for the Separation and Preconcentration of Cu(II), Cd(II), and Pb(II) Ions by Solid-Phase Extraction in Water and Vegetable Samples. Environ. Monit. Assess. 2021, 193, 642. [Google Scholar] [CrossRef]
  43. Rezvani, S.A.; Soleymanpour, A. Application of L-Cystine Modified Zeolite for Preconcentration and Determination of Ultra-Trace Levels of Cadmium by Flame Atomic Absorption Spectrometry. J. Chromatogr. A 2016, 1436, 34–41. [Google Scholar] [CrossRef] [PubMed]
  44. Mirabi, A.; Dalirandeh, Z.; Rad, A.S. Preparation of Modified Magnetic Nanoparticles as a Sorbent for the Preconcentration and Determination of Cadmium Ions in Food and Environmental Water Samples Prior to Flame Atomic Absorption Spectrometry. J. Magn. Magn. Mater. 2015, 381, 138–144. [Google Scholar] [CrossRef]
  45. Özkalkan, H.; Saygili Canlidinç, R. Investigation of the Conditions for Preconcentration of Cadmium Ions by Solid Phase Extraction Method Using Modified Juglans Regia L. Shells. J. AOAC Int. 2021, 104, 1246–1254. [Google Scholar] [CrossRef] [PubMed]
Figure 1. Co-condensation reaction between TEOS and CPTS to produce the material Si-Cl.
Separations 10 00108 g001
Figure 2. Modification reaction of the Si-Cl material in the presence of the ligand molecule (Purpald) to obtain the material Si-Pu.
Separations 10 00108 g002
Figure 3. Infrared spectra of the non-modified silica, the material Si-Cl, the ligand (Purpald) and the functionalized material (Si-Pu).
Separations 10 00108 g003
Figure 4. SEM image of the material Si-Pu.
Separations 10 00108 g004
Figure 5. 29Si-NMR spectrum of the modified material Si-Cl.
Separations 10 00108 g005
Figure 6. 13C-NMR spectra of the materials Si-Cl and Si-Pu.
Separations 10 00108 g006
Figure 7. Effect of pH on the adsorption of Cu(II) and Cd(II). Mass of adsorbent = 20.0 mg; solution volume = 1.80 mL.
Separations 10 00108 g007
Figure 8. Adsorption isotherms for Cu(II) (a) and Cd(II) (b). Mass of adsorbent = 20.0 mg; solution volume = 1.80 mL.
Separations 10 00108 g008
Figure 9. Isotherms for the adsorption of Cu(II) and Cd(II) in function of the metal concentration.
Separations 10 00108 g009
Table 1. Results of the nitrogen adsorption for the organofunctionalized material before and after calcination.
Samplea SBET (m2 g−1)b DBJH (nm)c V (cm3 g−1)
Si-Pucalcined489.24 ± 1.127.10.89
Si-Pu369.84 ± 1.157.10.85
a SBET = Specific surface area as calculated by the BET method; b DBJH = Average pore size diameter as calculated by the BJH method; c V = Average pore volume.
Table 2. Parameters for the pseudo-first- and pseudo-second-order kinetic models and their respective correlation coefficients for each metal ion. The experimental adsorption capacity of Si-Pu for the greatest contact time is also found for comparison.
MetalNf (exp) (mmol g−1)Pseudo-First-OrderPseudo-Second-Order
k1 (min −1)Ne (cal.) (mmol g−1)R2k2 (mmol g−1 min−1)Ne (cal.) (mmol g−1)R2
Cu(II)0.032−2.6 × 10−40.03040.70810.10.03260.999
Cd(II)0.0031−1.3 × 10−50.0290.51960.50.003050.992
Table 3. Parameters and correlation coefficients for Langmuir and Freundlich models. The obtained experimental maximum adsorption capacities for each metal can also be found for comparison.
MetalNf (max) (exp.) (mmol g−1)LangmuirFreundlich
Ns (mmol g−1)b
(L mmol−1)
R2Kf (mg g−1)1/nR2
Cu(II)0.0570.0643.3340.9930.3820.5490.946
Cd(II)0.0180.02245.700.6010.0390.8250.985
Table 4. Adsorption capacity of silica-based adsorbents for the extraction of Cu(II) and Cd(II).
AdsorbentMaximum Adsorption Capacity
(mmol g−1)
Reference
Cu(II)Cd(II)
Silica modified with 4-amino-2-mercaptopyrimidine0.01230.0006[29]
Silica modified with calix[4]arene0.026--------[30]
Silica gel modified with diethylenetriamine and calcium alginate0.123--------[17]
Multi-carboxyl-functionalized silica gel0.7400.369[31]
Diamine modified mesoporous silica on multi-walled carbon nanotubes1.047--------[32]
Silica modified with polyhexamethylene guanidine and Arsenazo I0.06--------[15]
Amino-functionalized hollow core–mesoporous shell silica spheres--------1.69[33]
Silica-polypyrrole nanocomposite0.020.01[34]
Mesoporous silica modified with Purpald0.0570.018This work
Table 5. Levels of variables for the 24 factorial planning, matrix and the results of the planning towards the determination of Cu(II) and Cd(II) through the preconcentration system.
VariableAbbreviationCu(II)Cd(II)
Low (−)High (+)Low (−)High (+)
pHpH4.08.05.18.0
Buffer concentration (mol L−1)BC0.010.10.010.1
Eluent concentration (mol L−1)EC0.52.00.52.0
Sample flow (mL min−1)SF2.05.02.05.0
Abs./Time
ExperimentpHBCECSFCu(II)Cd(II)
010.010.002096/0.002632
02+0.00970.0056/0.004224
03+0.00890.002088/0.003248
04++0.00870.003128/0.003144
05+0.00910.003232/0.003024
06++0.00940.005264/0.0056
07++0.00830.003824/0.004856
08+++0.00880.004488/0.004848
09+0.01990.00712/0.00594
10++0.02310.0168/0.01526
11++0.01890.00642/0.00938
12+++0.01770.01904/0.1486
13++0.01690.0053/0.0057
14+++0.02020.01586/0.01604
15+++0.01420.01152/0.01318
16++++0.0150.01574/0.01384
Table 6. Optimized conditions for the preconcentration of Cu(II) and Cd(II) using Si-Pu in SPE.
ParameterMagnitude of the Parameter
Cu(II)Cd(II)
Sample volume (mL)2525
Adsorbent mass (mg)50100
Sample flow (mL min−1)5.05.0
Eluent typeHCl + thioureaHNO3
Eluent concentration (mol L−1)0.5 HCl + 0.2 thiourea2.0
Buffer concentration (mol L−1)0.010.01
pH8.08.0
Table 7. Influence of coexisting ions in the preconcentration of Cu(II) and Cd(II).
AnalyteInterfering IonRecovery (%) for Distinct Analyte:Interfering Ion Ratios
1:51:101:251:501:1001:5001:10001:1500
Cu(II)Na+------------------------------------------100.5-------
K+-----------------------------------102.4--------------
Ca2+------------------------------------------105.5-------
Mg2+-----------------------------------98.0--------------
Fe3+-------101.7-------92.3----------------------------
Ba2+-----------------------------------96.1--------------
SO42−------------------------------------------99.4-------
H2PO4-----------------------------------100.4--------------
Cl-------------------------------------------------100.5
Cd(II)Na+104.1101.5------------------------------------------
K+-----------------------------------101.8--------------
Ca2+109.8-------------------------------------------------
Mg2+--------------94.0-----------------------------------
Fe3+103.697.6------------------------------------------
Ba2+--------------102.9-----------------------------------
SO42−----------------------------94.5---------------------
H2PO4--------------102.0-----------------------------------
Table 8. Analytical performance of the proposed preconcentration method.
AnalyteCurve without Preconcentration + (Correlation Coefficient)Curve with Preconcentration + (Correlation Coefficient)PFDL
(µg L−1)
QL
(µg L−1)
Cu(II)Abs = 0.150 × [Cu2+] + 0.0033 (R2 = 0.999)Abs = 2.722 × [Cu2+] + 0.0157 (R2 = 0.999)18.11.454.8
Cd(II)Abs = 0.335 × [Cd2+] + 0.0031 (R2 = 0.999)Abs = 5.268 × [Cd2+] + 0.0032 (R2 = 0.999)15.80.381.27
Table 9. Major analytical features of distinct SPE methods for the determination of Cu(II) and Cd(II).
MaterialIonDL
(µg L−1)
PFSample Volume (mL)Reference
Fe3O4@C nanoparticles modified with 1-(2-thiazolylazo)-2-naphtolCu(II)1.550100[36]
Silica gel funcionalized with N-(2-aminoethyl)-2,3-dihydroxybenzaldimine0.098100500[37]
Amberlite XAD-4 modified with N-para-anisidine-3,5-di-tert-butylsalicylaldimine0.5612550[38]
Nano-TiO2 modified with 2-mercaptobenzothiazole0.1583.3250[39]
Nitroso-R salt impregnated magnetic Ambersorb 5635.81530[40]
Modified graphene0.062801400[41]
Mesoporous silica organofunctionalized with Purpald1.4518.125This work
Melon peel biochar modified with CoFe2O4Cd(II)1.8250250[42]
Nitroso-R salt impregnated magnetic Ambersorb 5631.41530[40]
zeolite modified with l-cysteine0.04400800[43]
Magnetic nanoparticles modified with surfactant3.71100100[44]
Juglans regia L. shells modified with hydrazine hydrate0.1830150[45]
Ion-imprinted nanoparticles0.31410[35]
Mesoporous silica organofunctionalized with Purpald0.3815.825This work
Table 10. Determination of Cu(II) and Cd(II) in water samples, with and without the addition of a standard metal solution.
SampleIonAddedFound *Recovery (%)
River water 1Cu(II)0.019.79 ± 3.03----------
50.067.86 ± 1.6297.3
Cd(II)0.05.42 ± 0.69----------
1016.05 ± 0.91104.1
River water 2Cu(II)0.069.76 ± 1.77----------
50.0115.70 ± 1.9496.6
Cd(II)0.00.64 ± 0.21----------
1011.24 ± 0.63105.6
Tap waterCu(II)0.0<LD----------
100.0105.37 ± 2.13105.4
Cd(II)0.01.91 ± 0.22----------
1012.29 ± 0.57103.2
Mineral waterCu(II)0.0<LD----------
100.0105.83 ± 3.71105.8
Cd(II)0.00.55 ± 0.22----------
1011.29 ± 0.61103.2
Underground waterCd(II)0.03.18 ± 1.58----------
1013.24 ± 2.27100.5
* Results expressed as the average value ± standard deviation, as calculated from a triplicate of measurements.
Disclaimer/Publisher’s Note: The statements, opinions and data contained in all publications are solely those of the individual author(s) and contributor(s) and not of MDPI and/or the editor(s). MDPI and/or the editor(s) disclaim responsibility for any injury to people or property resulting from any ideas, methods, instructions or products referred to in the content.

