Article

Evaluation of CO2 Adsorption Parameters in Fluidised Zeolite 13X Beds Using Non-Linear Multivariate Optimisation

1
Department of Computer Engineering, Modelling, Electronics and System Engineering (DIMES), University of Calabria (UNICAL), Via P. Bucci, Cubo 42C, Rende (CS), 87036 Cosenza, Italy
2
Institute of Membrane Technology–National Council of Research (ITM-CNR), Via P. Bucci, Cubo 17C, Rende (CS), 87036 Cosenza, Italy
*
Author to whom correspondence should be addressed.
Separations 2023, 10(11), 558; https://doi.org/10.3390/separations10110558
Submission received: 18 September 2023 / Revised: 27 October 2023 / Accepted: 30 October 2023 / Published: 3 November 2023
(This article belongs to the Special Issue Advances in CO2 Adsorptive Separation for CO2 Capture)

Abstract

:
This work is part of a research project aimed at studying potential sorbents for CO2 capture. The main parameters characterising the adsorption process of zeolite 13X were derived with the aim of overcoming the limits of experimental analysis and thus predicting the performances of the materials of interest. In particular, the main parameters that control the adsorption process of CO2 in zeolite 13X were evaluated through parametric optimisation. This systematic procedure allows for the prediction of the performances of the materials at different operating conditions, identifying the most suitable ones for the case under consideration. Another important application lies in the possibility of a preliminary study of a potential process scale-up for future industrial use. The captured carbon dioxide can be stored or used as a reagent in the production of products with higher economic values, such as methanol, DME and others.

1. Introduction

Rising global temperatures, melting ice and increasing health problems are just some of the problems due to environmental pollution. This phenomenon is so important that it has also involved politics, which, through international agreements and memoranda of understanding, is providing for the identification of development strategies towards new sustainable sources. As a result of this, the so-called circular processes are developing, i.e., processes that take into account the entire life cycle whilst minimising the environmental impact. The production of eco-sustainable energy therefore requires the improvement of performance and reductions in the impacts on the environment and climate of the processes used. Precisely, in this regard, the main issues on which we are focusing are the processes of carbon dioxide capture and the production of hydrogen from sustainable sources. Currently, for the capture of carbon dioxide generated from primary fossil fuels (coal, natural gas or oil), biomass or fuel mixtures, there are three different technologies.
Pre-combustion capture consists of removing the carbon contained in the fossil fuel before it is sent to the energy production cycle. It is necessary to convert the primary fuel into a mixture called “syngas”. This can be achieved through coal or biomass gasification processes or through steam reforming processes for natural gas.
Post-combustion capture involves the removal of carbon dioxide directly from the flue gas stream of fossil fuel combustion.
Oxy-combustion capture takes place in the presence of oxygen and not air, which contains a high amount of nitrogen, to obtain a carbon dioxide-concentrated flue gas stream, thus simplifying separation. The oxygen used as an oxidant can be supplied as a gaseous stream or in the form of metal oxide, but all of this requires a preliminary process of separating the oxygen from the upstream air.
What the three processes have in common are the separation steps, which can be performed with physical or chemical systems (solvents, membranes, adsorbents or cryogenic separation). The choice of capture technology depends on the specific operating conditions. Currently, the post-combustion strategy is preferred in most cases, as this configuration does not require any modifications to the existing plant. From this point of view, the main techniques used today are the following:
  • Absorption processes;
  • Micro-algal ciofixation processes (photosynthetic fixation);
  • Membrane processes [1,2,3];
  • Cryogenic processes;
  • Adsorption processes [4,5,6,7].
Thus, the separated carbon dioxide can then be stored in underground deposits, which may consist of particularly porous and perimetrically impermeable layers, saturated with a solution called “brine” and thus made capable of adsorbing and retaining carbon dioxide.
It could also be used as a reagent in processes leading to syngas formation, such as the dry reforming of methane, or in processes for the production of products such as methanol or dimethyl-ether.
Absorption and adsorption processes are divided into chemical and physical processes.
In chemical absorption processes, carbon dioxide is absorbed into a liquid solvent with the formation of a chemical bond. As the process progresses, the solvent tends to enrich itself with carbon dioxide, so a regeneration process is necessary. The typical solvents used are amines.
The main physical solvents that can be used for this process are the following:
  • Cold methanol (Rectisol process);
  • Polyethylene glycol diethylene ether (Selexol process);
  • Propylene carbonate (Fluor process).
Selexol is preferable where the capture of deep sour gas (i.e., CO2 and H2S) is not required, whilst the Fluor process is mainly applicable for carbon dioxide separation where small amounts of H2S are present [8].
On the other hand, carbon dioxide adsorption on physical absorbents is based on selective intermolecular forces between gas molecules and the surfaces of a solid or liquid absorbent. During the physical adsorption process, the exhaust gas stream passes through an adsorption chamber, where the selective separation of carbon dioxide takes place [9]. Molecular sieves differentiate gas molecules according to their diameter and the relative sizes of the pore channels.
The degree of selectivity of carbon dioxide for adsorption depends on the temperature, partial pressure, surface forces and size of adsorbing pores [10,11,12].
In physical adsorption, no new bond is formed between the sorbate and sorbent; therefore, much less energy is required for carbon dioxide regeneration [13,14,15].
The most used methods for the regeneration of adsorbent materials are the following:
  • Pressure swing: The pressure of the adsorption chamber is lowered to very low values.
  • Temperature swing: The temperature is increased.
  • Electrical swing: The electric current that runs through the adsorbent bed is changed.
The most important limitation of adsorption processes is related to the low capacity and limited selectivity for carbon dioxide.
Zeolites are naturally occurring alumino-silicates with a three-dimensional framework structure bearing AlO4 and SiO4 tetrahedrals. These are linked to each other by sharing all of the oxygen to form interconnected cages and channels where exchangeable cations are present, which counterbalance the negative charge on the zeolite surface generated from isomorph substitution. Thus, the presence of cations leads to strong electrostatic interactions of the zeolites with CO2. In particular, in zeolite 13X, this effect is due to the presence of Na+ cations [16,17,18,19].
Zeolites are important materials for carbon dioxide capture processes. Their structure allows for a good amount of carbon dioxide to be stored or reused. They are widely used as they have highly variable physico-chemical properties, including good thermal stability and ion exchange capacity.
Experimental and computational studies of carbon dioxide removal from flue gas using naturally occurring zeolites and other synthetic zeolites like 5A and 13X indicate that synthetic zeolites are most promising adsorbents for carbon dioxide capture from flue gas mixture [20].
Currently, many researchers are experimenting with chemical modifications of the surface of the molecular sieve to eliminate some limitations of molecular sieves. In particular, amino or siliceous groups are added to facilitate carbon dioxide adsorption.
The objective is now to evaluate the adsorption parameters by developing a mathematical model, consisting of different equations and allowing for the prediction of the ability of materials to adsorb carbon dioxide. Defining n as the number of species considered, the following equations describe the system:
  • n gas phase mass balances;
  • n mass balances in the adsorbed phase;
  • 1 energy balance related to intra-system exchange;
  • 1 energy balance related to external exchange;
  • 1 momentum balance;
  • n equilibrium relations.
The model was developed considering a fixed bed made up of zeolite 13X with the same voidage degree as the fluidised bed, and the equations were derived based on the assumptions reported in Table 1 [21].
In the first part of the study, the model was developed (see the Appendix A) and validated, whereas in the second part, a parametric optimisation was performed to estimate the parameters of interest. The obtained differential equations need boundary conditions to saturate the degrees of freedom that are obtained from the presence of the derived operator.

2. Materials and Methods

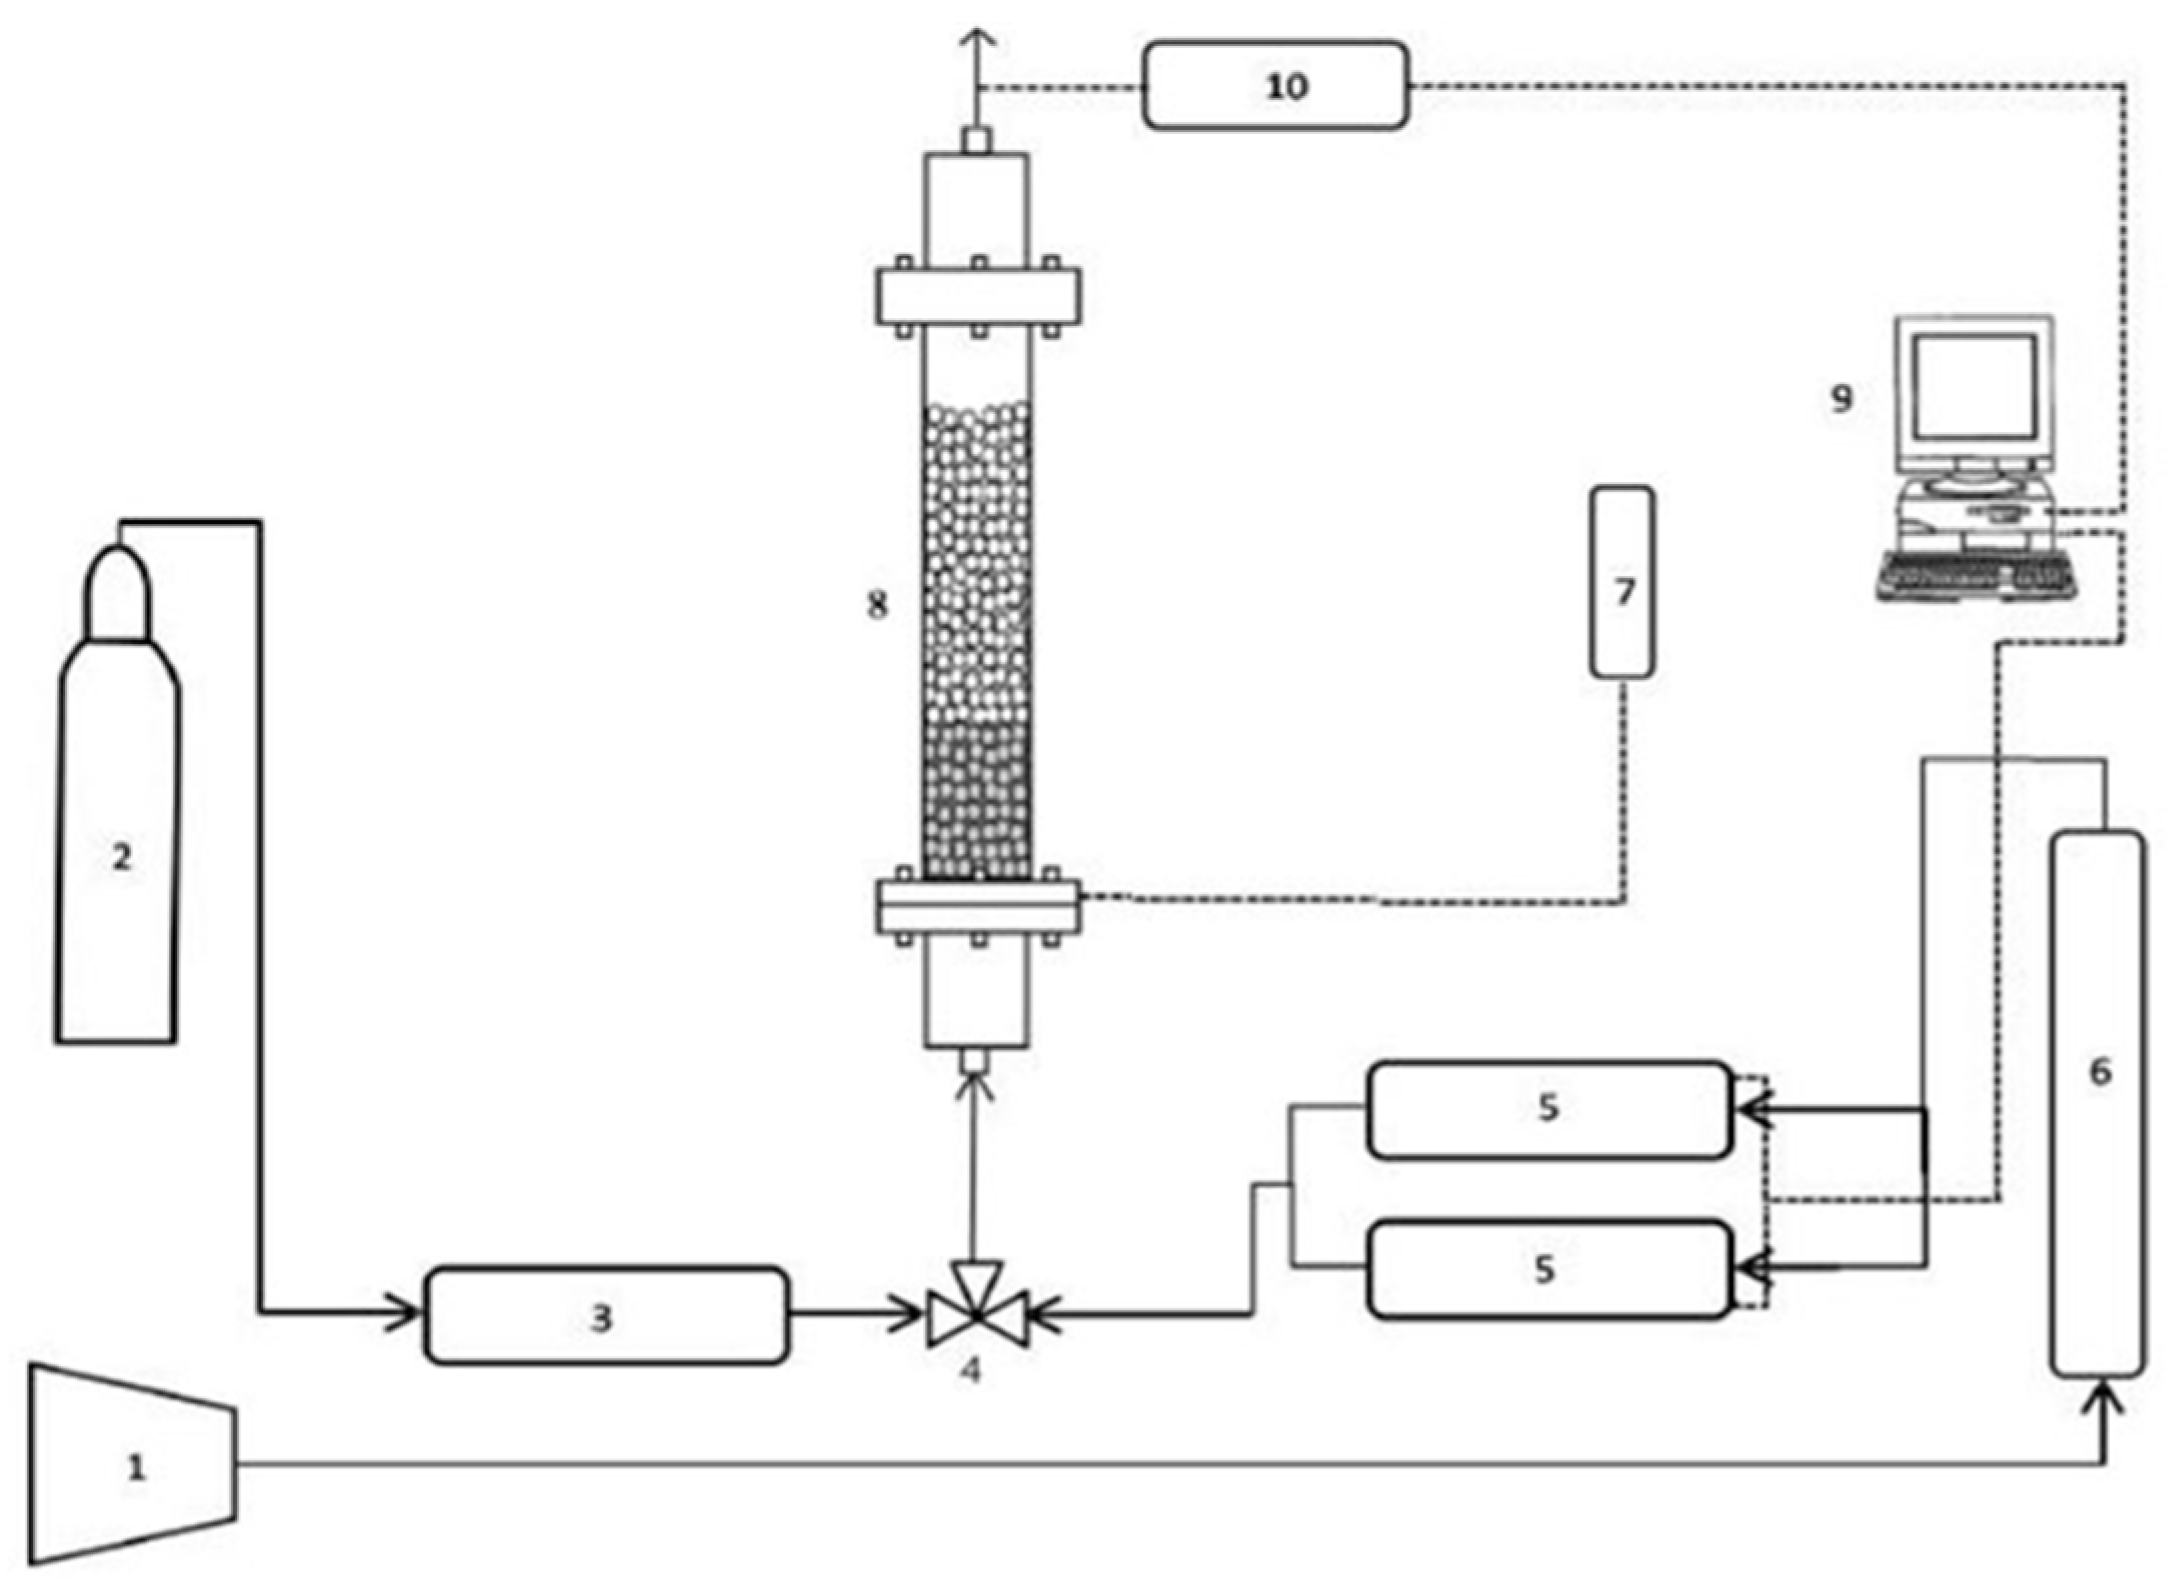
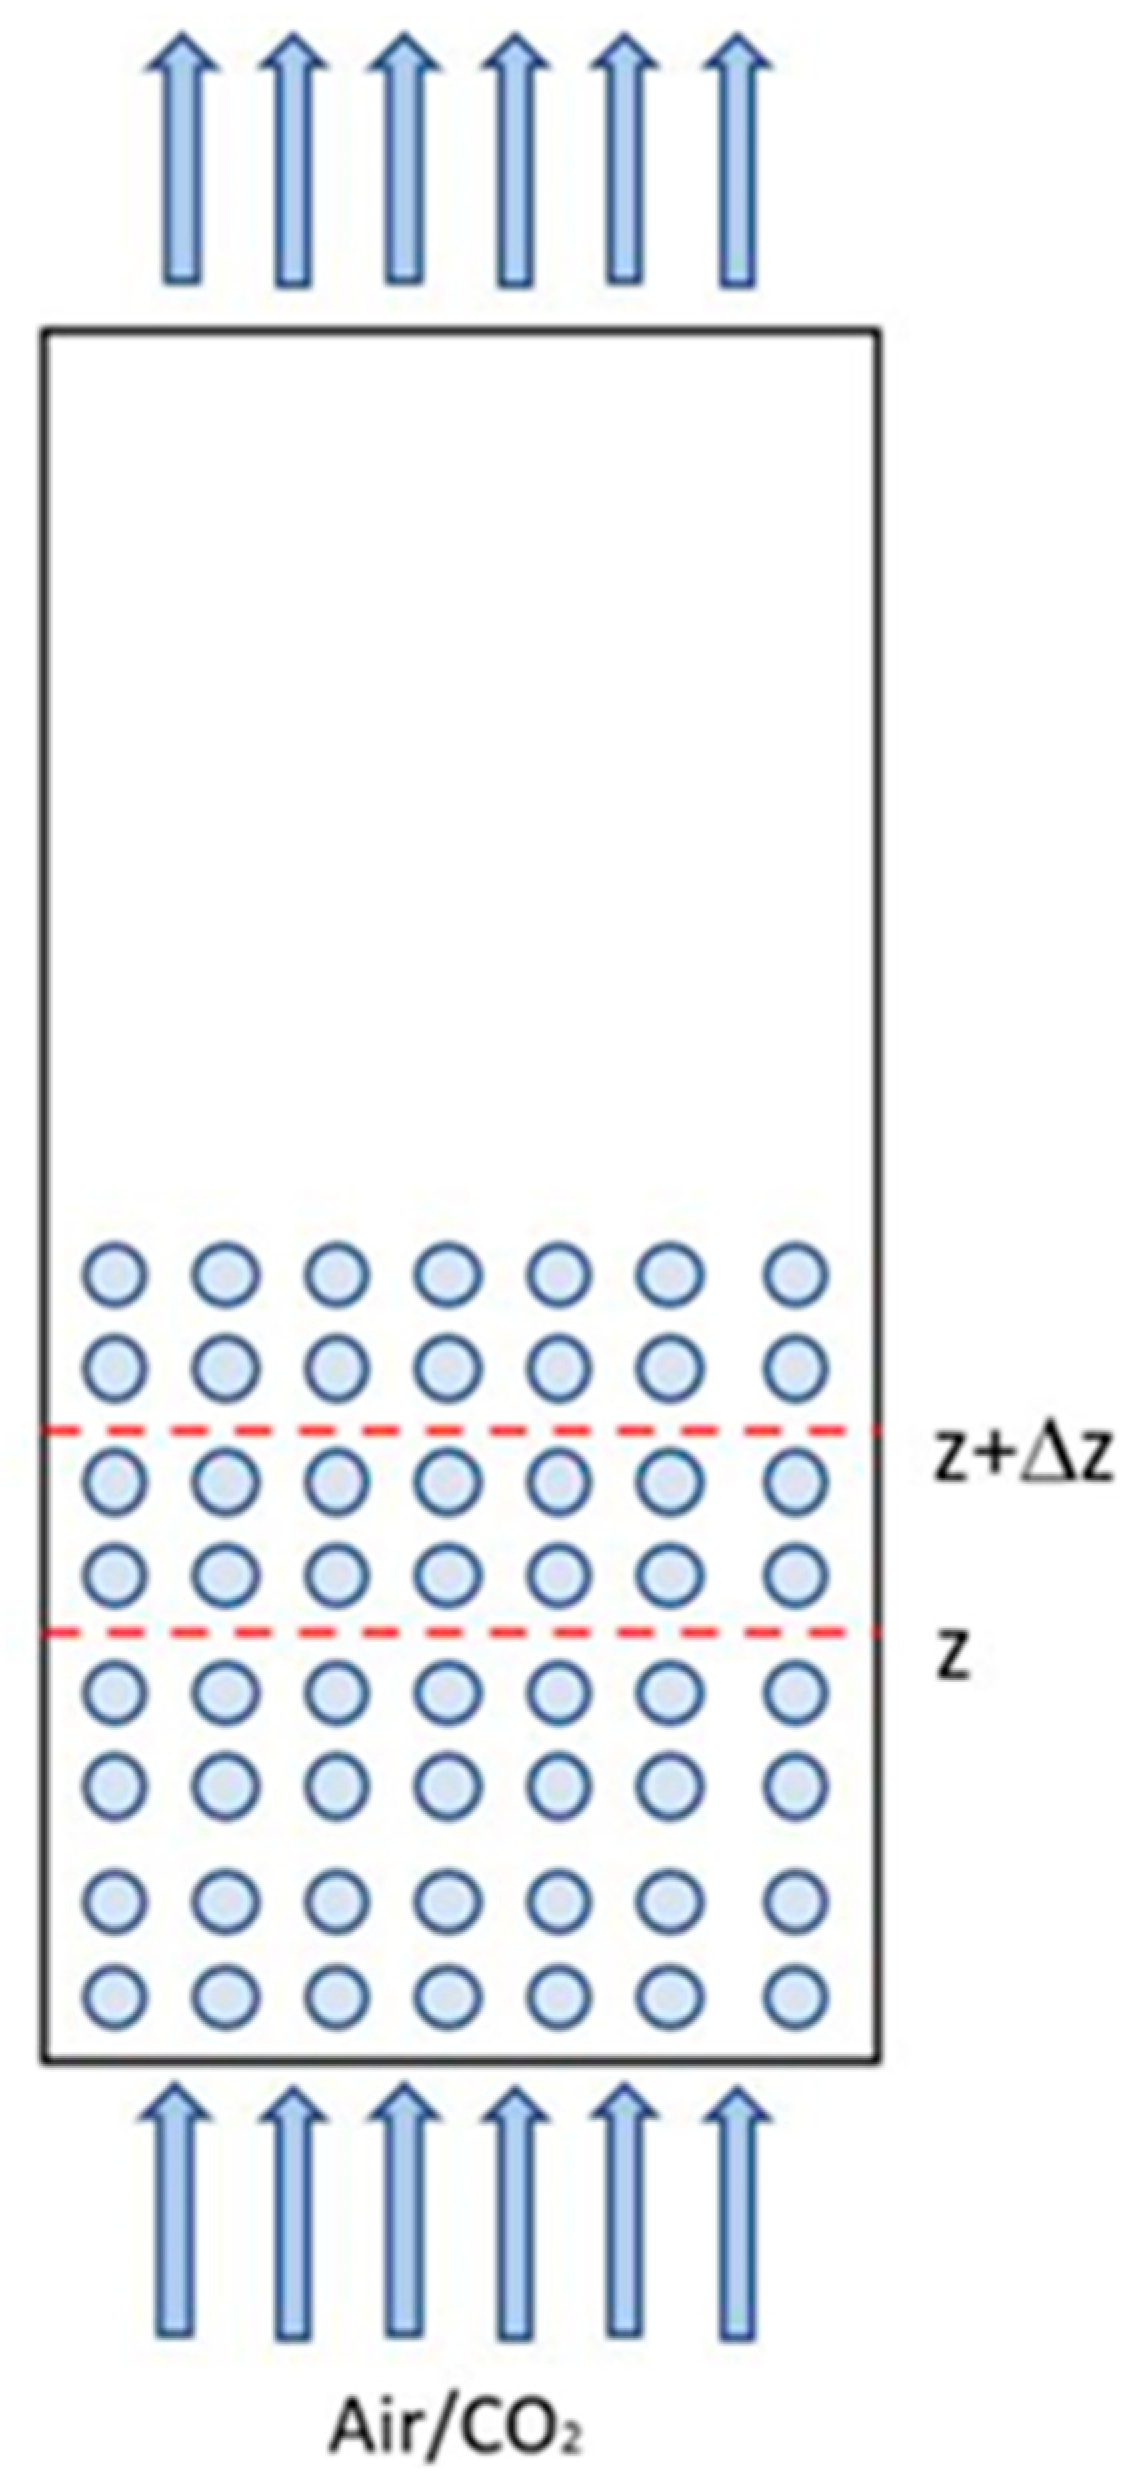
The equipment used to carry out the experimental test (Figure 1) is briefly described in this section. In particular, a fluidised bed column made of plexiglass is used to conduct the CO2 adsorption tests. The operating superficial velocity is set to 0.139 m s−1, which is 20% higher than the minimum fluidisation velocity. A corresponding bed voidage degree of 0.4 is obtained.
For the adsorbent material, the zeolite 13X-APG MOLSIV provided by UOP LLC (Des Plaines, Illinois, USA) is analysed with the MALVERN MASTERSIZER 2000 laser diffractometer in order to determine the particle size distribution of the solid (Figure 2).
The measurement is carried out by analysing the angular variation of the intensity of the scattered light when a laser beam passes through the sample of scattered particles. The data are received by a series of receptor sensors and then processed to obtain the following:
  • Particle size distribution;
  • Sauter diameter;
  • Volume diameter.
A plexiglass column with an inner diameter (ID) of 4.94 cm and a height (H) of 73.3 cm is used for the experimental carbon dioxide capture tests. Both ends are equipped with a flange as follows:
  • The upper one has the function of conveying the gas coming out of the bed to the composition analyser.
  • The lower one is connected to the distribution chamber through a porous septum that has the task of evenly distributing the gas entering the bed. Glass marbles with a diameter of 11 mm and a density of 2.48 g/cm3 are used to pack the columns.
The detection of the composition of the current output from the column is carried out using a Madur GA-21 Plus analyser, which transmits the O2 concentration data to the appropriate software installed on the computer. The minimum time interval between two consecutive measurements is two seconds. From the obtained oxygen concentration values, the concentration of carbon dioxide is traced by means of the following relationship (Equation (1)):
x C O 2 = 1 x O 2 0.2095
A specific probe is used to measure the CO2 composition as it can be easily put in the proximity of the end of the fluidised bed, allowing for a real-time measurement. It is undeniable that the indirect evaluation of CO2 via O2 detection slightly increases the experimental error, which we believe is minimised due to the fact that our measurement is carried out very close to the end of the bed, avoiding a further error owing to the diffusion effect.
The main elements composing the analyses are the following (Table 2):
  • Gas sampling probe: This allows samples of gas to be examined. It consists of a handle and a tube, inside of which there is a thermocouple.
  • Gas pump: It is located inside the analyser and has the function of sucking the sample.
  • Gas chamber: Located inside it are electrochemical cells. The cells measure the oxygen content and send an electrical signal directly proportional to the volumetric concentration of the species.
The MADCOM 2.9 software allows one to store the measured data in worksheets. The material used to capture the carbon dioxide must be regenerated through a temperature increase to promote desorption. This operation takes place inside an ISCO stove. The experimental tests are conducted in a laboratory-scale plant, as schematised in Figure 1.
First, the solid is loaded into the column; then, the composition of the incoming current is measured, and finally, by means of a system of manual valves, the gaseous mixture is passed through the bed.
The software returns the trend of the oxygen composition of the current, leaving the column as a function of time, from which the breakthrough curve is easily calculated.

3. Results and Discussion

Through the non-linear regression of the model breakthrough curve of the carbon dioxide on its experimental breakthrough curve, the adsorption parameters of the other species are also estimated.
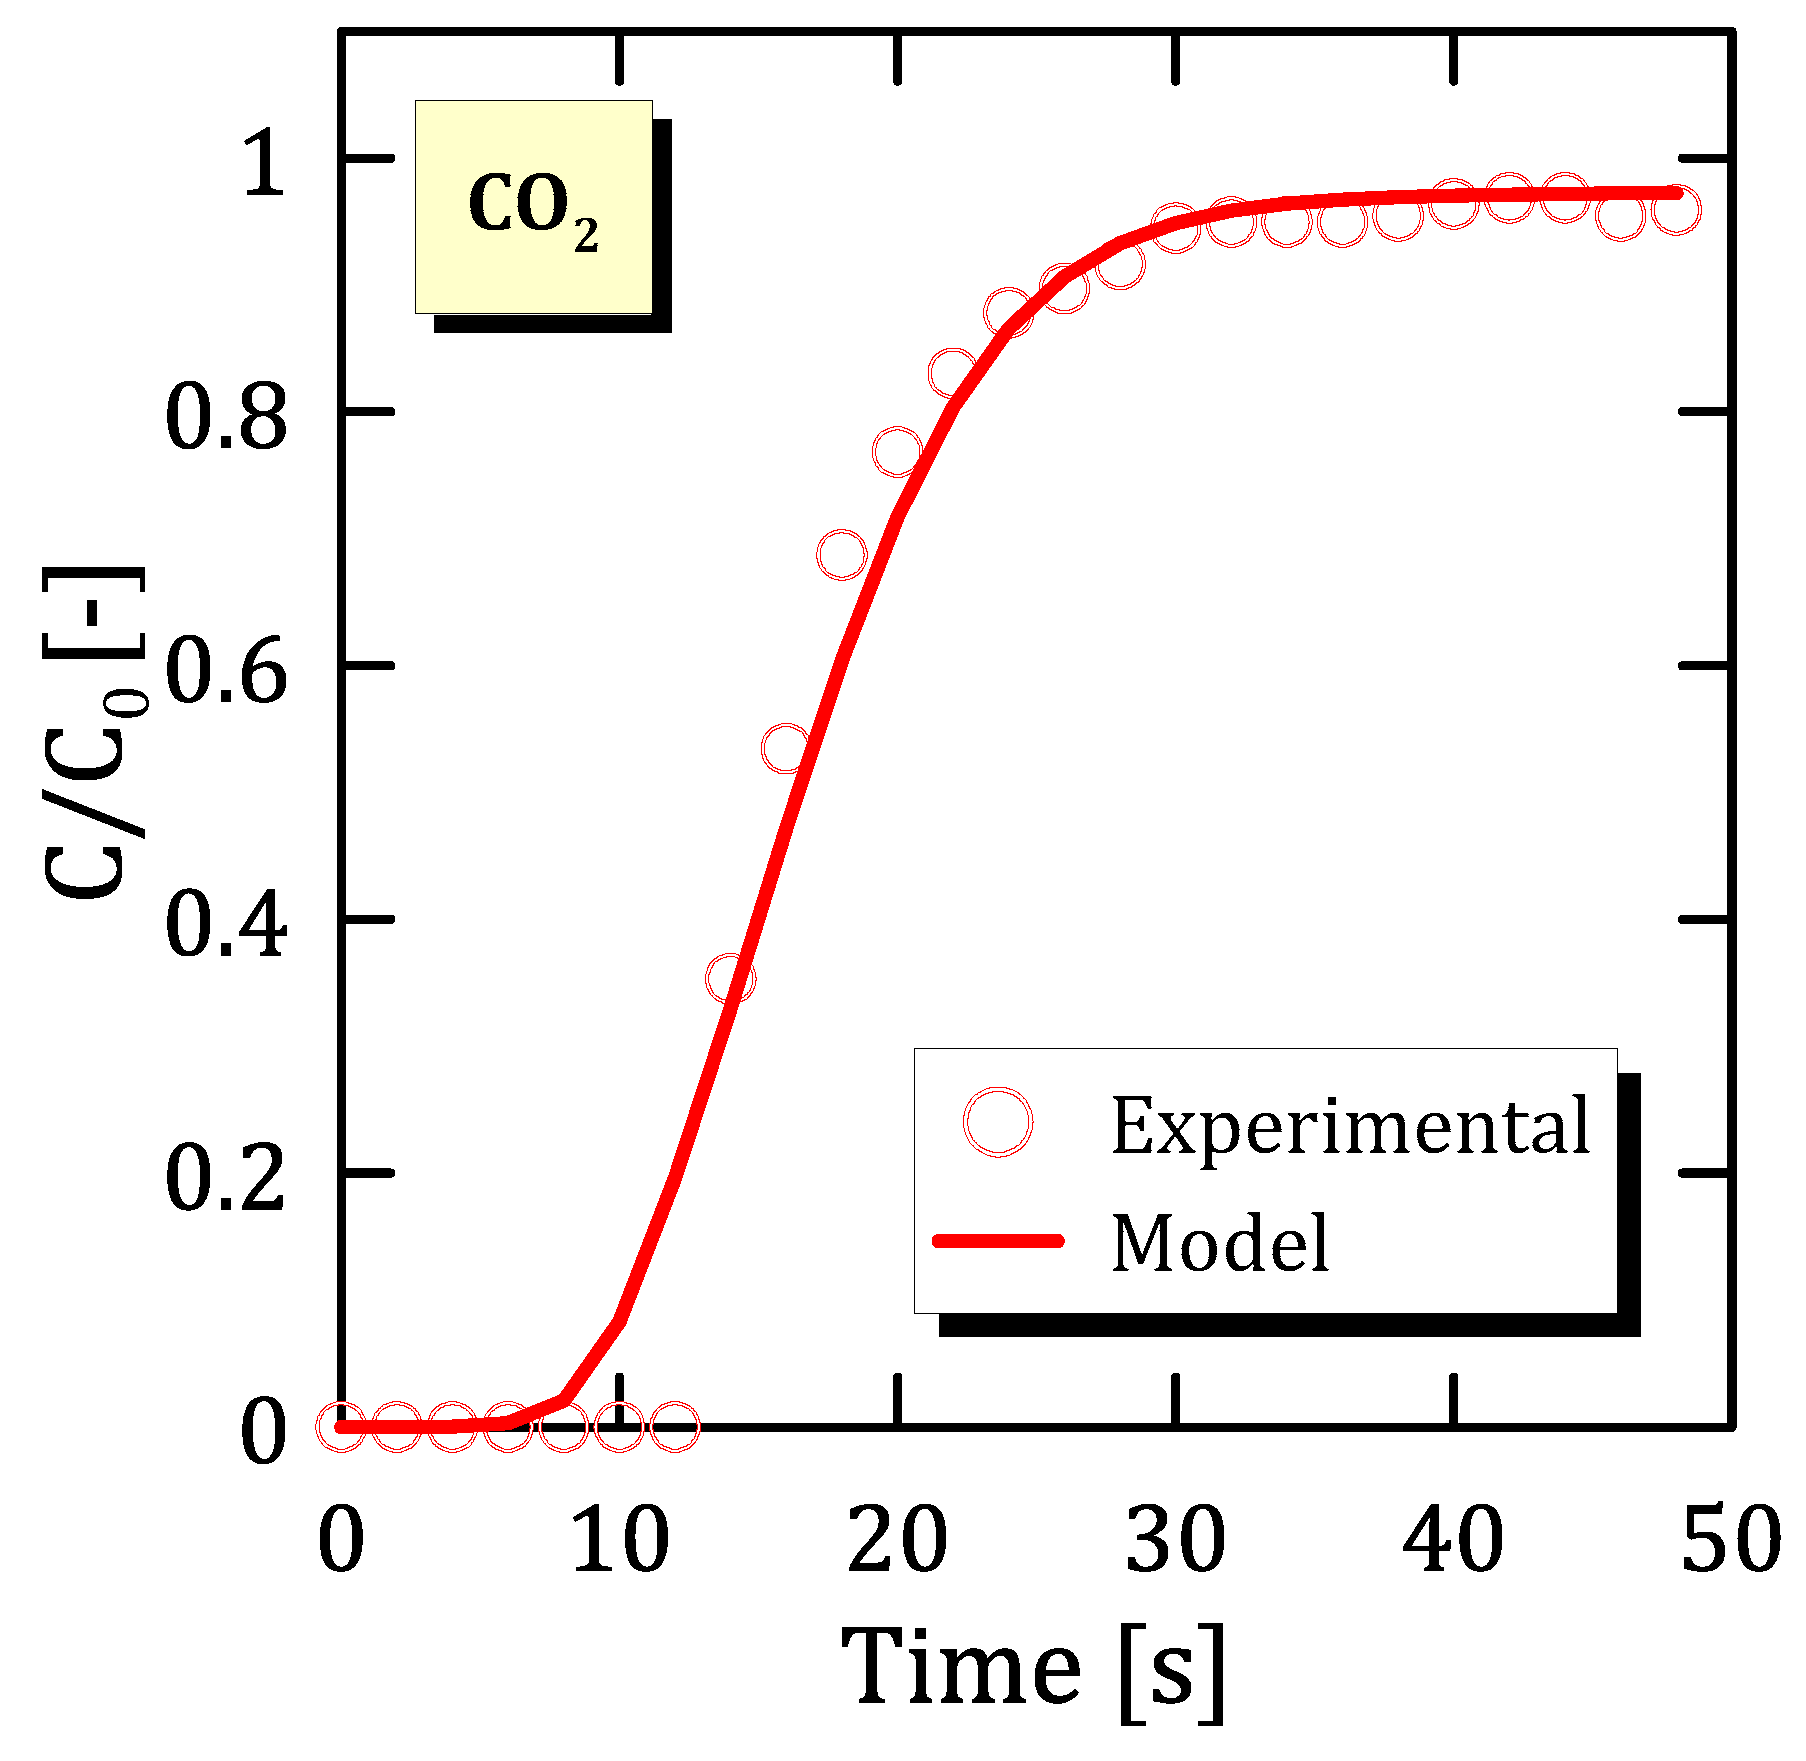
Figure 3 represents the comparison between the experimental carbon dioxide breakthrough curve and that obtained using the optimisation procedure described in the previous section. In both cases, an increasing sigmoidal trend is observed up to values close to 1. At the beginning, the carbon dioxide concentration leaving the adsorber turns out to be zero because it is completely adsorbed by the preceding solid.
As the process goes on, the mass transfer zone moves towards the end section of the bed as the previous areas have become saturated. Increasingly higher outlet concentration values are then observed until the bed is completely saturated, at which point the maximum value occurs. The more closely the experimental data match the modelling data, the more reliable the model. From the calculation, the values reported in Table 3 are observed.
Based on the values reported in this table, it can be said that the Langmuir model is well suited to describe the system under consideration. Specifically, amongst all parameters considered, a particular importance has the estimation of the k L D F value, which is the parameter that regulates the mass transport between the gas and adsorption phase. In fact, it determines the adsorption rate so that
  • If k L D F is high, the adsorption is rapid, and therefore, the breakthrough curve grows very quickly.
  • If k L D F is low, the adsorption is slow, and therefore, the breakthrough curve grows very slowly.
Figure 4 represents the nitrogen and oxygen model breakthrough curves calculated using the objective function minimisation. For oxygen, the experimental curve evaluated using the above-mentioned probe is also shown, which looks satisfactory considering the number of different uncertainties present in the experimental system. The curves do not start from the origin because at the initial moment, there is air in the bed.
For nitrogen, adsorption begins earlier than for oxygen, but it is much slower.
By evaluating the oxygen breakthrough curve, two features can be highlighted:
  • The adsorption of nitrogen is much more rapid than that of oxygen.
  • The curve value comes above the unit value because the driving force changes the sign.
  • At the outlet, there is a flux given by the sum of the incoming flux and the flux desorbed by the solid.
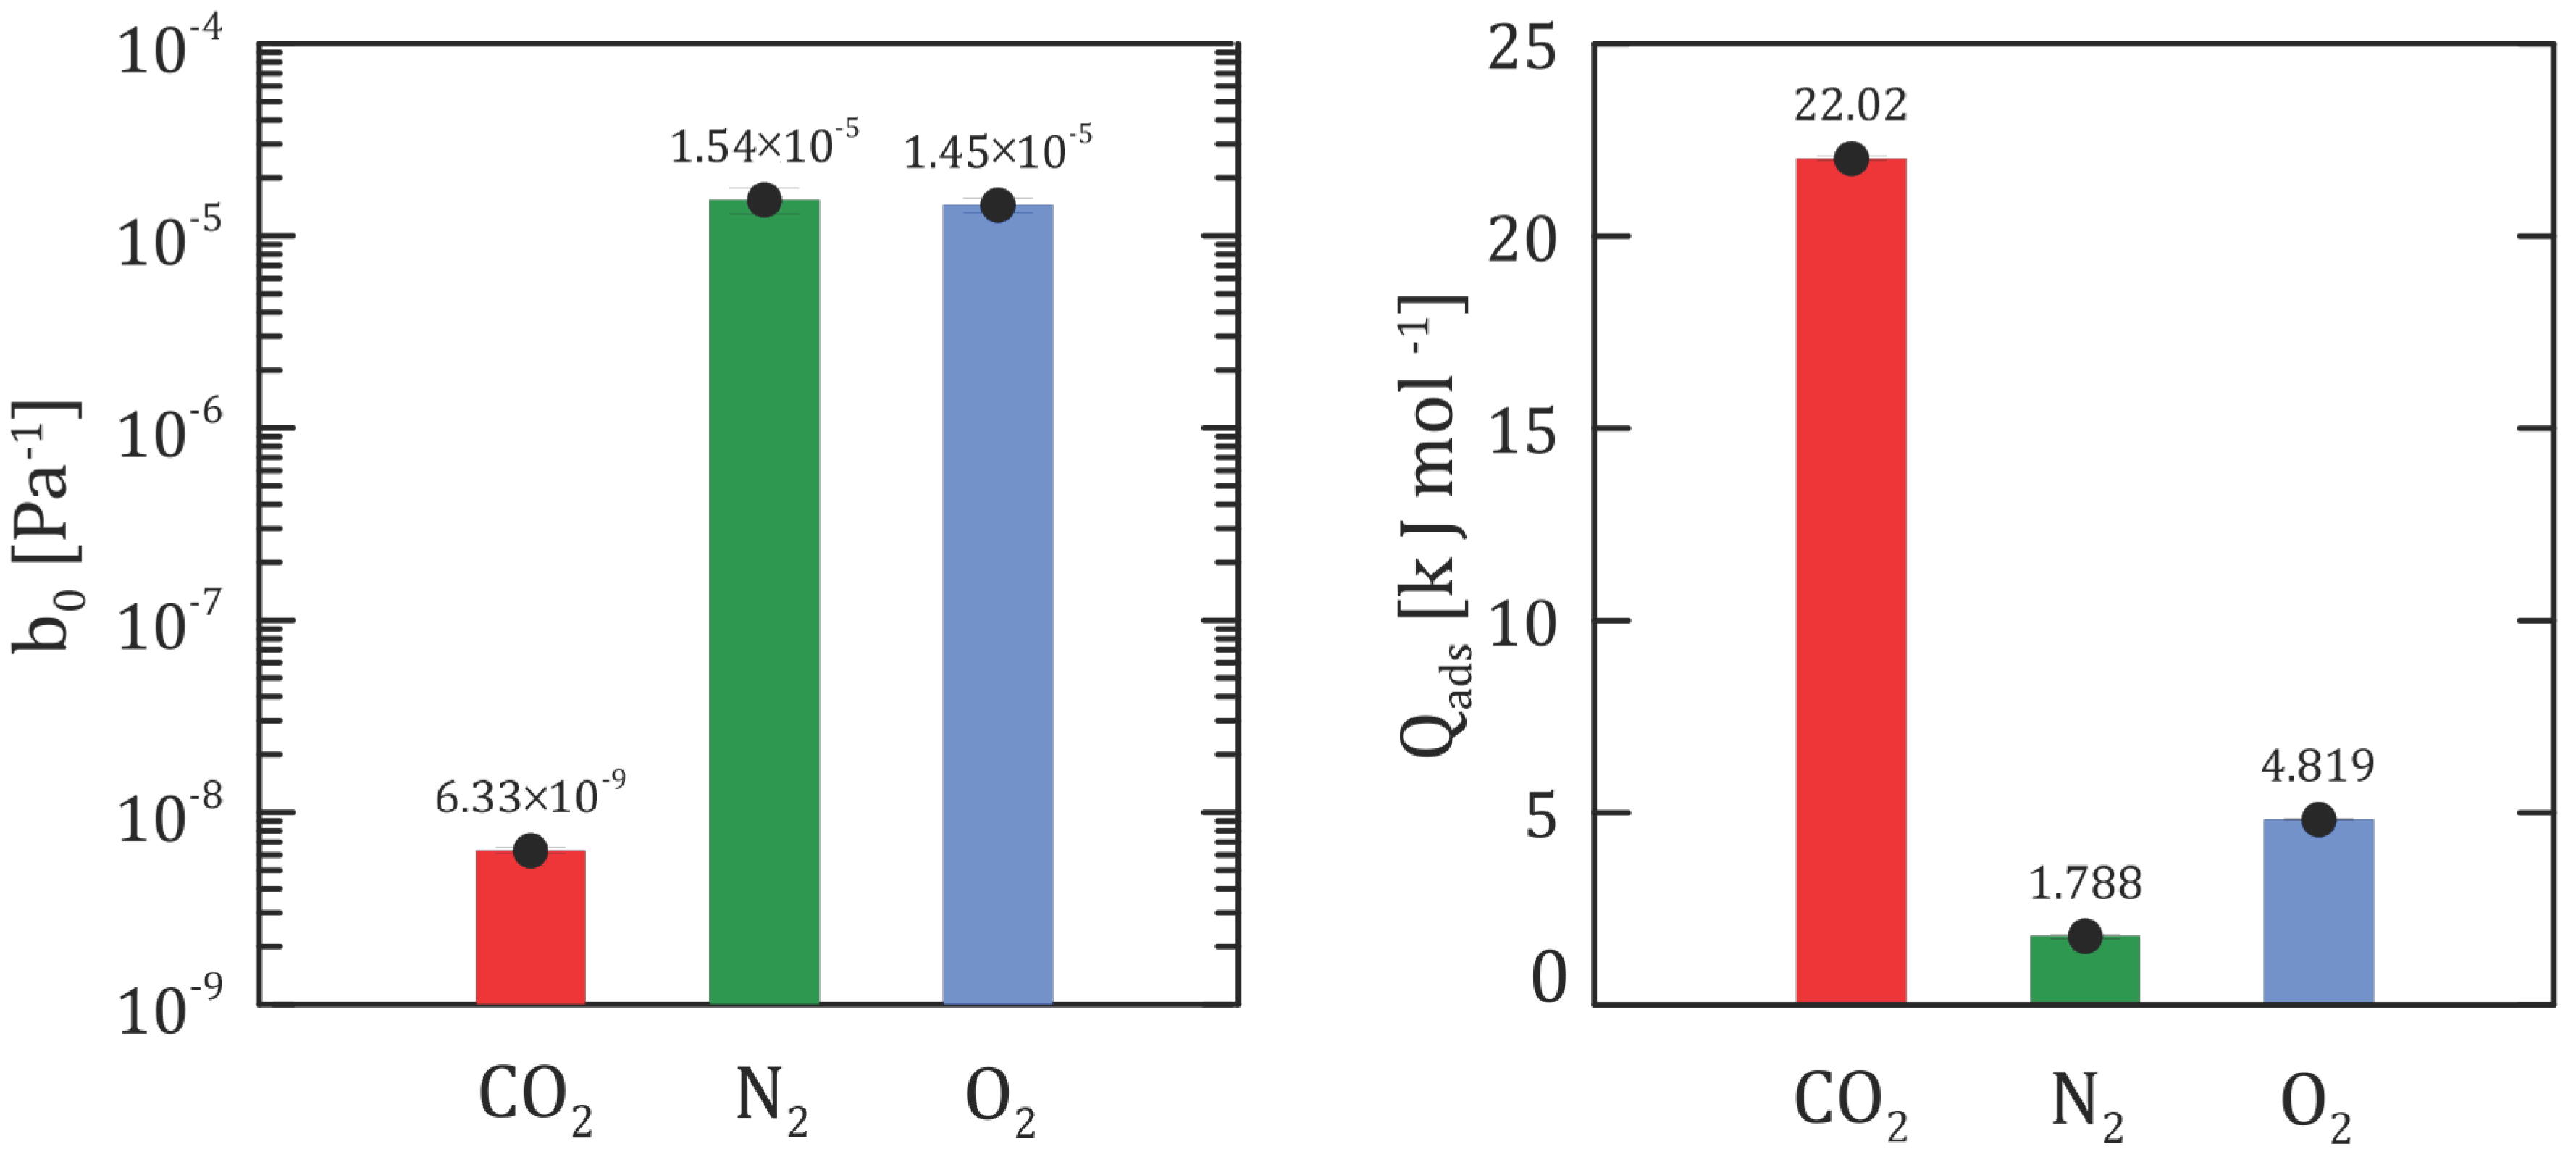
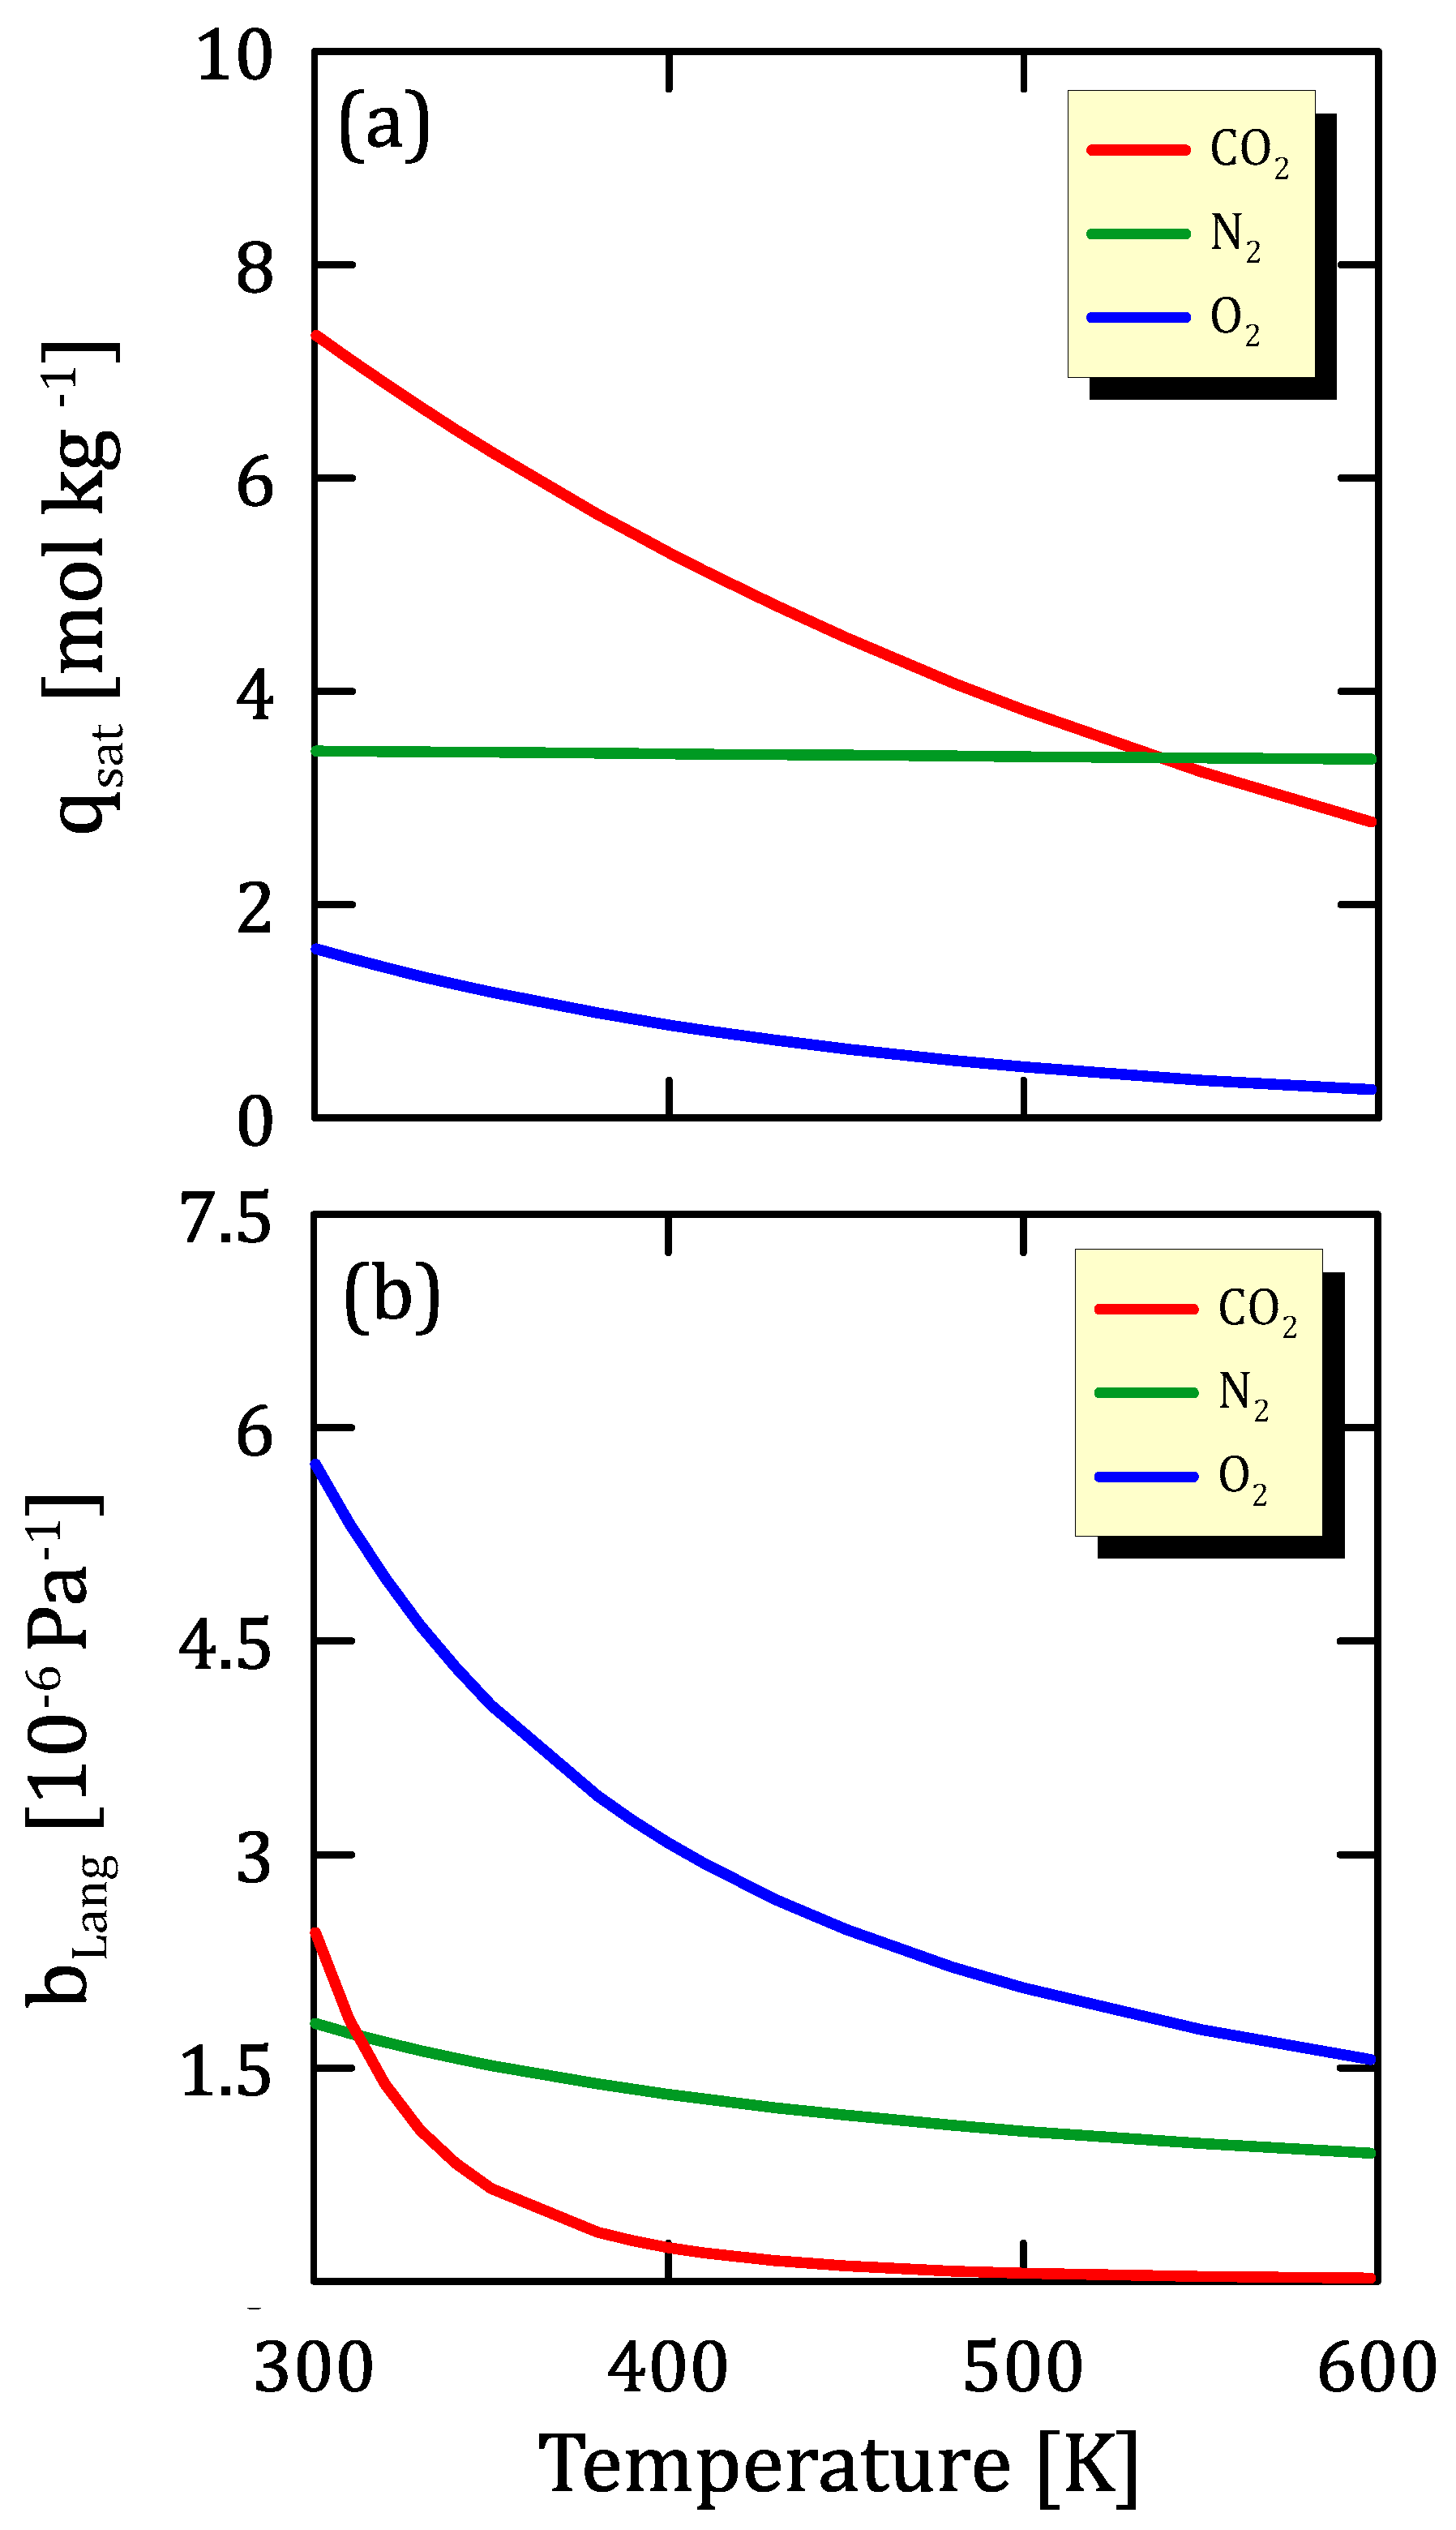
Figure 5 presents the calculated parameters calculated using the simulations. As for q s 0 , it is possible to observe that carbon dioxide has the lowest value. Since this is the pre-multiplicative factor in the saturation load calculation, it is expected to assume a low value. This trend is confirmed by the fact that the other parameter (χ) present in the calculation of q s a t has an intermediate value between those of nitrogen and oxygen and therefore does not make changes from a numerical point of view.
As for b 0 , the carbon dioxide value is very low, even three orders of magnitude lower than the others. However, since Q a d s is greater, the affinity will have a comparable value with the other two species, but with a more important temperature dependence.
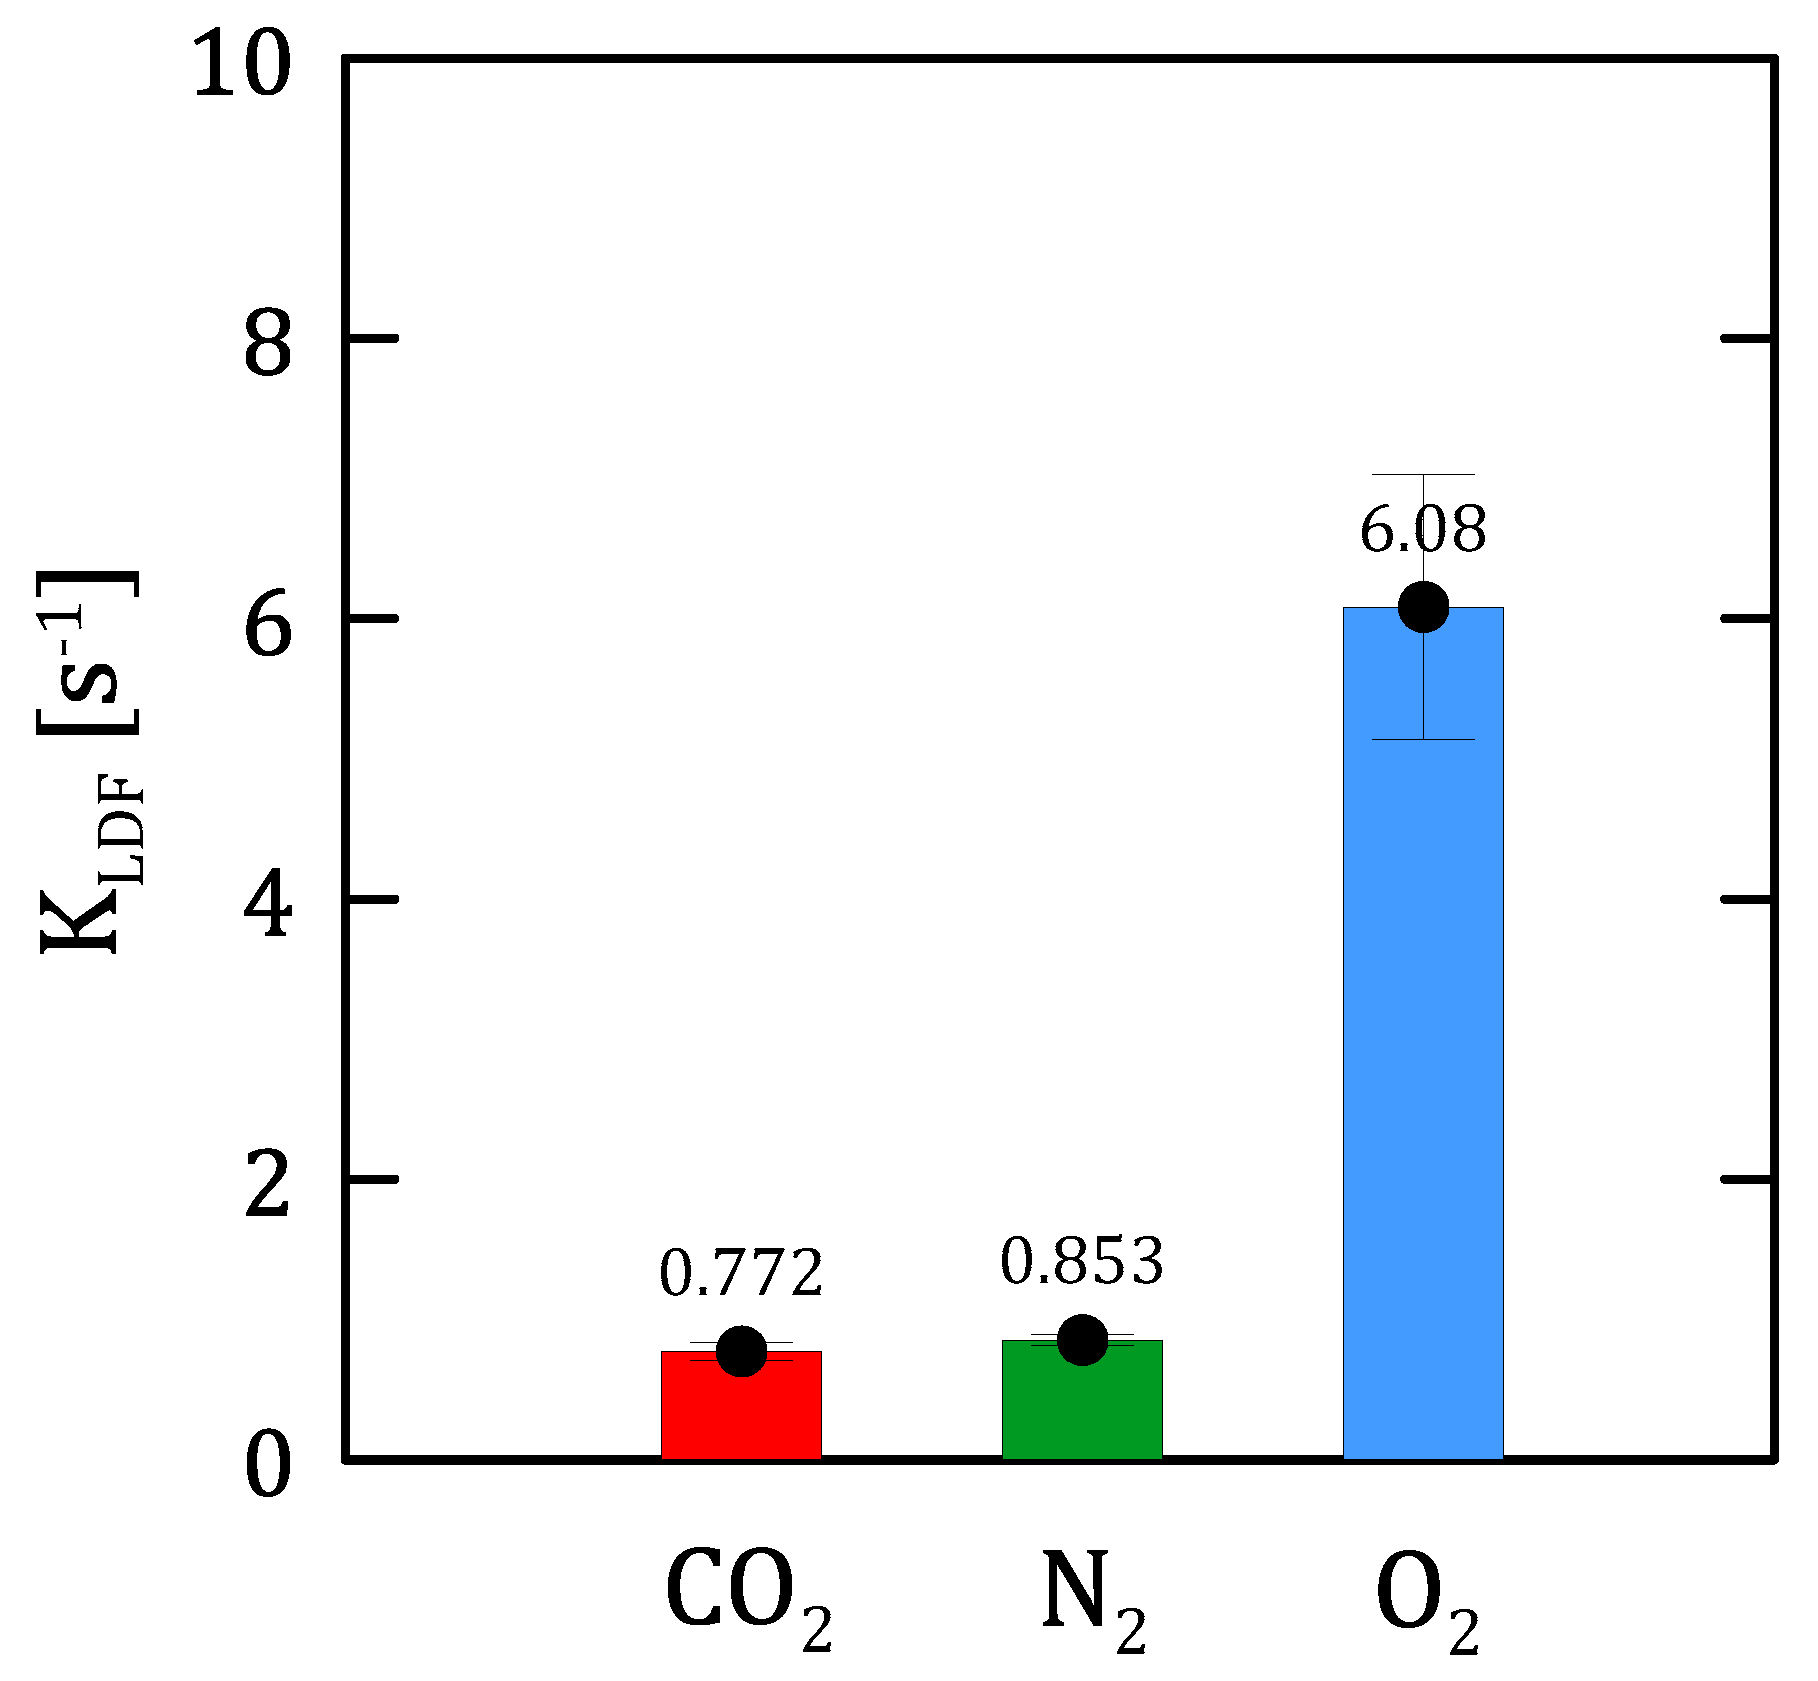
As already mentioned above, KLDF describes the adsorption rate of the species and can already be evaluated through an analysis of the breakthrough curves. In fact, comparing Figure 3, Figure 4 and Figure 6, it can be seen that a higher slope of the MTZ section is associated with a higher KLDF value.
The interpretation of these results is clearer if one analyses the trends of saturation loading and affinity through the relationships described above, as shown in Figure 7.
The parameters q s a t and b L a n g are two important parameters for material characterisation. The parameter q s a t represents the maximum monolayer adsorption capacity, and b L a n g is related to the affinity of the adsorption system.
As for saturation loading, it can be observed that, among the three species evaluated, carbon dioxide shows the lowest values. This is an indication that the number of available active sites is lower than those of the other species. This also explains the reason why the saturation condition is reached quickly.
Observing the particularly low value of the empirical parameter χ, the q s a t value for nitrogen shows a virtual independence of temperature. As already mentioned above, the saturation loading of carbon dioxide shows a stronger dependence on temperature. Therefore, when operating at an ambient temperature, the carbon dioxide–zeolite interactions is favoured over the nitrogen–zeolite ones.
Table 4 reports the calculated values with their respective confidence intervals. It is possible to observe that the wideness of the confidence intervals is different for each value. Some comparisons with the experimental data taken from the literature in different operating conditions are reported in Table 5.
Considering the KLDF value, the confidence interval is narrower for carbon dioxide and nitrogen and wider for oxygen. It can be said that the optimisation procedure allowed us to obtain the two parameters with a high degree of accuracy.
The most critical value appears to be b 0 , as it is very small. It is important to say that the values provided by the confidence intervals lose their usefulness if the optimal value of a parameter is progressively closer to zero. Since for some species, the value ranges are wider than others, it is possible to say that the calculation may be affected by uncertainty. This is physically due to the weakness of the physical species–zeolite bond, which makes the values of the final parameters become dependent on the initial hypothesis.
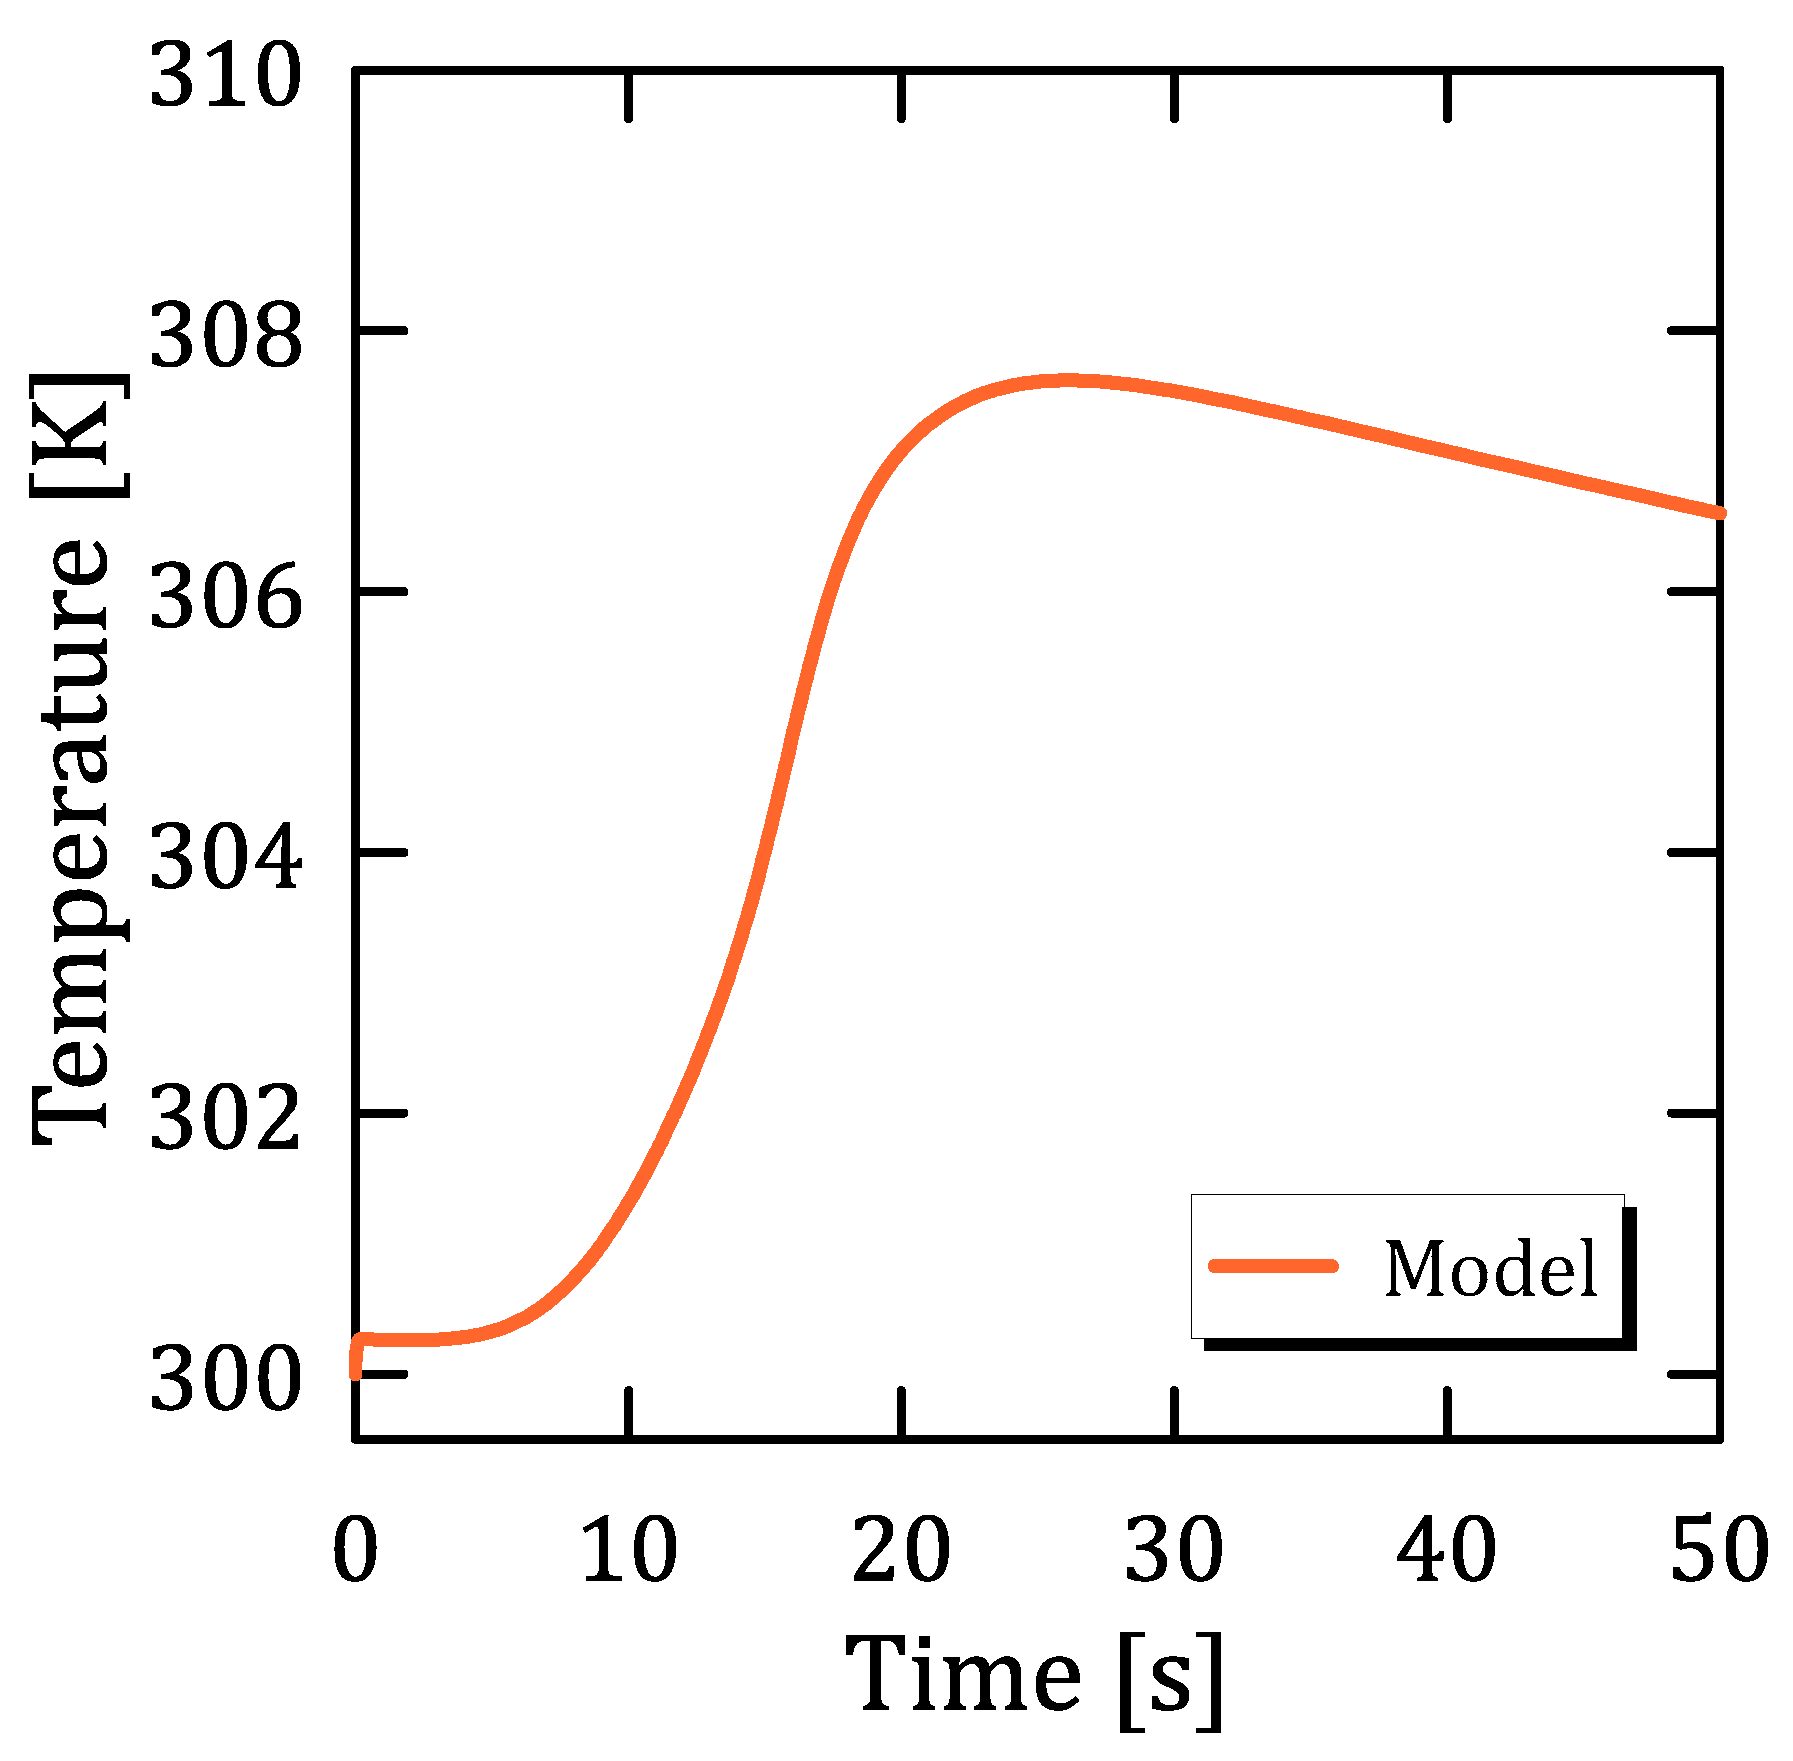
Figure 8 shows the temperature profile at the outlet section of the bed. Since the adsorption process is mainly an exothermic process (ΔH < 0), the temperature should increase along the bed in adiabatic conditions. The model correctly reproduces this behaviour, which predicts a maximum temperature value to which the maximum adsorbed carbon dioxide amount corresponds.
After the maximum, the temperature reaches a value of above 307 K. Figure 9 depicts the rate of the species recovery. This is an important parameter because it allows one to define the rate by which a species can be captured at a certain pressure and temperature.
For all plots, it is possible to distinguish two zones: (i) a zone in which the recovery grows linearly with respect to time as the entire bed participates in the process, and (ii) a zone in which the growth tends to decrease until it reaches a plateau, indicating that the sites start becoming saturated.
The final section of the graph is linear and indicates that a saturation condition has been reached in which the bed is no longer able to adsorb the species. The equilibrium adsorption isotherms of the three species predicted using the estimated parameters are described in this section. Adsorption isotherms were evaluated considering multi-species single-site adsorption. The depicted profiles show recovery performances comparable to recent works in the literature [29,30], the second of which (Beleli et al., 2023 [30]) considers a multi-stage fluidised bed system.
Figure 10 represents the predicted adsorption isotherms for multi-species single-site adsorption. The graphs are parametric with respect to temperature and pressure. Loading represents the maximum adsorbent capacity of the solid, which is the greatest for nitrogen, and then for oxygen and, finally, for carbon dioxide. Since at high pressures, the loading does not vary with the increasing pressure, it can be said that for carbon dioxide, there is a maximum amount of adsorbate. This phenomenon can occur because there are a few sites available for adsorption, so the particles entering the micropores lead to the saturation of the material, which will have no more sites for subsequent adsorption.
The model trend of the isotherms shows an up-concavity. This indicates that, from a physical point of view, carbon dioxide molecules preferentially occupy a certain type of adsorption sites at first. The presence of inflection point is appreciable at lower temperatures. This could be an indication that the potential of these preferential sites is very similar to that of the other sites, and their difference is more evident the lower the temperature as the adsorption force is higher. The spatial and temporal profiles of the gas-phase concentration, loading and temperature calculated through simulations can be observed.
Figure 11 shows the calculated spatial and time profiles of the gas-phase concentrations. The profiles are all decreasing as all three species participate in the adsorption process. Interestingly, the amounts of nitrogen and oxygen adsorbed in the bed are not negligible since their concentrations decrease sharply. Although the adsorption of oxygen and nitrogen is not considered in the literature, when looking at the graphs, it can be seen that this leads to an overestimation of the model results.
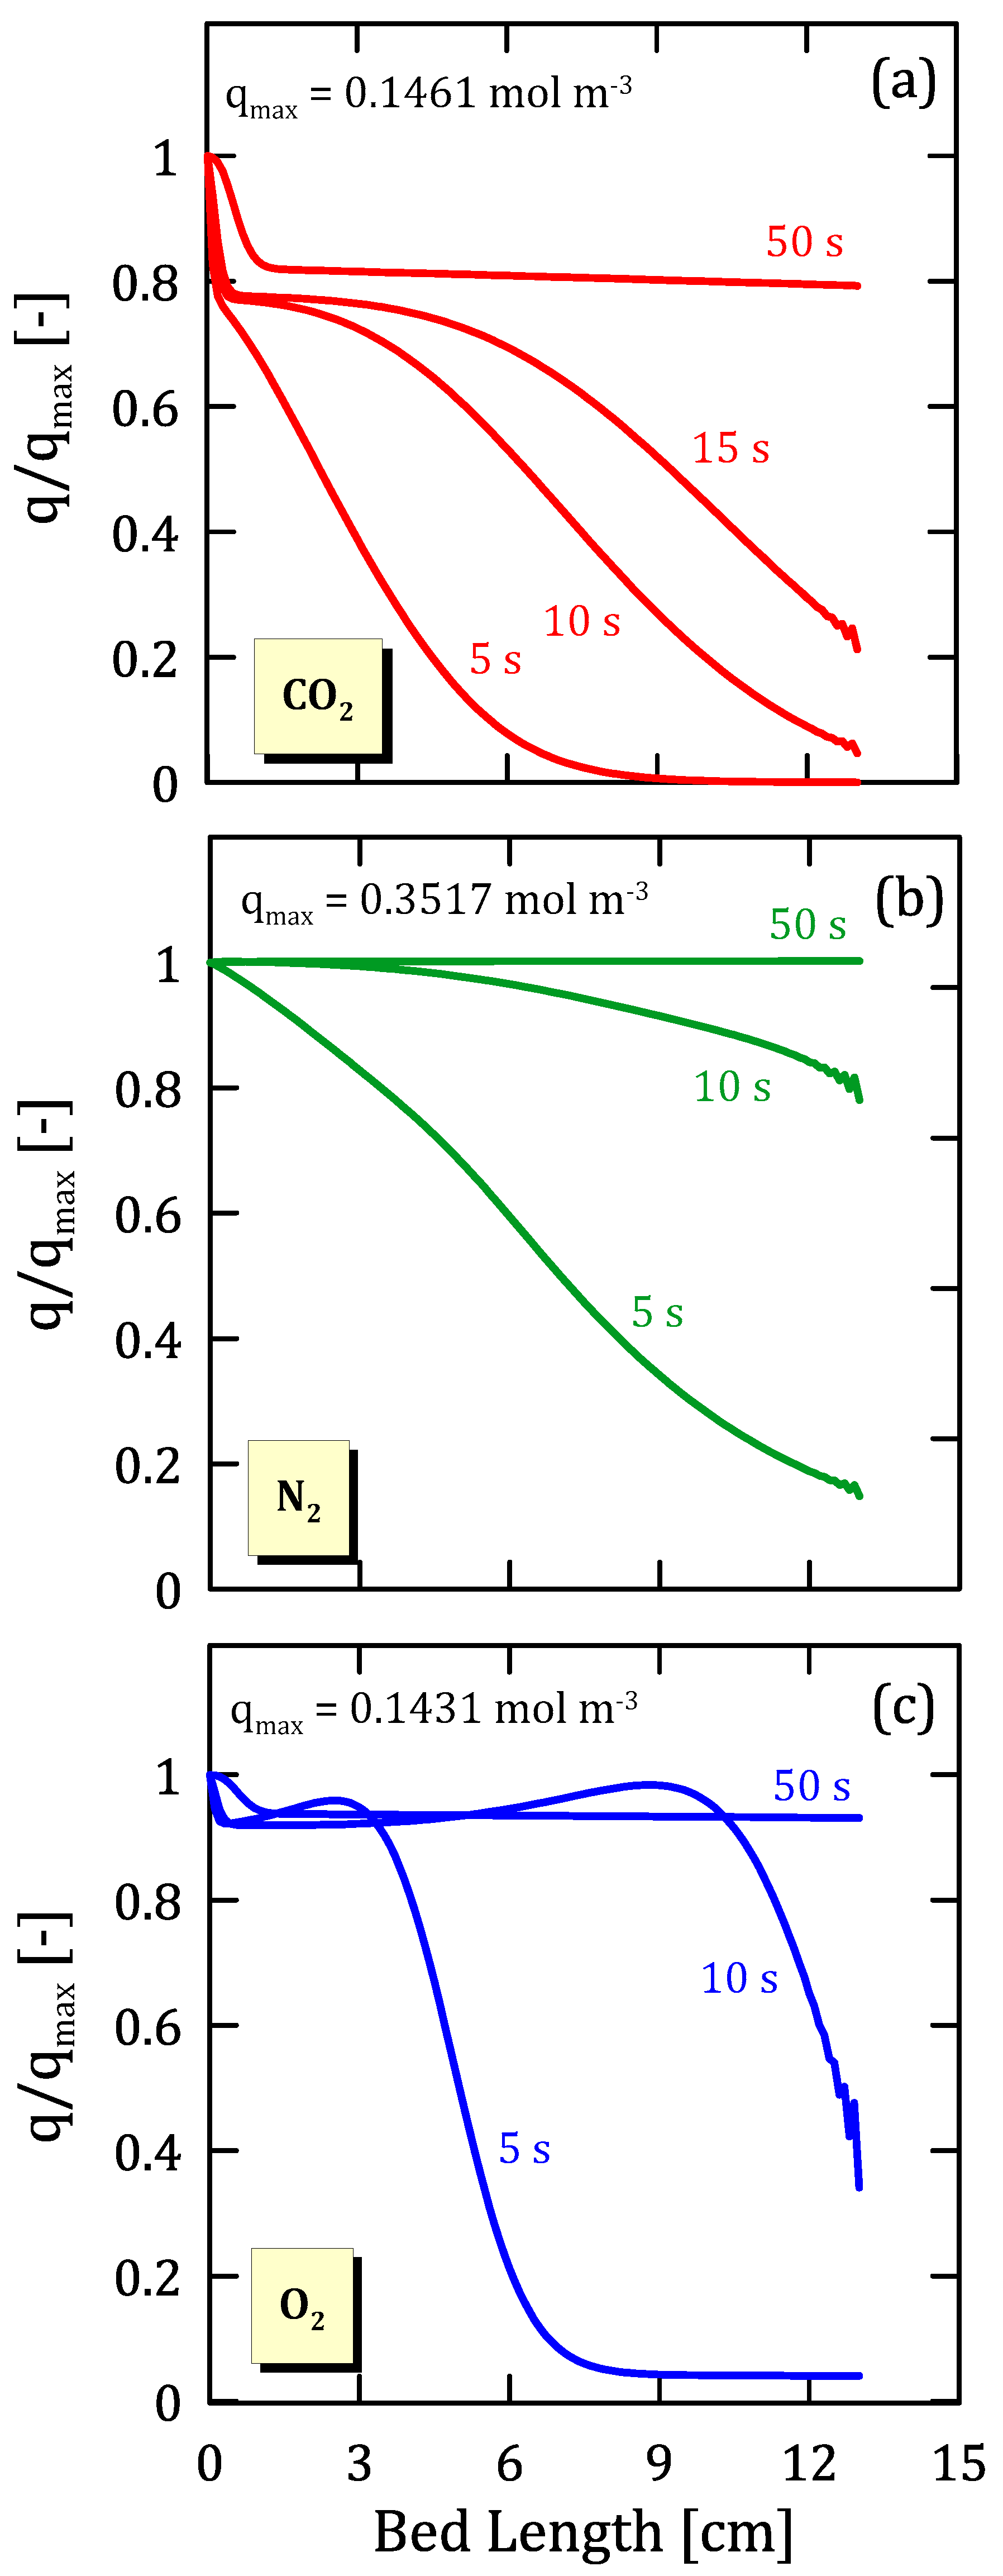
Figure 12 represents the calculated spatial and time profiles of the adsorbed phase concentrations. As for the loading, the profiles decrease as the spatial coordinate increases because the area closest to the inlet is the area that is the most in contact with the inlet stream.
Figure 13 represents the calculated spatial temperature profiles. The temperature profiles have a maximum in correspondence to the maximum carbon dioxide amount adsorbed. Since for low times, the amount that is adsorbed, especially in the final areas of the bed, is low, the temperature does not change. As the time grows due to adsorption processes, the temperature tends to rise gradually.
Figure 14 shows adsorbent material selectivity for nitrogen and oxygen. The selectivity trend therefore makes it possible to state that the material not only adsorbs carbon dioxide, but also important amounts of nitrogen and oxygen. Taking into account that Figure 14 must be read considering the distance of the curves from the unity—the larger this distance, the higher the selectivity—for nitrogen, selectivity is higher at a low temperature and pressure, whereas for oxygen, it is higher at high pressures and a low temperature, although a non-monotone trend with temperature is found. In this case, selectivity increases with the increasing temperature and always has a value greater than 1. This occurs because the adsorption force of nitrogen and oxygen is favoured over that of carbon dioxide, leading the molar fraction of the adsorbed carbon dioxide to be lower.

4. Conclusions

This work is part of a research project aimed at studying potential sorbents for CO2 capture. The main parameters characterising the adsorption process of zeolite 13X were derived with the aim of overcoming the limits of experimental analysis and thus predicting the performances of the materials. In the first part of the study, a parameter-distributed adsorption and transport model was developed and validated, whereas in the second part, a parametric optimisation was performed to estimate the parameters of interest. This was only carried out based on knowledge of the experimental carbon dioxide breakthrough curve.
In contrast to the literature, it was considered that adsorption is a competitive phenomenon, and therefore, the effect that the interaction between the species has on the process itself was evaluated, concluding that this cannot be neglected as it has an important influence on the result.
Since a high R2 value is observed for all materials, it is possible to state that the maximum likelihood between the experimental and numerical results was achieved.
Overall, it can be stated that the zeolite 13X has satisfactory performances for a potential industrial application of CCS due to its high CO2 capture capacity, high selectivity towards the species of interest and higher durability.

Author Contributions

Conceptualisation, A.C. and R.G.; methodology, R.G. and F.T.; software, S.D.L., G.P. and A.C.; validation, G.P. and S.D.L.; formal analysis, A.C. and R.G.; investigation, A.C., R.G., G.P., S.D.L., M.T. and F.T.; resources, R.G.; data curation, M.T., A.C. and G.P.; writing—original draft preparation, G.P. and A.C.; writing—review and editing, G.P. and A.C.; visualisation, A.C. and S.D.L.; supervision, A.C, R.G. and F.T. All authors have read and agreed to the published version of the manuscript.

Funding

This research received no external funding.

Data Availability Statement

The data will be made available upon request.

Conflicts of Interest

The authors declare no conflict of interest.

Abbreviations

List of Symbols
SymbolsDescription
amSpecific area, m−1
AmExchange area, m2
b0Affinity pre-exponential factor, Pa−1
bAffinity, Pa−1
cPSpecific heat, K·mol−1·K−1
CConcentration in the fluid phase, mol m−3
dPParticle diameter, m
DDiffusion coefficient, m2·s−1
fobjObjective function, -
FFlux exchanged with the adsorbed face, mol·m−2·s−1
hHeat transport coefficient, W·m−2·K−1
kLDFMass transport coefficient, s−1
LColumn length, m
nNumber of species, -
niNumber of moles of i species, mol
NTotal flux, mol·m−2·s−1
PPressure, Pa
qLoading in the adsorbed phase, mol·kg−1
qs0Saturation loading, mol·kg−1
QAdsHeat of adsorption, J·mol−1
RIdeal gas constant, J·mol−1·K−1
R2Determination coefficient, -
ReReynolds number, -
tTime, s
TTemperature, K
u, vVelocity, m·s−1
vfSuperficial velocity, m·s−1
VVolume m3
xMole fraction, -
yGas mole fraction, -
Greek symbols
αGeneric coefficient
ΔHEnthalpy variation, J·mol−1
ΔxSpace variation, m
εVoidage degree, -
θGeneric variable
μViscosity, Pa·s−1
ρDensity, kg·m−3
ϕSphericity, -
χ Adsorption parameter, -
Subscripts and Superscripts
adsAdsorption
atmAtmospheric pressure
eEquilibrium
ExpExperimental
gGas
iGeneric species
jIndex for spatial discretisation
LangLangmuir
LDFLinear driving force
ModModel
nIndex for time discretisation
pParticle
sSolid
satSaturation
wWall

Appendix A. Modelling of Carbon Dioxide–Air Adsorption

This section describes the balance equations describing the adsorption process. Figure A1 shows the scheme of the system considered for simulation. The model was developed by considering a fixed bed with the same voidage degree as the fluidised one.
Figure A1. System schematisation.
Separations 10 00558 g0a1

Appendix A.1. Gas-Phase Balance

The gas-phase balance was written by taking the empty area of the column as a control volume (Equation (A1)). The generation term represents the moles exchanged between the gas and adsorbed phase.
N i | z A N i | z + d z A F i a d s d A m = n i t
The total flux Ni can be split into a convective flux contribution and a dispersive flux one, respectively, in the following way (Equation (A2)):
N i = D i C g i z + C g i u
where u represents interstitial velocity. The dispersive flux is expressed in terms of the axial mass dispersion (Dax) analogous to Fick’s First Law. The term related to the adsorption rate can be expressed as follows (Equation (A3)):
F i a d s = 1 ε ρ p k L D F q e , i q i
The difference between the adsorbed quantity at equilibrium and the actual one defines the linear mass transfer driving force. The mole adsorbed at equilibrium was evaluated through the multicomponent Langmuir isotherm (Equations (A4)–(A7)):
q e , i = q s a t , i b L a n g i P i 1 + j = 1 n b L a n g j P j
where
b L a n g , i = b L a n g , i exp Q a d s , L a n g i R T
b L a n g , i = b 0 T
q s a t , i = q s a t , 0 exp χ 1 T T 0
The parameters described with the subscript of zero (0) are those that will be calculated using the optimisation procedure. So, the balance equation becomes the following (Equation (A8)):
ε D a x C g 2 y i z 2 + z v C g , i + ε C g , i t + 1 ε ε p C g , i t + 1 ε ρ p q i t = 0

Appendix A.2. Mass Balance in the Adsorbed Phase

Starting from the general expression (Equation (A9)) and eliminating the terms of OUT and IN, we easily reach the following expression (Equation (A10)):
ACC = IN − OUT + GEN
q i t = k L D F q e , i q i
where IN and OUT are, respectively, the inlet and the outlet flowrates in the adsorbed phase, which are both zero, because we supposed that the molar flux in the adsorbed phase was zero. Differently, the generation term, GEN (right-hand side of Equation (A10)), describes the mass transfer between the adsorbed phase and the fluid one, which is modelled by an overall mass transfer coefficient (kLDF) multiplied by a characteristic driving force, expressed by the difference between the equilibrium loading (qe,i) and the actual loading (qi). The accumulation term (ACC) represents the variation of the loading with respect to time.
The adsorbed phase receives species from the gas phase according to their affinity (Equation (A11)).
k i q e , i q i d A m = n i t d V
where q i is the saturation loading and the analogue of the concentration in the adsorbed phase (Equations (A12) and (A13)).
q i = n i s m s = n i s 1 ε ε ρ p V
n i S = q a 1 ε ε ρ p V
Substituting this equation into the previous one gives the following (Equations (A14)–(A17)):
k q e q d A m = 1 ε ε ρ p d V q A t
k q e q d A m 1 ε ε ρ p d V = q A t
By defining the two parameters as follows, the final equation can be derived (Equation (A18)):
a m = d A m d V
k L D F = k i a m 1 ε ε ρ p
q i t = k L D F q e , i q i
where k L D F is the linear driving force model mass transfer. It considers the mass transfer resistance as a linear function of concentration.

Appendix A.3. Energy Balance

The balances are written by considering the pseudo-homogeneous system, i.e., neglecting the temperature variation inside the solid. This avoids writing the energy transfer equations at the interphase between the gas and solid phases.
The balance written on the wall of the column turns out to be the following (Equation (A19)):
ρ w C p w T w t = a w h w T g T w a w l U o T w T a i r
The balance equation for the pseudo-homogeneous phase is the following (Equation (A20)):
t ( ε C g C p g + 1 ε ( ε p C g , i C p g , i + ρ p q i C p g , i ) ) T g ε + 1 ε ε p P t + t ρ s C p s T g + z v C g C v g T g z λ e T g z ρ b H i q i t + 4 h w d i ( T g T w ) = 0
The assumption, therefore, consists of considering a flat temperature profile inside the adsorbent. This condition is quite close to the actual conditions and allows for the mathematical treatment to be simplified without introducing major errors.

Appendix A.4. Pressure Loss Equation

The Ergun equation is used to account for the process pressure losses and thus to quantify the velocity variations (Equations (A21)–(A25)). Generally, it is neglected because the contribution of these losses is negligible, whereas in this case, it was used to take account of the pressure change.
P z = 150 μ g 1 ε 2 ε 3 d p 2 v + 1.75 1 ε ε 3 d p ρ g v 2
P z = c f 1 2 ρ f v f 2 A T V a
v f = u ε
A T = 1 ε V 6 d p
A T V a = 1 ε V 6   d p
Considering the spherical particles, the following expression is obtained (Equations (A26)–(A31)):
A T V a = 1 ε ε 6 d p
P z = 3 c f ρ f u 2 d p 1 ε ε 3
c f = 3 2 c f
P z = 2 c f ρ f u 2 d p 1 ε ε 3
R e = ρ f u d p 1 ε μ f
c f = 75 R e + 0.875
Unlike those seen above, the Ergun equation does not have terms of times derivatives, so it will be modelled differently, as explained in the following sections.

Appendix A.5. Simulation System

Once all of the balance equations are described, the resulting system is the following (Equations (A32)–(A36)):
{ ( A 32 ) q i t = k L D F q e , i q i ( A 33 ) ε D a x 2 C g , i z 2 + z v C g , i + ε C g , i t + 1 ε ε p C g , i t + 1 ε ρ p q i t = 0 ( A 34 ) t ( ε C g C p g + 1 ε ( ε p C g , i C p g , i + ρ p q i C p g , i ) ) T g ε + 1 ε ε p P t + t ρ s C p s T g + z v C g C v g T g z λ e T g z ρ b H i q i t + 4 h w d i ( T g T w ) = 0 ( A 35 ) ρ w C p w T w t = a w h w T g T w a w l U o T w T a i r ( A 36 ) P z = 150 μ g 1 ε 2 ε 3 d p 2 v + 1.75 1 ε ε 3 d p ρ g v 2
In particular, it consists of (n + 2) ordinary differential equations (ODEs) and (n + 1) partial differential equations (PDEs).
Due to the system’s complexity, it is immediately clear that an analytical solution is not feasible, so numerical solution methods are used. The method commonly used to solve PDEs is the finite difference method, in which we proceed using the Taylor series, according to which
  • The first derivative can be written as Forward, Backward or Centred. The Forward and Backward formulations are less accurate than the Centred formulation, so a method that uses the latter formulation is more accurate.
  • The second derivative can only be expressed through a Centred formulation.
Discretisation aims to build a solution in the form of a grid of points.

Appendix A.6. Initial and Boundary Conditions

This section describes the initial and boundary conditions used to saturate the degrees of freedom.
{ ( A 37 ) t = 0 C g , i = C g , I N ( A 38 ) t = 0 q i = 0 ( A 39 ) t = 0 T w = T 0 ( A 40 ) t = 0 T g = T 0
At the initial time t = 0, the conditions are as follows:
  • The concentration inside the bed is the same as that in air (Equation (A37));
  • The concentration of the adsorbed phase is zero, as the adsorbent material is considered to be completely regenerated from the previous operations (Equation (A38));
  • The temperature is equal to the ambient temperature (Equations (A41)–(A45)).
{ ( A 41 ) z = 0 D A C g , i z | z = 0 + v C g , i | z = 0 = D A C g , i z | z = 0 + + v C g , i | z = 0 + ( A 42 ) z = 0 ( v C p g , i C g , i T g ) | i n l e t = ( v C p g , i C g , i T g ) | z = 0 ( A 43 ) z = L C g , i z = 0 ( A 44 ) z = L T z = 0 ( A 45 ) z = L P = P a t m
As for the inlet section, it is possible to assign Danckwerts boundary conditions, in which the flux continuity of mass and energy is set (Equations (A41) and (A42)). As for the outlet section, instead, it is possible to assign a null flow condition because the variations related to the convective terms are negligible (Equations (A43) and (A44)).
As for pressure, since the Ergun equation has no time derivatives, it is sufficient to assign a single boundary condition, which is written at the outlet section where pressure is assigned to the atmospheric pressure (Equation (A45)).

Appendix A.7. Method of Line

The method allows for partial differential equations (PDEs) to be solved via the numerical integration of ordinary differential equations (ODEs).
The basic idea of the MOL is to replace the spatial derivatives in the PDE with algebraic approximations. Once this is carried out, the spatial derivatives are no longer written explicitly in terms of the spatial independent variables. Thus, only the initial value variable (typically time) remains [31].
This method is similar to the finite difference discretisation method, as the derivatives are written using the Taylor series truncated to a certain degree, with the difference that this is only carried out for the spatial derivatives, whilst the temporal derivatives remain unchanged (Equations (A46) and (A47)).
θ t = α 2 θ x 2
θ t = α θ j 1 n 2 θ j n + θ j + 1 n x 2
This is an important simplification, as there is no need for a complex discretisation, and the classic solution methods are bypassed in this way. Such a discretisation also allows for non-linear terms to be considered as linear ones, since they are evaluated in the previous time step. The problem then turns into ordinary differential equations with initial values. In this case, the solution is simpler than the system described above.
This system (Equation (A48)) is solved through the MATLAB function, ode15s, whose algorithm works at a variable step. The integration solution is returned as reported, known as the dependent variable array (Equation (A53)).
Since the solution is calculated via points, it is important to consider the fact that it may suffer from instability problems. The step was chosen to reach a compromise between the burden of calculation and the accuracy of solution. As described by Scott [31], it is possible to manipulate the Ergun equation by making the velocity explicit (Equations (A54)–(A59)). This allows for the calculation of the velocity profile u.
q i t = k L D F ( q e , i q i ) ε D a x 2 C g , i z 2 + z v C g , i + ε C g , i t + 1 ε ε p C g , i t + 1 ε ρ p q i t = 0 t ( ε C g C p g + 1 ε ( ε p C g , i C p g , i + ρ p   q i C p g , i ) ) T g ε + 1 ε ε p P t + + t ρ s C p s T g + z v C g C v g T g z λ e T g z ρ b H i q i t + 4 h w d i (   T g T w ) = 0 ρ w C p w T w t = a w h w T g T w a w l U o T w T a i r P z = 150 μ g 1 ε 2 ε 3 d p 2 v + 1.75 1 ε ε 3 d p ρ g v 2
where
C z = C j 1 n C j + 1 n 2 x
T z = T j 1 n T j + 1 n 2 x
2 C z 2 = C j 1 n 2 C j n + C j + 1 n x 2
2 T z 2 = T j 1 n 2 T j n + T j + 1 n x 2
Y = C g i z = 0 t = 0 C g i z = L t = 0 C g i z = 0 t = t f C g i z = L t = t f q i z = 0 t = 0 q i z = L t = 0 q i z = 0 t = t f q i z = L t = t f T z = 0 t = 0 T z = L t = 0 T z = 0 t = t f T z = L t = t f T w z = 0 t = 0 T w z = L t = 0 T w z = 0 t = t f T w z = L t = t f
u = v 0 1 α z 1 2
where
v 0 = R T G M P 0
α = 2 R T L ( A G + B G 2 ) M P 0
G = 1 2 B A 2 + 2 B M p 2 R T L A
A = 150 1 ε 2 μ ε 3 d 2
B = 1.75 ( 1 ε ) ε 3 d

Appendix A.8. Parametric Optimisation

Through parametric optimisation, it is possible to evaluate both the main parameters describing the solid–fluid exchange and those characterising the Langmuir isotherm. This was carried out because to evaluate the performance of the material used during the experimental phase, it is necessary to develop the modelling part, which is not present in the literature.
In this section, the objective function, solution algorithm and constraints will be explained. The experimental data are derived from measurements on the carbon dioxide breakthrough curve. From these, the main parameters characterising the adsorption process are calculated by means of a parametric optimisation.
The objective function is constructed by imposing the maximum likelihood between the experimental results and numerical ones in terms of the carbon dioxide breakthrough curve. As the experimental curve is detected through a series of measurements at regular intervals in a characteristic time range, whilst the model curve is evaluated at variable intervals, we must specify how to calculate the difference between the curves.
The points must first be standardised through fitting operations, and then the two breaking curves are subtracted. The parametric optimisation will return the k L D F value and the parameters of the adsorption isotherms.
The generic approach to a problem of this type is to consider a black box characteristic of the problem, which takes over the variables being optimised, solves the entire process, and returns the fx. Once this is carried out, it is possible to know the value of the fobj for any optimisation parameter.
The objective function is evaluated as the norm of the residuals, i.e., as the sum of the absolute value of the difference between the model and experimental points (Equation (A60)) (Figure A2).
f o b j = i = 1 n | y i M o d y i E x p |
Figure A2. Sketch of the objective function.
Separations 10 00558 g0a2

References

  1. Sreedhara, I.; Vaidhiswarana, R.; Kamania, M.B.; Venugopalb, A. Process and engineering trends in membrane based carbon capture. Renew. Sustain. Energy Rev. 2017, 68, 659–684. [Google Scholar] [CrossRef]
  2. Wang, M.; Wang, Z.; Zhao, S.; Wang, J.; Wang, S. Recent advances on mixed matrix membranes for CO2 separation. Chin. J. Chem. Eng. 2017, 25, 1581–1597. [Google Scholar] [CrossRef]
  3. Kim, S.; Lee, M.Y. High performance polymer membranes for CO2 separation. Curr. Opin. Chem. Eng. 2013, 2, 238–244. [Google Scholar] [CrossRef]
  4. Abd, A.A.; Naji, S.Z.; Hashim, A.S.; Othman, R.M. Carbon dioxide removal through physical adsorption using carbonaceous and non-carbonaceous adsorbents: A review. J. Environ. Chem. Eng. 2020, 8, 104142. [Google Scholar]
  5. Yu, H.C.; Huang, H.C.; Tan, S.C. A Review of CO2 Capture by Absorption and Adsorption. Aerosol Air Qual. Res. 2012, 12, 745–769. [Google Scholar] [CrossRef]
  6. Feng, J.; Guo, H.; Wang, S.; Zhao, Y.; Ma, X. Fabrication of multi-shelled hollow Mg-modified CaCO3 microspheres and their improved CO2 adsorption performance. Chem. Eng. J. 2017, 321, 401–441. [Google Scholar] [CrossRef]
  7. García, S.; Pis, J.J.; Rubiera, F.; Pevida, C. Predicting mixed-gas adsorption equilibria on activated carbon for Precombustion CO2 capture. Langmuir 2013, 29, 6042–6052. [Google Scholar] [CrossRef]
  8. Gao, H.; Zhou, L.; Luo, X.; Liang, Z. Optimised process configuration for CO2 recovery from crude synthesis gas via a rectisol wash process. Int. J. Greenh. Gas Control 2018, 79, 83–90. [Google Scholar] [CrossRef]
  9. Duong, D.D. Adsorption Analysis: Equilibia and Kinetics. Series on Chemical Engineering; Imperial College Press: London, UK, 1998. [Google Scholar]
  10. Girimonte, R.; Formisani, B.; Testa, F. Adsorption of CO2 on a confined fluidized bed of pelletized 13X zeolite. Powder Technol. 2017, 311, 9–17. [Google Scholar] [CrossRef]
  11. Girimonte, R.; Formisani, B.; Testa, F. CO2 adsorption in a confined fluidized bed of zeolite pellets: Influence of operating velocity. Particuology 2018, 46, 67–74. [Google Scholar] [CrossRef]
  12. Ghurabi, E.H.A.; Ajbar, A.; Asif, M. Enhancement of CO2 Removal Efficacy of Fluidized Bed Using Particle Mixing. Appl. Sci. 2018, 8, 1467. [Google Scholar] [CrossRef]
  13. Poursaeidesfahani, A.; Andres-Garcia, E.; de Lange, M.; Torres-Knoop, A.; Rigutto, M.; Nair, N.; Kapteijn, F.; Gascon, J.; Dubbeldam, D.; Vlugt, T.J. Prediction of adsorption isotherms from breakthrough curves. Predict. Adsorpt. Isotherms Breakthr. Curves 2019, 277, 237–244. [Google Scholar] [CrossRef]
  14. Ünveren, E.E.; Monkul, Ö.B.; Sarıoğlan, Ş.; Karademir, N.; Alper, E. Solid amine sorbents for CO2 capture by chemical adsorption: A Review. Petroleum 2016, 3, 37–50. [Google Scholar] [CrossRef]
  15. Mansour, B.M.; Habib, M.A.; Bamidele, O.E.; Basha, M.; Qasem, N.A.A.; Peedikakkal, A.; Laoui, T.; Ali, M. Carbon capture by physical adsorption: Materials, experimental investigations and numerical modeling and simulations—A review. Appl. Energy 2016, 161, 225–255. [Google Scholar] [CrossRef]
  16. Motsi, T.; Rowson, N.A.; Simmons, M.J.H. Adsorption of heavy metals from acid mine drainage by natural zeolite. Int. J. Miner. Process 2009, 92, 42–48. [Google Scholar] [CrossRef]
  17. Boonchuay, A.; Worathanakul, P. The Diffusion Behavior of CO2 Adsorption from a CO2/N2 Gas Mixture on Zeolite 5A in a Fixed-Bed Column. Atmosphere 2022, 13, 513. [Google Scholar] [CrossRef]
  18. Zhang, Z.; Zhang, W.; Chen, X.; Xia, Q.; Li, Z. Adsorption of CO2 on Zeolite 13X and Activated Carbon with Higher Surface Area. Sep. Sci. Technol. 2010, 45, 710–719. [Google Scholar] [CrossRef]
  19. Dantas, T.L.P.; Luna, F.M.T.; Silva, I.J., Jr.; Torres, A.E.B.; Azevedo, D.C.S.; Rodrigues, A.E.; Moreira, R.F.P.M. Modeling of the fixed-bed adsorption of carbon dioxide and a carbon dioxide nitrogen mixture on Zeolite 13X. Braz. J. Chem. Eng. 2011, 28, 533–544. [Google Scholar] [CrossRef]
  20. Morales, O.R.; Santiago, G.R.; Siqueira, R.M.; Azevedo, S.C.D.; Neto, B.M. Assessment of CO2 Desorption from 13X Zeolite for a Prospective TSA Process; Springer Science+Business Media: Berlin/Heidelberg, Germany, 2019. [Google Scholar]
  21. Moura, P.A.S.; Bezerra, D.P.; Vilarrasa-Garcia, E.; Bastos-Neto, M.; Azevedo, D.C.S. 2016 Adsorption Equilibria of CO2 and CH4 in Cation-Exchanged Zeolites 13X; Springer Science+Business Media: New York, NY, USA, 2015. [Google Scholar]
  22. Garshasbi, V.; Jahangiri, M.; Anbia, M. Equilibrium CO2 adsorption on zeolite 13X prepared from natural clays. Appl. Surf. Sci. 2017, 393, 225–233. [Google Scholar] [CrossRef]
  23. Pereira, A.; Ferreira, A.F.P.; Rodrigues, A.; Ribeiro, A.M.; Regufe, M.J. Evaluation of the potential of a 3D-printed hybrid zeolite 13X/activated carbon material for CO2/N2 separation using electric swing adsorption. Chem. Eng. J. 2022, 450, 138197. [Google Scholar] [CrossRef]
  24. Kareem, F.A.; Shariff, A.M.; Ullaha, S.; Dreisbachb, F.; Keonga, L.K.; Mellona, N.; Garga, S. Experimental measurements and modeling of supercritical CO2 adsorption on 13X and 5A zeolites. J. Nat. Gas Sci. Eng. 2018, 50, 115–127. [Google Scholar] [CrossRef]
  25. Majchrzak-Kucęba, I.; Wawrzynczak, D.; Sciubidlo, A. Experimental investigation into CO2 capture from the cement plant by VPSA technology using zeolite 13X and activated carbon. J. CO2 Util. 2022, 61, 102027. [Google Scholar] [CrossRef]
  26. Won, W.; Lee, S.; Lee, K.S. Modeling and parameter estimation for a fixed-bed adsorption process for CO2 capture using zeolite 13X. Sep. Purif. Technol. 2012, 85, 120–129. [Google Scholar] [CrossRef]
  27. Najafi, A.M.; Soltanali, S.; Khorashe, F.; Ghassabzadeh, H. Effect of binder on CO2, CH4, and N2 adsorption behavior, structural properties, and diffusion coefficients on extruded zeolite 13X. Chemosphere 2023, 324, 138275. [Google Scholar] [CrossRef] [PubMed]
  28. Ghaemi, A.; Dehnavi, M.K.; Khoshraftar, Z. Exploring artificial neural network approach and RSM modeling in the prediction of CO2 capture using carbon molecular sieves. Case Stud. Chem. Environ. Eng. 2023, 7, 100310. [Google Scholar] [CrossRef]
  29. Beleli, Y.S.; de Paiva, J.L.; Seckler, M.M.; Carrillo Le Roux, G.A. Optimization of a continuous multi-stage fluidized bed system for CO2 capture utilizing temperature swing adsorption. Comput. Aided Chem. Eng. 2023, 52, 3233–3238. [Google Scholar]
  30. Hamdi, S.; Schiesser, W.E.; Griffiths, G.W. Method of Lines, Part I: Basic Concepts. Scholarpedia 2007, 2, 2859. [Google Scholar] [CrossRef]
  31. Scott, D.M. Effects of bed pressure drop on adsorption and desorption with Langmuir Isotherms. Chem. Eng. Sci. 1993, 17, 3001–3006. [Google Scholar] [CrossRef]
Figure 1. Experimental apparatus used in the present work.
Separations 10 00558 g001
Figure 2. Distribution of the solid particles used in the experiments.
Separations 10 00558 g002
Figure 3. Experimental and model breakthrough curve of carbon dioxide.
Separations 10 00558 g003
Figure 4. Nitrogen (a) and oxygen (b) model breakthrough curves.
Separations 10 00558 g004
Figure 5. Optimal parameters calculated via optimisation.
Separations 10 00558 g005aSeparations 10 00558 g005b
Figure 6. Linear driving force coefficients calculated.
Separations 10 00558 g006
Figure 7. Saturation loading (a) and affinity (b) calculated.
Separations 10 00558 g007
Figure 8. Temperature profile at the outlet section of the bed.
Separations 10 00558 g008
Figure 9. Time profiles of the species recovery.
Separations 10 00558 g009
Figure 10. Predicted isotherms for multi-species single-site adsorption of carbon dioxide (a), nitrogen (b) and oxygen (c).
Separations 10 00558 g010
Figure 11. Spatial and time profiles of gas-phase concentrations of carbon dioxide (a), nitrogen (b) and oxygen (c).
Separations 10 00558 g011
Figure 12. Spatial and time profiles of adsorbed phase concentrations of carbon dioxide (a), nitrogen (b) and oxygen (c).
Separations 10 00558 g012
Figure 13. Spatial temperature profiles at different times.
Separations 10 00558 g013
Figure 14. Adsorbent material selectivity for nitrogen (a) and oxygen (b).
Separations 10 00558 g014
Table 1. Assumptions and hypotheses of the model.
1.
The gas mixture follows the ideal gas equation of state
2.
The fluid through the bed is perfectly mixed along the radial direction and characterised by dispersion along the axial one
3.
Radial direction gradients of any property are neglected
4.
A linear driving force model describes the mass transport from the bulk of the fluid to the internal part of the particle
5.
Non-isothermal conditions
Table 2. Experimental plant devices.
1Compressor6Moisture Abatement System
2CO2 cylinder (Pyrossigeno®)7U-shaped manhole
3CO2 rotameter (ASA S.p.A.®)8Fluidisation column
43-way valve (Plasson®)9Computer
5MFC Air (Brooks Instruments®)10Composition Analyser (Madur®)
Table 3. Value of objective function and R2.
ParameterValue
fobj0.22
R20.9985
Table 4. Optimal parameters calculated and corresponding confidence intervals.
SpeciesParametersOptimal ValueConfidence IntervalsUnits
CO2KLDF0.7722±0.0641s−1
q s 0 10.358±0.0268mol·kg−1
χ 0.6372±0.0475-
b06.328 × 10−9±0.216 × 10⁻⁹Pa−1
Qads22017±65J·mol−1
N2KLDF0.8534±0.0424s−1
q s 0 3.4695±0.0419mol·kg−1
χ 0.01499±0.0033-
b01.535 × 10−5±0.236 × 10⁻⁵Pa−1
Qads1788±48J·mol−1
O2KLDF6.0846±0.9426s−1
q s 0 2.9904±0.5273mol·kg−1
χ 1.1707±0.0337-
b01.447 × 10−5±0.119 × 10⁻⁵Pa−1
Qads4819±21J·mol−1
Table 5. Comparison between model and experimental data taken from the literature.
SpeciesParameterConditionsThis WorkThe LiteratureRef.
CO2qsat, mol·kg−1298 K7.47.5[22]
298 K7.47.1[23]
308 K7.26.6[23]
318 K6.96.2[23]
328 K6.75.7[23]
273 K8.07.4[24]
323 K6.87.3[25]
343 K6.46.8[25]
N2q, mol·kg−1(303 K, 1 bar)0.910.63[26]
(298 K, 1 bar)0.530.40[27]
(323 K, 1 bar)0.490.23[27]
(323 K, 1 bar)0.420.11[27]
(298 K, 1 bar)0.530.38[28]
O2q, mol·kg−1(303 K, 1 bar)0.830.31[26]
Disclaimer/Publisher’s Note: The statements, opinions and data contained in all publications are solely those of the individual author(s) and contributor(s) and not of MDPI and/or the editor(s). MDPI and/or the editor(s) disclaim responsibility for any injury to people or property resulting from any ideas, methods, instructions or products referred to in the content.

