

Factors Influencing the Control of Diabetes Measured via Glycated Hemoglobin Concentrations in Adults with Type 1 Diabetes
 , , ,
, , ,  , and
, and 
Abstract
:1. Introduction
2. Materials and Methods
2.1. Participants and Study Design
- -
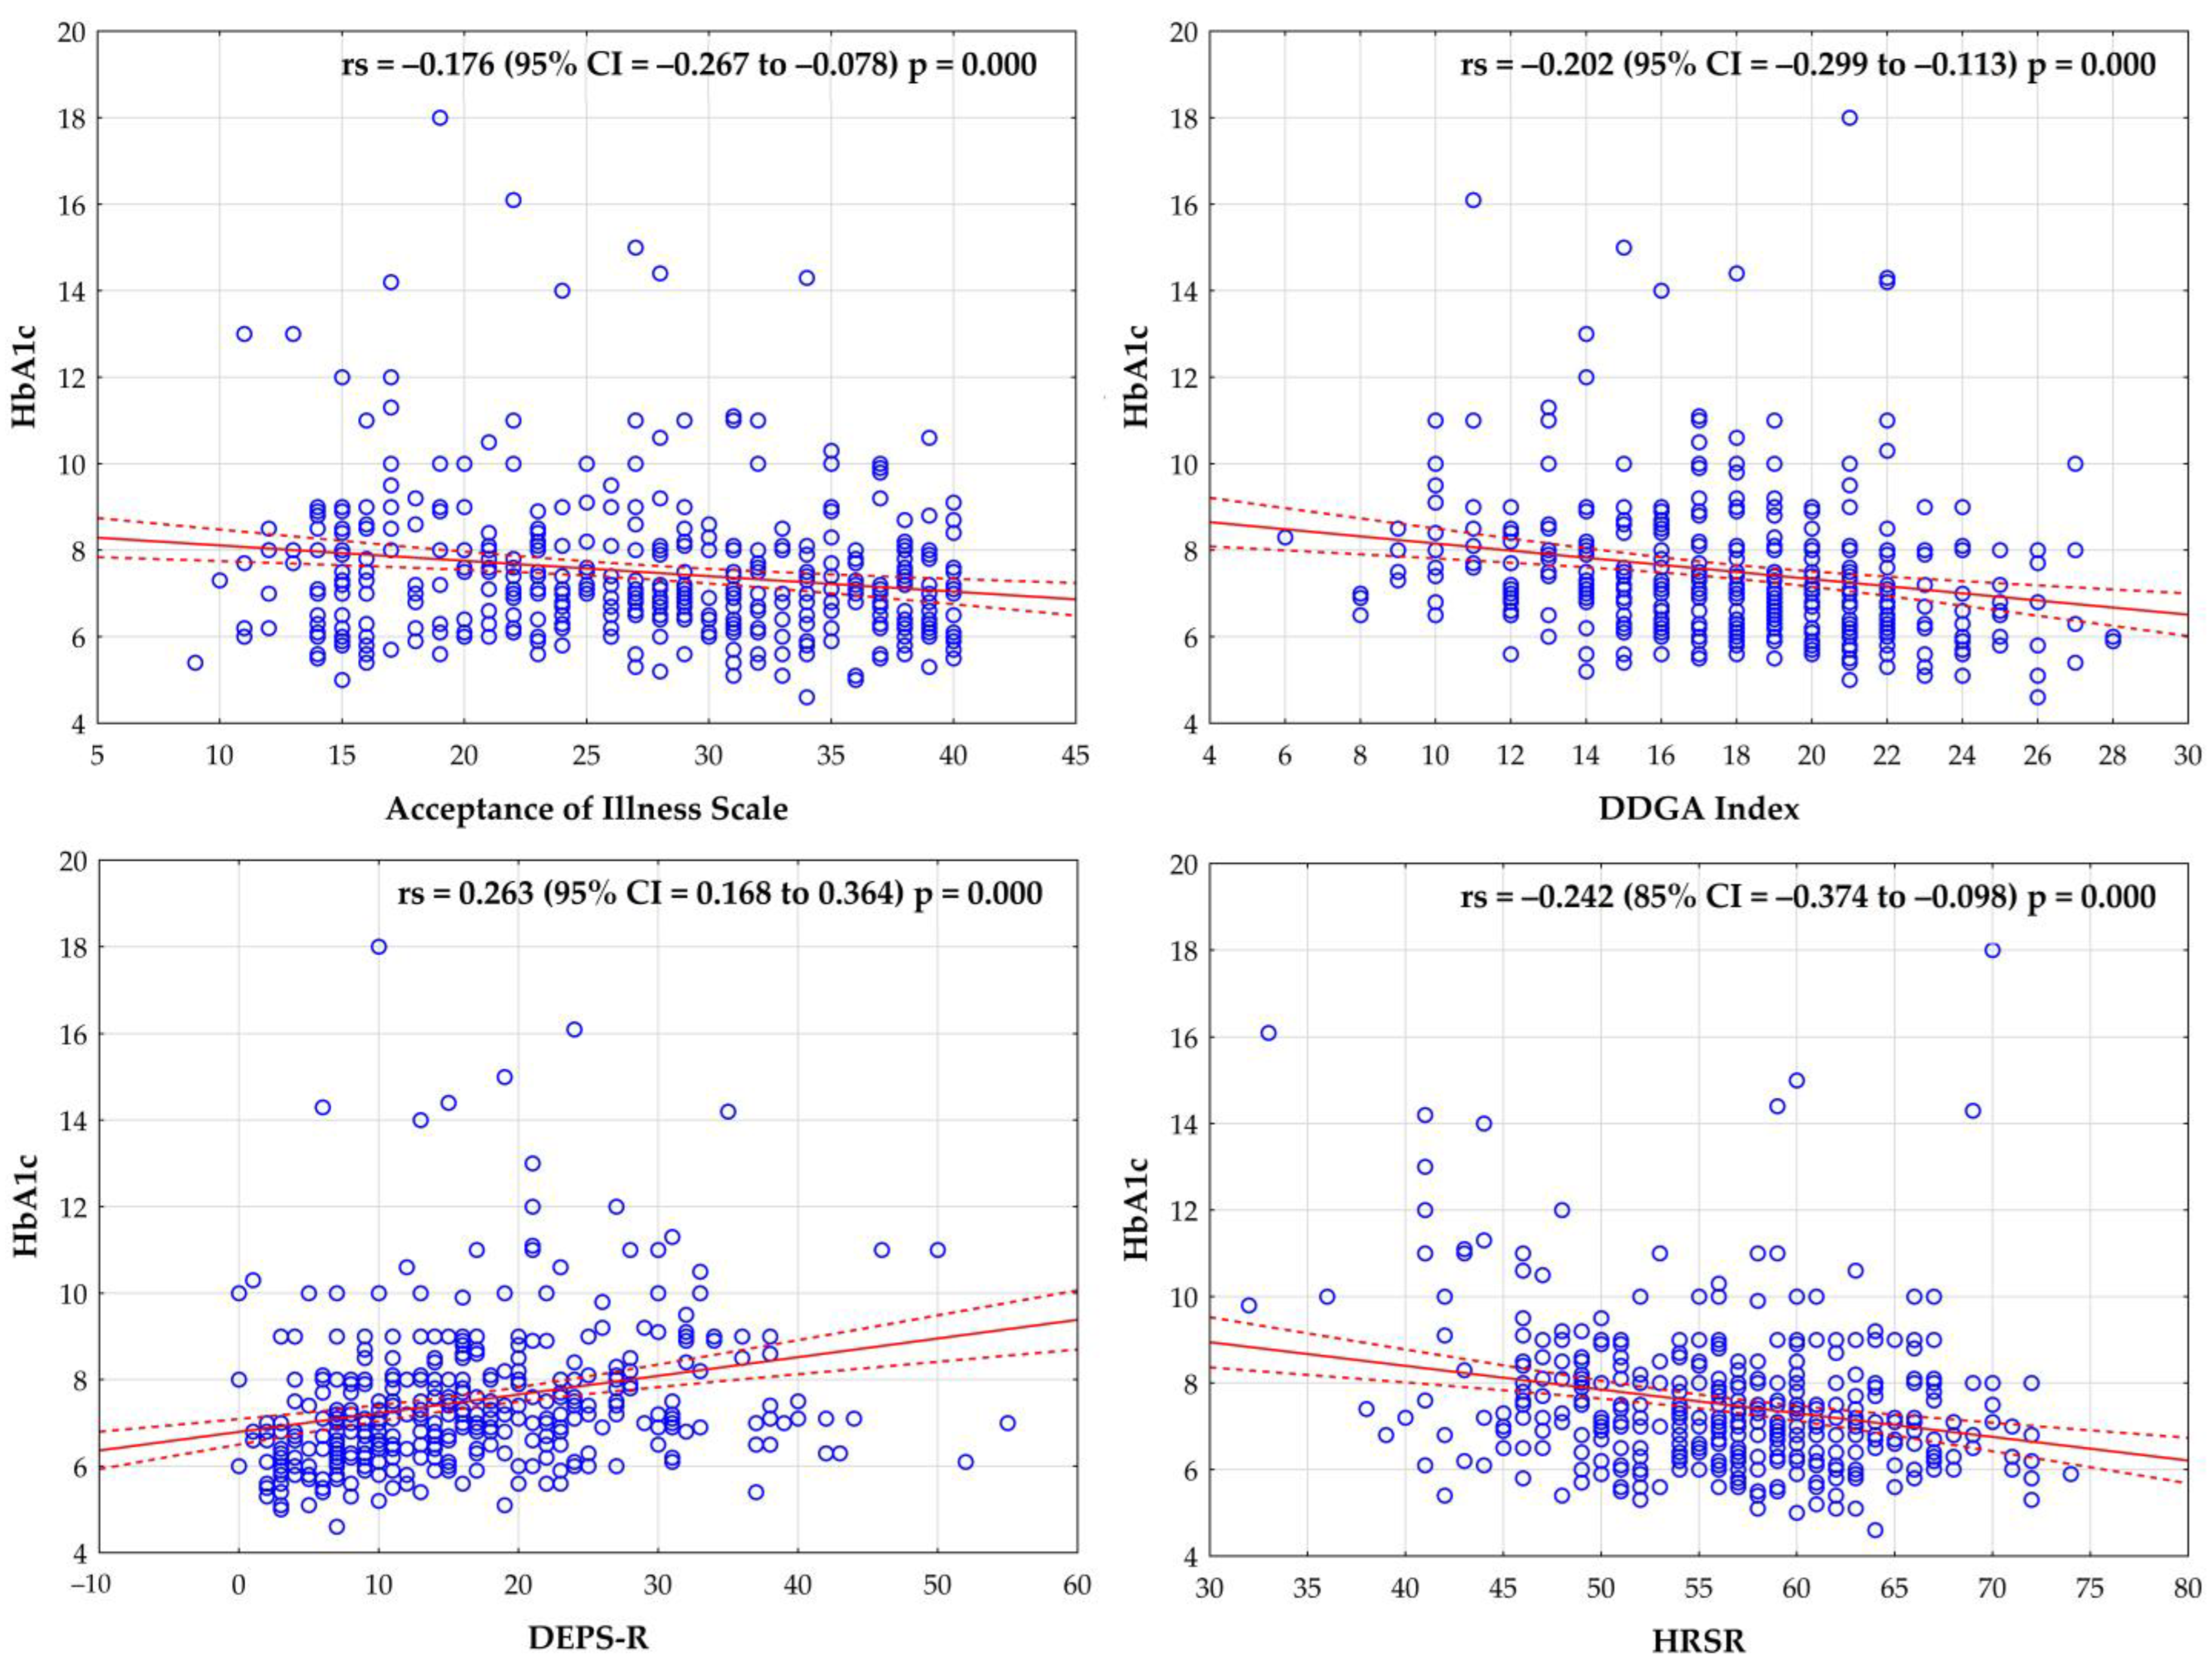
- Diabetes Dietary Guidelines Adherence Index (the DDGA Index): This index combines current recommendations concerning healthy eating for the population and the guidelines of behavioral therapy of the Polish Diabetes Association. The index takes account of the regular consumption of meals and the recommended frequency of the consumption of 29 groups of products. One point was scored if the frequency of the consumption of a specific group of products adhered to the recommendations, while 0 was scored in case of non-adherence. The DDGA Index value was expressed as the total score between 0 and 30 points. Higher DDGA Index values were interpreted as a higher degree of adherence to dietary recommendations (i.e., 0 points—complete lack of adherence to the recommendations; 30 points—complete adherence to the recommendations) [13].
- -
- The Acceptance of Illness Scale (AIS) as adapted by Jurczyński: This scale contains 8 statements describing the consequences of poor health regarding the recognition of limitations imposed by the disease, lack of self-sufficiency, a sense of dependence on other people, and lowered self-esteem. The answers were scored from “strongly agree”−1 to “strongly disagree”−5. The total, ranging from 8 to 40, is a general measure of the degree of acceptance of the disease, with low scores indicating poor adaptation to the disease, while high scores indicate acceptance of the disease. The greater the acceptance, the better the adaptation and the lower the sense of psychological discomfort [14].
- -
- The Diabetes Eating Problem Survey-Revised scale (DEPS-R): A diabetes-specific tool for screening eating disorders. The DEPS-R consists of 16 items, each containing 6 responses on a 6-point Likert scale. The overall DEPS-R score ranges from 0 to 80, so those with higher total DEPS-R scores are more likely to have an eating disorder. According to the original version of the DEPS-R, the total score equal to or above 20 was set as a threshold point indicating greater disturbances [15].
- -
- The Sense of Responsibility for Health Scale (HSRS), developed by Adamus: The scale consists of 12 items rated on a 5-point scale (1—hardly ever, 2—rarely, 3—sometimes, 4—often, 5—nearly always/very often). The HSRS allows for the determination of the total level of the sense of responsibility for one’s health (HSRS-T) and includes two subscale scores: Active Involvement (HSRS-AI) and Adequate Behaviour (HSRS-AB). Only the total level of responsibility for one’s health was assessed in the present study. This is due to the fact that the HSRS-AI and HSRS-AB subscores are correlated [16].
2.2. Ethics
2.3. Statistical Analysis
3. Results
4. Discussion
5. Conclusions
Author Contributions
Funding
Institutional Review Board Statement
Informed Consent Statement
Data Availability Statement
Conflicts of Interest
References
- Silva, J.A.D.; Souza, E.C.F.; Echazú Böschemeier, A.G.; Costa, C.C.M.D.; Bezerra, H.S.; Feitosa, E.E.L.C. Diagnosis of diabetes mellitus and living with a chronic condition: Participatory study. BMC Public Health 2018, 18, 699. [Google Scholar] [CrossRef]
- Xu, Y.; Wang, L.; He, J.; Bi, Y.; Li, M.; Wang, T.; Wang, L.; Jiang, Y.; Dai, M.; Lu, J.; et al. 2010 China Noncommunicable Disease Surveillance Group. Prevalence and control of diabetes in Chinese adults. JAMA 2013, 310, 48–59. [Google Scholar] [CrossRef]
- Andrade, C.S.; Ribeiro, G.S.; Santos, C.A.S.T.; Neves, R.C.S.; Moreira, E.D., Jr. Factors associated with high levels of glycated haemoglobin in patients with type 1 diabetes: A multicentre study in Brazil. BMJ Open 2017, 7, e018094. [Google Scholar] [CrossRef]
- Diaz-Valencia, P.A.; Bougnères, P.; Valleron, A.J. Global epidemiology of type 1 diabetes in young adults and adults: A systematic review. BMC Public Health 2015, 15, 255. [Google Scholar] [CrossRef] [PubMed]
- World Health Organization. Use of Glycated Haemoglobin (HbA1c) in the Diagnosis of Diabetes Mellitus: Abbreviated Report of a WHO Consultation; World Health Organization: Geneva, Switzerland, 2011. [Google Scholar]
- Shubrook, J.H., Jr. Risks and benefits of attaining HbA1c goals: Examining the evidence. J. Osteopath. Med. 2010, 110, 7–12. [Google Scholar]
- Araszkiewicz, A.; Bandurska-Stankiewicz, E.; Borys, S.; Budzyński, A.; Cyganek, K.; Cypryk, K.; Czech, A.; Czupryniak, L.; Drzewoski, J.; Dzida, G.; et al. 2023 Guidelines on the management of patients with diabetes. A position of Diabetes Poland. Curr. Top. Diabetes 2023, 3, 1–133. [Google Scholar] [CrossRef]
- Beck, R.W.; Tamborlane, W.V.; Bergenstal, R.M.; Miller, K.M.; DuBose, S.N.; Hall, C.A. T1D Exchange Clinic Network. The T1D Exchange clinic registry. J. Clin. Endocrinol. Metab. 2012, 97, 4383–4389. [Google Scholar] [CrossRef] [PubMed]
- Cheneke, W.; Suleman, S.; Yemane, T.; Abebe, G. Assessment of glycemic control using glycated hemoglobin among diabetic patients in Jimma University specialized hospital, Ethiopia. BMC Res. Notes 2016, 9, 96. [Google Scholar] [CrossRef] [PubMed]
- Surgenor, L.J.; Horn, J.; Hudson, S.M. Links between psychological sense of control and disturbed eating behavior in women with diabetes mellitus. Implications for predictors of metabolic control. J. Psychosom. Res. 2002, 52, 121–128. [Google Scholar] [CrossRef] [PubMed]
- Young-Hyman, D.; de Groot, M.; Hill-Briggs, F.; Gonzalez, J.S.; Hood, K.; Peyrot, M. Psychosocial Care for People with Diabetes: A Position Statement of the American Diabetes Association. Diabetes Care 2016, 39, 2126–2140. [Google Scholar] [CrossRef]
- Hagger, V.; Hendrieckx, C.; Sturt, J.; Skinner, T.C.; Speight, J. Diabetes Distress Among Adolescents with Type 1 Diabetes: A Systematic Review. Curr. Diabetes Rep. 2016, 16, 9. [Google Scholar] [CrossRef] [PubMed]
- Sińska, B.I.; Dłuzniak-Gołaska, K.; Jaworski, M.; Panczyk, M.; Duda-Zalewska, A.; Traczyk, I.; Religioni, U.; Kucharska, A. Undertaking Healthy Nutrition Behaviors by Patients with Type 1 Diabetes as an Important Element of Self-Care. Int. J. Environ. Res. Public Health 2022, 19, 13173. [Google Scholar] [CrossRef] [PubMed]
- Juczyński, Z. Narzędzia pomiaru w psychologii zdrowia. Przegląd Psychol. 1999, 42, 43–56. [Google Scholar]
- Markowitz, J.T.; Butler, D.A.; Volkening, L.K.; Antisdel, J.E.; Anderson, B.J.; Laffel, L.M. Brief screening tool for disordered eating in diabetes: Internal consistency and external validity in a contemporary sample of pediatric patients with type 1 diabetes. Diabetes Care 2010, 33, 495–500. [Google Scholar] [CrossRef]
- Jaworski, M.; Adamus, M.M. Health suggestibility, optimism and sense of responsibility for health in diabetic patients. Int. J. Diabetes Dev. Ctries 2016, 36, 290–294. [Google Scholar] [CrossRef]
- Paris, C.A.; Imperatore, G.; Klingensmith, G.; Petitti, D.; Rodriguez, B.; Anderson, A.M.; Schwartz, I.D.; Standiford, D.A.; Pihoker, C. Predictors of insulin regimens and impact on outcomes in youth with type 1 diabetes: The SEARCH for Diabetes in Youth study. J. Pediatr. 2009, 155, 183–189.e1. [Google Scholar] [CrossRef]
- Pfützner, A.; Weissmann, J.; Mougiakakou, S.; Daskalaki, E.; Weis, N.; Ziegler, R. Glycemic Variability Is Associated with Frequency of Blood Glucose Testing and Bolus: Post Hoc Analysis Results from the ProAct Study. Diabetes Technol. Ther. 2015, 17, 392–397. [Google Scholar] [CrossRef] [PubMed]
- Davison, K.A.; Negrato, C.A.; Cobas, R.; Matheus, A.; Tannus, L.; Palma, C.S.; Japiassu, L.; Carneiro, J.R.; Rodacki, M.; Zajdenverg, L.; et al. Relationship between adherence to diet, glycemic control and cardiovascular risk factors in patients with type 1 diabetes: A nationwide survey in Brazil. Nutr. J. 2014, 13, 19. [Google Scholar] [CrossRef]
- Xing, X.Y.; Wang, X.Y.; Fang, X.; Xu, J.Q.; Chen, Y.J.; Xu, W.; Wang, H.D.; Liu, Z.R.; Tao, S.S. Glycemic control and its influencing factors in type 2 diabetes patients in Anhui, China. Front Public Health. 2022, 10, 980966. [Google Scholar] [CrossRef] [PubMed]
- Duarte, F.G.; da Silva Moreira, S.; Almeida, M.D.C.C.; de Souza Teles, C.A.; Andrade, C.S.; Reingold, A.L.; Moreira, E.D., Jr. Sex differences and correlates of poor glycaemic control in type 2 diabetes: A cross-sectional study in Brazil and Venezuela. BMJ Open 2019, 9, e023401. [Google Scholar] [CrossRef]
- Bitew, Z.W.; Alemu, A.; Jember, D.A.; Tadesse, E.; Getaneh, F.B.; Sied, A.; Weldeyonnes, M. Prevalence of Glycemic Control and Factors Associated with Poor Glycemic Control: A Systematic Review and Meta-analysis. Inquiry 2023, 60, 469580231155716. [Google Scholar] [CrossRef]
- Kobo, O.; Van Spall, H.G.C.; Mamas, M.A. Urban-rural disparities in diabetes-related mortality in the USA 1999–2019. Diabetologia 2022, 65, 2078–2083. [Google Scholar] [CrossRef]
- McAlexander, T.P.; Malla, G.; Uddin, J.; Lee, D.C.; Schwartz, B.S.; Rolka, D.B.; Siegel, K.R.; Kanchi, R.; Pollak, J.; Andes, L.; et al. Urban and rural differences in new onset type 2 diabetes: Comparisons across national and regional samples in the diabetes LEAD network. SSM Popul. Health 2022, 19, 101161. [Google Scholar] [CrossRef]
- Flood, D.; Geldsetzer, P.; Agoudavi, K.; Aryal, K.K.; Brant, L.C.C.; Brian, G.; Dorobantu, M.; Farzadfar, F.; Gheorghe-Fronea, O.; Gurung, M.S.; et al. Rural-Urban Differences in Diabetes Care and Control in 42 Low- and Middle-Income Countries: A Cross-sectional Study of Nationally Representative Individual-Level Data. Diabetes Care 2022, 45, 1961–1970. [Google Scholar] [CrossRef] [PubMed]
- Dugani, S.B.; Wood-Wentz, C.M.; Mielke, M.M.; Bailey, K.R.; Vella, A. Assessment of Disparities in Diabetes Mortality in Adults in US Rural vs Nonrural Counties, 1999–2018. JAMA Netw. Open 2022, 5, e2232318. [Google Scholar] [CrossRef] [PubMed]
- Slåtsve, K.B.; Claudi, T.; Lappegård, K.T.; Jenum, A.K.; Larsen, M.; Nøkleby, K.; Tibballs, K.; Cooper, J.G.; Sandberg, S.; Buhl, E.S.; et al. Level of education is associated with coronary heart disease and chronic kidney disease in individuals with type 2 diabetes: A population-based study. BMJ Open Diabetes Res. Care 2022, 10, e002867. [Google Scholar] [CrossRef]
- Allen, K.; McFarland, M. How Are Income and Education Related to the Prevention and Management of Diabetes? J. Aging Health 2020, 32, 1063–1074. [Google Scholar] [CrossRef]
- Sharma, P.K.; Rajpal, N.; Upadhyay, S.; Shaha, D.; Deo, N. Status of diabetes control and knowledge about diabetes in patients. Endocrinol. Diabetes Nutr. 2021, 68, 716–727. [Google Scholar] [CrossRef] [PubMed]
- Dahlström, E.H.; Sandholm, N.; Forsblom, C.M.; Thorn, L.M.; Jansson, F.J.; Harjutsalo, V.; Groop, P.H. Body Mass Index and Mortality in Individuals with Type 1 Diabetes. J. Clin. Endocrinol. Metab. 2019, 104, 5195–5204. [Google Scholar] [CrossRef]
- Badura-Brzoza, K.; Główczyński, P.; Piegza, M.; Błachut, M.; Sedlaczek, K.; Nabrdalik, K.; Gumprecht, J.; Gorczyca, P. Acceptance of the disease and quality of life in patients with type 1 and type 2 diabetes. Eur. J. Psychiatry 2022, 36, 114–119. [Google Scholar] [CrossRef]
- Bonikowska, I.; Szwamel, K.; Uchmanowicz, I. Analysis of the Impact of Disease Acceptance, Demographic, and Clinical Variables on Adherence to Treatment Recommendations in Elderly Type 2 Diabetes Mellitus Patients. Int. J. Environ. Res. Public Health 2021, 18, 8658. [Google Scholar] [CrossRef] [PubMed]
- Krzemińska, S.; Kostka, A. Influence of Pain on the Quality of Life and Disease Acceptance in Patients with Complicated Diabetic Foot Syndrome. Diabetes Metab. Syndr. Obes. 2021, 14, 1295–1303. [Google Scholar] [CrossRef] [PubMed]
- Lewko, J.; Kochanowicz, J.; Zarzycki, W.; Mariak, Z.; Górska, M.; Krajewska-Kulak, E. Poor hand function in diabetics. Its causes and effects on the quality of life. Saudi Med. J. 2012, 33, 429–435. [Google Scholar]
- Schmitt, A.; Reimer, A.; Kulzer, B.; Icks, A.; Paust, R.; Roelver, K.M.; Kaltheuner, M.; Ehrmann, D.; Krichbaum, M.; Haak, T.; et al. Measurement of psychological adjustment to diabetes with the diabetes acceptance scale. J. Diabetes Complicat. 2018, 32, 384–392. [Google Scholar] [CrossRef]
- Graham, C.D.; Gouick, J.; Krahé, C.; Gillanders, D. A systematic review of the use of Acceptance and Commitment Therapy (ACT) in chronic disease and long-term conditions. Clin. Psychol. Rev. 2016, 46, 46–58. [Google Scholar] [CrossRef]
- Bertolin, D.C.; Pace, A.M.; Cesarino, C.B.; Ribeiro, R.C.; Ribeiro, R.M. Psychological adaptation to and acceptance of type 2 diabetes mellitus. Acta Paul. Enferm. 2015, 28, 440–446. [Google Scholar] [CrossRef]
- Rovner, A.J.; Nansel, T.R.; Mehta, S.N.; Higgins, L.A.; Haynie, D.L.; Laffel, L.M. Development and validation of the type 1 diabetes nutrition knowledge survey. Diabetes Care 2012, 35, 1643–1647. [Google Scholar] [CrossRef] [PubMed]
- Franz, M.J.; MacLeod, J.; Evert, A.; Brown, C.; Gradwell, E.; Handu, D.; Reppert, A.; Robinson, M. Academy of Nutrition and Dietetics Nutrition Practice Guideline for Type 1 and Type 2 Diabetes in Adults: Systematic Review of Evidence for Medical Nutrition Therapy Effectiveness and Recommendations for Integration into the Nutrition Care Process. J. Acad. Nutr. Diet. 2017, 117, 1659–1679. [Google Scholar] [CrossRef]
- Coleman, S.E.; Caswell, N. Diabetes and eating disorders: An exploration of ‘Diabulimia’. BMC Psychol. 2020, 8, 101. [Google Scholar] [CrossRef] [PubMed]
- Eisenberg Colman, M.H.; Quick, V.M.; Lipsky, L.M.; Dempster, K.W.; Liu, A.; Laffel, L.M.B.; Mehta, S.N.; Nansel, T.R. Disordered Eating Behaviors Are Not Increased by an Intervention to Improve Diet Quality but Are Associated With Poorer Glycemic Control Among Youth With Type 1 Diabetes. Diabetes Care 2018, 41, 869–875. [Google Scholar] [CrossRef] [PubMed]
- Cezar, P.; Gonçalves, R.R.; Schainberg, A.; Comim, F.V.; Oliveira, S.C. Higher score of diabetes eating problem survey-revised (DEPS-R) is associated with poor glycemic control among Brazilian patients with type 1 diabetes (T1DM): A brief report. Diabetes Metab. Syndr. 2022, 16, 102570. [Google Scholar] [CrossRef] [PubMed]
- Nip, A.S.Y.; Reboussin, B.A.; Dabelea, D.; Bellatorre, A.; Mayer-Davis, E.J.; Kahkoska, A.R.; Lawrence, J.M.; Peterson, C.M.; Dolan, L.; Pihoker, C.; et al. Disordered Eating Behaviors in Youth and Young Adults with Type 1 or Type 2 Diabetes Receiving Insulin Therapy: The SEARCH for Diabetes in Youth Study. Diabetes Care 2019, 42, 859–866. [Google Scholar] [CrossRef]
- Mehta, S.N.; Volkening, L.K.; Anderson, B.J.; Nansel, T.; Weissberg-Benchell, J.; Wysocki, T.; Laffel, L.M.; Family Management of Childhood Diabetes Study Steering Committee. Dietary behaviors predict glycemic control in youth with type 1 diabetes. Diabetes Care 2008, 31, 1318–1320. [Google Scholar] [CrossRef] [PubMed]
- Pursey, K.M.; Hart, M.; Jenkins, L.; McEvoy, M.; Smart, C.E. Screening and identification of disordered eating in people with type 1 diabetes: A systematic review. J. Diabetes Complicat. 2020, 34, 107522. [Google Scholar] [CrossRef] [PubMed]


| Variables | HbA1c ≤ 7% (n = 189) | HbA1c > 7% (n = 228) | Total (n = 417) | p-Value |
|---|---|---|---|---|
| Age—n (%) | ||||
| 19–30 years | 89 (43.0) | 118 (57.0) | 207 (49.6) | 0.615 |
| 31–50 years | 85 (48.0) | 92 (51.9) | 177 (42.5) | |
| >50 years | 15 (45.5) | 18 (54.6) | 33 (7.91) | |
| Gender—n (%) | ||||
| Female | 118 (50.2) | 117 (49.8) | 235 (56.4) | 0.023 |
| Male | 71 (39.0) | 111 (60.9) | 182 (43.6) | |
| Place of residence—n (%) | ||||
| Rural area | 35 (35.7) | 63 (64.3) | 98 (23.5) | 0.029 |
| Urban area | 154 (48.3) | 165 (51.7) | 319 (76.5) | |
| Education—n (%) | ||||
| Primary/vocational | 9 (24.3) | 28 (75.7) | 37 (8.8) | 0.001 |
| Secondary | 69 (40.1) | 103 (59.9) | 172 (41.3) | |
| Tertiary | 111 (53.4) | 97 (46.6) | 208 (49.9) | |
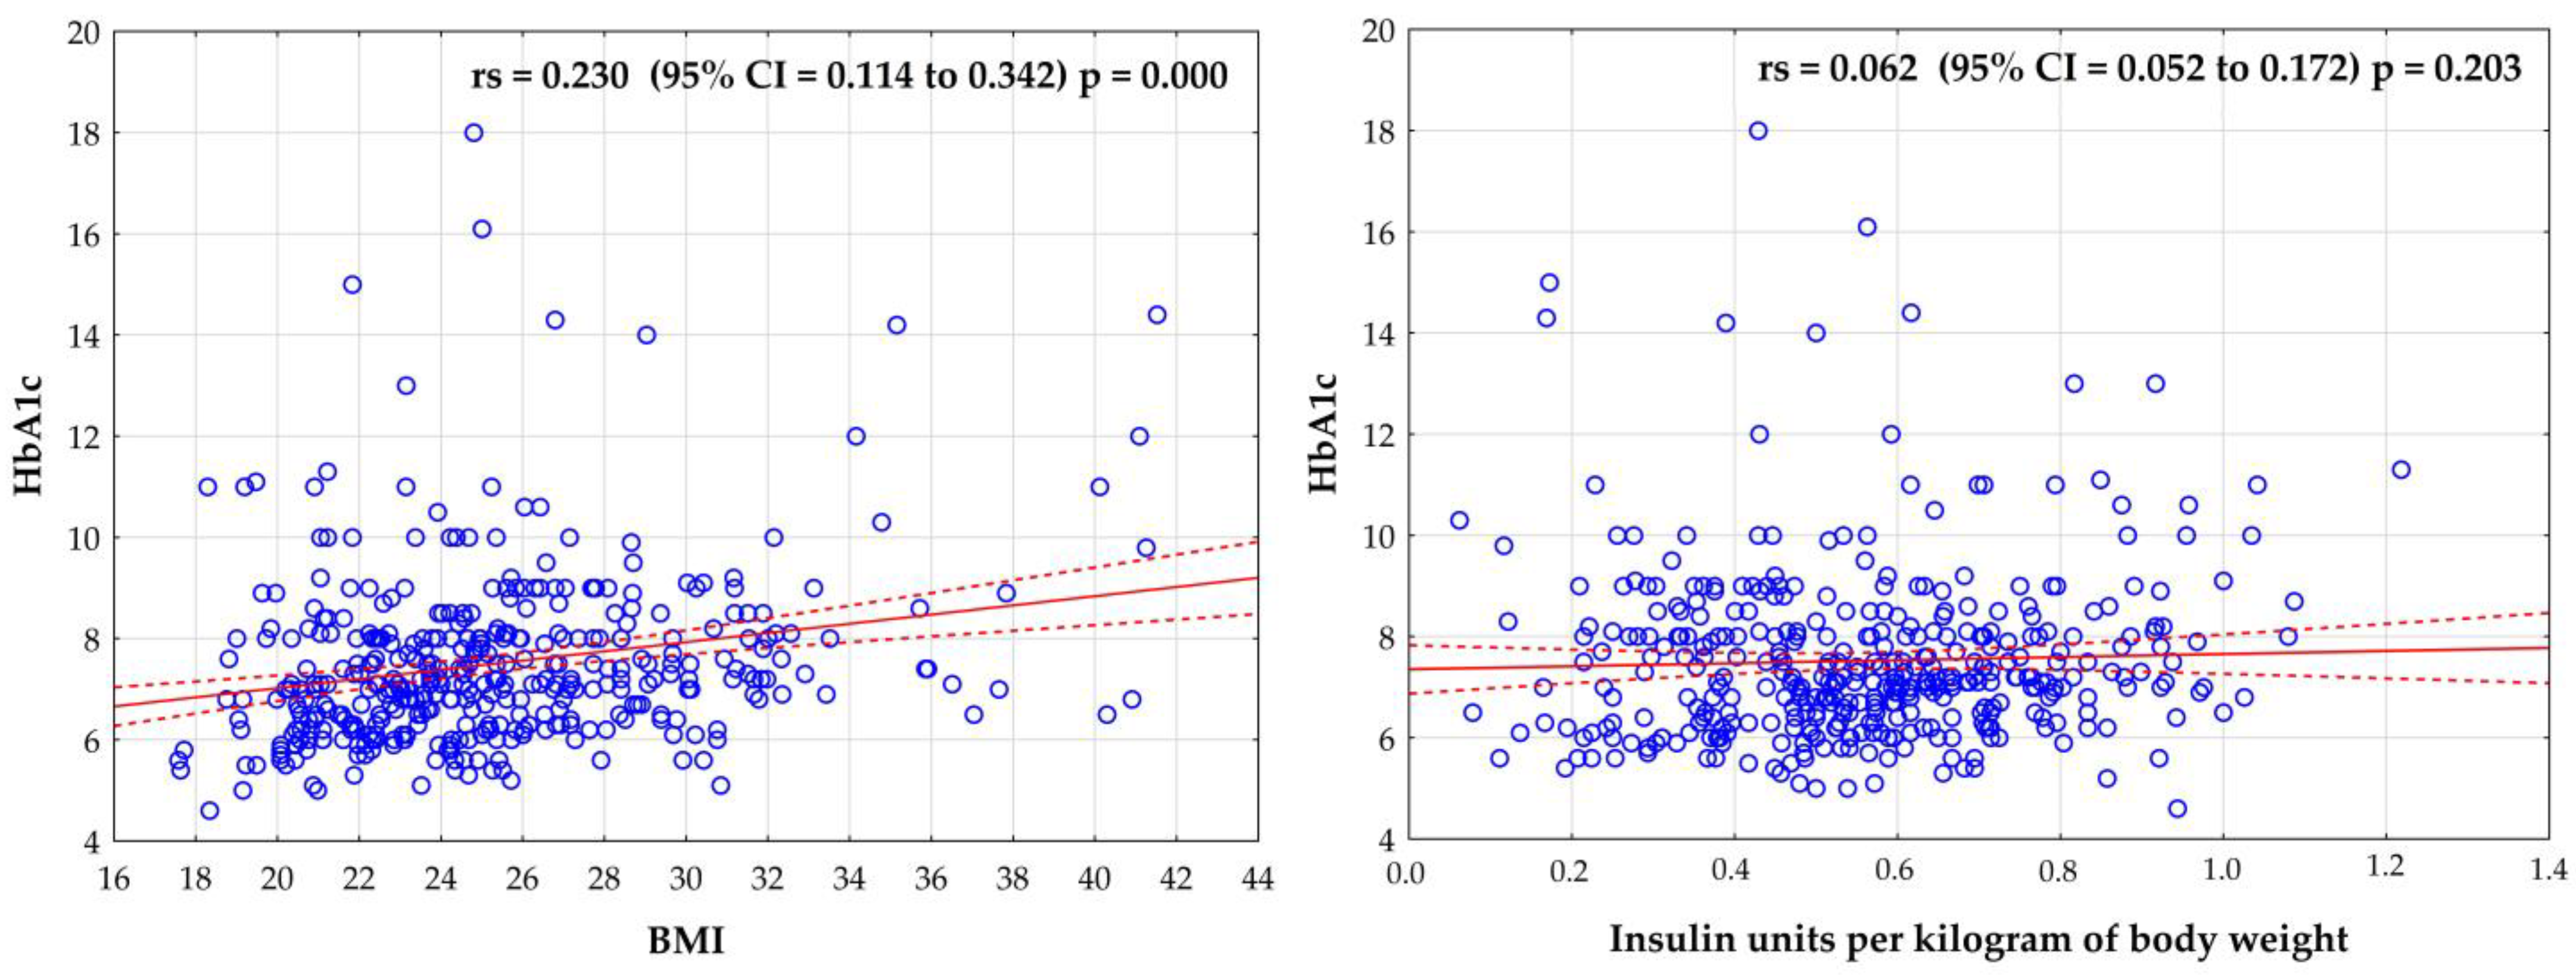
| BMI—M ± SD | 24.3 ± 3.9 | 26.2 ± 4.3 | 25.3 ± 4.3 | <0.001 |
| Variables | HbA1c ≤ 7% (n = 189) | HbA1c > 7% (n = 228) | Total (n = 417) | p-Value |
|---|---|---|---|---|
| Acceptance of Illness Scale—M ± (SD) | 28.4 ± 8.2 | 26.1 ± 8.5 | 27.2 ± 8.4 | 0.004 |
| DDGA Index—M ± (SD) | 18.9 ± 4.2 | 17.14 ± 3.9 | 17.9 ± 4.1 | <0.001 |
| DEPS-R Scale—M ± (SD) | 13.2 ± 10.3 | 19.01 ± 9.7 | 16.4 ± 10.4 | <0.001 |
| HRSR—M ± (SD) | 57.7 ± 6.8 | 55.18 ± 7.8 | 56.3 ± 7.5 | 0.001 |
| Insulin units per kilogram of body weight per day—M ± (SD) | 0.54 ± 0.2 | 0.58 ± 0.2 | 0.56 ± 0.2 | 0.046 |
| Duration of diabetes (years)—M ± (SD) | 18.7 ± 9.50 | 18.8 ± 8.8 | 18.8 ± 9.1 | 0.629 |
| Type of insulin therapy—n (%) | ||||
| Pens | 98 (44.8) | 121 (55.3) | 219 (52.5) | 0.804 |
| Insulin pumps | 91 (45.9) | 107 (54.0) | 198 (47.5) | |
| Hypoglycemic episodes—n (%) | ||||
| Every day | 12 (57.1) | 9 (42.9) | 21 (5.04) | 0.268 |
| 3 and more times a week | 85 (41.7) | 119 (58.3) | 204 (48.9) | |
| 1–2 times a week | 62 (50.8) | 60 (49.2) | 122 (29.3) | |
| Never | 30 (42.9) | 40 (57.1) | 70 (16.8) | |
| Hyperglycemic episodes—n (%) | ||||
| Every day | 22 (29.7) | 52 (70.3) | 74 (17.8) | 0.002 |
| 3 and more times a week | 74 (42.3) | 101 (57.7) | 175 (41.9) | |
| 1–2 times a week | 69 (56.1) | 54 (43.9) | 123 (29.5) | |
| Never | 24 (53.3) | 21 (46.7) | 45 (10.8) | |
| Knowing the calorie value of one’s diet—n (%) | ||||
| Yes | 98 (51.3) | 93 (48.7) | 191 (45.8) | 0.024 |
| No | 91 (40.3) | 135 (59.7) | 226 (54.2) | |
| Univariate Logistic Regression | Multivariate Logistic Regression | |||||
|---|---|---|---|---|---|---|
| Variable | Orc | 95% CI | p-Value | Ora | 95% CI | p-Value |
| Sex (Female) | 1.58 | 1.07–2.34 | 0.023 | - | - | - |
| Place of residence (Urban area) | 1.68 | 1.05–2.68 | 0.030 | - | - | - |
| Education (Tertiary) | 1.37 | 1.13–1.66 | 0.001 | - | - | - |
| BMI | 0.89 | 0.84–0.94 | <0.001 | 0.92 | 0.87–0.97 | 0.004 |
| Acceptance of Illness Scale | 1.49 | 1.14–1.96 | 0.004 | 1.03 | 1.00–1.06 | 0.026 |
| DDGA Index | 1.11 | 1.06–1.17 | <0.001 | 1.08 | 1.02–1.14 | 0.008 |
| DEPS-R | 0.94 | 0.92–0.96 | <0.001 | 0.96 | 0.94–0.99 | 0.001 |
| HSRS | 1.05 | 1.02–1.08 | 0.001 | - | - | - |
| Insulin units per kg BW | 0.29 | 0.12–0.74 | 0.009 | - | - | - |
| Hyperglycemic episodes | 0.85 | 0.68–1.05 | 0.132 | - | - | - |
| Knowing the calorie value of one’s diet | 1.56 | 1.05–2.31 | 0.024 | - | - | - |
Disclaimer/Publisher’s Note: The statements, opinions and data contained in all publications are solely those of the individual author(s) and contributor(s) and not of MDPI and/or the editor(s). MDPI and/or the editor(s) disclaim responsibility for any injury to people or property resulting from any ideas, methods, instructions or products referred to in the content. |
© 2023 by the authors. Licensee MDPI, Basel, Switzerland. This article is an open access article distributed under the terms and conditions of the Creative Commons Attribution (CC BY) license (https://creativecommons.org/licenses/by/4.0/).
Share and Cite
Sińska, B.I.; Rzońca, E.; Kucharska, A.; Gałązkowski, R.; Traczyk, I.; Rzońca, P. Factors Influencing the Control of Diabetes Measured via Glycated Hemoglobin Concentrations in Adults with Type 1 Diabetes. Eur. J. Investig. Health Psychol. Educ. 2023, 13, 2035-2045. https://doi.org/10.3390/ejihpe13100144
Sińska BI, Rzońca E, Kucharska A, Gałązkowski R, Traczyk I, Rzońca P. Factors Influencing the Control of Diabetes Measured via Glycated Hemoglobin Concentrations in Adults with Type 1 Diabetes. European Journal of Investigation in Health, Psychology and Education. 2023; 13(10):2035-2045. https://doi.org/10.3390/ejihpe13100144
Chicago/Turabian StyleSińska, Beata I., Ewa Rzońca, Alicja Kucharska, Robert Gałązkowski, Iwona Traczyk, and Patryk Rzońca. 2023. "Factors Influencing the Control of Diabetes Measured via Glycated Hemoglobin Concentrations in Adults with Type 1 Diabetes" European Journal of Investigation in Health, Psychology and Education 13, no. 10: 2035-2045. https://doi.org/10.3390/ejihpe13100144