Article

Analysis of Channel Vortex and Cavitation Performance of the Francis Turbine under Partial Flow Conditions

1
Department of Engineering Mechanics, Faculty of Civil Engineering and Mechanics, Kunming University of Science and Technology, Kunming 650500, China
2
Department of Energy and Power Engineering, Kunming University of Science and Technology, Kunming 650093, China
*
Authors to whom correspondence should be addressed.
Processes 2021, 9(8), 1385; https://doi.org/10.3390/pr9081385
Submission received: 17 July 2021 / Revised: 5 August 2021 / Accepted: 6 August 2021 / Published: 9 August 2021

Abstract

:
To realize a multienergy complementary system involving hydropower and other energy sources, hydraulic turbines frequently run under partial flow conditions in which a unique flow phenomenon, the channel vortex, occurs in the runner, causing fatigue failure and even cavitation to the turbine blade. Cavitation severely shortens the service life of the unit and terribly limits the output of the turbine under partial flow conditions. In this paper, a numerical model of a Francis turbine was created with tetrahedral grids; the large eddy simulation (LES) method based on the WALE subgrid scale model and the Schnerr–Sauer cavitation model was adopted to carry out numerical simulation of the Francis turbine; and a vortex identification method based on the Q criterion was used to capture and analyze the channel vortex. The calculation results showed that a negative impact angle at the inlet of the runner occurred when the turbine ran under partial flow conditions, leading to three different types of channel vortexes in the blade channel. Also, different channel vortexes caused cavitation on different positions on the runner, and the volume change of cavitation showed periodic properties.

1. Introduction

Hydropower, as the most widely-used renewable resource, has always been a major concern for the world. The total global installed hydropower capacity had reached 1308 GW in 2019, and the generating capacity had reached 4306 TWh, according to the 2020 Hydropower Status Report released by the International Hydropower Association in 2020. Also, statistics show that the installed capacity of Francis turbines accounts for more than 60% of all installed capacity of hydropower, making it the most popular hydropower turbine at present [1] and therefore of high research value. In recent years, the multienergy complementary power supply system has been advocated to realize the multienergy complementarity of hydropower and other energy resources [2,3], requiring hydraulic turbines to be frequently operated under partial flow conditions [4,5]. However, the fluid structure of the hydraulic turbine is so complicated under partial flow conditions that it often leads to unstable operation problems such as channel vortexes, flow-induced vibration of the blades, cavitation, and cavitation erosion inside the turbine [6,7]. These problems not only reduce the efficiency of the turbine but also damage its flow components [8]. Certain studies have shown that when a turbine runs under partial flow conditions, outflow and backflow occur in the blade channel, and then channel vortexes are formed; turbulent backflow causes unstable channel vortexes and even serious vibration and cavitation in the blade passage [9]. Channel vortexes do not necessarily lead to cavitation, but a close relationship exists between these two phenomena [10,11].
Many scholars have carried out studies on channel vortexes and cavitation inside the Francis turbine. Guo Tao et al. [12] studied the evolution of the channel vortex under part-load conditions using the large eddy simulation (LES) method based on the Vreman subgrid-scale stress model, and the results they gained showed that the instability and rupture of the channel vortex increases the pressure fluctuation of the blades. K. Yamamoto et al. [13,14,15,16] used visualization PIV technology to conduct experimental observations on a channel vortex, analyze its development mechanism, and estimated its generation area. Guo Pengcheng et al. [17,18,19] carried out experiments with numerical models on Francis turbines to analyze the development mechanism of channel vortices and made a comparative analysis of the shapes of cavitation vortices inside the channel by using said models in experiments. Liu [20,21,22,23] et al. used a high-speed camera to capture the channel vortex phenomenon during a test and found that the channel vortex occurs due to the influence of the attack angle at the blade inlet. Su Wentao et al. [24] carried out numerical simulations and tests on a Francis turbine, which verified the feasibility and accuracy of the LES method based on a cavitation model in predicting the performance of Francis turbines under partial flow conditions, while Trivedi Chirag et al. [25,26] used the LES method to simulate the load change of a Francis turbine and compared the results with experimental data. Trivedi Chirag [27] took the extreme operating conditions of the turbine into consideration, and he found that the cavitation phenomenon in hydraulic turbine gradually disappeared with the increase of rotation speed; however, when running at high rotating speed, the intensity of cavitation reached its maximum. Sun Longgan et al. [28] found that the position of channel vortexes in Francis turbines shows a clearer correlation to rotating speed than that to guide vane opening. Finally, Shi Guang-tai et al. [29] found that the cavitation on the blade surface of Francis turbine under BEP conditions is only subtly affected by the water head, but with the increase of the guide vane opening, cavitation on the blade surface is more likely to occur.
Because of the complicated internal flow field of the Francis turbine under partial flow conditions and the flow interference between runner components and stationary components, it is relatively difficult to analyze the whole flow passage. Additionally, the mechanism of cavitation along with the flow characteristics of channel vortexes and within Francis turbines are still unclear. Therefore, to further analyze the relationship between channel vortexes and cavitation in Francis turbines, a three-dimensional numerical calculation of the whole flow passage of a Francis turbine under partial flow conditions was carried out based on a cavitation model and the large eddy simulation (LES) method in this paper, and the shape and evolution of the channel vortex and the temporal and spatial evolution of the cavitation in the channel were analyzed by capturing relevant statistics. Finally, the relationship between channel vortexes, cavitation, and the generation mechanism of channel vortexes in Francis turbines under partial flow conditions was elaborated.

2. Mathematical Formulations and Numerical Method

2.1. LES Method

The LES method was first proposed by Smagorinsky in 1963. It aims to solve the large-scale eddy structure directly and to close the small-scale eddy structure. In addition to the LES method, the direct numerical simulation (DNS) method and Reynolds average Navier–Stokes (RANS) method are commonly used in this field. The former directly solves the minimum scale flow, so the information obtained thereby shows better comprehensiveness and accuracy. However, while the results obtained by DNS are more accurate, the computation required to distinguish small-scale flows is infeasible. Meanwhile, the RANS method only solves large-scale flow, which is equivalent to the wall scale, and flows of other scales are replaced by models, thus greatly reducing the computational complexity at the cost of losing many flow field details. Also, this model depends on the boundary conditions. Therefore, to some degree, LES is a compromise solution between DNS and RANS. The small-scale vortex was separated from the large-scale vortex by box filter in this paper, and the flows were divided into low-frequency unsolvable parts and high-frequency unsolvable parts. Then, the subgrid scale model was established to simulate the high-frequency unsolvable parts. The LES method was adopted to solve turbulence in this paper, which use has been widely verified [30,31,32,33].

2.2. WALE Subgrid Scale Model

Commonly used subgrid scale models include the Smagorinsky–Lilly model, Wall-adapting Local Eddy-viscosity model (WALE), Vreman model, and so on. Among them, the WALE model, which was put forward by Nicoud et al. [34] in 1999, is based on the square of the velocity gradient tensor, which takes not only the deformation rate tensor but also the influence of the rotation tensor into consideration. Additionally, this model can obtain better vortex viscosity without a dynamic model when certain fluid is close to the wall. Studies have shown that the WALE subgrid scale model has good accuracy in describing the overall characteristics and details of the flow field [35,36], and can well predict the typical laminar–turbulent transition of the boundary layer. Therefore, the eddy viscosity was defined by the WALE subgrid scale model in this paper:
μ t = ρ Δ S 2 ( S ij d S ij d ) 3 / 2 ( S i j ¯ S i j ¯ ) 5 / 2 + ( S ij d S ij d ) 5 / 4
S ij d = 1 2 ( g ¯ ij 2 + g ¯ ji 2 ) 1 3 δ ij g ¯ kk 2 ,   g ¯ ij = u i ¯ x j ¯
In this equation, the filter size Δs is calculated by Δs = CwV1/3; Cw, the model parameter, is of fixed value; and, in most cases, Cw = 0.325.

2.3. Schnerr–Sauer Cavitation Model

The generation and collapse processes of cavitation can be described by the Rayleigh–Plesset equation [37,38]. One of the most commonly used cavitation models at present, the Schnerr–Sauer cavitation model, was proposed based on the Rayleigh–Plesset equation. The Schnerr–Sauer cavitation model regards the mixture of water and steam as a mixture containing a large number of spherical steam bubbles. Therefore, starting from the expression of net mass source term, the volume fraction was calculated, and the phase transition rate was obtained is as follows:
R e = 3 ρ v ρ l ρ m α v ( 1 α v ) R B 2 ( p v p ) 3 ρ l ; p p v
R c = 3 ρ v ρ l ρ m α v ( 1 α v ) R B 2 ( p p v ) 3 ρ l ; p p v
R B = ( 3 α v 4 π n 0 ( 1 α v ) ) 1 3
R = R e R c
In these equations, Re is the mass transfers during the growth of the cavitation bubble; Rc is the mass transfers during the collapse of the cavitation bubble; RB is the bubble radius (m); n0 is the number of bubbles per unit volume of liquid; ρm is the density of mixed medium (kg/m3); ρv is the vapor density (kg/m3); ρl is the liquid density (kg/m3); p is the bubble local pressure of the fluid (Pa); pv is the bubble surface pressure of the fluid (Pa); and αv is the vapor volume fraction.
The Schnerr–Sauer model has been validated by many studies [39,40].

2.4. Numerical Examples and Boundary Conditions

The HLA551-LJ-43 Francis turbine was taken as the research object for this paper, and its calculation domain is shown in Figure 1. The runner diameter of the turbine was 0.43 m, the number of movable guide vanes was 16, the number of stay vanes was 8, the number of runner blades was 13, and the working head was 60 m.
This study used ANSYS FLUENT commercial software for the unsteady-state analyses of the Francis turbine’s incompressible internal flow field, the ANSYS FLUENT is an Unstructured Solver. Unstructured tetrahedral grids show sound geometric adaptability to complex geometry, and the geometry of the internal flow passage of the turbine is rather complicated, so the whole flow passage of the turbine is divided by Unstructured tetrahedral grids. The number of grids exerts a great influence on the calculation accuracy [41]. This paper finally adopts a grid scheme involving about 15.2 million elements through irrelevance verification, and the number of elements varies slightly with the opening of the movable guide vanes, the Figure 2 shows the Francis turbine mesh. Prism grids were used to locally refine the no-slip wall: the first node was placed 0.3 mm away from the nonslip wall to obtain y+ ≤ 80. Figure 3 shows the combined characteristic curve of the turbine model HLA551-LJ-35 with a diameter of 0.35 m, 24 movable guide vanes, 24 stay vanes, and 13 runner vanes. Six working conditions were selected according to the similarity theory of hydraulic turbines. Among them, the three working conditions of A, B, and C deal with part-load conditions; D shows the rated condition (i.e., the working condition that enables 100% output listed in the HLA551-LJ-43 Francis turbine manual provided by its manufacturer); and E and F are high-speed working conditions. The details of each working condition can be found in Table 1, in which α represents the opening degree of the movable guide vanes, n11 the unit speed, Q11 the unit flow, and η the efficiency. After the turbine is integrated into the public power grid, its rotating speed runner is constant. Therefore, four working conditions, A, B, C, and D, were selected to simulate the performance of Francis turbines connected with the power grid at different guide vane openings. In addition, working condition E and F were used to simulate the performance of Francis turbines under higher rotating speeds with the same guide vane opening. Through comparative analysis of the six working conditions, the influence of the guide vanes’ opening and the rotating speed of the runner on the channel vortex and cavitation were studied.
The boundary conditions were set as follows: the total pressure inlet was adopted at the spiral case-shaped inlet; a pressure outlet was adopted at the outlet of the draft tube. Therefore, the adjustment of different cavitation coefficients could be realized by changing the pressure value at the outlet. The grid interface of the runner was set by interface, and the data transfer between the dynamic and static interfaces was realized by sliding grid technology. The liquid phase’s volume fractions of the inlet and outlet were set to 1, the volume fraction of the cavitation phase was set to 0, and the saturated vapor pressure was set to 3169 Pa (saturated vapor pressure of water at 25 °C). Considering the influence of gravity, the acceleration of gravity was set to 9.81 m/s2, and the operating pressure was set to 101,325 Pa in this simulation. The SIMPLEC algorithm was used for the calculation, the Green–Gauss node-based algorithm for the discretization method, the PRESTO method for the calculation of pressure terms, First Order Upwind for the solution of momentum and volume fraction, and the first order implicit for the transient formulation. The time step was set to the time it took for the wheel to rotate 3°. The convergence criteria in this simulation required that residual error should be less than 10−4.

3. Results

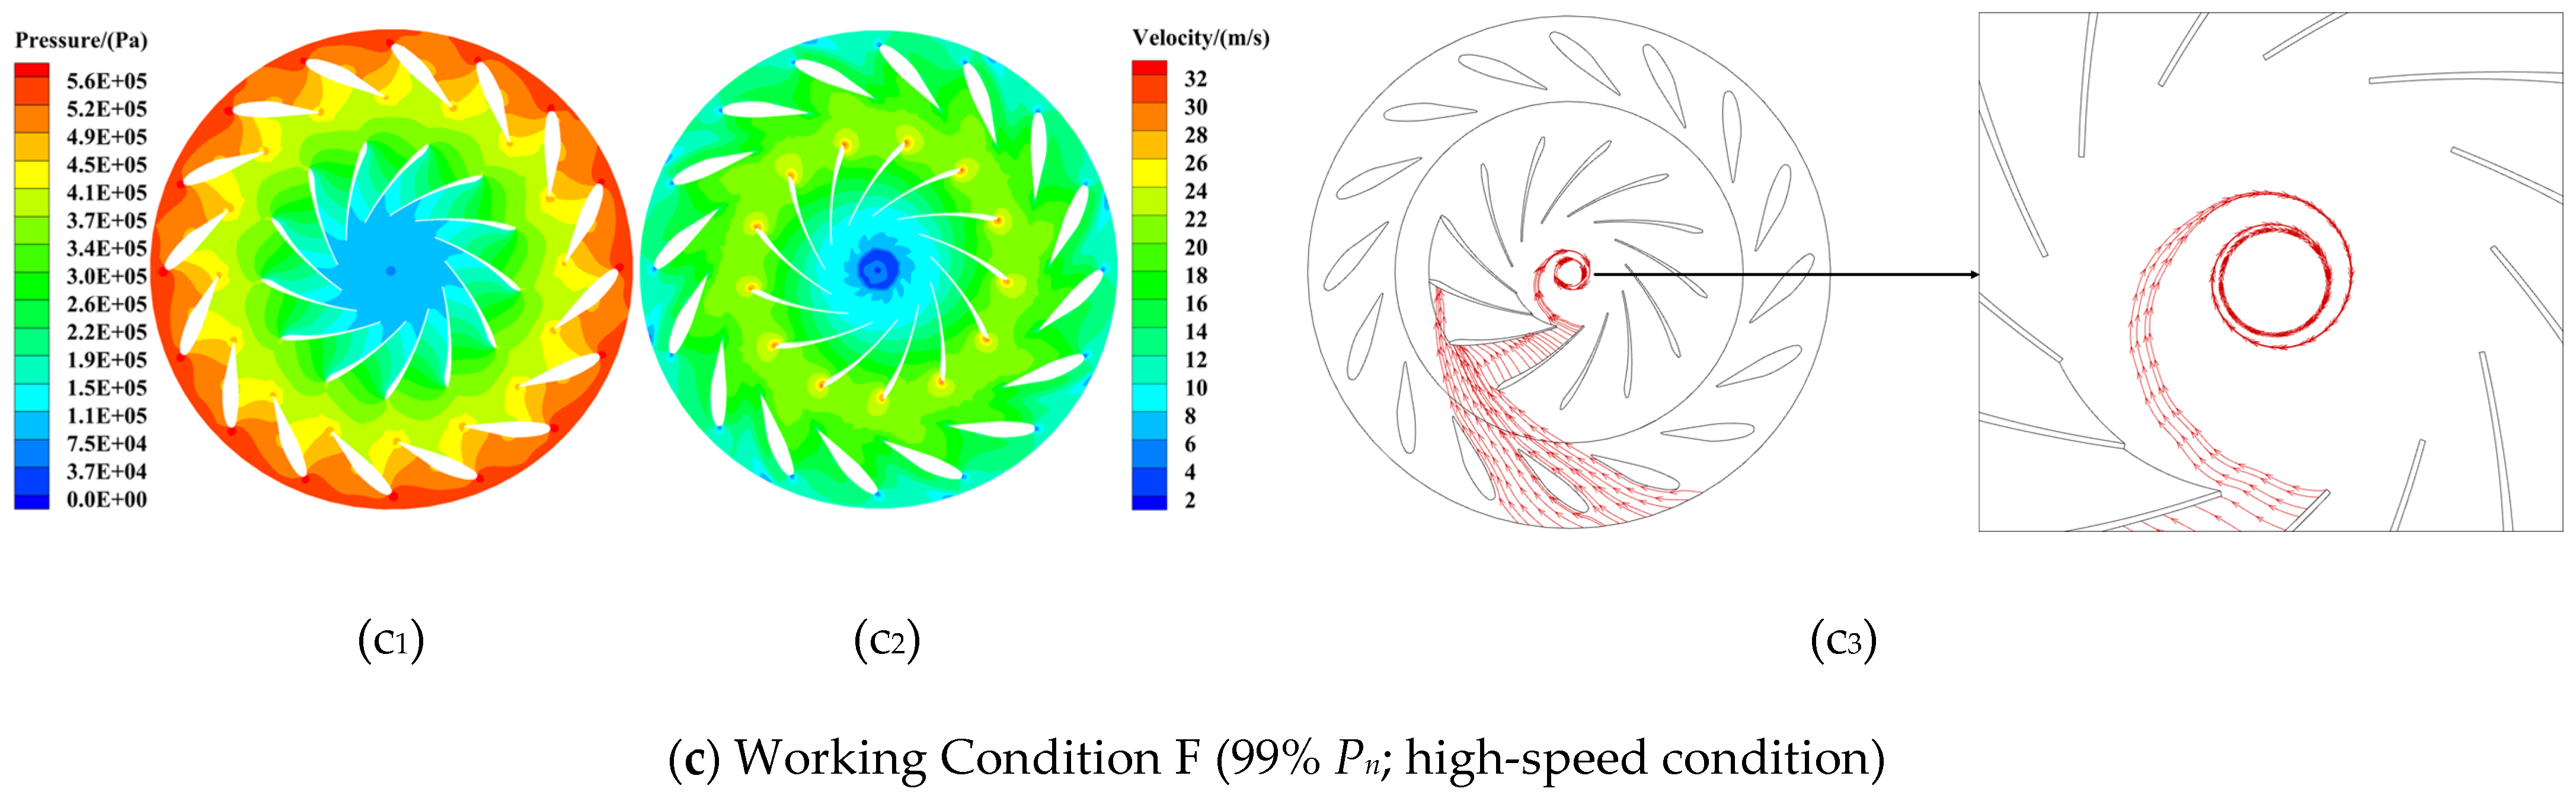
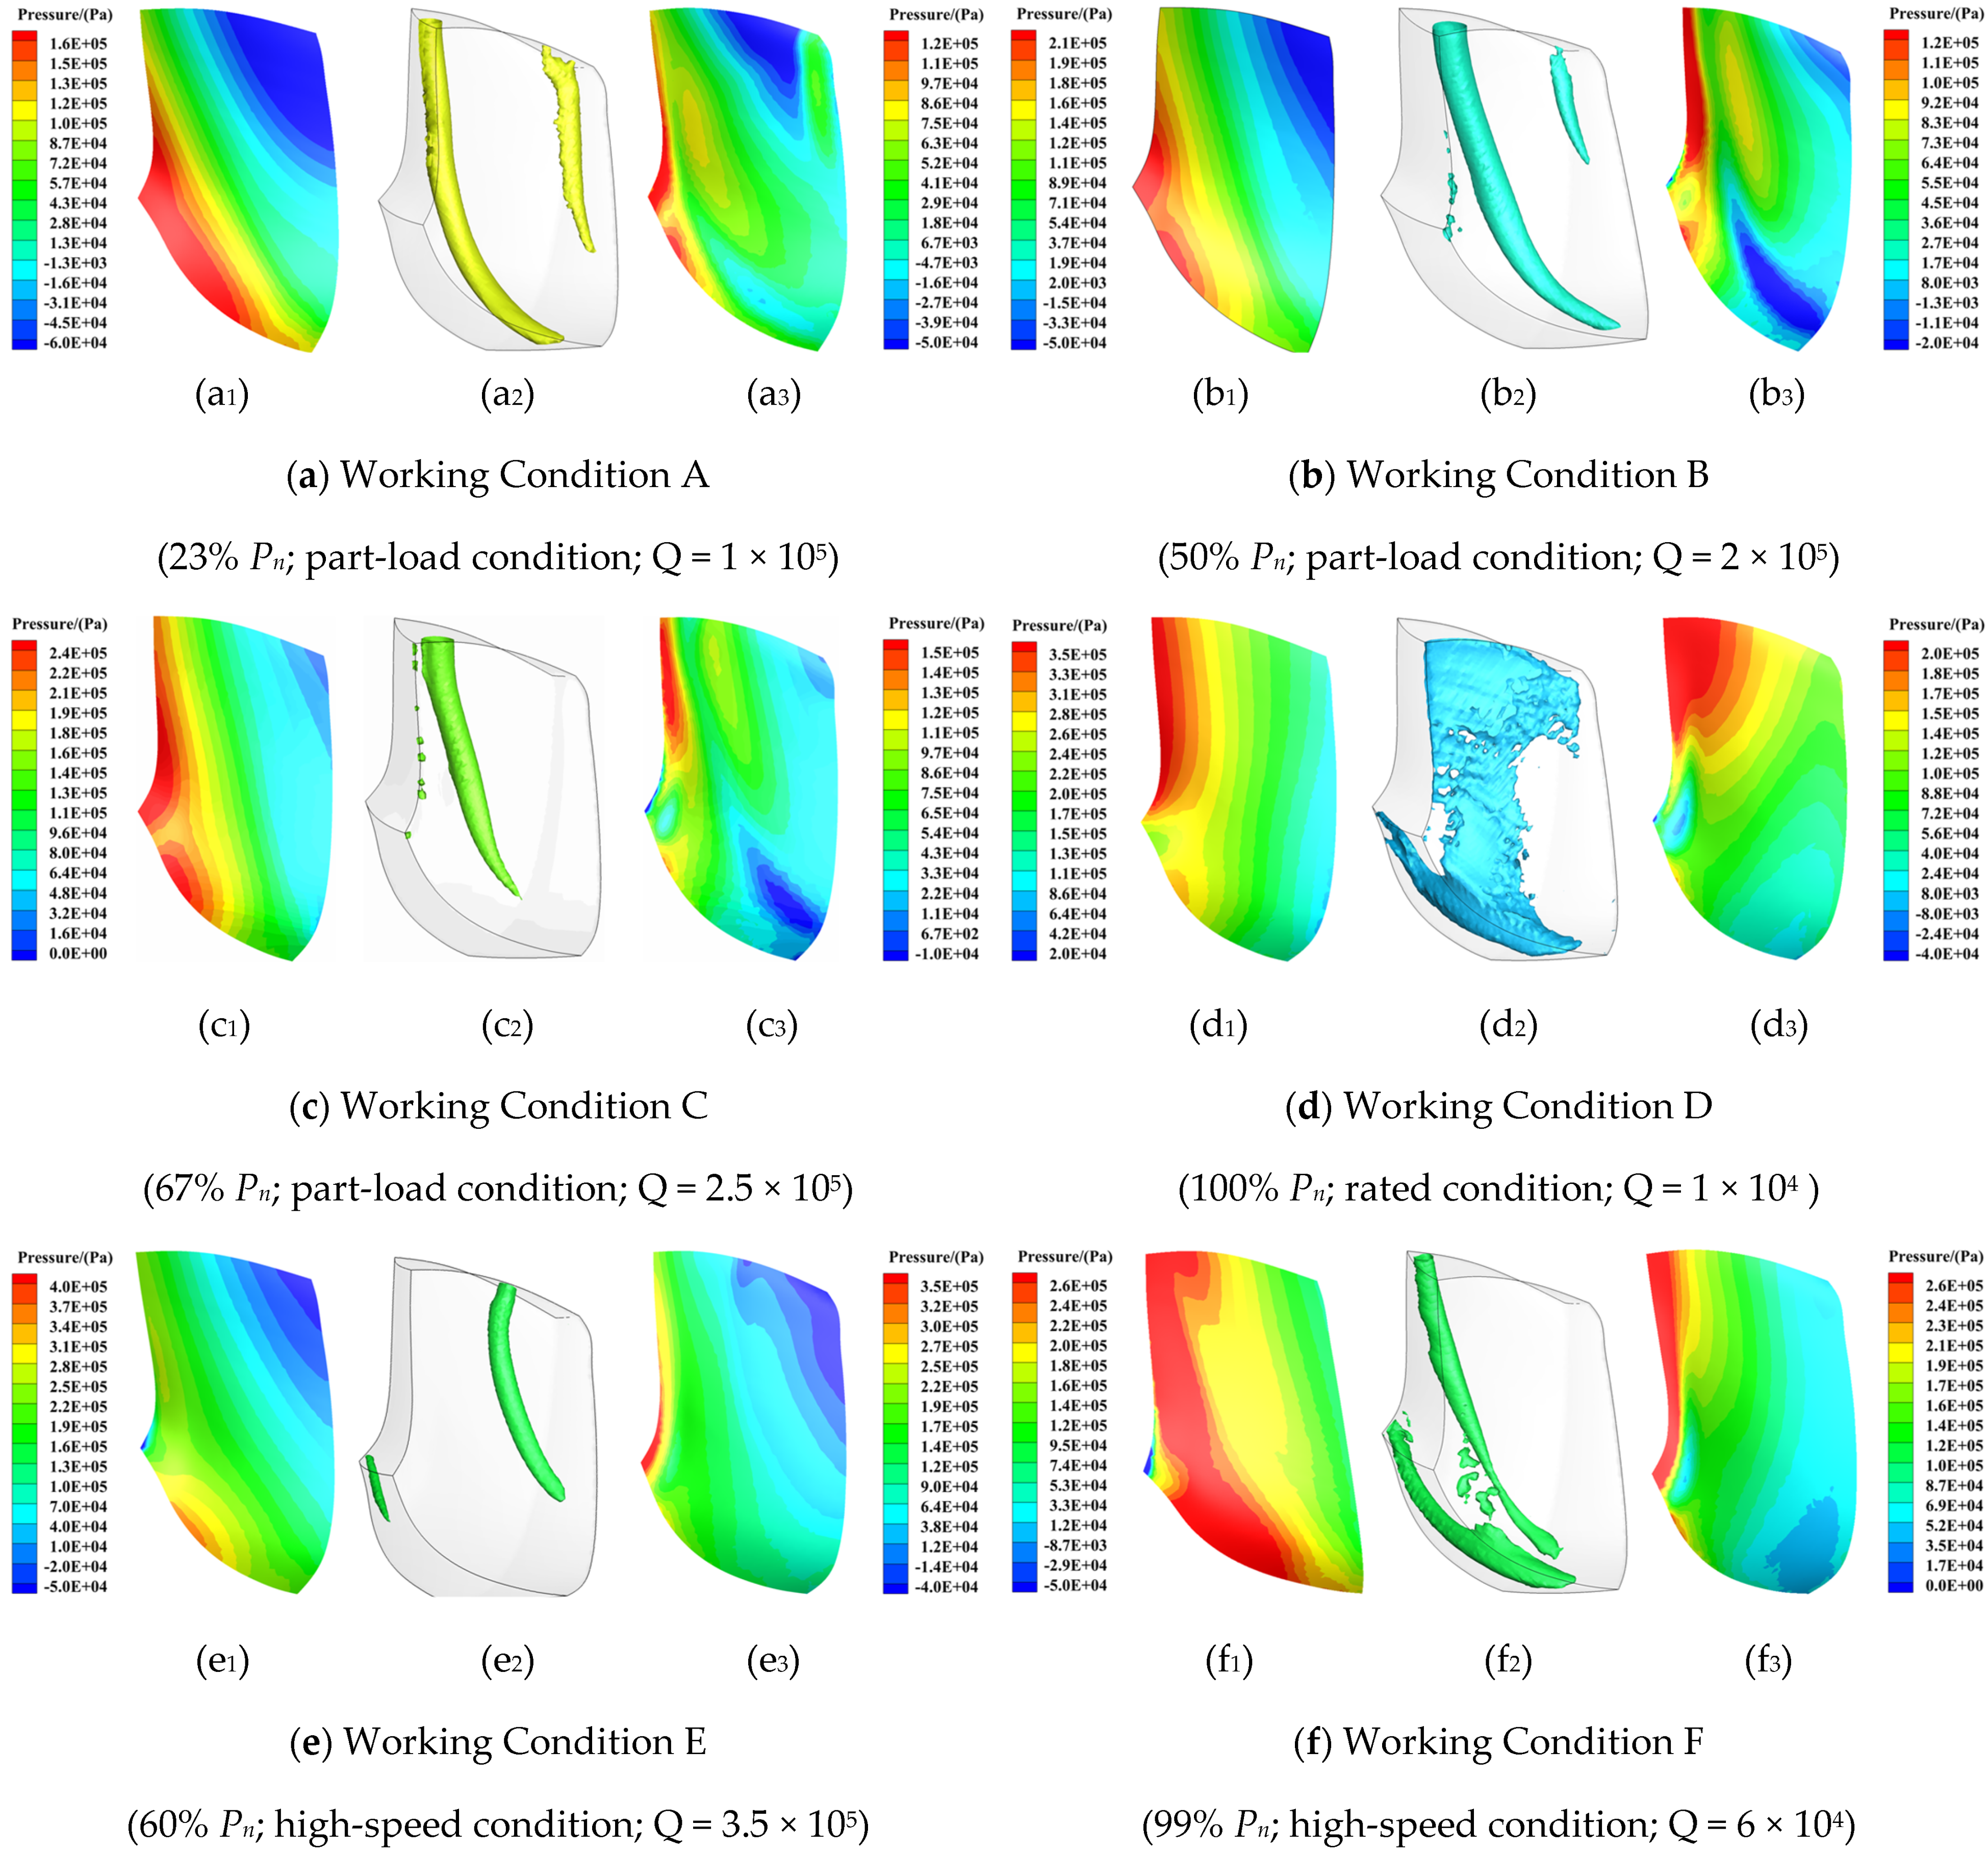
3.1. Flow Regime of Distributor and Runner

The pressure distribution and the velocity distribution on the meridional section of the distributor and runner featured high symmetry, as shown in Figure 4. When running under part-load conditions, the velocity gradient of the fluid was greater than that under the rated conditions, and the fluid velocity reached its maximum at the leading edge of the suction surface of the vanes. At that time, the flow in the blade passage was relatively turbulent, and a negative pressure zone could be found at the trailing edge of the pressure surface of the vanes. Also, it can be seen from the streamline of the fluid that the flow became longer after the fluid entered the runner; the fluid then formed vortexes at the trailing edges of the vanes, as shown in Figure 4(a3). When running under rated conditions, the pressure and velocity in the passage changed relatively smoothly along the vanes. It can be seen from the streamline of the fluid that the fluid flow was stable under those conditions and then formed vortexes in the center of the runner after leaving the trailing edges of the vanes. When running under high-speed conditions, the fluid velocity reached its maximum at the leading edge of the pressure surface of the vane, and the pressure in the blade passage gradually decreased from the leading edge to the trailing edges of the vanes. In addition, a severe negative pressure was observed in the runner cone zone. It can be seen from the streamline that the fluid formed stronger vortexes in the center of the runner than the fluid under the rated condition. In summary: (1) when running under rated conditions, channel vortexes could rarely be found in the blade passage of the Francis turbine, and the flow state in the blade passage was rather stable; (2) the tangential velocity of the fluid entering the runner became increasingly dominant under the part-load conditions, which led to a longer fluid flow and easily caused a blocking effect—furthermore, the fluid flowed out at the trailing edge of the suction surface of the vane and produced backflow, which formed channel vortexes at the trailing edge of the pressure surface of the vane; (3) under high-speed conditions, affected by the tangential velocities of the runner, longer flow was achieved after the fluid left the trailing edges of the vanes, and stronger vortexes were generated in the center of the runner compared with those generated under rated conditions.

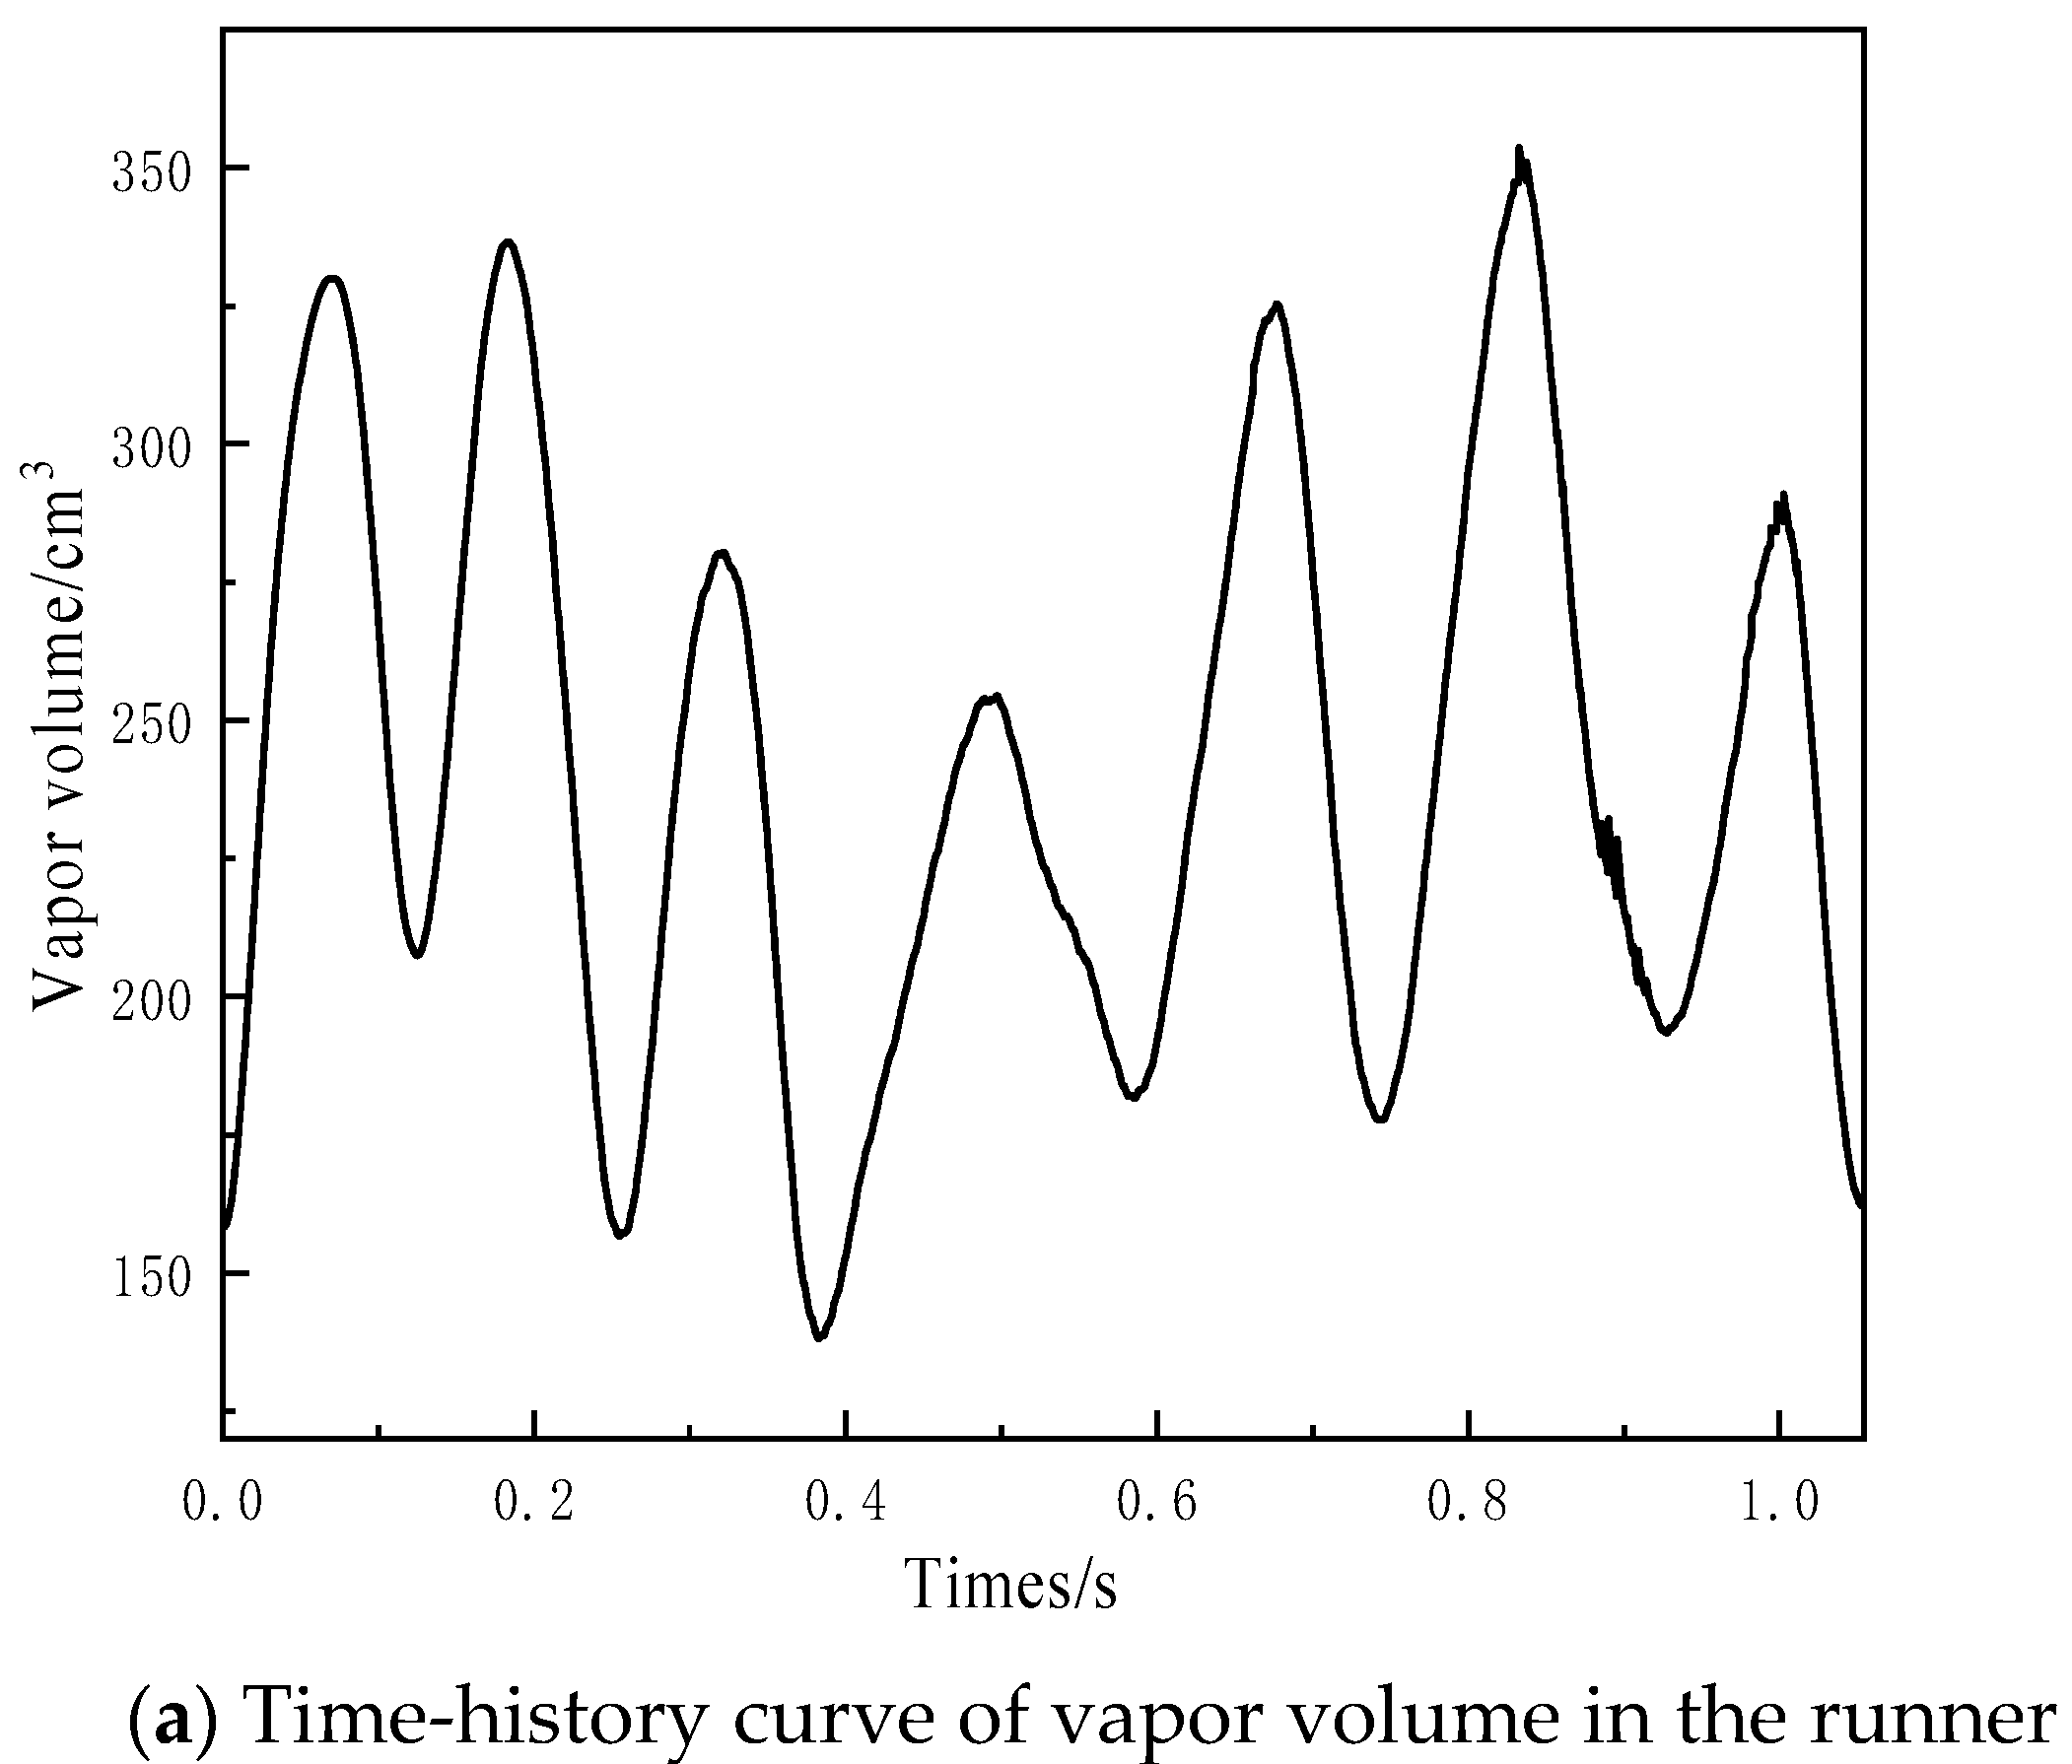
3.2. Analysis of Cavitation around the Runner

Cavitation is a special phenomenon that occurs in the energy conversion process of water flow. A large amount of heat is released because of cavitation with strong physical impact during the process from generation to collapse, which may cause a turbine to vibrate or even damage the flow wall of the turbine. There are various classifications of cavitation. In 2002, the 23rd International Towing Tank Conference (ITTC) proposed dividing cavitation into sheet cavitation, cloud cavitation, vortex cavitation, striated cavitation, etc. [42]. In view of the cavitation in Francis turbines [27], generally, there are leading edge cavitation, travelling bubble cavitation, draft tube vortex cavitation, channel vortex cavitation, Karman vortex cavitation [43], etc. Partial flow conditions aggravate the complexity of the flow field in the blade passage and the intensity of the vortexes in the Francis turbine, which may exacerbate the cavitation in the flow field when the latter is unstable. Through comparative analysis of the cavitation volume fraction on the walls of the vane, it was found that obvious cavitation could be observed on the wall of the runner vane under only four operating conditions, namely A, B, E, and F, and that said cavitation mainly resulted from the pressure surface of the vane, as shown in Figure 5. Under part-load conditions, the cavitation on the blade wall mainly occurred near the junction between the trailing edge of the pressure surface of the vane and the crown. Additionally, the smaller the opening of the guide vane was, the more obvious the wall surface cavitation became, and the greater the cavitation volume fraction was. As shown in Figure 5(a1,b1),when the opening α = 33% and the power was 23% Pn, the maximum cavitation volume fraction of the pressure surface of the vane was 0.99, while when the opening α = 54% and the power was 50% Pn, the maximum cavitation volume fraction of the pressure surface of the vane was 0.65. Under high-speed conditions, the cavitation on the blade wall surface mainly occurred near the connection between the front edge of the pressure surface of the vane and its band, as shown in Figure 5(c1,d1). When the opening α = 65% and the power was 60% Pn, the maximum cavitation volume fraction of the pressure surface of the vane was 0.76, while when the opening α = 100% and the power was 99% Pn, the maximum cavitation volume fraction of the pressure surface of the vane was 0.45. The same unit speed and incremental opening of movable guide vanes was set when the turbine ran under four of the working conditions, namely A, B, C, and D, and the relevant peak volumes of the cavitation in the runner were analyzed (Figure 6). It can be seen that as the opening of the movable guide vane decreased, the cavity volume in the runner showed an increasing trend. In summary: (1) the cavitation phenomenon mainly occurred near the junction between the trailing edge of the pressure surface of the vane and its upper crown under part-load conditions; (2) the cavitation phenomenon mainly occurred near the junction of the front edge and its band of the pressure surface of the vane under high-speed conditions; (3) as the opening of the movable guide vane decreased, the severity of the cavitation in the runner showed an increasing trend.
A dynamic cycle from generation, to development, to partial collapse, to disappearance, to reformation can be observed in the cavitation inside the runner. Therefore, the changes of vapor volume in the runner followed certain rules. Figure 7 shows the seven cavitation transformation cycle times in the runner under part-load conditions and the spectral characteristics obtained through FFT (fast Fourier transform). Under these conditions, the rotating frequency of the runner was 22.5 Hz, and the domain frequency obtained by FFT accounted for 30% of the rotation frequency; that is, the conversion frequency of the cavitation in the runner can be considered as 30% of the rotation frequency.

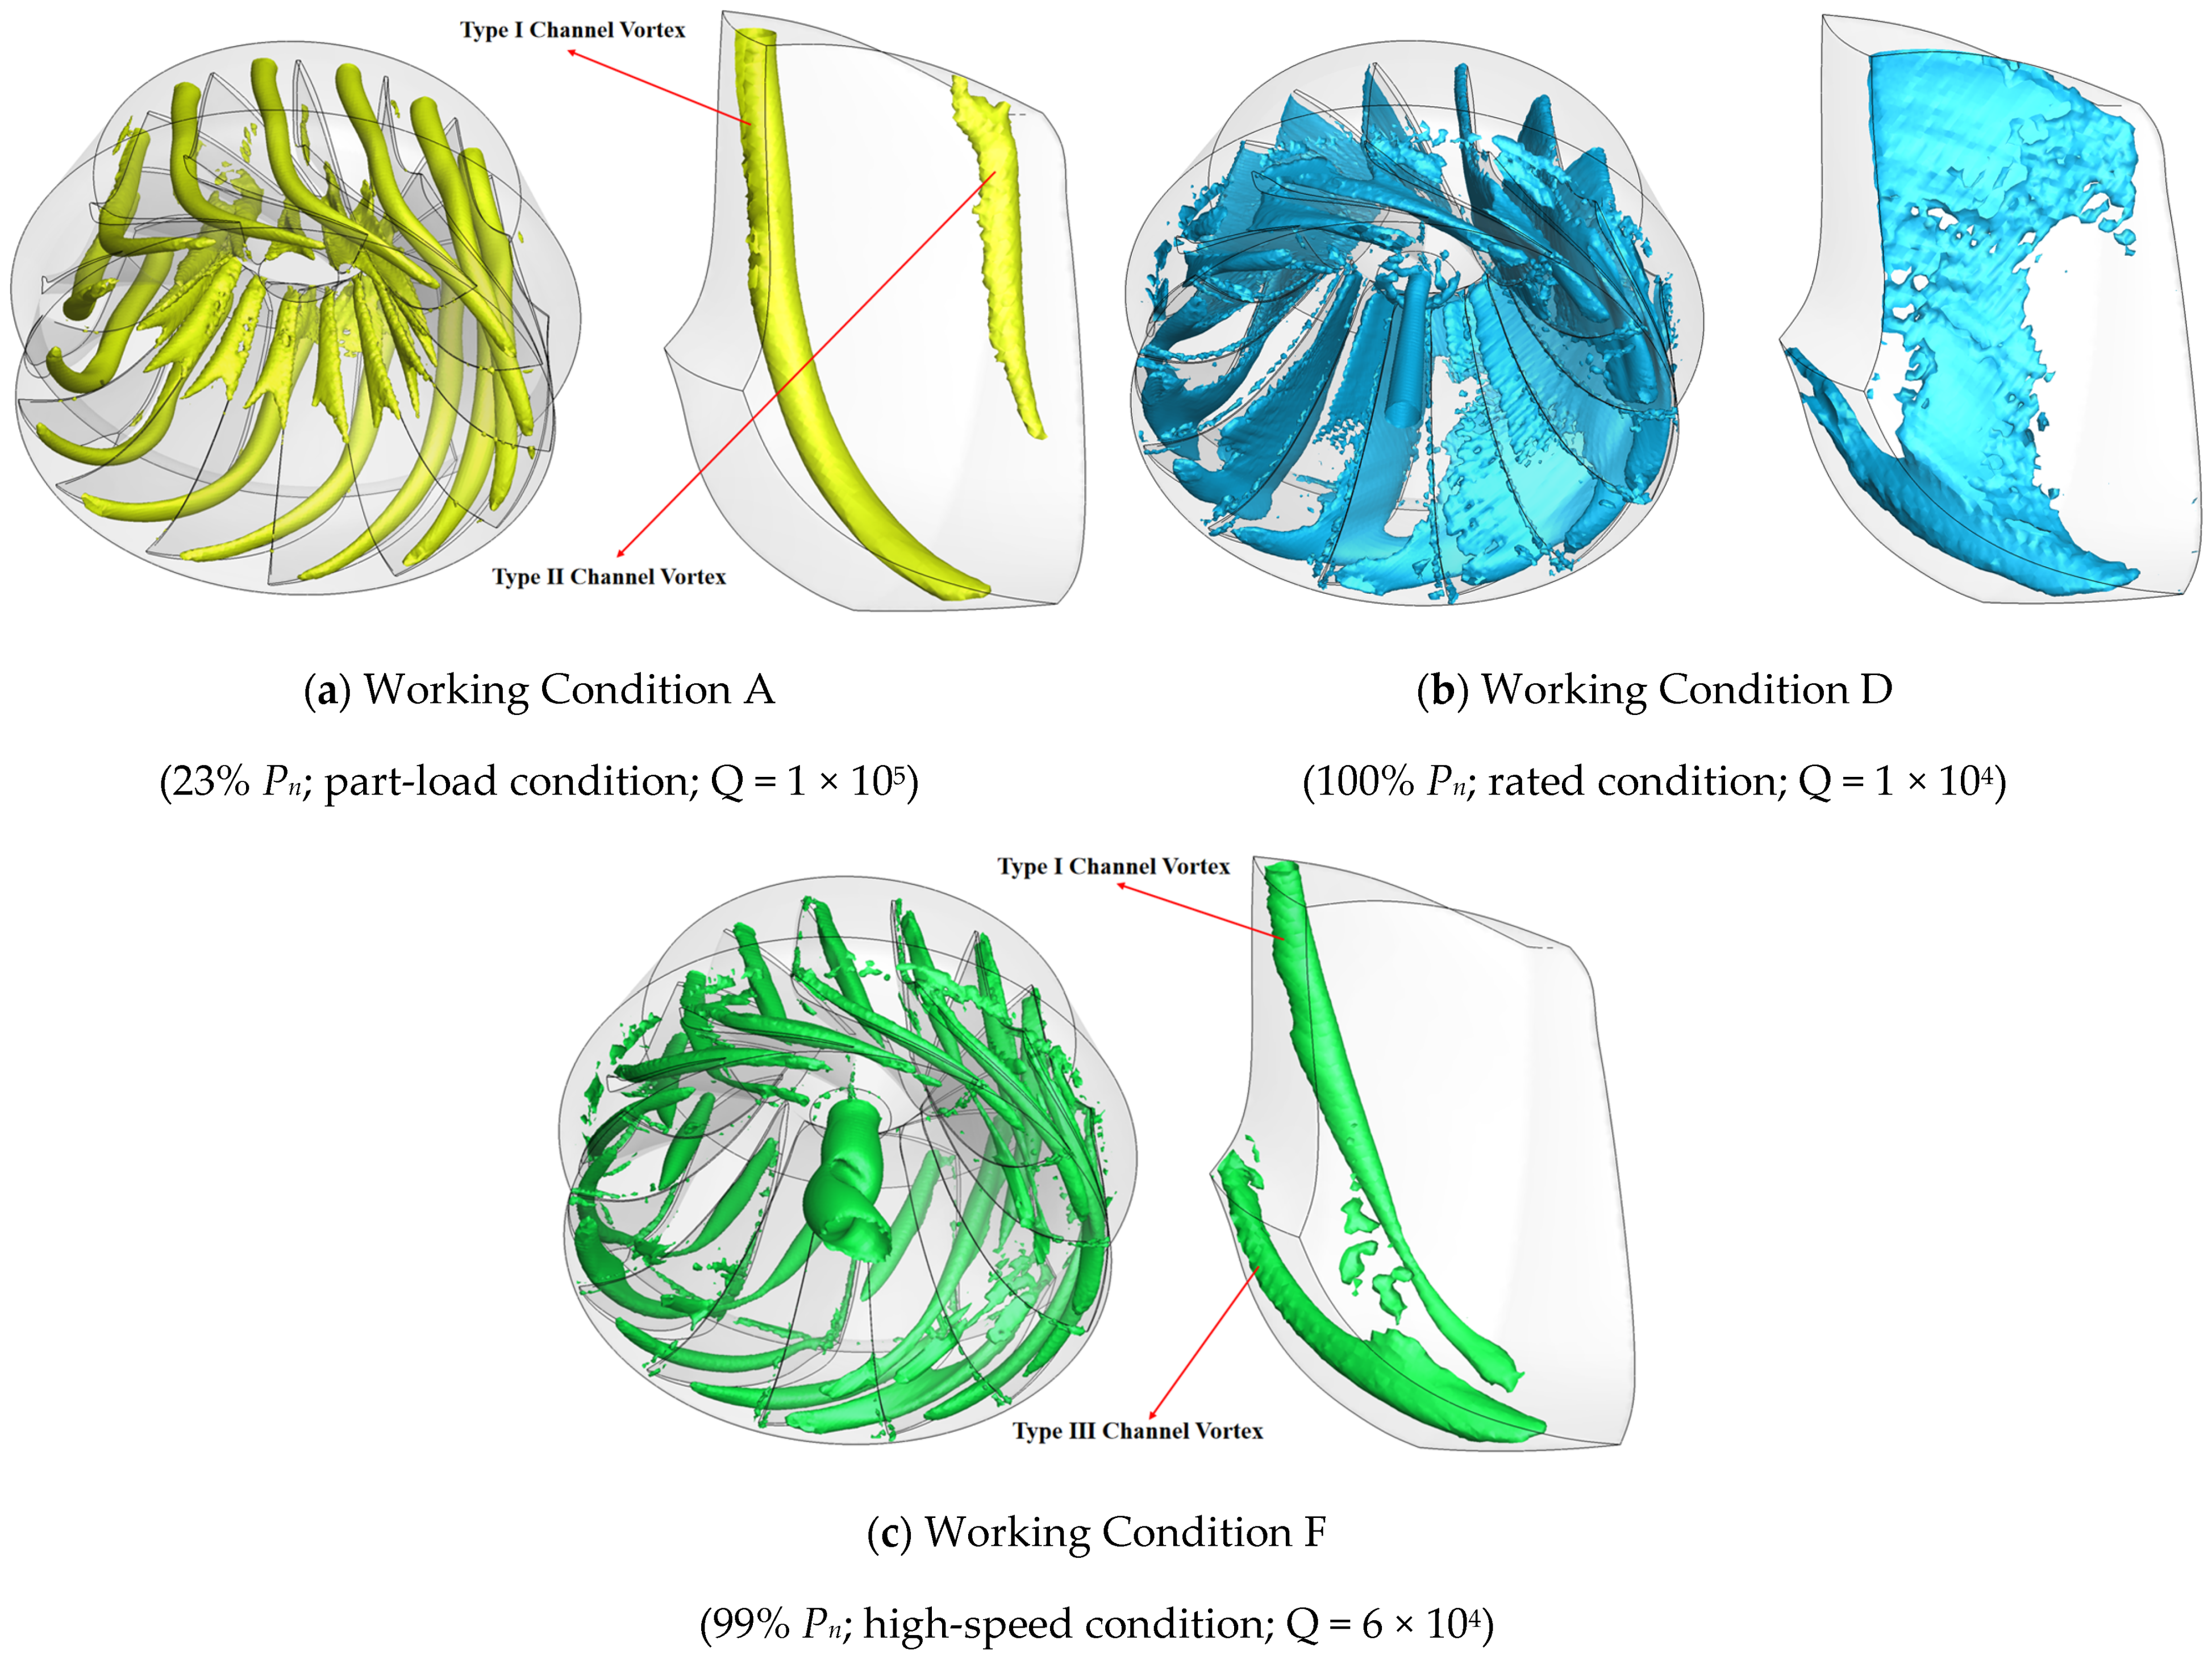
3.3. Analysis of Channel Vortexes around the Runner

Figure 8 shows the channel vortex structure captured by the Q criterion identification method, in which Q represents the Q criterion magnitude. The Q criterion method avoids the interference of shear stress, leaving only the rotating part to mark the vortex, which better captures the motion of vortexes. It is generally believed that when the Q criterion is greater than 0, the fluid rotation is greater than the fluid deformation, and the vortex captured at that time is more authentic. It can be seen from the figure that there are mainly three types of channel vortex structures, namely types I, II, and III. Also, Figure 8a shows that when the turbine ran under part-load conditions, two obvious channel vortexes in the blade passage could be observed at the same time, namely type I and type II channel vortexes, both of which were generated below the upper crown running through the blade passage. These channel vortexes were consistent with those vortex observed in the experiment, as shown in Figure 9a. The type II channel vortex was originally generated below the upper crown of the vane. Going downstream, it gradually ruptured and disappeared as its evolution intensity continued to decrease. When the turbine ran under rated condition, no complete channel vortex was formed in the blade passage, which indicates that the flow pattern in the blade passage is relatively uniform and stable under those conditions. Meanwhile, when the rotating speed of the runner was increased, type I and type III vortexes occurred at the same time, as shown in Figure 8c. The type III channel vortex was generated at the junction between the leading edge of the pressure surface of the vane and its band, and it gradually expanded along the intersection line between the band and the pressure surface of the vane before finally disappearing at the draft tube inlet, as shown in Figure 9b. In summary: type I channel vortexes were commonly found in the blade passage under partial flow operating conditions; type I and type II channel vertexes occurred in the blade passage under part-load conditions, and the latter caused cavitation around the junction of the tailing edge of the pressure surface and the crown of the runner vane; there were type I and type III channel vertexes in the blade passage under high-speed conditions, and the latter caused cavitation at the leading edge of the pressure surface of runner vane.
As shown in Figure 10, the cause of the formation of the channel vortexes was analyzed from the aspect of the velocity triangle of the Francis turbine. When running under part-load conditions, compared with running under rated condition, the flow rate decreased. The corresponding change shown in the velocity triangle is that as the relative velocity decreases, the relative liquid flow angle of the inlet decreases, and negative attack angles can be found at the runner inlet; however, when running at high speed, due to the increase of the runner speed, the corresponding change in the speed triangle is that as the circumferential speed increases, the inlet relative liquid flow angle decreases and a negative attack angle also can be found in the runner inlet, which leads the fluid to the vane and produces outflow and backflow in the blade passage, forming channel vortexes.
To further elaborate the mechanism and influence of the channel vortex, the contours of the pressure surface and suction surface of the vane were analyzed (Figure 11). The high-pressure zone of the runner vane mainly occurred on the leading edge of the vane, and the low-pressure zone and the negative pressure zone mainly occurred on the trailing edge of the vane. Type I channel vortexes occurred inside the blade passage, closer to the suction surface of the vane. Running through the whole blade passage, this type of channel vortex finally disappeared at the draft tube inlet, which led to the blade pressure distribution gradually decreasing from the bottom side of the leading edge to the top side of the trailing edge of the vane; it then broke off at the tailing edge of the blade passage and entered the draft tube, resulting in a low-pressure zone and negative pressure zone on the bottom side of the trailing edge on the suction surface of the vane. The fluid produced outflow and backflow at the trailing edge of the suction surface of the vane and finally formed type II channel vortexes at the trailing edge of the pressure surface of the vane. The type II channel vortex accounted for the negative pressure zone on the junction of the trailing edge of the vane and its crown when running under part-load conditions, as shown in Figure 11(a1,a3,b1,b3). However, while a high-pressure zone can be observed at the leading edge of pressure surface of the vane, under high-speed conditions, the pressure zone occurred at the junction of the same place and the band showed a sudden drop, which led to the negative pressure zone, as shown in Figure 11(e1,f1). That explained why the type III channel vortexes formed when the fluid hit the pressure surface of the vane, which resulted from the negative attack angle at the inlet of the runner.
We took the nondimensional pressure coefficient of vanes with the elevations of 40% and 75% for analysis, and the expression of the pressure coefficient Cp was:
C p = p t p a 0 . 5 ρ v 2
in which pt is the instantaneous static pressure of the vane (Pa); pa is the average static pressure of the vane (Pa); ρ is the water density (kg/m3); and v is the inlet flow rate of the turbine (m/s).
It can be seen from Figure 12a,b that the pressure coefficient distribution showed severe fluctuations of the suction surface of the vane at 40% elevation and 75% elevation. As the opening of the movable guide vane decreased, the peak value of the pressure coefficient at the leading edge on the pressure surface of the vane increased while the valley value of the pressure coefficient of the trailing edge of the pressure surface of the vane decreased, indicating that the pressure coefficient distribution fluctuated more severely. Under high-speed conditions, the pressure coefficient of the leading edge of the suction surface of the vane with 40% elevation dropped sharply; under part-load conditions, the pressure coefficient of the trailing edge of the suction surface of the vane dropped to its valley value. From Figure 12c,d, it can be seen that the pressure coefficient distribution changed more uniformly, and the pressure coefficient gradually decreased from the leading edge of to the trailing edge of the vane’s pressure surface. As the opening of the guide vane decreased, the gradient of the pressure coefficient increased. Under high-speed conditions, a sudden increase in the pressure coefficient could be observed at the leading edge of the vane’s pressure surface; under part-load conditions, the valley value of the pressure coefficient could be found at the trailing edge of the pressure surface. In summary: (1) the high-pressure zone of the runner blade mainly occurred at the leading edge of the vane, which may cause physical damage—the low-pressure and negative pressure zones of the runner vane mainly occurred in the trailing edge, which may bring cavitation; (2) as the opening of the movable vane decreased, the pressure gradient on the blade wall increased; (3) the blade was affected by the channel vortexes, which may have caused the partial sudden change in the pressure distribution on the blade wall.

4. Conclusions

In this paper, the LES method based on the WALE subgrid scale stress model was used with the Schnerr–Sauer cavitation model to study the flow characteristics in the flow passage of a Francis turbine under partial flow conditions. The results showed that when running under partial flow conditions, channel vortexes with different structures could be observed in the flow passage, causing cavitation in the runner. The vapor volume changes inside the runner showed periodic features. As the opening of the movable guide vane decreased, the severity of the cavitation in the runner showed an increasing trend. Under partial flow conditions, negative attack angles at the runner inlet resulted in channel vortexes. The channel vortexes disturbed the pressure distribution of the vane, resulting in partial high-pressure zones or negative pressure zones on.

5. Further Work

Further research will focus on the detailed patterns of time–space evolution of channel vertex and cavitation, further explore the relationship between these phenomena, and try find an improved method through data obtained in this paper to destroy channel vortex and avoid cavitation in Francis turbines.

Author Contributions

Conceptualization, T.G. and Z.L.; methodology, T.G.; software, J.Z.; validation, T.G., J.Z. and Z.L.; formal analysis, T.G.; investigation, Z.L.; resources, T.G.; data curation, J.Z.; writing—original draft preparation, J.Z.; writing—review and editing, J.Z.; visualization, T.G.; supervision, Z.L.; project administration, T.G.; funding acquisition, T.G. All authors have read and agreed to the published version of the manuscript.

Funding

This research was funded by National Natural Science Foundation of China (NSFC), grant number 51969009 and grant number 52069010.

Institutional Review Board Statement

The study did not involve humans or animals.

Informed Consent Statement

The study did not involve humans.

Data Availability Statement

The study did not report any data.

Acknowledgments

This work was financially supported by National Natural Science Foundation of China (NSFC) (Grants no. 51969009 and 52069010).

Conflicts of Interest

The authors declare no conflict of interest.

References

  1. Müller, A.; Favrel, A.; Landry, C.; Avellan, F. Fluid–structure interaction mechanisms leading to dangerous power swings in Francis turbines at full load. J. Fluids Struct. 2017, 69, 56–71. [Google Scholar] [CrossRef]
  2. Duan, R. Some Technical Problems of Reversible Pump Turbine and in the Construction of Pumped-storage Power Stations. Water Power 2012, 38, 47–50+83. (In Chinese) [Google Scholar]
  3. Trivedi, C.; Agnalt, E.; Dahlhaug, O.G. Experimental study of a Francis turbine under variable-speed and discharge conditions. Renew. Energy 2018, 119, 447–458. [Google Scholar] [CrossRef]
  4. Trivedi, C.; Gandhi, B.; Michel, C.J. Effect of transients on Francis turbine runner life: A review. J. Hydraul. Res. 2013, 51, 121–132. [Google Scholar] [CrossRef]
  5. Kirschner, O.; Ruprecht, A.; Göde, E.; Riedelbauch, S. Experimental investigation of pressure fluctuations caused by a vortex rope in a draft tube. IOP Conf. Ser. Earth Environ. Sci. 2012, 15, 062059. [Google Scholar] [CrossRef]
  6. Celebioglu, K.; Altintas, B.; Aradag, S.; Tascioglu, Y. Numerical research of cavitation on Francis turbine runners. Int. J. Hydrog. Energy 2017, 42, 17771–17781. [Google Scholar] [CrossRef]
  7. Jiang, W.; Chang, J. Cavitation Performance of Hydraulic Turbines in the Three Gorges Reservoir with Consideration of Influence of Total Phosphorus Pollution. J. Fluids Eng. 2016, 138, 081301. [Google Scholar] [CrossRef]
  8. Goyal, R.; Gandhi, B.K. Review of hydrodynamics instabilities in Francis turbine during off-design and transient operations. Renew. Energy 2018, 116, 697–709. [Google Scholar] [CrossRef]
  9. Chen, J.X.; Li, G.; Liu, S.; Lu, G.P. The Occurrence and the Influence of the Interblade Wortex on the Hydraulic Turbine Stability. Large Electr. Mach. Hydraul. Turbine 2007, 3, 42–46. (In Chinese) [Google Scholar]
  10. Escaler, X.; Egusquiza, E.; Farhat, M.; Avellan, F.; Coussirat, M. Detection of cavitation in hydraulic turbines. Mech. Syst. Signal Process. 2004, 20, 983–1007. [Google Scholar] [CrossRef] [Green Version]
  11. Magnoli, M.V.; Anciger, D.; Maiwald, M. Numerical and experimental investigation of the runner channel vortex in Francis turbines regarding its dynamic flow characteristics and its influence on pressure oscillations. IOP Conf. Ser. Earth Environ. Sci. 2019, 240, 022044. [Google Scholar] [CrossRef]
  12. Guo, T.; Zhang, L.; Wang, W.; Luo, Z. Rotating Turbulent Flow Simulation with LES and Vreman Subgrid-Scale Models in Complex Geometries. Adv. Mech. Eng. 2014, 6, 1–8. [Google Scholar] [CrossRef]
  13. Yamamoto, K.; Müller, A.; Favrel, A.; Avellan, F. Experimental evidence of inter-blade cavitation vortex development in Francis turbines at deep part load condition. Exp. Fluids 2017, 58, 142. [Google Scholar] [CrossRef]
  14. Favrel, A.; Junior JG, P.; Müller, A.; Landry, C.; Yamamoto, K.; Avellan, F. Swirl number based transposition of flow-induced mechanical stresses from reduced scale to full-size Francis turbine runners. J. Fluids Struct. 2020, 94, 102956. [Google Scholar] [CrossRef]
  15. Yamamoto, K.; Müller, A.; Favrel, A.; Landry, C.; Avellan, F. Flow characteristics and influence associated with inter-blade cavitation vortices at deep part load operations of a Francis turbine. J. Phys. Conf. Ser. 2017, 813, 012029. [Google Scholar] [CrossRef]
  16. Yamamoto, K.; Müller, A.; Favrel, A.; Landry, C.; Avellan, F. Numerical and experimental evidence of the inter-blade cavitation vortex development at deep part load operation of a Francis turbine. IOP Conf. Ser. Earth Environ. Sci. 2016, 49, 082005. [Google Scholar] [CrossRef]
  17. Guo, P.; Sun, L.; Luo, X. Flow characteristic investigation into inter-blade vortex for Francis turbine. Trans. Chin. Soc. Agric. Eng. 2019, 35, 43–51. (In Chinese) [Google Scholar]
  18. Guo, P.C.; Wang, Z.N.; Luo, X.Q.; Wang, Y.L.; Zuo, J.L. Flow characteristics on the blade channel vortex in the Francis turbine. IOP Conf. Ser. Mater. Sci. Eng. 2016, 129, 012038. [Google Scholar] [CrossRef] [Green Version]
  19. Guo, P.; Wang, Z.; Sun, L.; Luo, X. Characteristic analysis of the efficiency hill chart of Francis turbine for different water heads. Adv. Mech. Eng. 2017, 9, 21–26. [Google Scholar] [CrossRef]
  20. Liu, D.; Liu, X.; Zhao, Y. Experimental Investigation of Inter-Blade Vortices in a Model Francis Turbine. Chin. J. Mech. Eng. 2017, 30, 854–865. [Google Scholar] [CrossRef]
  21. Cheng, H.; Zhou, L.; Liang, Q.; Guan, Z.; Liu, D.; Wang, Z.; Kang, W. The investigation of runner blade channel vortices in two different Francis turbine models. Renew. Energy 2020, 156, 201–212. [Google Scholar] [CrossRef]
  22. Cheng, H.; Zhou, L.; Liang, Q.; Guan, Z.; Liu, D.; Wang, Z.; Kang, W. A method of evaluating the vortex rope strength in draft tube of Francis turbine. Renew. Energy 2020, 152, 770–780. [Google Scholar] [CrossRef]
  23. Zhou, L.; Liu, M.; Wang, Z.; Liu, D.; Zhao, Y. Numerical simulation of the blade channel vortices in a Francis turbine runner. Eng. Comput. 2017, 34, 364–376. [Google Scholar] [CrossRef]
  24. Su, W.; Zheng, Z.; Li, X.; Li, F.; Lan, C. Verification of large eddy simulation (LES) applied in Francis hydro-turbine under partial flow conditions. J. Harbin Inst. Technol. 2015, 47, 84–91. (In Chinese) [Google Scholar]
  25. Trivedi, C.; Dahlhaug, O.G. Interaction between trailing edge wake and vortex rings in a Francis turbine at runaway condition: Compressible large eddy simulation. Phys. Fluids 2018, 30, 075101. [Google Scholar] [CrossRef]
  26. Trivedi, C. Time-dependent inception of vortex rings in a Francis turbine during load variation: Large eddy simulation and experimental validation. J. Hydraul. Res. 2020, 58, 790–806. [Google Scholar] [CrossRef]
  27. Trivedi, C.; Iliev, I.; Dahlhaug, O.G.; Markov, Z.; Engstrom, F.; Lysaker, H. Investigation of a Francis turbine during speed variation: Inception of cavitation. Renew. Energy 2020, 166, 147–162. [Google Scholar] [CrossRef]
  28. Sun, L.; Guo, P.; Luo, X. Numerical investigation of inter-blade cavitation vortex for a Francis turbine at part load conditions. IET Renew. Power Gener. 2021, 15, 1163–1177. [Google Scholar] [CrossRef]
  29. Shi, G.T.; Xue, Z.C.; Yang, Q.; Liu, Z.K. Effect of Guide Vane Opening on Cavitation Performance of Runner Blade of Francis Turbine. China Rural. Water Hydropower 2021, 3, 163–167. (In Chinese) [Google Scholar]
  30. Anvari, S.; Taghavifar, H.; Khalilarya, S.; Jafarmadar, S.; Shervani-Tabar, M.T. Numerical simulation of diesel injector nozzle flow and in-cylinder spray evolution. Appl. Math. Model. 2016, 40, 8617–8629. [Google Scholar] [CrossRef]
  31. Roohi, E.; Pendar, M.R.; Rahimi, A. Simulation of three-dimensional cavitation behind a disk using various turbulence and mass transfer models. Appl. Math. Model. 2016, 40, 542–564. [Google Scholar] [CrossRef]
  32. Li, M.; Chen, X.; Ruan, X. Investigation of flow structure and heat transfer enhancement in rectangular channels with dimples and protrusions using large eddy simulation. Int. J. Therm. Sci. 2020, 149, 106207. [Google Scholar] [CrossRef]
  33. Li, L.M.; Wang, Z.D.; Li, X.J.; Wang, Y.P.; Zhu, Z.C. Very Large Eddy Simulation of Cavitation from Inception to Sheet/Cloud Regimes by A Multiscale Model. China Ocean. Eng. 2021, 35, 361–371. [Google Scholar] [CrossRef]
  34. Nicoud, F.; Ducros, F. Subgrid-Scale Stress Modelling Based on the Square of the Velocity Gradient Tensor. Flow Turbul. Combust. 1999, 62, 183–200. [Google Scholar] [CrossRef]
  35. Yu, J.Y.; Wang, R.Y.; Chen, F.; Song, Y. A Comparison of the Different Subgrid-Scale Models and Its Application. J. Eng. Thermophys. 2016, 37, 2311–2318. (In Chinese) [Google Scholar]
  36. Yang, J. Study on Cavitation Flows in Draft Tube of a Francis Turbine. Diploma Thesis, China Agricultural University, Beijing, China, 2013. (In Chinese). [Google Scholar]
  37. Rayleigh, L., VIII. On the pressure developed in a liquid during the collapse of a spherical cavity. Philos. Mag. 1917, 34, 94–98. [Google Scholar] [CrossRef]
  38. Susan-Resiga, R.; Dan Ciocan, G.; Anton, I.; Avellan, F. Analysis of the Swirling Flow Downstream a Francis Turbine Runner. J. Fluids Eng. 2006, 128, 177–189. [Google Scholar] [CrossRef]
  39. Valdes, J.R.; Rodríguez, J.M.; Monge, R.; Peña, J.C.; Pütz, T. Numerical simulation and experimental validation of the cavitating flow through a ball check valve. Energy Convers. Manag. 2014, 78, 776–786. [Google Scholar] [CrossRef]
  40. Cheng, H.Y.; Bai, X.R.; Long, X.P.; Ji, B.; Peng, X.X.; Farhat, M. Large eddy simulation of the tip-leakage cavitating flow with an insight on how cavitation influences vorticity and turbulence. Appl. Math. Model. 2020, 77 Pt 1, 788–809. [Google Scholar] [CrossRef]
  41. Wack, J.; Riedelbauch, S. Numerical simulations of the cavitation phenomena in a Francis turbine at deep part load conditions. J. Phys. Conf. Ser. 2015, 656, 012074. [Google Scholar] [CrossRef]
  42. Wu, Y. (Ed.) Proceedings of the 23th National Congress on Hydrodynamics and 10nd National Conference on Hydrodynamics, Venice, Italy, 8–14 September 2002; China Ocean Press: Beijing, China, 2011. (In Chinese).
  43. Pan, Z.; Yuan, Q.S. Fundamentals of Cavitation in Pumps; Jiangsu University Press: Zhenjiang, China, 2013. (In Chinese) [Google Scholar]
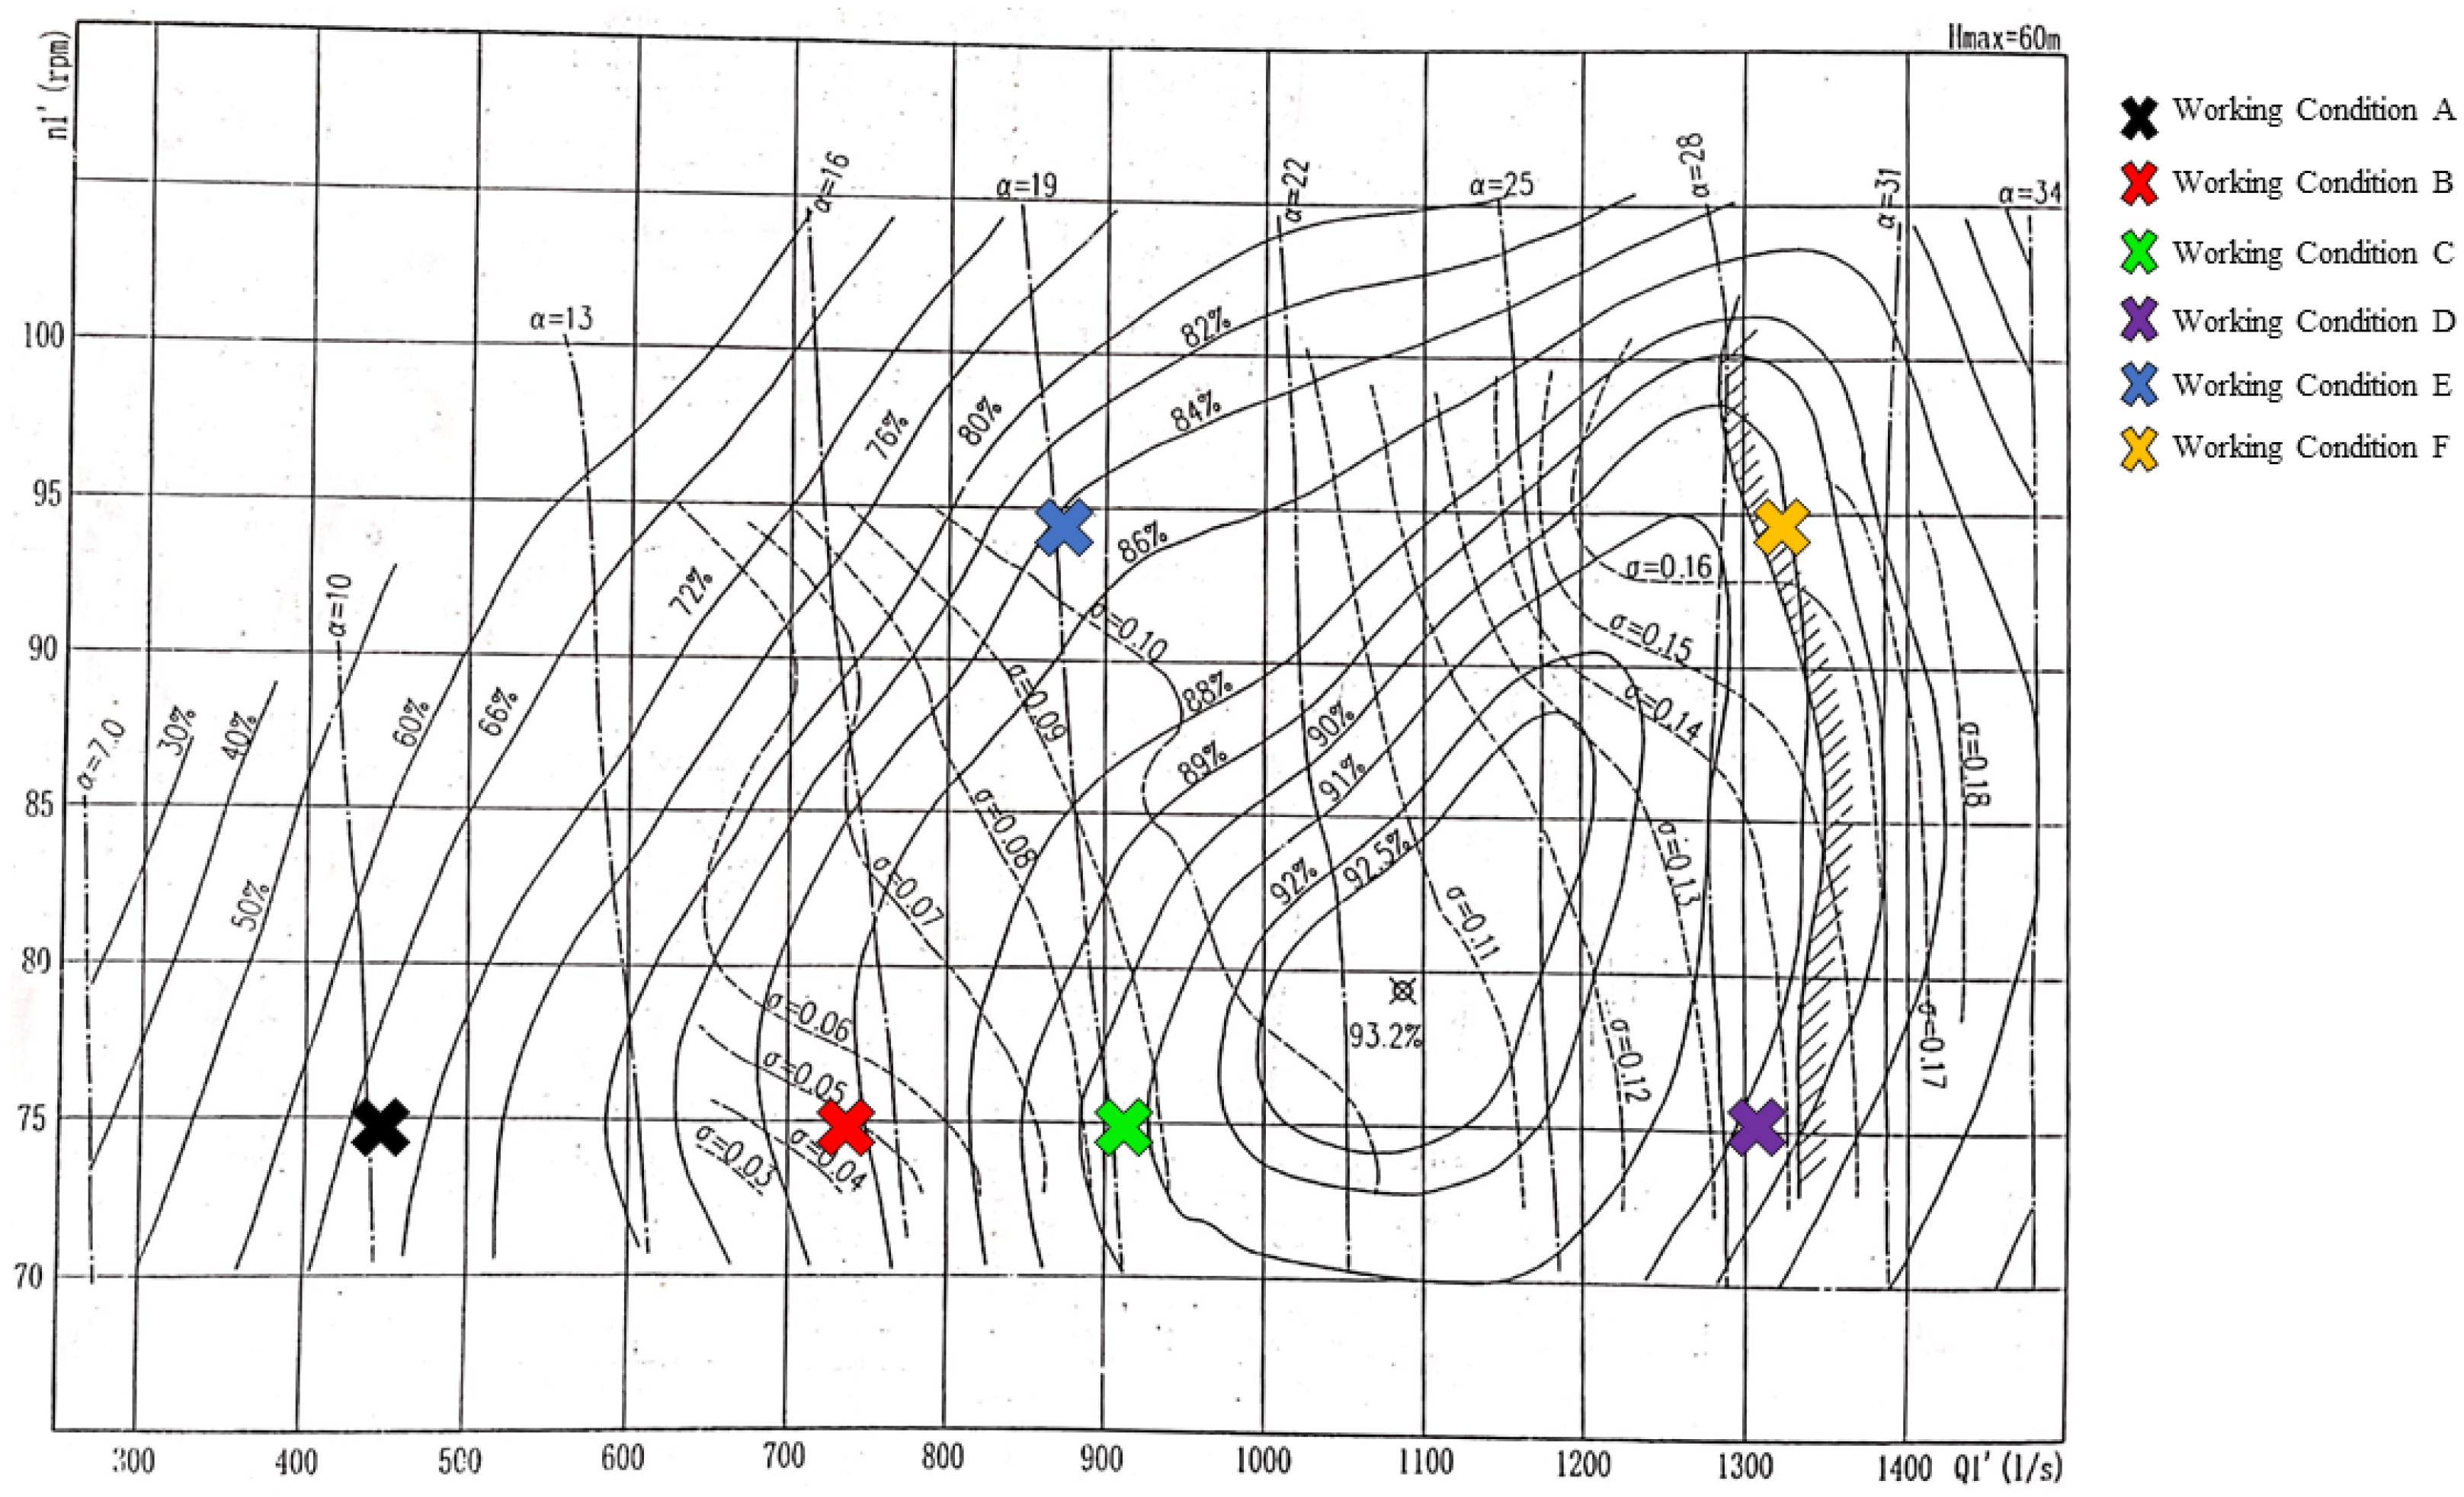
Figure 1. Calculation domain of Francis turbine.
Processes 09 01385 g001
Figure 2. The Francis turbine mesh.
Processes 09 01385 g002
Figure 3. Combined characteristic curve of Francis turbine HLA551-LJ-35.
Processes 09 01385 g003
Figure 4. Meridian sections of distributor and runner. Note: (a1c1) are pressure contours; (a2c2) are velocity contours; and (a3c3) are fluid streamline diagrams.
Processes 09 01385 g004aProcesses 09 01385 g004b
Figure 5. Isosurface of vapor volume fraction of the blade passage and the vapor volume fraction of the pressure surface of the vane. Note: (a1d1) describe the vapor volume fraction of the pressure surface of the vane; (a2d2) describe the isosurface of the 1% of the vapor volume fraction in the blade passage.
Processes 09 01385 g005
Figure 6. The vapor volume in the runner changes with the opening of the movable guide vane.
Processes 09 01385 g006
Figure 7. Time-history curve and frequency spectrum analysis of vapor volume in the runner under working condition A (23% Pn; part-load condition). Note: Nondimensional frequency represents the ratio of simulated frequency to rotating frequency.
Processes 09 01385 g007aProcesses 09 01385 g007b
Figure 8. Structure of channel vortex captured by Q criterion. Note: (ac) describe channel vortex structures captured by Q criterion.
Processes 09 01385 g008
Figure 9. Channel vortex observed in experiment [17,27]. Note: (a,b) are the channel vortexes observed in the experiment.
Processes 09 01385 g009
Figure 10. Velocity triangle. Note: α1, α2 and α3 are the absolute flow angles at the inlet (°); β1, β2 and β3 are the relative flow angles at the inlet (°); U1, U2 and U3 are circumferential speeds (m/s); W1, W2 and W3 are relative velocities (m/s); and V1, V2 and V3 are absolute velocities (m/s).
Processes 09 01385 g010
Figure 11. Contours of static pressure distribution on the wall of runner vanes. Note: (a1f1) are contours describing the pressure distribution of the pressure surface of the blade; (a2f2) are structures of channel vortexes captured by Q criterion in the blade passage; and (a3f3) are contours describing pressure distribution in the suction surface of the vane.
Processes 09 01385 g011
Figure 12. Pressure coefficient of the vanes at different elevations. Note: (a) shows the pressure coefficient of the vane’s suction surface at the elevation h/H = 40%; (b) shows the pressure coefficient of the vane’s suction surface at the elevation h/H = 75%; (c) shows the pressure coefficient of the vane’s pressure surface at the height h/H = 40%; (d) shows the pressure coefficient of the vane’s pressure surface at the elevation h/H = 75%.
Processes 09 01385 g012
Table 1. Details of six working conditions.
Conditionα/mmα%n11/rpmQ11/(m3/s)ηPn%
A16.003374.940.360.7223
B26.175474.940.650.8650
C32.056574.940.830.9167
D48.7410074.941.220.91100
E32.056594.370.790.8660
F48.7410094.371.230.9199
Publisher’s Note: MDPI stays neutral with regard to jurisdictional claims in published maps and institutional affiliations.

