1. Introduction
Ballast is an essential structural component in most railway foundation systems. The primary function of the ballast layer is to resist the applied wheel loads from railway equipment through the tracks and to spread them uniformly to the underlying foundation material. Therefore, the mechanical behavior of the ballast is important for the stability and functionality of railway equipment. Voids usually exist within fresh, uniformly graded coarse aggregates that form a ballast layer. As ballast ages, such voids are filled with fine material, which is regarded as ballast fouling [
1]. The major sources of ballast fouling include: (1) infiltration of foreign fine material, and (2) mechanical degradation due to the particle breakage [
2,
3]. Ballast fouling can cause unfavorable effects, most notably, shear strength reduction that further impacts the performance of the railway system [
4].
The discrete element method (DEM) developed by Cundall and Strack [
5] has been used to investigate the mechanical behavior of fresh ballast [
6,
7,
8,
9,
10], as well as fouled ballast [
3,
4]. In previous studies, ballast fouling induced by infiltration of foreign fine material was simulated using two approaches. In the first approach, small particles are explicitly modeled and injected into the ballast assembly [
3,
11,
12]. This approach is computationally demanding due to the fine particle sizes and the significant increase in the number of particles [
5,
7]. The second approach relies on reducing the ballast particle surface friction angle without injection of new fine particles [
4]. In this case, the computational time is significantly reduced, and the influence of fine particles is reflected as lubricant between the ballast particles, thus affecting the interparticle friction angle [
3,
4]. The limitation of this approach is that the calibration process can be complex [
11] and it is sometimes difficult to replicate the exact response [
4].
Mechanical degradation, a major source of ballast fouling, produces approximately 75% of the fouling material under normal operating conditions [
13]. In other studies [
7,
14], ballast degradation was simulated using breakable particles subjected to dynamic loading. As ballast degradation takes place, particle size distribution (PSD) changes from uniform to a broader grading [
15,
16]. The degraded ballast assembly is represented in DEM analysis by reducing the size of particles using either 2D or 3D models. Experimental and numerical investigations [
3,
14,
15,
17] that examined the effect of ballast degradation on the material shear strength revealed results that can differ from those obtained numerically. It is, therefore, necessary to further explore the numerical approaches to come up with a simplified method that would allow for the effect of ballast degradation to be investigated.
In this study, a discrete element model is developed using Particle Flow Code software in three dimensions (PFC3D) [
18] to simulate the shear stress–strain behavior of conventional ballast material assembly under direct shear condition. A simplified computational approach is proposed to simulate foreign-material-induced ballast fouling. It captures the mechanical behavior of the ballast at various levels of void contamination using the so-called void contamination index (VCI). Model results are validated with experimental data under similar loading and boundary conditions. Empirical relationships between VCI and micro-mechanical parameters (effective modulus
E* and interparticle friction coefficient
μ) are developed to efficiently determine the required
E* and
μ for a given VCI ratio. The degraded particle assembly is tested using direct shear tests to obtain the shear strength properties. The impacts of degradation on the mechanical behavior of the ballast are discussed.
2. Modeling Ballast Particles
Modeling irregularly shaped particles in a discrete element model can realistically reflect the mechanical interaction between ballast particles, as it allows for sufficient interlocking to develop and minimizes excessive rolling [
19]. Particle shape characteristics (i.e., angularity and flakiness) are known to affect the shear stress–strain behavior of ballast assembly [
20,
21,
22]. In this study, a sample of railway ballast is obtained from Quebec, Canada, from which nine particles are randomly selected to represent typical particle size and shapes. The Bubble-Pack algorithm built in PFC3D is used to generate the irregular-shaped particle clumps based on the scanned three-dimensional ballast contours [
23,
24]. A clump is defined as a group of spheres of different sizes clustered into one unbreakable particle that acts like a single ballast particle in the DEM model [
25].
Two parameters (
φ and
ρ) are usually specified in the Bubble-Pack algorithm to control the co-ordinates and the size of the spheres within the clump. The angle
φ represents the maximum intersection angle between two pebbles, whereas
ρ is the ratio of the smallest to the largest sphere size. The effect of varying
φ and
ρ on the shapes of the generated clumps is shown in
Figure 1. As can be seen, increasing the interaction angle,
φ, results in a much smoother clump surface, whereas decreasing the size ratio of the spheres,
ρ, value results in a finer clump shape.
Normally, a large number of spheres is required for the algorithm to generate a realistic clump shape. However, the computational cost will proportionally increase. A balance is, therefore, needed between the number of particles required to sufficiently simulate the various ballast shapes and the cost of the analysis. In this study, the nine irregular-shaped clumps shown in
Figure 2 are generated using several spherical particles that range between 10 and 16. These shapes approximately represent, to a large extent, the overall geometry of the investigated ballast particles and, at the same time, resulted in significant cost saving to the computation process.
3. Contact Model
The linear contact model (LCM) has been shown by researchers to be efficient in describing ballast interaction under different loading conditions [
3,
6,
7,
10,
26]. The LCM, described in
Figure 3, is usually used in discrete element analysis to represent particle–particle contact (PPC), as well as particle–wall contact (PWC).
The micro-mechanical parameters that need to be defined in PFC3D include the effective modulus
E* and the normal-to-shear stiffness ratio
k*. These parameters are related to the normal and shear stiffness of the LCM as follows:
where
kn is the contact stiffness in the normal direction and
ks is the contact stiffness in the tangential direction.
R and
L are geometry parameters of the contact described in
Figure 3a,b. The contact stiffnesses are automatically scaled based on the individual particle size and the specified
E* and
k* values. Hence, the mechanical behavior of particle assemblies is associated with the elastic modulus and the Poisson’s ratio at the macroscopic level [
6].
The interparticle friction coefficient
μ is a local contact surface property that controls the slip behavior between particles. Slip would occur when the contact shear force (
) is greater than the shear resistance. The shear resistance in the LCM is defined as:
where
is the shear resistance and
is the normal contact force. A higher interparticle friction coefficient
μ implies higher shear resistance and, hence, higher resistance to shear slip. This means that the overall stiffness and shear strength of the ballast assembly will increase [
27].
Particle kinematic is calculated iteratively in the discrete element model for each time-step. The time-step should not generally exceed a critical value to ensure that disturbance only propagates from the particle to its immediate neighboring particle [
28]. The critical time-step,
, used in PFC
3D is determined using Equation (6) below:
where
m is the smallest particle mass and
K is the contact spring stiffness [
29]. The critical time-step generally increases with the increase in particle sizes or the decrease in contact stiffness.
4. Model Setup and Calculation Procedure
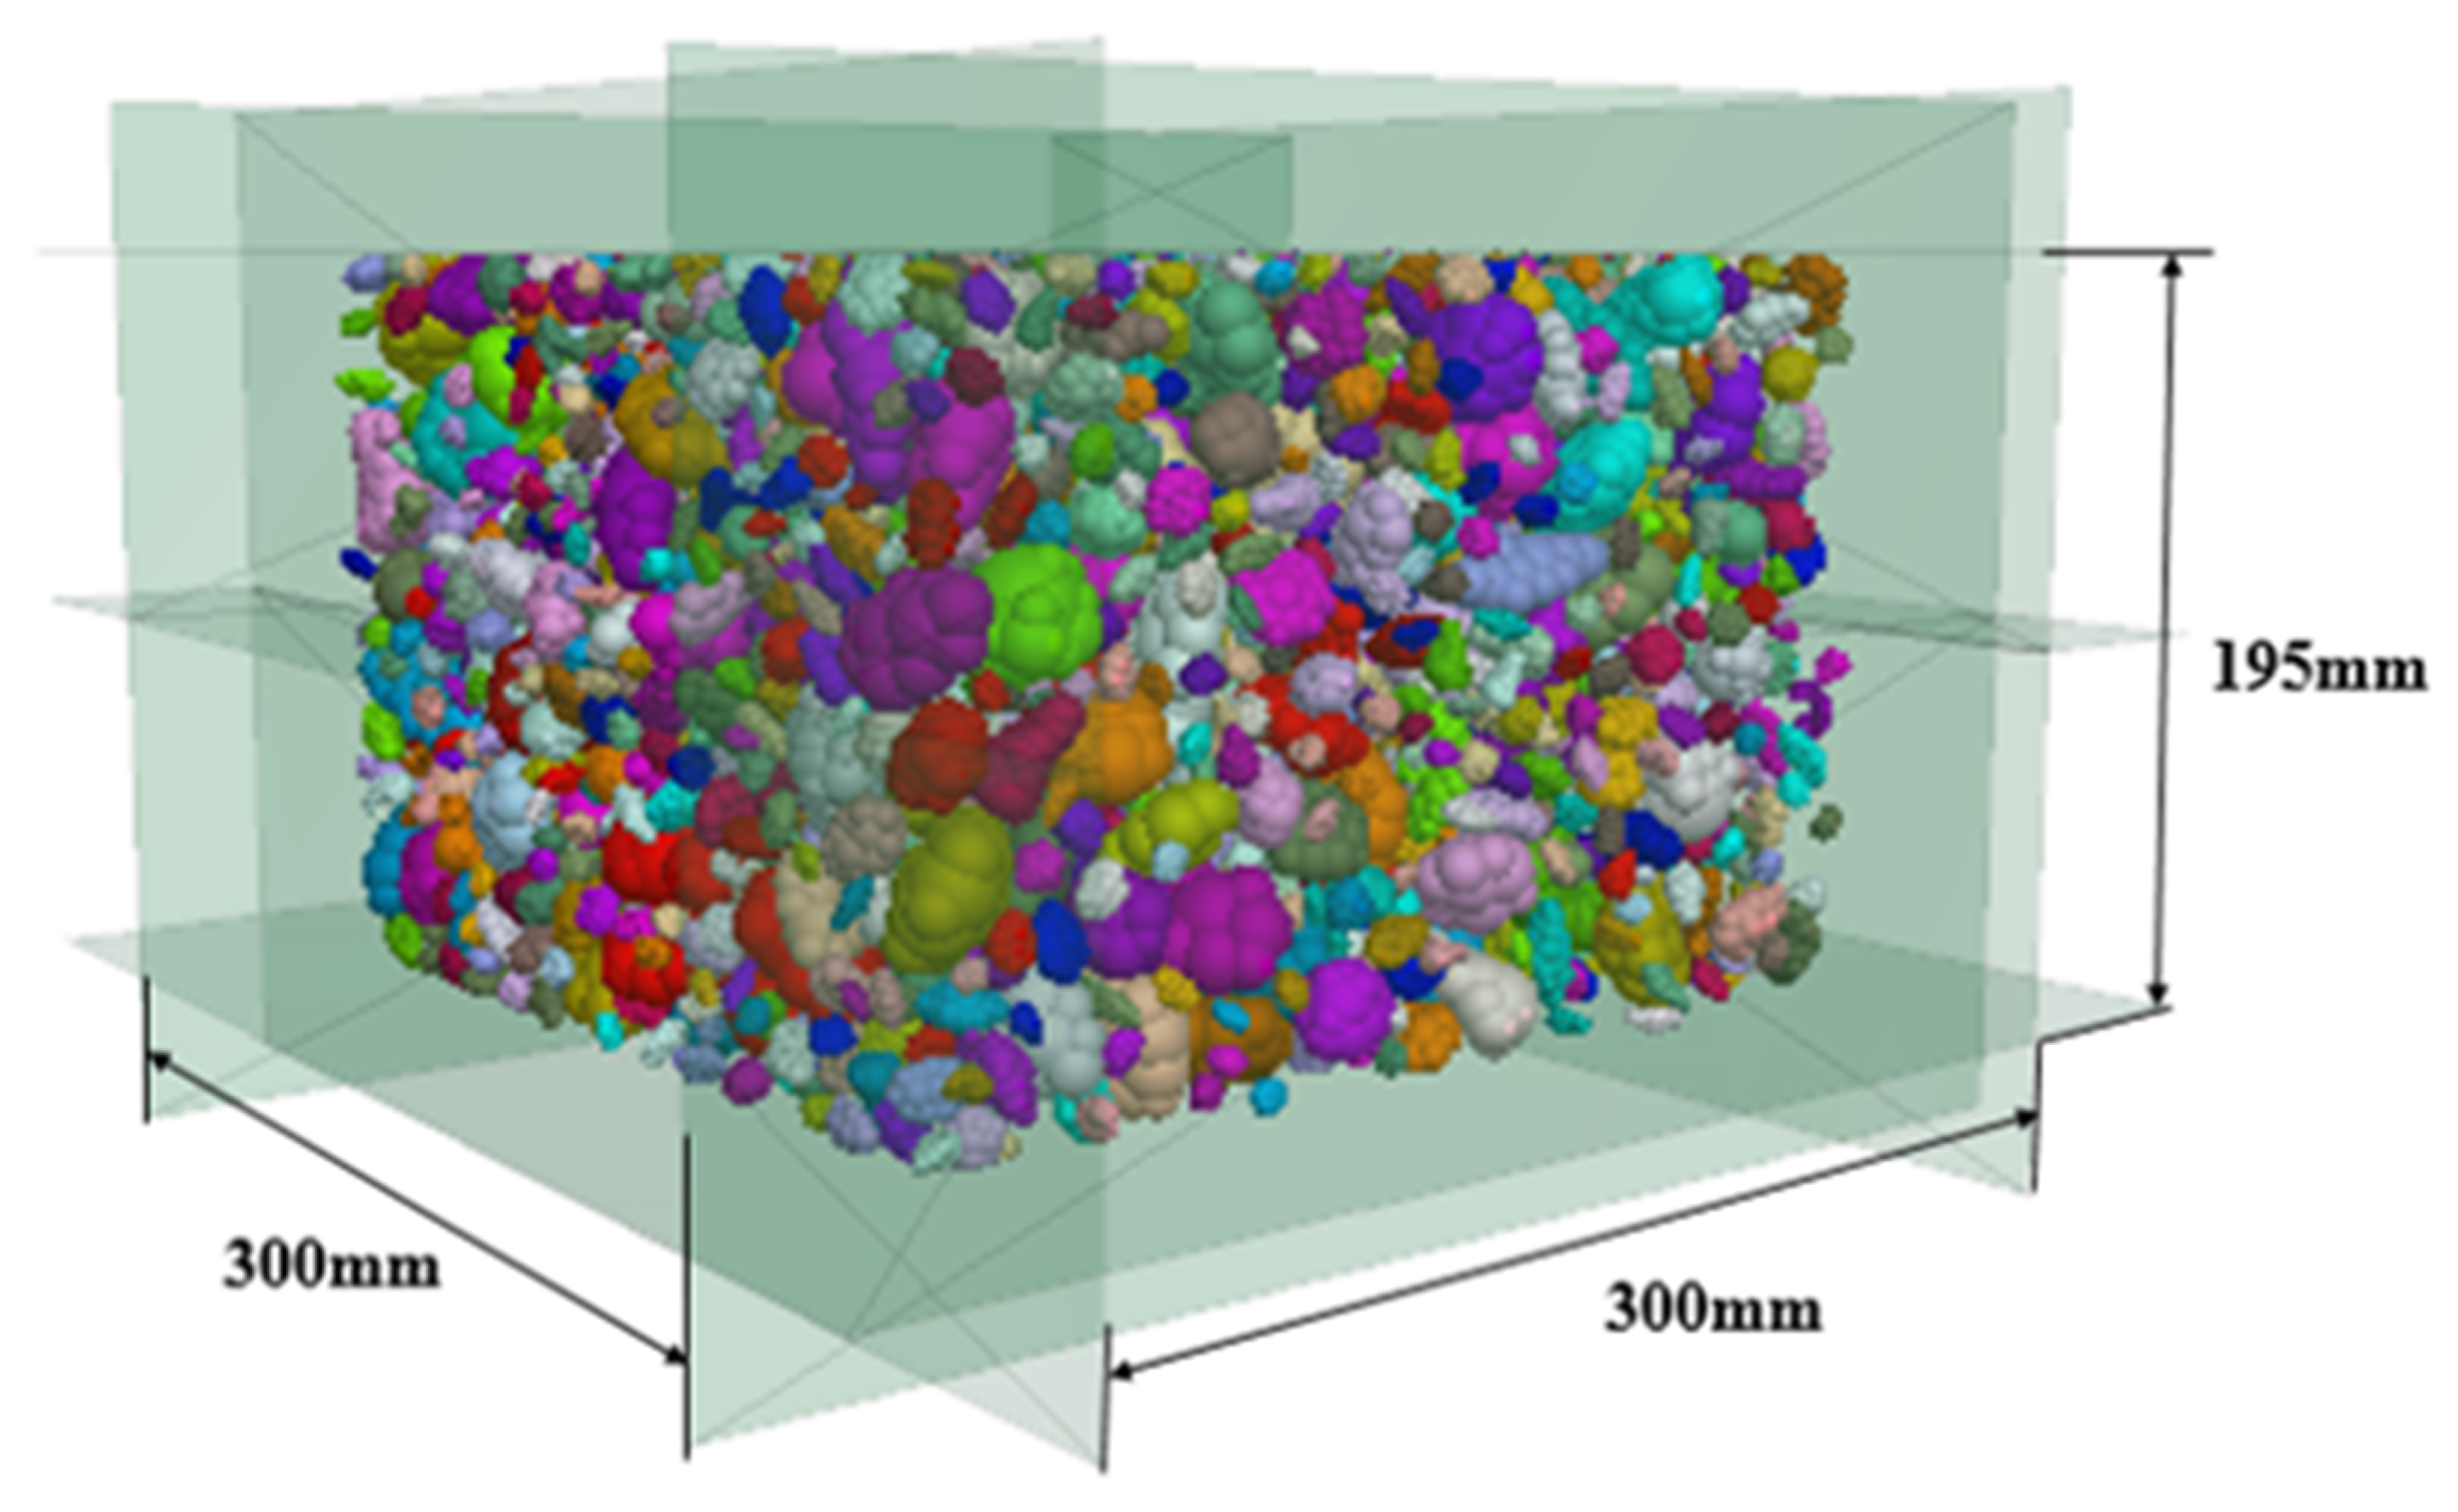
Indraratna et al. [
30] conducted a series of direct shear tests to examine the mechanical behavior of ballast fouled by coal dust at different contamination levels. The experiments were performed using a shear box measuring 300 mm × 300 mm × 195 mm. In this study, the direct shear tests are numerically simulated considering the dimensions and boundary conditions used in the experiments.
The numerical model used to simulate the direct shear test with the ballast assembly generated, using the irregular particle shapes presented earlier, is shown in
Figure 4. The linear contact model is used to represent the contacts between particles, as well as between particles and the walls of the box, in both the normal and tangential directions. A total number of 8424 particles (density = 2700 kg/m
3) are randomly generated within the shear box. Typical ballast gradation, in practice, ranges from a maximum of 50–76 mm to a minimum of 12–20 mm, depending on the type of rail. However, in the experimental work of Indraratna et al. [
30], the particle size ranges from 1.5 mm to 40 mm, as shown in
Figure 5. Therefore, downscaling was deemed necessary to fit the PFC model with the experimental results by Indraratna et al. [
30]. Considering that computing time is exponentially proportional with smaller particle size, it is impossible to replicate the lower limit of 1.5 mm in
Figure 5. Therefore, it was rationalized that downscaling would apply to the ¾ inch sieve (19 mm) representing 0–10% ballast by weight in practice. This resulted in a particle size distribution that ranges from 7.5 to 40 mm. This is in line with the discrete element modeling by Indraratna et al. [
3] for the same ballast sample. The randomly oriented particles are then cycled to satisfy the required porosity and to reach an equilibrium state inside the box. The porosity of the ballast assembly after initial packing reached 0.45, which is consistent with that reported in the experiment.
After the system has reached equilibrium, normal stress is applied at the top and bottom of the assembly (see
Figure 6a) and kept constant by adjusting the velocity of the top and bottom plates, utilizing the servo-control feature in PFC. The lower section of the box is then moved horizontally under a constant rate to apply the shear force on the ballast assembly [
31]. A slow rate of shearing of 0.4 mm/s is used throughout the analysis. This rate was chosen by comparing the shear stress–strain results for different shear rates (from 0.04 mm/s to 40 mm/s) to avoid unduly sample disturbance during shear [
3,
27,
32] and to save on computational time. At 40 mm shear displacement, the assembly would reach a maximum shear strain of about
εs = 13.3%.
The forces acting on the shear box are shown in
Figure 6b. The normal force (
FN) acting on the shear plane is equal to the normal load applied to the assembly, whereas the shear force (
FS) is equal to the sum of the horizontal forces in the upper section that can be calculated as follows.
where
Fn1 and
Fn2 are the normal forces acting on the left and right walls of the box,
Fs1 is the shear force on the top plate, and
Fs2 and
Fs3 are the shear forces on the front and back walls, as shown in
Figure 6b. The normal and shear stresses
and
acting on the shear plane are calculated using Equations (8) and (9) below:
where
and
are the length and width of the shear box (see
Figure 4). The lower section moves at a constant rate
, which means that, after a time
has elapsed, the shear area would be
.
5. Modeling Fresh Ballast Assembly
The discrete element model is first validated using the results of the direct shear tests performed on fresh ballast under three different normal pressures, namely, 27 kPa, 51 kPa, and 75 kPa. To choose a suitable interparticle friction coefficient (
μ) for the modeled material, sensitivity analysis was performed by modeling the shear stress–strain response under applied normal stress of 51 kPa. This is achieved by incrementally increasing
μ value in five stages, 0.1, 1.1, 2.1, 3.1, and 4.1, respectively. Results showed that an interparticle friction coefficient of 2.1 or less could not capture the strain-softening behavior of the material. Some improvement is found when
μ increased from 3.1 to 4.1. A value of 4.1 is, therefore, used in this study. The micro-mechanical parameters used in model validation are summarized in
Table 1. The modeling results are presented in
Figure 7, along with the experimental data.
The trends of the computed responses are found to be in general agreement with the laboratory test results. It can also be seen that the DEM simulation is able to reproduce, to a large extent, the strain-softening behavior of the ballast material under applied normal stresses of 27 kPa and 51 kPa. Under normal stress of 75 kPa, however, the discrete element model overestimated the shear strength at shear strain of more than 7%. This may be attributed to possible ballast particle breakage in the shear box during the experiment under high normal stress (75 kPa). As particle breakage is not explicitly modeled in this study, the model may not capture the contribution of particle breakage to the softening response of the assembly [
16,
31].
In general, it can be concluded that the developed model performed reasonably well in capturing the overall shear stress–strain behavior of fresh ballast assembly under the investigated range of normal stresses. It is worth noting that, for typical 20 to 30-ton axle loads, the confining pressure within the ballast layer is usually in the range of 10–40 kPa and rarely exceeds 60 kPa [
33].
7. Modeling Fouled Ballast due to Particle Infiltration
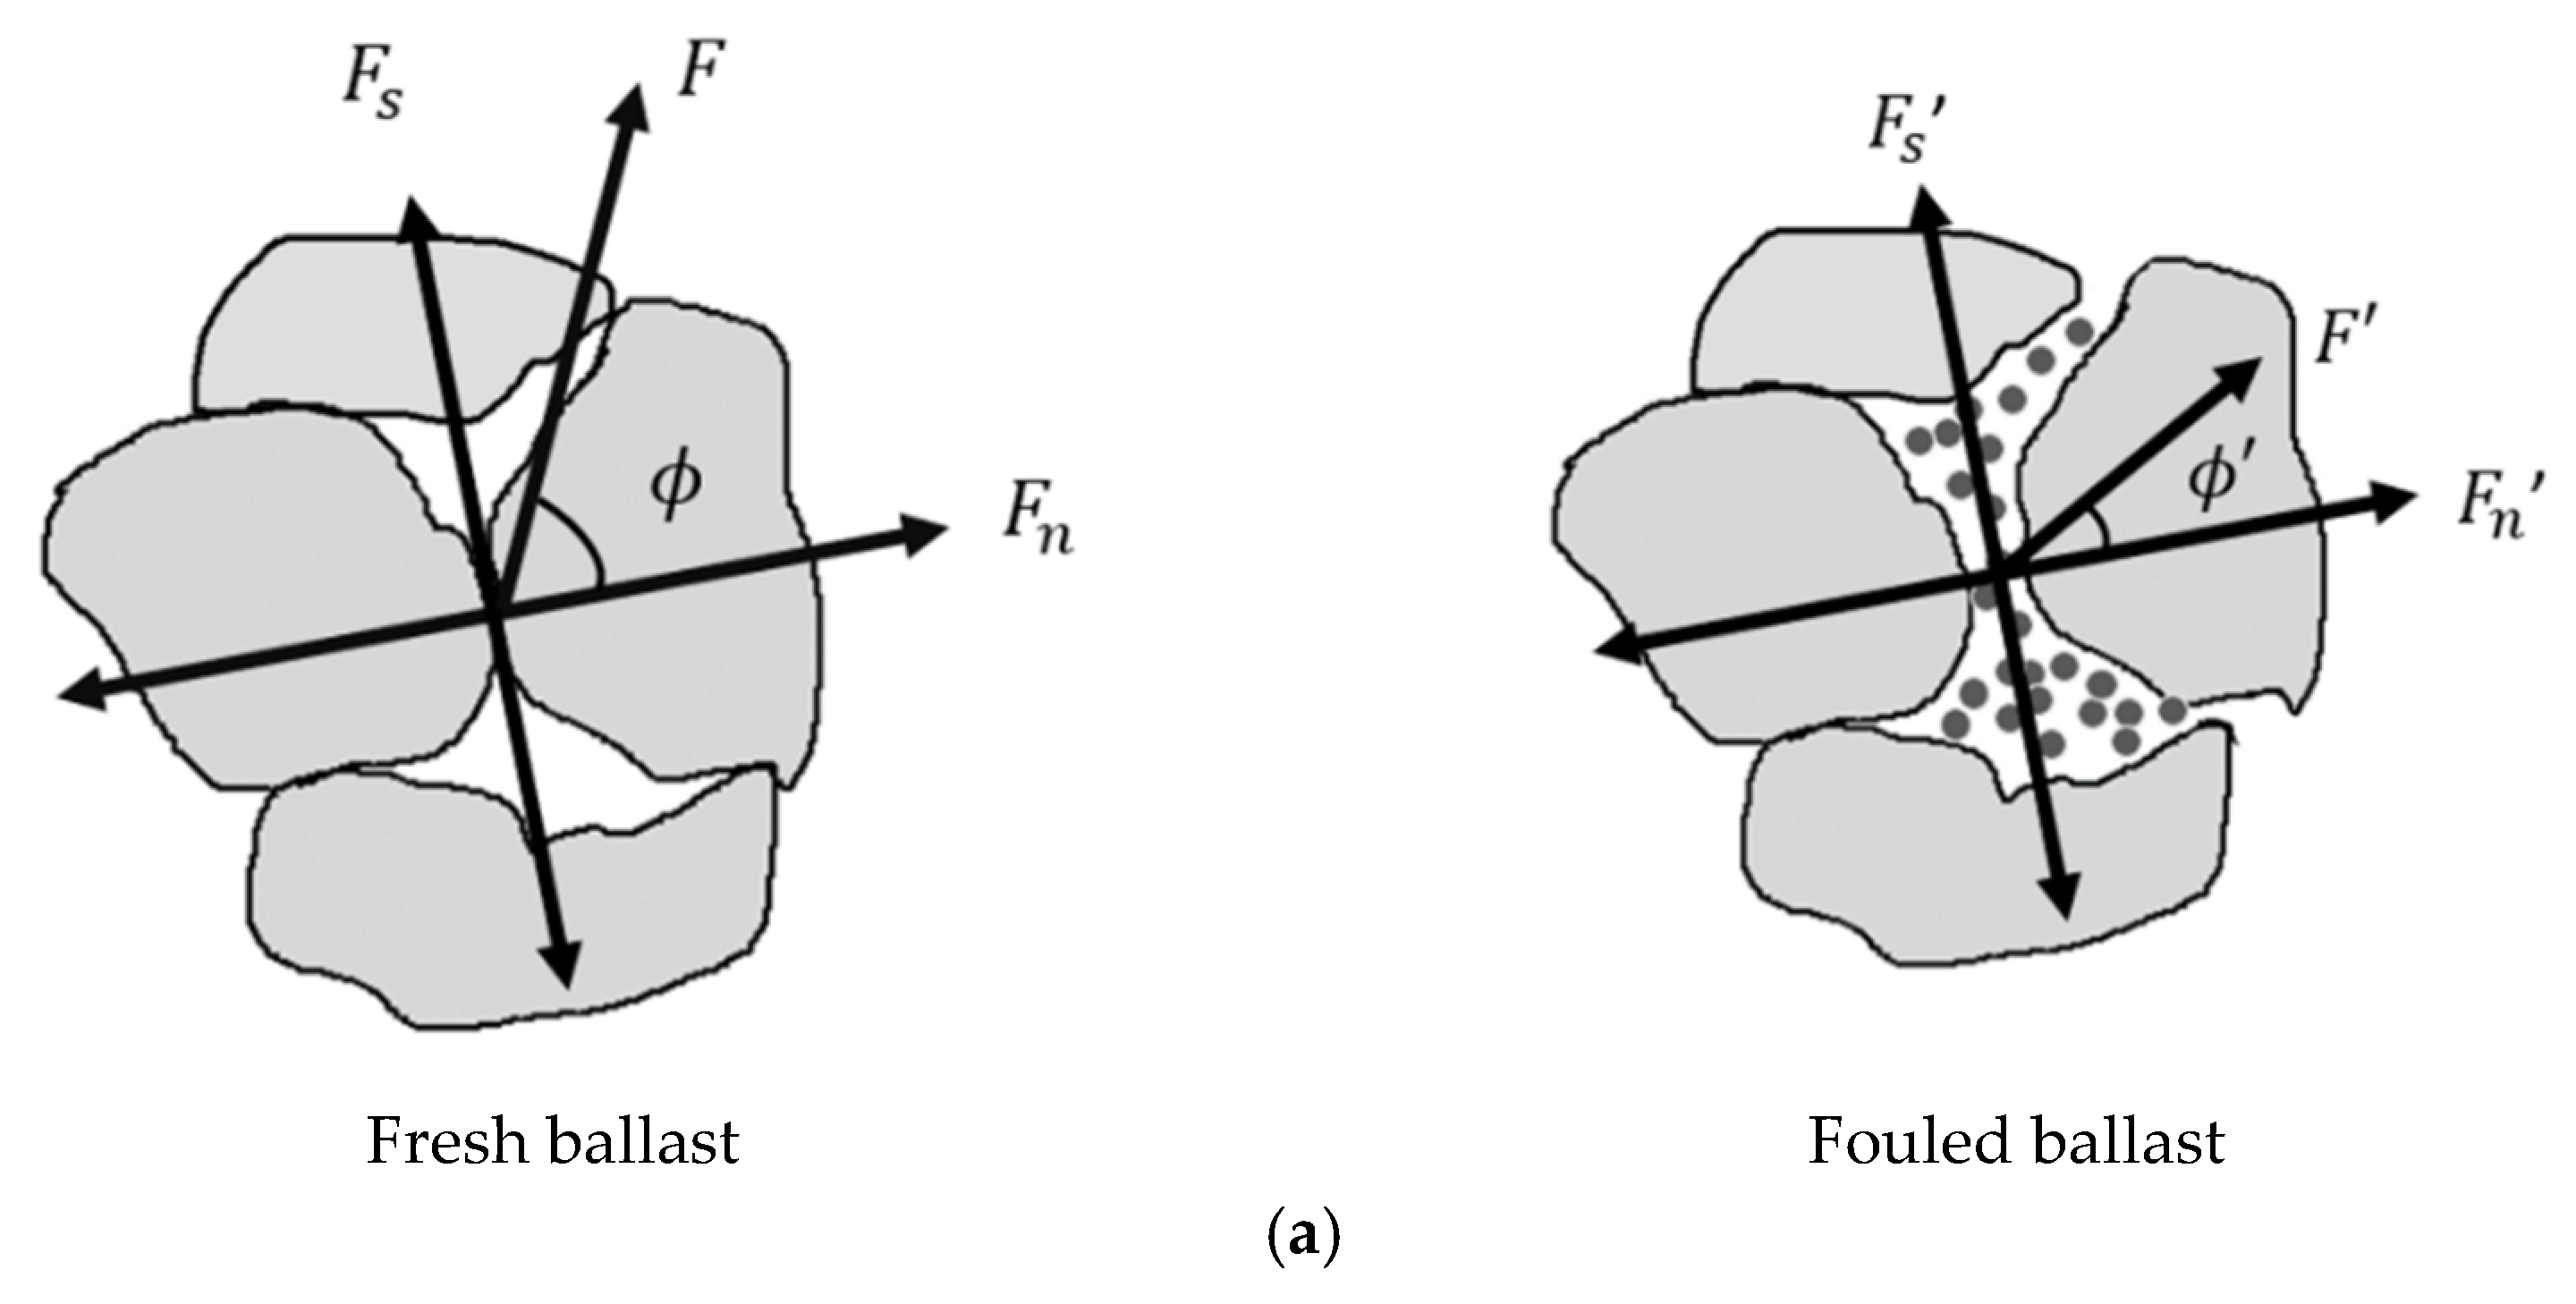
The approach adopted in modeling fouled ballast due to the intrusion of foreign material into the ballast assembly is illustrated in
Figure 8.
Figure 8a shows that introducing external fines results in the interparticle force,
, changing to
, and the friction angle between particles
changing to
. In addition, as shown in
Figure 8b, the interparticle contact stiffness,
k1 of fresh ballast changed to a lower stiffness,
k2. With this modeling approach, the interparticle friction coefficient
μ and effective modulus
E* are also reduced [
34].
Void contamination index (VCI) represents the percentage of the voids within the fresh ballast assembly that is occupied by fouling material [
35]. It is expressed as:
where
is the void ratio of the fouling material;
is the void ratio of the fresh ballast;
is the specific gravity of the ballast;
is the specific gravity of the fouling material;
is the dry mass of the fouling material; and
is the dry mass of the fresh ballast. VCI can be used to effectively represent the level of the foreign material in the ballast.
Figure 9 compares the shear response of fouled ballast, calculated using the proposed model, and the experimental data for three different VCI ratios, 20%, 40%, and 95%, respectively. The effective modulus
E* and the interparticle friction coefficient
μ for each VCI ratio are summarized in
Table 2. The figures show typical strain-softening responses for the three investigated VCI ratios, which are reasonably captured by the model. The maximum shear stress values were found to slightly decrease with the increase in VCI ratio. For the investigated range of confining stress, the shear stress–strain model reasonably predicted the shear response of the fouled ballast assembly. In addition, the adopted approach used to model the different VCI levels by reducing the effective modulus
E* and the interparticle friction coefficient
μ seem to be efficient and save about 40% of the computational time.
8. Estimating the Micro-Properties and Shear Strength of Fouled Ballast
Empirical correlations between the VCI and the micro-properties of the ballast assembly
E* and
μ can be obtained by plotting the relationships depicted in
Figure 10a.
The relationship between VCI and effective modulus is approximated using a power fit described by Equation (11). The effective modulus rapidly decreased from 18 Pa to about 5.5 Pa with the increase in VCI from 0% (fresh ballast) to about 20%. Little change in effective modulus was found for VCI of more than 20%.
The relationship between VCI and interparticle friction coefficient is characterized by a linear decrease with the increase in VCI, as shown in
Figure 10b. The relationship can be described by Equation (12) below.
These relationships are useful for estimating the micro-parameters
E* and
μ of a fouled ballast for a given VCI ratio. To validate these two expressions, a series of discrete element analyses was performed and used to calculate
E*,
μ values for a given VCI ratio and compare the results with experimental data. The results are presented in
Figure 11 for a range of applied normal stresses. For VCI = 70%, the estimated
E*,
μ using the above expressions are found to be 5.15 MPa and 2.7, respectively. By inspecting the 45° line in
Figure 11, the calculated strength was found to be in good agreement with the experimental data, which confirms the validity of the above expressions under direct shear conditions.
Figure 12 shows the shear strength envelopes generated using the power-fitting expressions for different VCI ratios. In addition, both the experimental and numerical data are also presented. The power equations used to calculate the shear strength in each case are given below:
where the shear and normal stresses,
τf and
, in the above equations are expressed in kPa.
These envelopes suggest that the ballast shear strength is proportional to the applied normal stress and inversely proportional to the VCI ratio. For normal stress of 51 kPa, increasing VCI from 0% (fresh ballast) to 20% resulted in a significant decrease in the shear strength from about 90 kPa to about 75 kPa. An additional increase in VCI from 20% to 40% resulted in a moderate change in shear strength from 75 kPa to about 65 kPa. A further increase in VCI to more than 40% did not cause significant change in the shear strength of the fouled ballast.
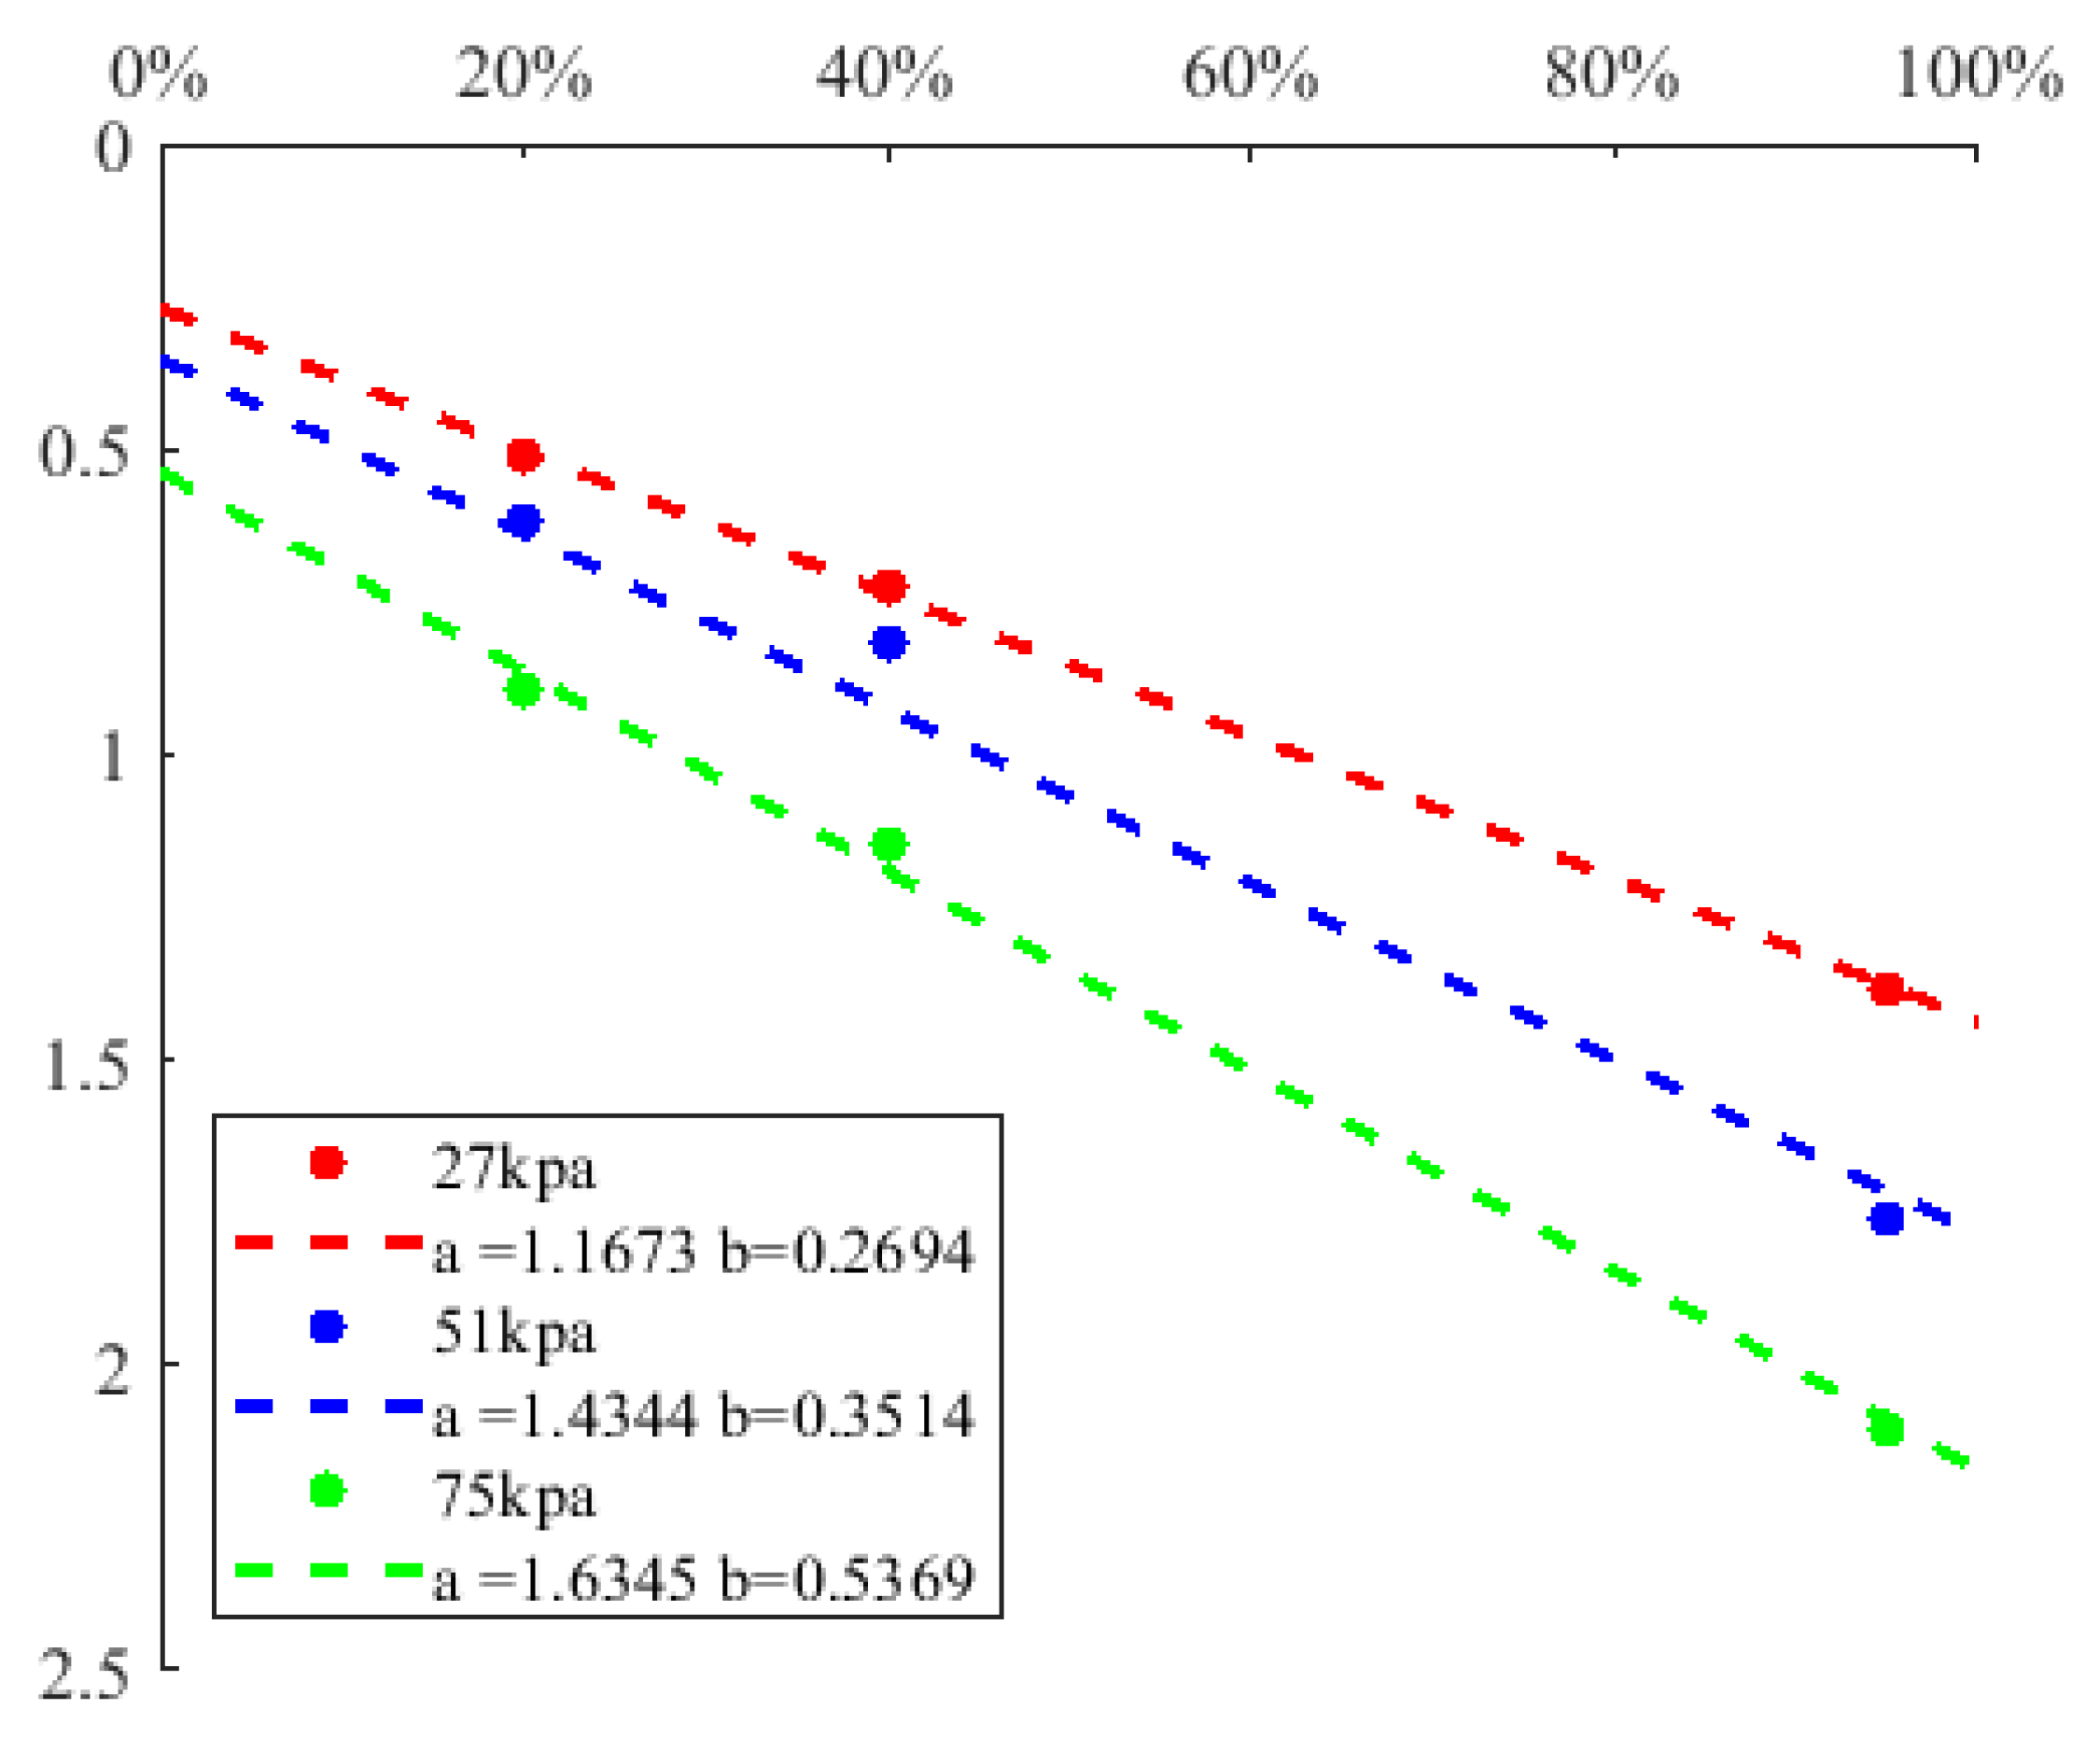
The normalized shear strength of the fouled ballast can be related to VCI ratios and is determined using the hyperbolic relationship below [
11]:
where
is the shear strength of fouled ballast sample,
is the shear strength of fresh ballast sample, and
a and
b are hyperbolic constants that depend on the normal stress level. The linear relationship between the reduction in shear strength and VCI ratio can be obtained by rearranging Equation (18) as follows:
The hyperbolic constants
a and
b are determined using linear regression, as illustrated in
Figure 13, which are based on Equation (19). This expression is useful in estimating the shear strength reduction for a given VCI ratio.
9. Modeling the Effects of Ballast Degradation on Shear Strength
Ballast degradation generally causes the initial particle size distribution (PSD) to gradually shift to a degraded PSD with a wider range of particle sizes. The degree of ballast degradation is usually measured using the breakage (
B) index [
36], which is defined as the ratio between (i) the area between the fresh and degraded PSDs; and (ii) the area of the cumulative PSD. To simulate ballast degradation at different fine levels, the particle sizes are incrementally reduced, as summarized in
Table 3. “It should be noted that this is an entirely different method from the one previously presented to simulate ballast fouling caused by foreign material injection whereby the microparameter properties were gradually decreased to simulate fouling. Therefore, in this section, a constant set of microparameters representing fresh ballast deemed sufficient.” The ballast samples are sheared under normal stress of 51 kPa, and the corresponding shear strengths are determined.
The shear strength results corresponding to different ballast degradation levels are plotted in
Figure 14a, along with the best fit line. The shear strength is found to gradually decrease from 140 kPa to about 80 kPa as the breakage index increased from 0% to 20%. No significant change in shear strength occurs as a result of further increase in the breakage index.
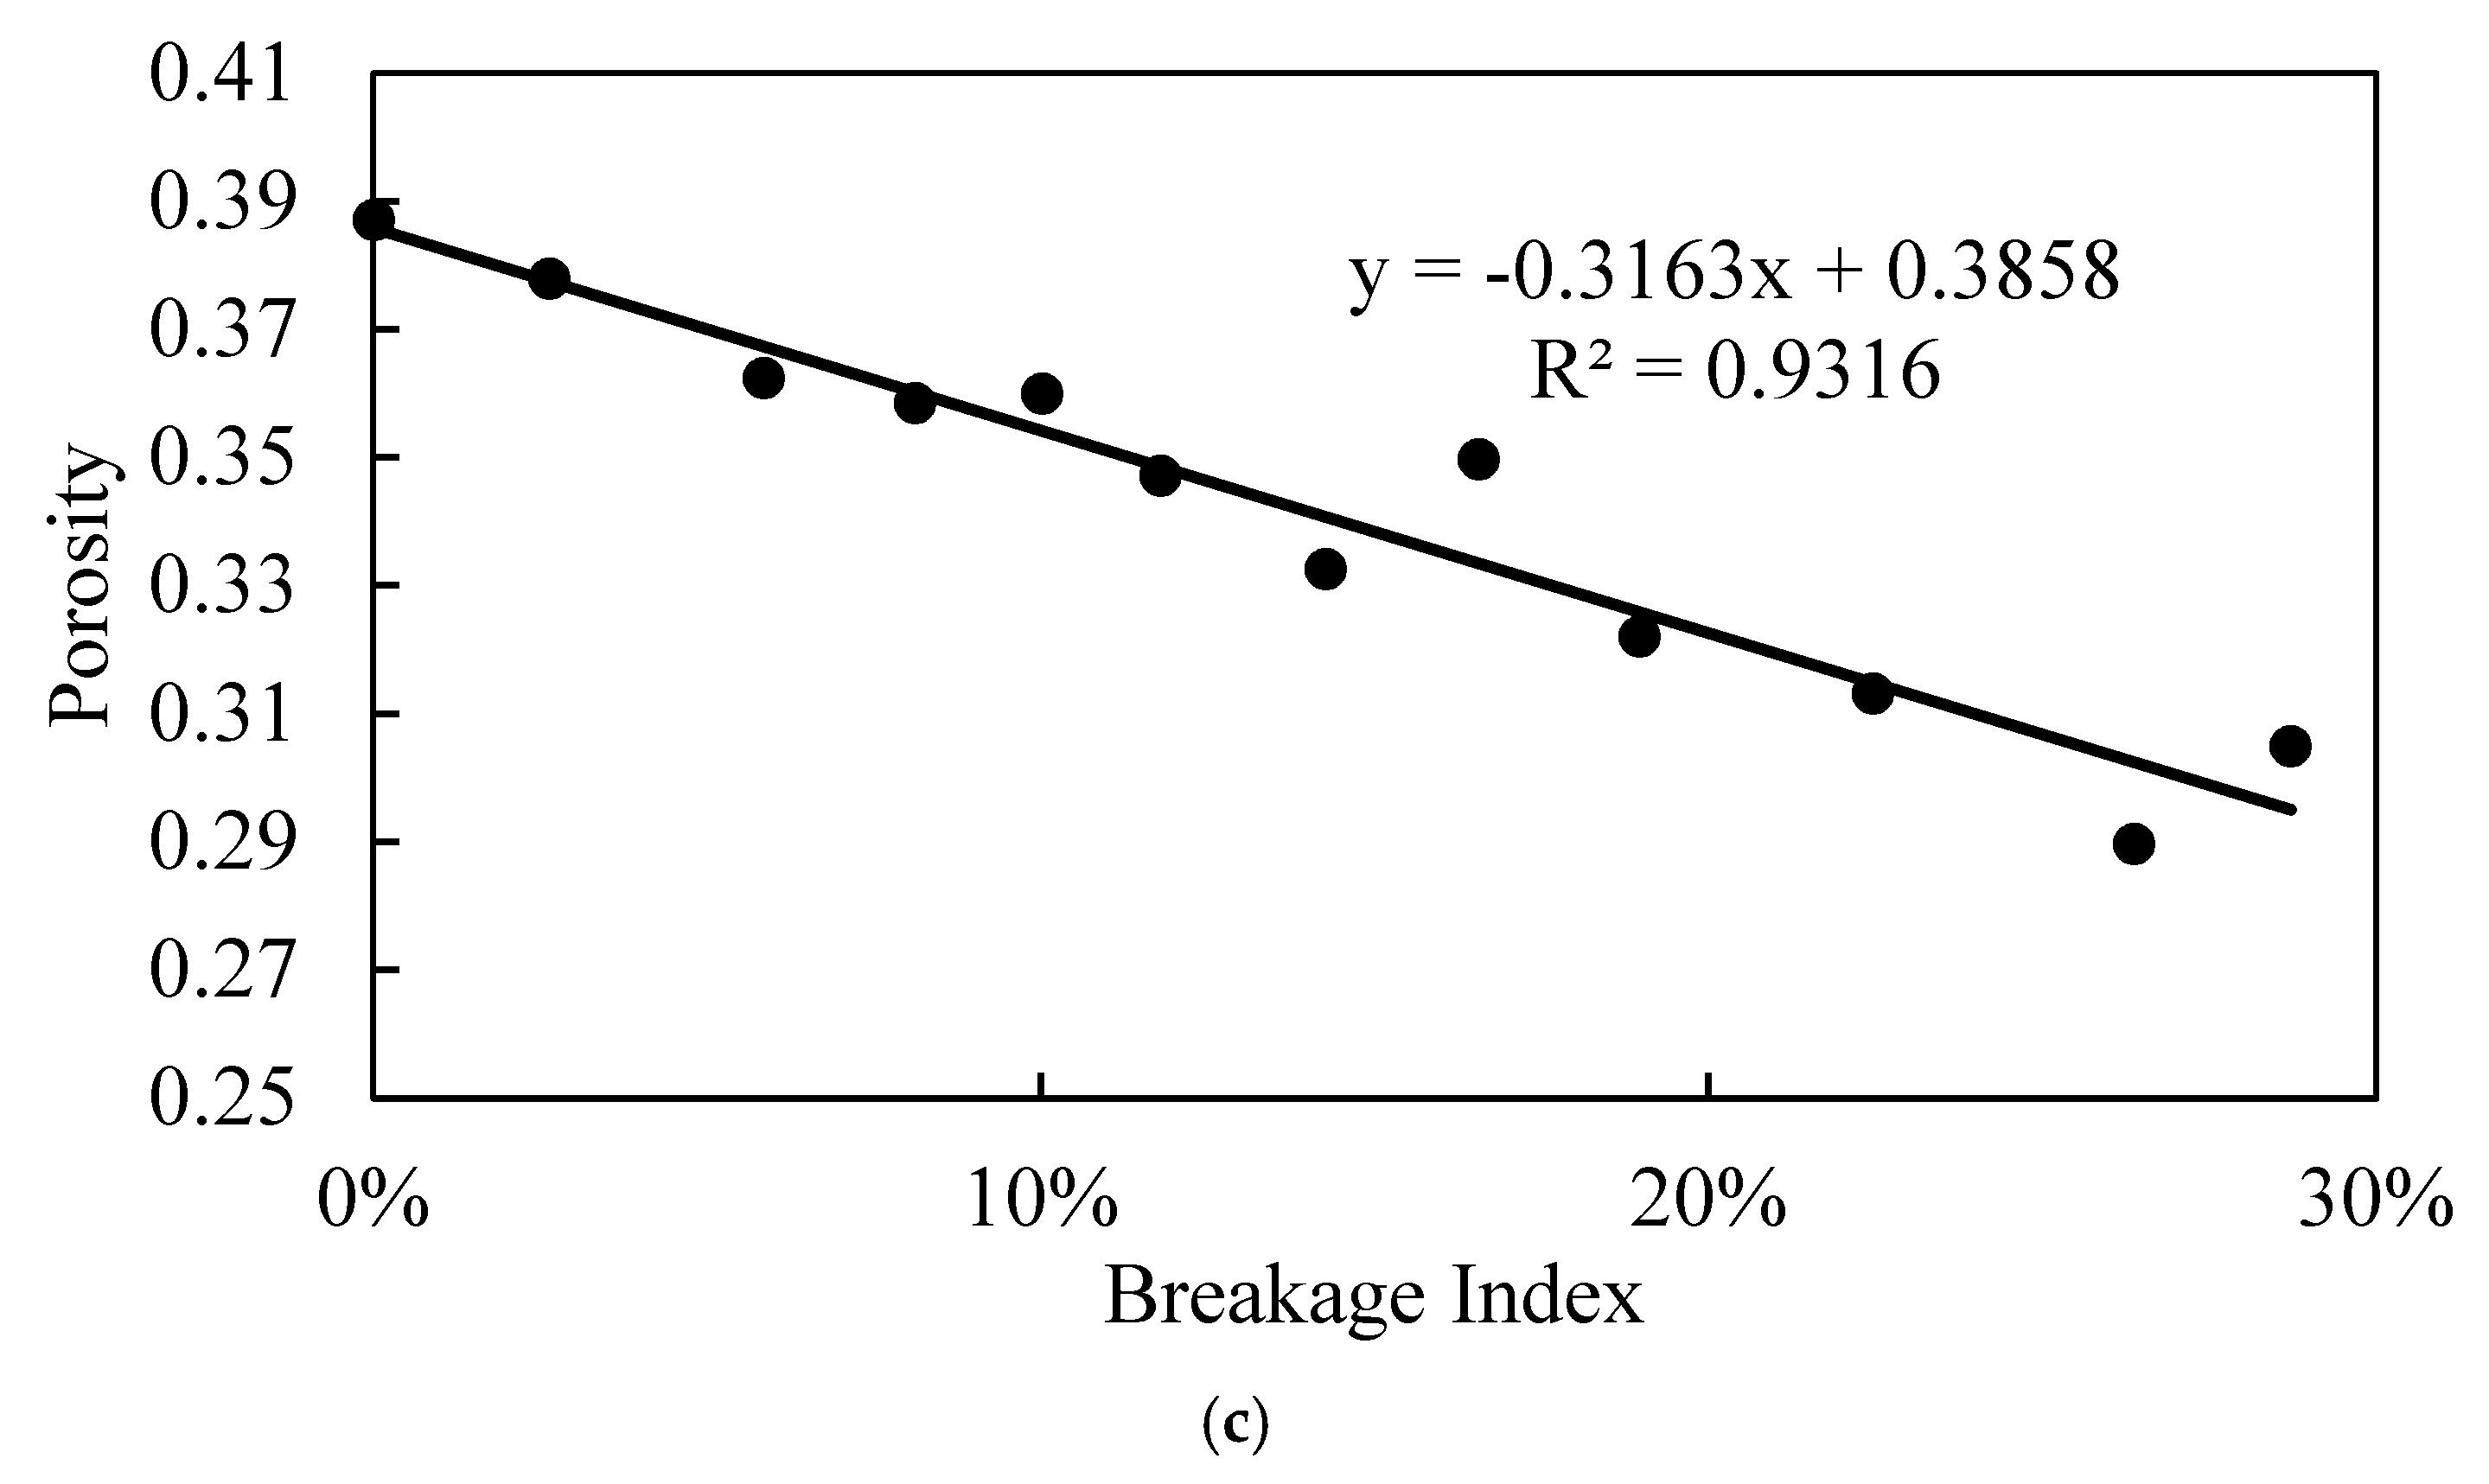
Figure 14b shows the change in co-ordination number with the increase in the breakage index. The co-ordination number was found to decrease to about half of its value when the breakage index reached 30%. Similarly, the porosity of the ballast assembly (seen in
Figure 14c) was found to decrease from about 0.39 to about 0.29 as the breakage index increased from 0% to about 30%.
10. Conclusions
In this study, the shear stress–strain behavior of both fresh and fouled ballast subjected to direct shear loading is investigated using the discrete element method. Simplified models that account for the intrusion of fine material and particle degradation are proposed. Empirical relationships between the micro-mechanical parameters and the void contamination index (VCI) are presented to help calculate the parameters needed for the analysis. The results are validated by comparing the numerical results with published experimental data. Shear strength envelopes for different levels of VCI are generated to examine the relation between the shear strength of the fouled ballast assembly and the VCI values. Increasing the range of particle size distribution is adopted as a tool to simulate the effect of ballast degradation on the shear strength of the assembly.
The analysis shows that reducing the effective modulus and interparticle friction coefficient can be used to numerically represent the condition where fine particles intrude fresh ballast. The modeling results were found to produce shear stress–strain responses that are consistent with the experimental data.
Finally, it is evident from the reported results that both infiltration of fines and particle degradation can negatively impact the shear strength of the ballast. That said, particle degradation alone is found to have significant effects on the strength of the ballast assembly that are comparable to those of fine particle infiltration.
It should be noted that, while the findings of this study are specific to the particle shapes and sizes investigated, the methodology presented herein to examine the influence of ballast fouling should be equally applicable to other ballast particle configurations.


