1. Introduction
As offshore resources deplete and the demand for energy grows of the energy, it is inevitable to seek improvements in the efficient use of energy and exploit undiscovered energy sources [
1,
2]. Deep-sea crude oil is a multiphase substance containing natural gas and seawater in addition to petroleum, and the application of the multiphase transport technology in crude oil transporting can reduce costs and improve efficiency. This is the reason why this technology stands out from many transport technologies [
3,
4]. The multiphase pump—the core equipment of the multiphase transport system—has both pump and compressor functions [
5,
6,
7]. In recent years, many scholars at home and abroad have studied aspects of the multiphase pump, including the IGVF, cavitation issues, etc., which has led to the further development of multiphase transport technology.
Gas-liquid two-phase flow is a common form of the multiphase flow. The flow characteristics are different owing to the different physical properties of the two kinds of medium. Moreover, the complex interaction force between the two phases and the constant change of flow pattern complicate the fluid flow [
8,
9]. Shi et al. [
10] studied the effect of the IGVF on the impeller work in the multiphase pump and found that the work capacity of the impeller fore area was greatly affected by the IGVF. Zhang et al. [
11] explored the energy characteristics of the multiphase pump by combining the experimental and numerical simulation and found that the multiphase pump efficiency decreased with an increase in the IGVF. Li et al. [
12] studied the effect of the IGVF on the pressurization performance of the multiphase pump and discovered the higher the IGVF, the greater the effect on the multiphase pump pressurization performance. Zhang et al. [
13] analyzed the internal flow and interphase interaction of the multiphase pump and found that the gas in the impeller mainly gathered near the hub, and the interphase force increased with an increase in the IGVF. Shi et al. [
14] studied the influence of the IGVF on the flow characteristics in the tip clearance and discovered that the trajectory and structure of the tip leakage vortex were significantly impacted by the IGVF. Moreover, the numerical simulation results were verified through high-speed photography. Zhang et al. [
15,
16] also carried out an experimental study on two-phase flow in the multiphase inlet and found the average bubble diameter increased as the IGVF increased. Additionally, some scholars have investigated the transient flow characteristics of the gas-liquid two phases in the multiphase pump [
17,
18,
19] and the pump performance under the condition of extremely high IGVF [
20] and have proposed a numerical analysis method to better study the effect of the IGVF on the pump flow characteristics [
21].
Cavitation often occurs in fluid machinery, causing fatigue damage of solid materials and thus further affecting the performance of the machinery [
22,
23,
24]. Thus, cavitation is an important issue in studying the performance of fluid machinery such as multiphase pumps, pump-turbines [
25] and so on. When the multiphase pump transports the multiphase media, it is easy for cavitation to appear under the condition of low inlet pressure. According to a study on hydrofoil, the cavitation evolution can be divided into three stages [
26,
27]. Azad et al. [
28] explored the effect of polymers with different concentrations on the cavitation performance of centrifugal pumps and found that the performance improved with the increase in concentration of polymers. Hao et al. [
29,
30] discovered that the cavitation evolution cycle of the hydrofoil was affected by the surface materials. Zhao et al. [
31] proposed the method of arranging rough on the suction surface of the blade leading edge to suppress cavitation. Tao et al. [
32] studied the effect of the blade inlet shape on the centrifugal pump cavitation performance and found the pump had a larger initial cavitation coefficient when the shape of the impeller inlet edge was circular and elliptical. In addition, there are many methods to control the cavitation development, such as the structural optimization of overflow parts [
33], arrangement of the surface obstacle or slotted blade [
34,
35,
36] and blade perforation [
37]. At the same time, some scholars also proposed new cavitation models [
38,
39], which can be used to predict cavitation more accurately. The above results can promote the development of cavitation research.
Based on the above literature, it can be seen that scholars seldom take the cavitation into account when researching the characteristics of the multiphase pumps, including energy conversion, etc. However, in the study of cavitation issues, the object is always the centrifugal pump; there is less focus on the cavitation under the two-phase condition. Consequently, it is essential to investigate the effect of the IGVF on the internal cavitation evolution of the multiphase pump and the work performance at each cavitation stage, considering simultaneously the IGVF and cavitation issue. The research results can provide a more comprehensive theoretical reference for improving multiphase pump performance.
3. Simulation Method
3.1. Computational Domain Meshing
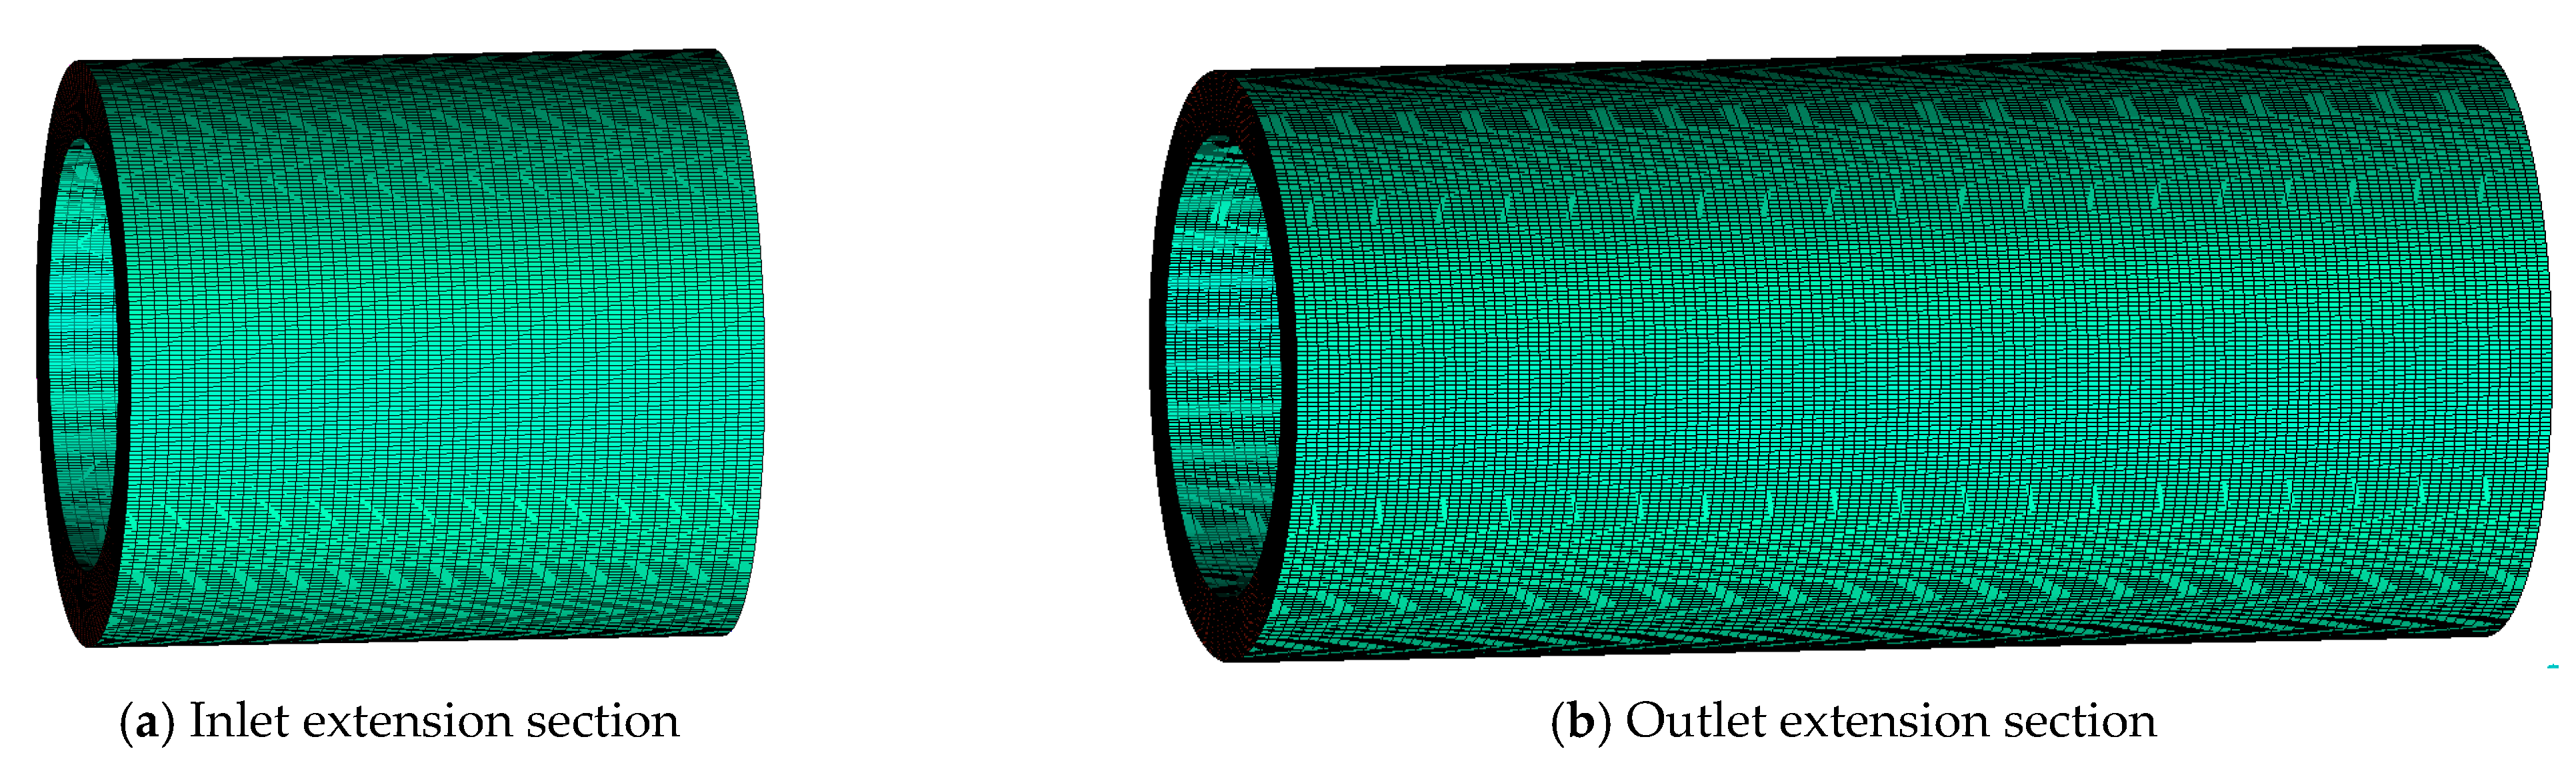
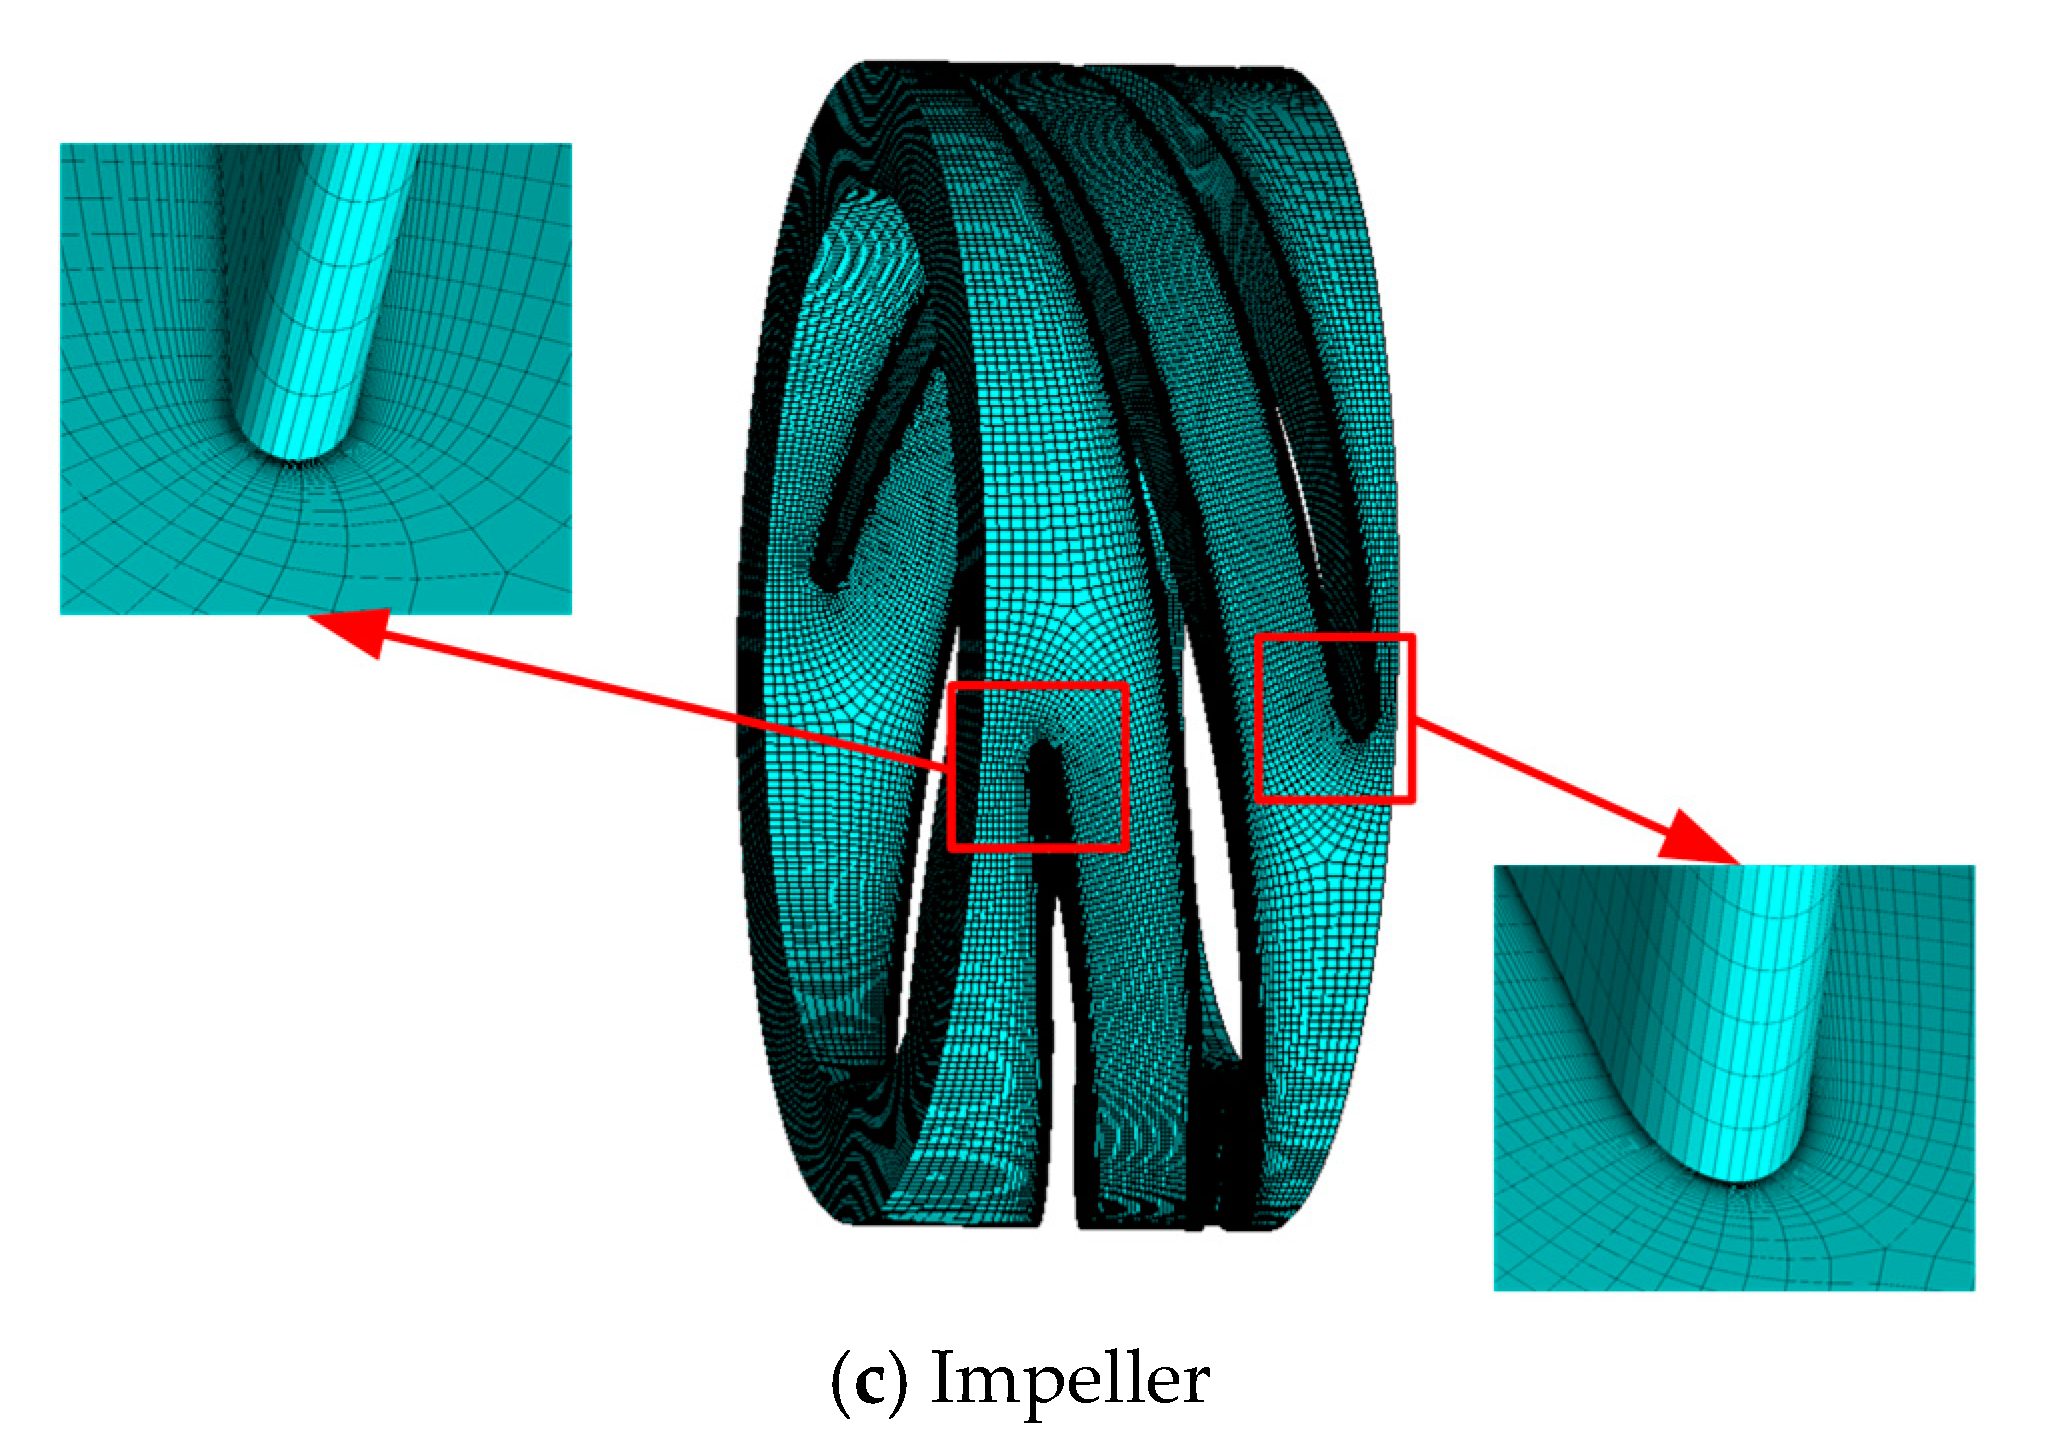
Owing to the large curvature of the multiphase pump blades, hexahedral mesh was used for the single channel of the impeller. Then, the mesh of the single channel was rotated and copied as the full channel, using ICEM software to divide the hexahedral meshes of the inlet and outlet extension sections. As is well known, the merit of hexahedral mesh division is that it can be used for mesh refinement at specific locations by adjusting the nodes, and therefore the flow situation in specific regions can be presented clearly. The computational domain meshing of the inlet and outlet extension sections and the impeller are shown in
Figure 2.
3.2. Mesh Independence Verification
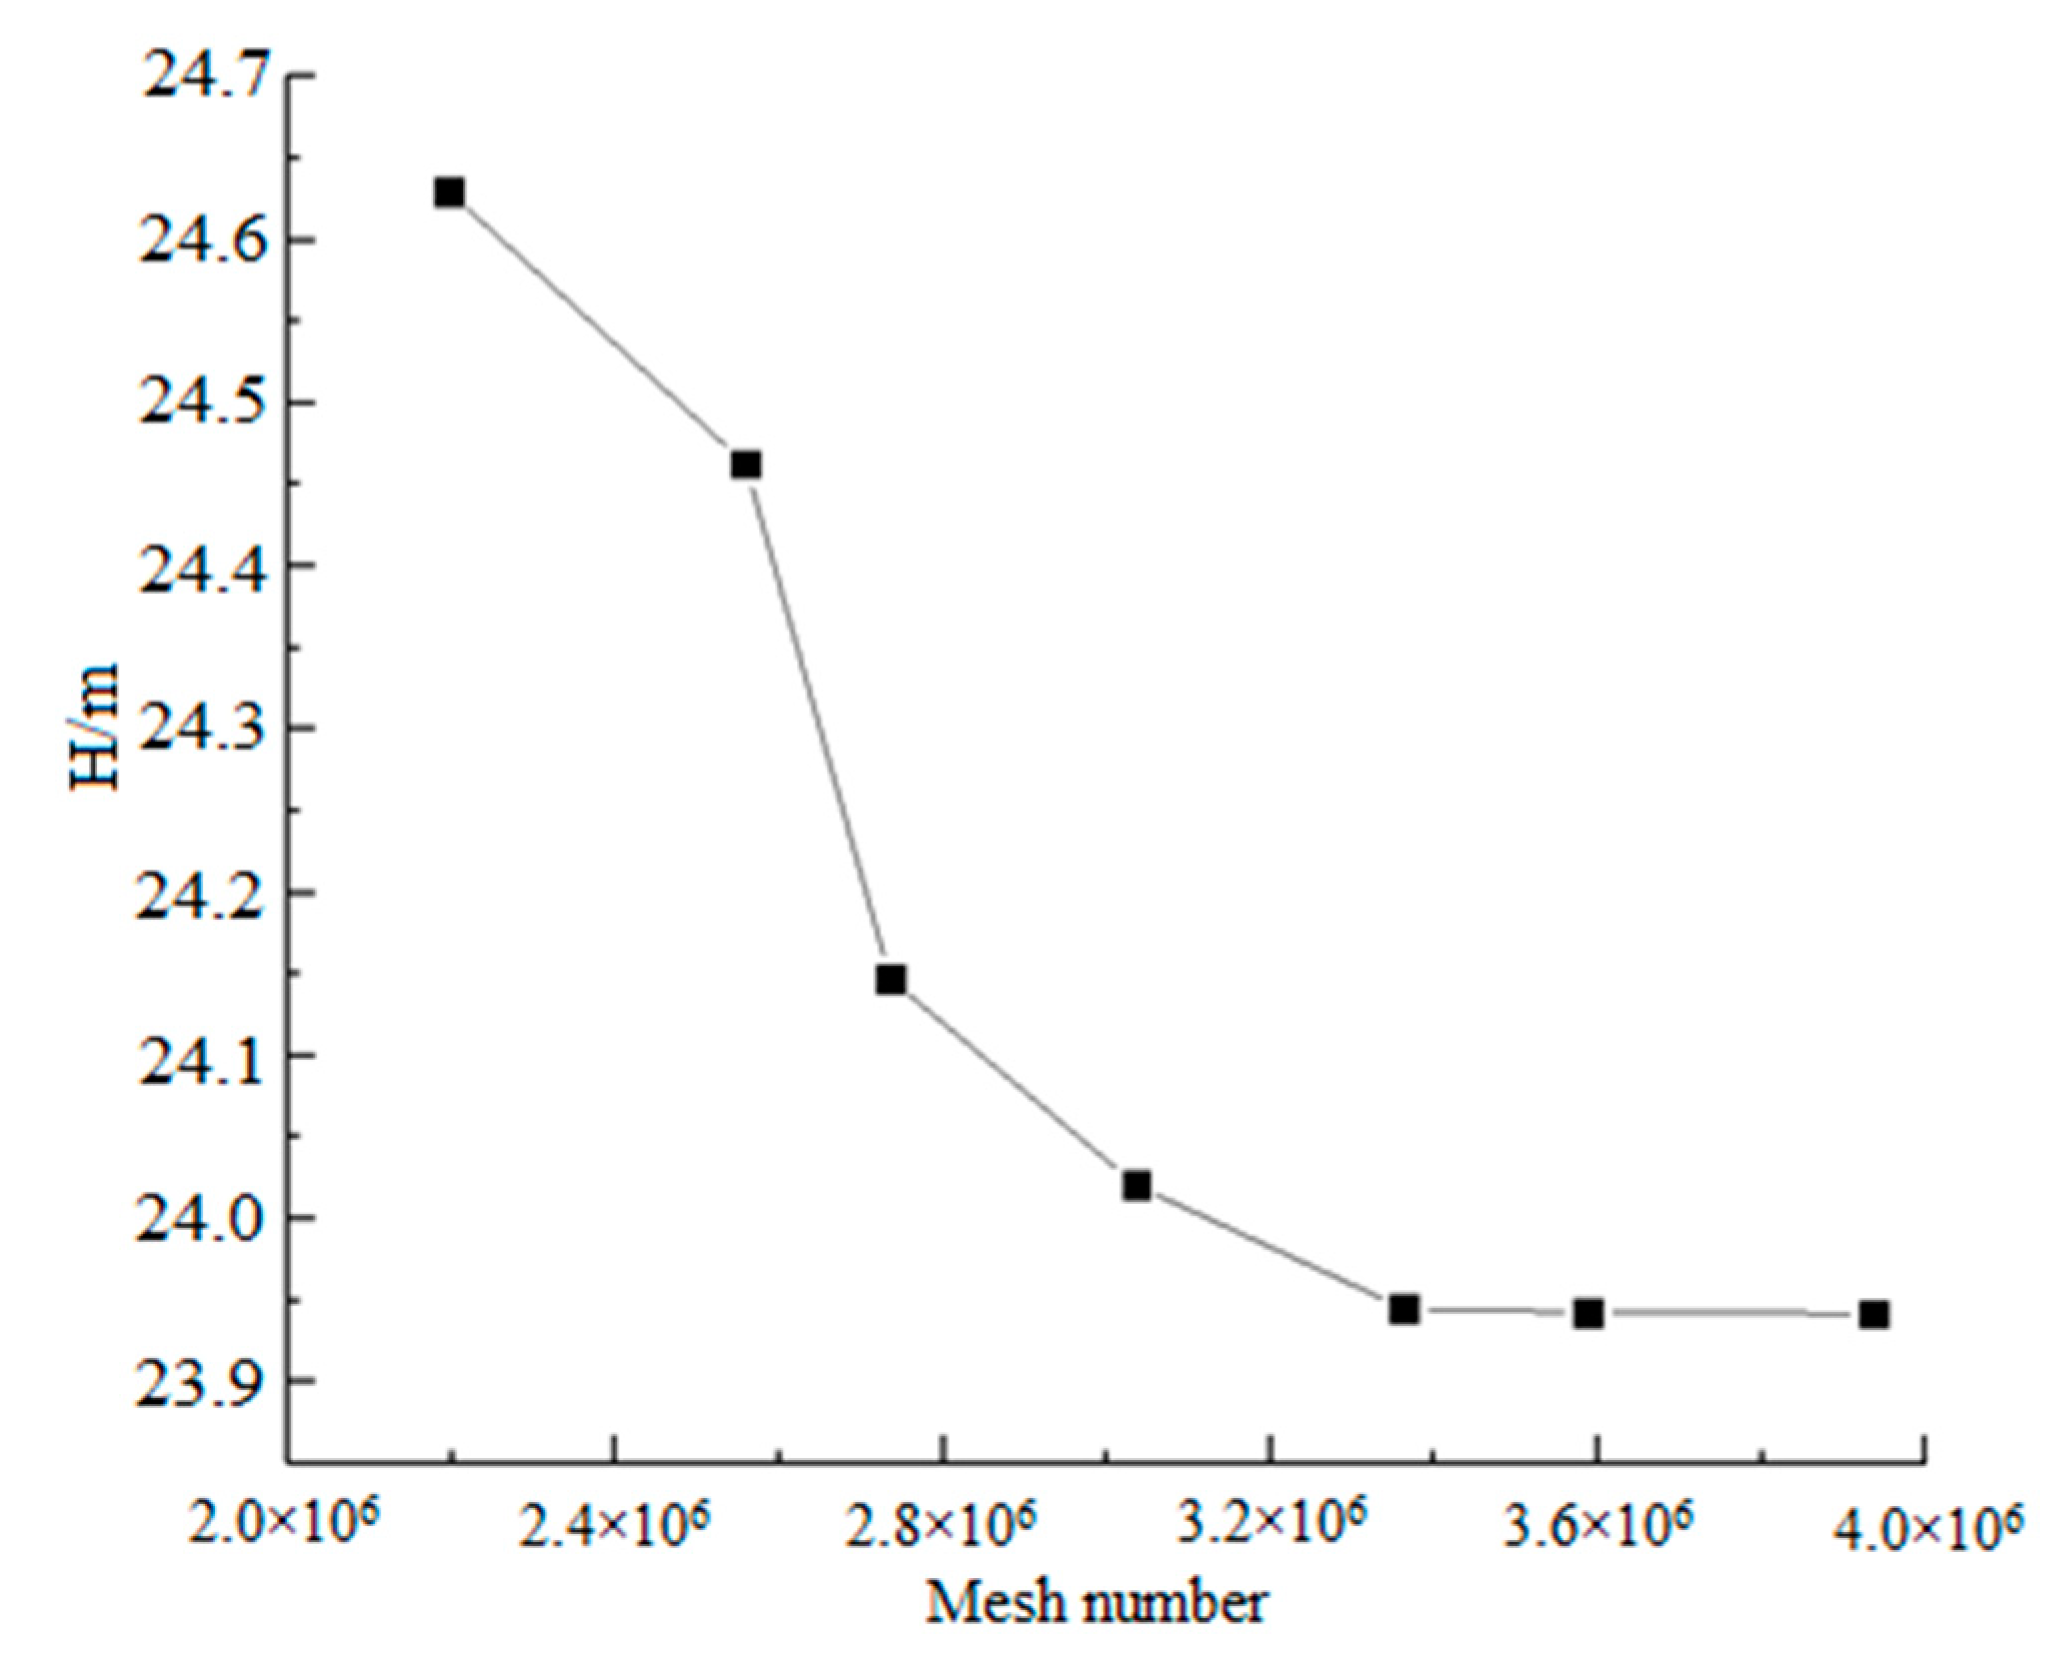
The accuracy of the numerical simulation result and the consumption of the computational time and resources are affected dramatically by the mesh number of the fluid domain. Taking into consideration the simulation accuracy and computational efficiency, the mesh independence verification was accomplished (see
Figure 3). There were seven sets of meshes of the pump fluid domain, which were numerically calculated under the water design condition to select the model with the optimal mesh number for subsequent numerical calculation.
It can be seen from
Figure 3 that the head of the multiphase pump gradually decreased and then tended to be stable while the mesh number increased. The variation of the head was only 0.31%—less than 0.5%—when the mesh number exceeded 3.38 million. Therefore, the mesh number selected to use in the simulation was about 3.60 million, including a 0.5 million mesh number of the inlet extension section, 2.17 million mesh number of the impeller and 0.9 million mesh number of the outlet extension section.
3.3. Model Selection and Boundary Conditions
The software ANSYS CFX, which is widely used in the turbomachinery field, was used to simulate the cavitation flow of the multiphase pump under the design condition. Because of the large curvature blades and the high rotating speed of the multiphase pump, flow separation can easily occur in the interior while conveying the multiphase medium. Therefore, the SST k-ω turbulence model—which is suitable for flow separation—with large curvature flow and jet flow, was selected. Additionally, concerning the speed of convergence and the amount of calculation, the mixed flow model was chosen, which regards the mixed phase as the single phase. Moreover, the Zwart-Gerber-Belamri model was chosen as the cavitation model, because it can more accurately simulate the quasi-periodicity and evolution process of the cavitation.
Meanwhile, the single-phase medium was set as water, while the gas-liquid two- phase media were set as water and air, respectively. The inlet and outlet conditions were set as the pressure inlet and the mass outflow, respectively. The vapor phase volume fraction was set to zero. The cavitation was achieved in the multiphase pump interior by decreasing the inlet pressure gradually. In the whole calculation process, the SIMPLE algorithm with strong convergence and extremely fast convergence speed was used in the coupling between the pressure and velocity. The interfaces between the impeller domain and the inlet and outlet extension section were set as Frozen rotor. The relatively no-slip condition was set for the wall of the impeller blades, hub and shroud, while the absolutely no-slip condition was set for others. Additionally, the convergence criterion was set to 10-5, and the saturated vapor pressure of pure water at 25 °C was set as 3170 Pa.
3.4. Numerical Method Verification
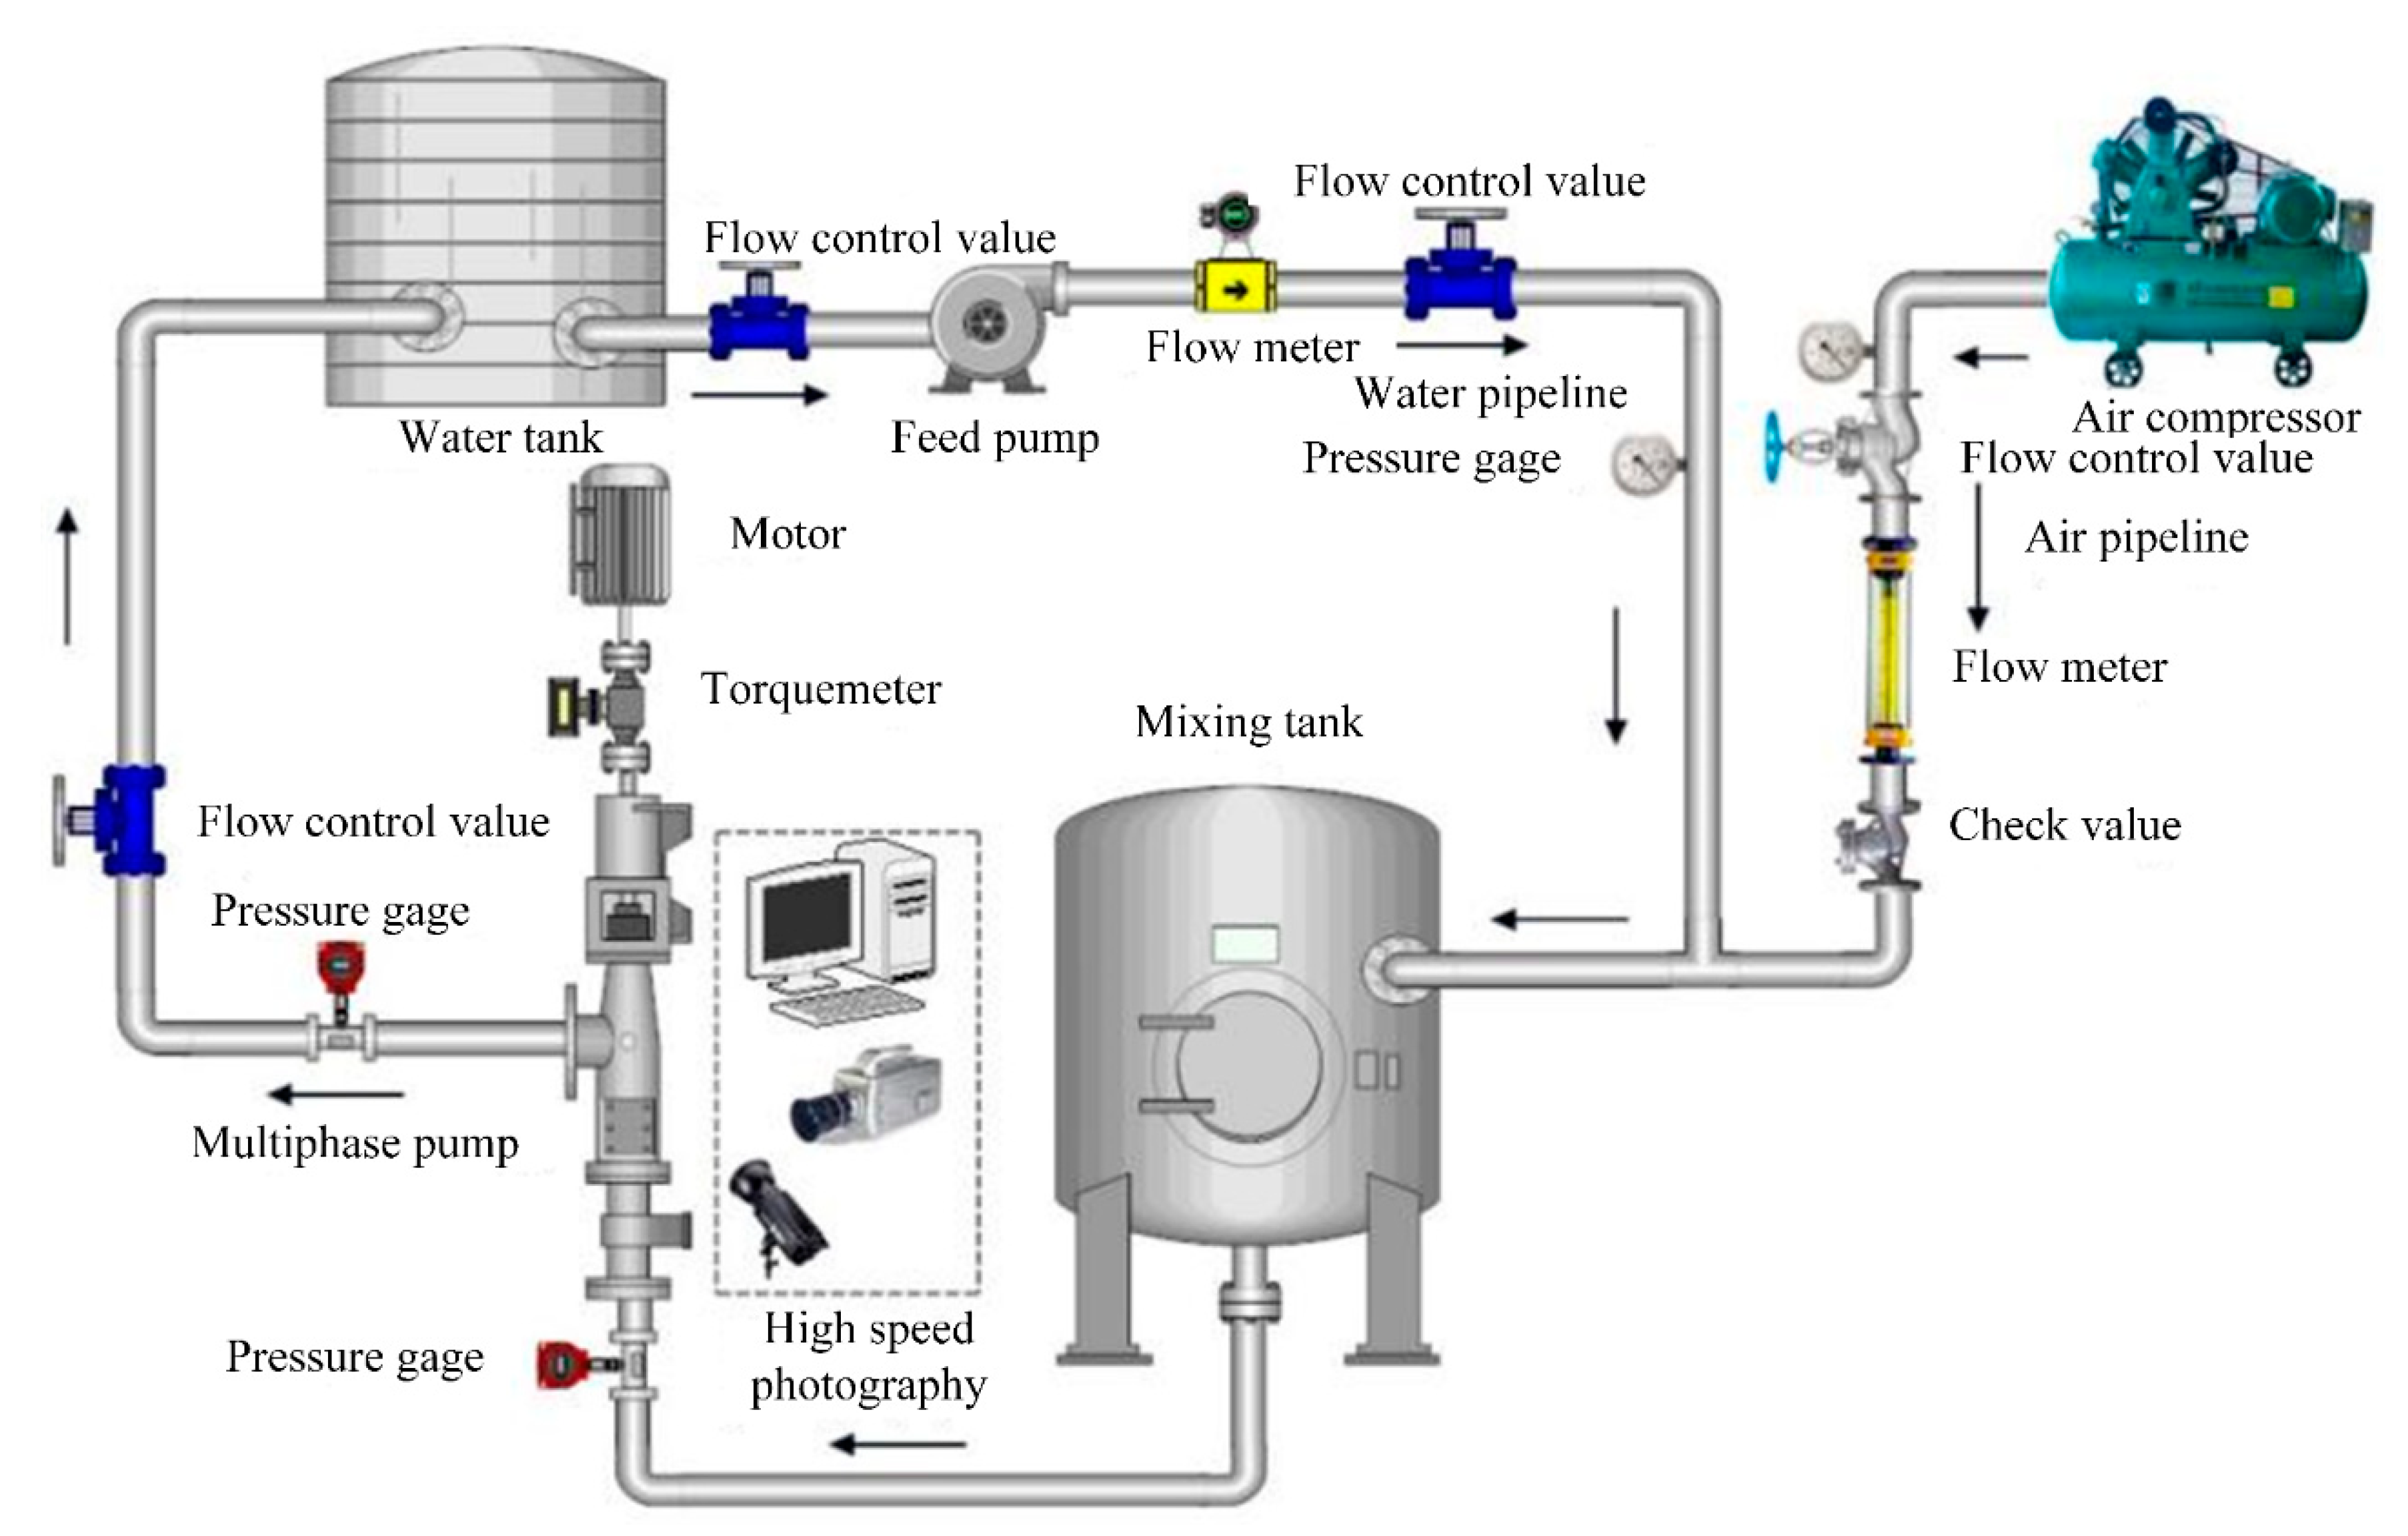
The multiphase pump test system is shown in
Figure 4. It consists of the multiphase pump, motor, mixing tank, cooling system, lubrication system, control system, gas supply system, water supply system, pipelines and valves. In this experiment, water and air were used for the liquid phase and gas phase, respectively. High-speed photography was employed to capture the flow field near the blade tip to verify the numerical simulation reliability.
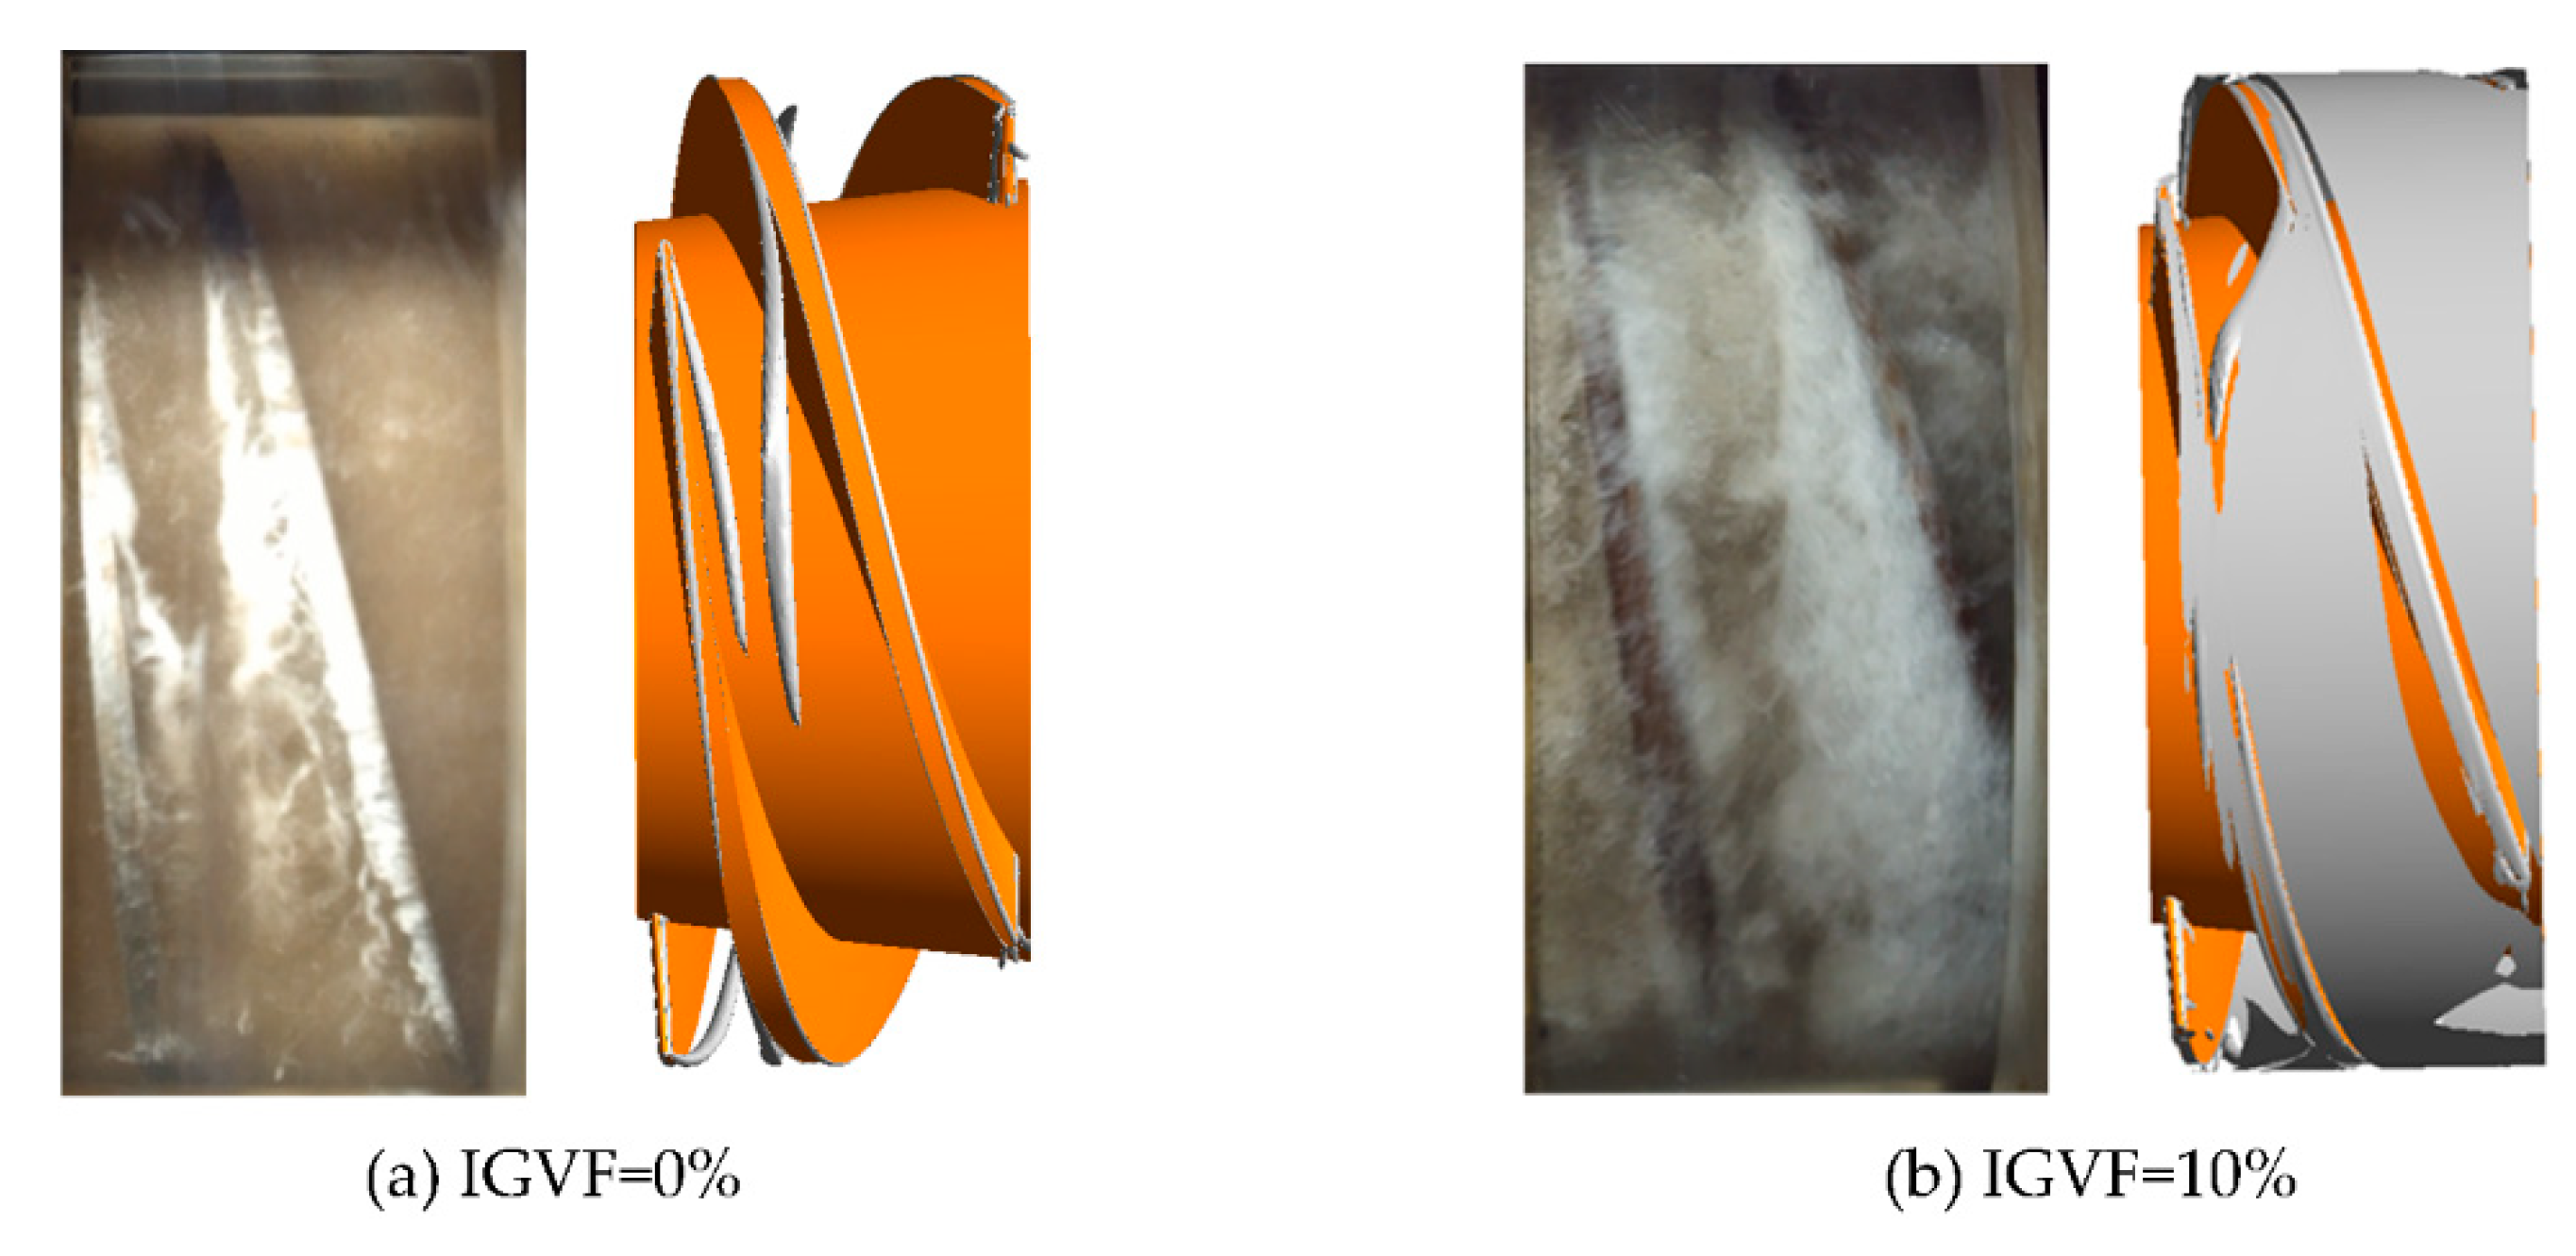
Figure 5 shows the experimental and CFD flow fields with IGVFs at 0% and 10%. It can be seen that the experimental flow field near the blade tip is in good agreement with the CFD flow field, especially in the case of water, which shows that the numerical method was reliable.
4. Research Approach
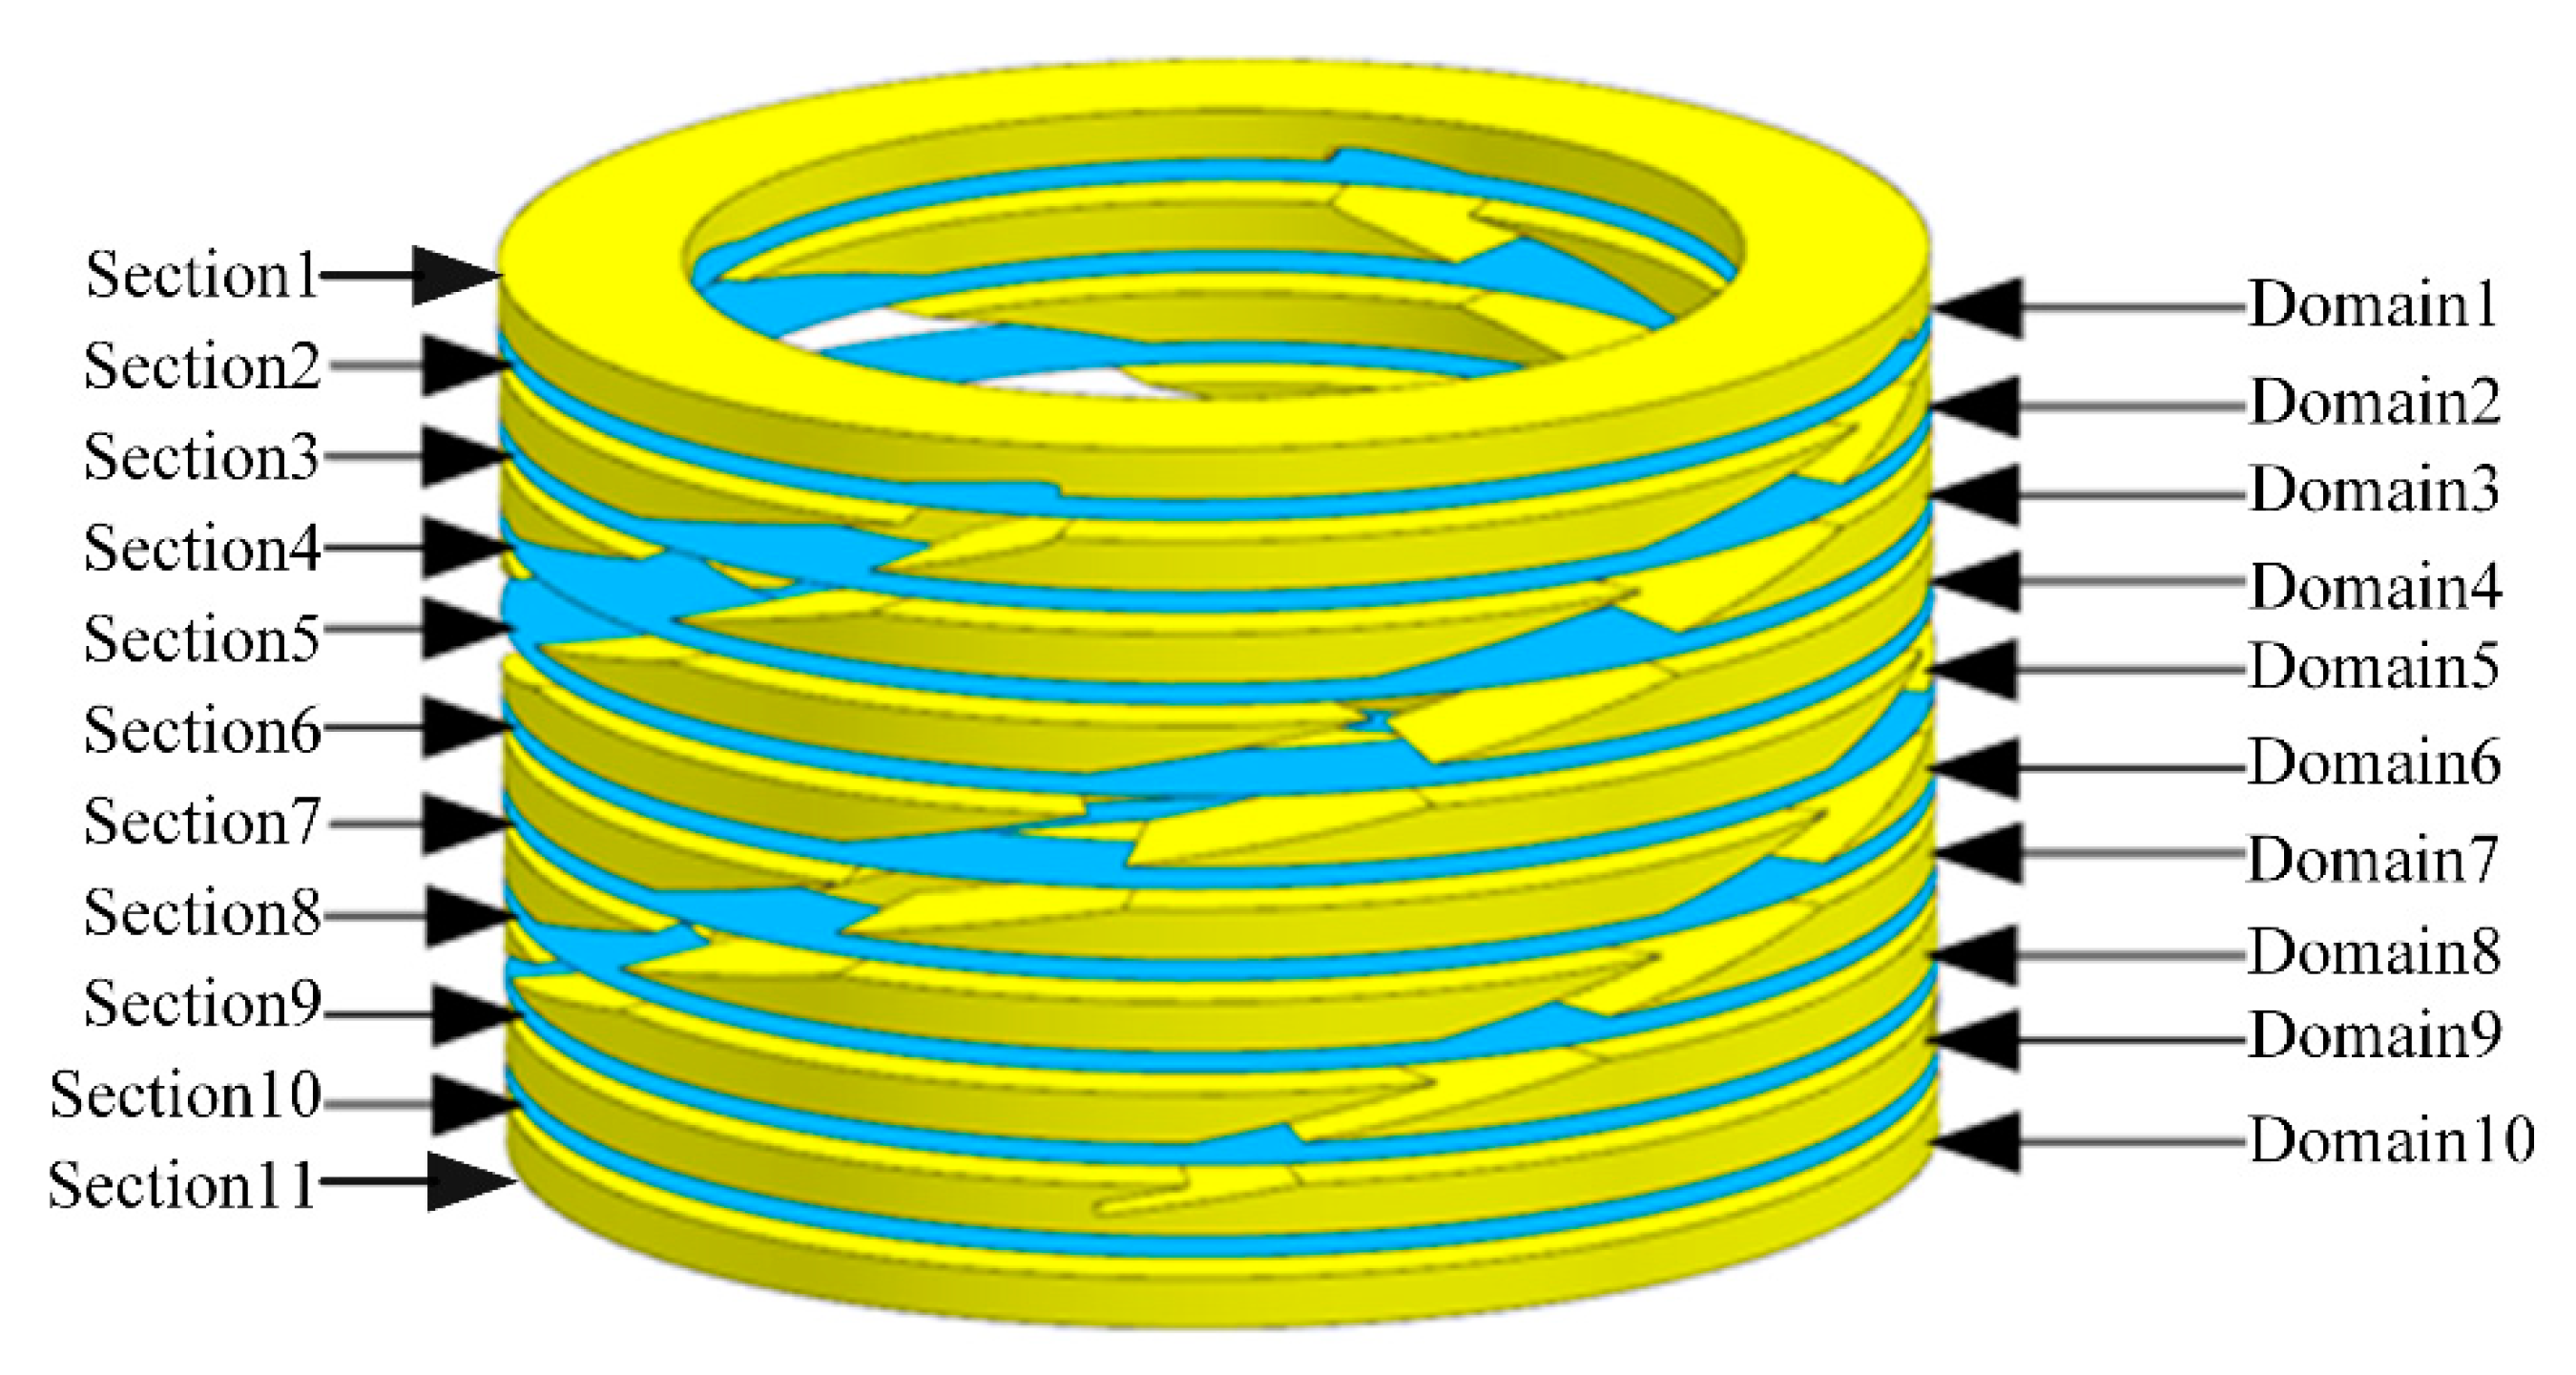
To analyze in detail the effect of IGVFs on the power performance of the multiphase pump at each cavitation stage, the impeller domain of the pump was divided into 10 small regions by 11 equiaxial spacing sections, among which the inlet and outlet sections were set as Section 1 and Section 11, respectively, as shown in
Figure 6.
As a type of vane pump, the work principle of multiphase pumps is that the motor shaft drives the impeller to rotate, transferring the mechanical energy to the fluid, which can achieve the aim of pressurizing the fluid. To quantitatively investigate the effect of the IGVF on the work performance of the pump at different cavitation stages, its output power in unit time was first computed by Equation (1), which is specifically expressed as follows:
where
,
and
represent the impeller output power, the power worked by the pressure and the viscosity force of the impeller wall, respectively.
and
denote the pressure and viscosity force of the impeller pump, respectively.
is the distance between the center of the impeller rotating shaft and the force application point.
is the rotating speed of the shaft.
Equation (2) was used to calculate the total pressure power through each section to further study the pump work performance; the total pressure power consists of the static and dynamic pressure power, expressed by Equations (3) and (4), respectively.
where
represents the total pressure in the absolute coordinate system.
represents the absolute velocity of the mixed-phase fluid.
denotes a unit vector perpendicular to the section.
denotes the power density at each section.
and
are the static and dynamic pressure in the absolute coordinate system, respectively.
5. Interpretation of Results
5.1. Effect of IGVFs on the Cavitation Evolution Process
The variation curves of the head coefficient
and the vapor volume fraction
of the multiphase pump with the cavitation number
are shown in
Figure 7 and
Figure 8, respectively. The definition equations of the head coefficient
, the vapor volume fraction
and the cavitation number
are as follows:
where
and
represent the inlet and outlet pressure of the multiphase pump, respectively.
is the circumferential velocity of the impeller hub, expressed as
, where
D and
n are the impeller diameter and rotating speed, respectively.
N is the number of the computational domain volume mesh units.
denotes the vapor volume in each volume mesh unit, whose volume is expressed as
.
is the saturated vapor pressure of pure water at 25 °C.
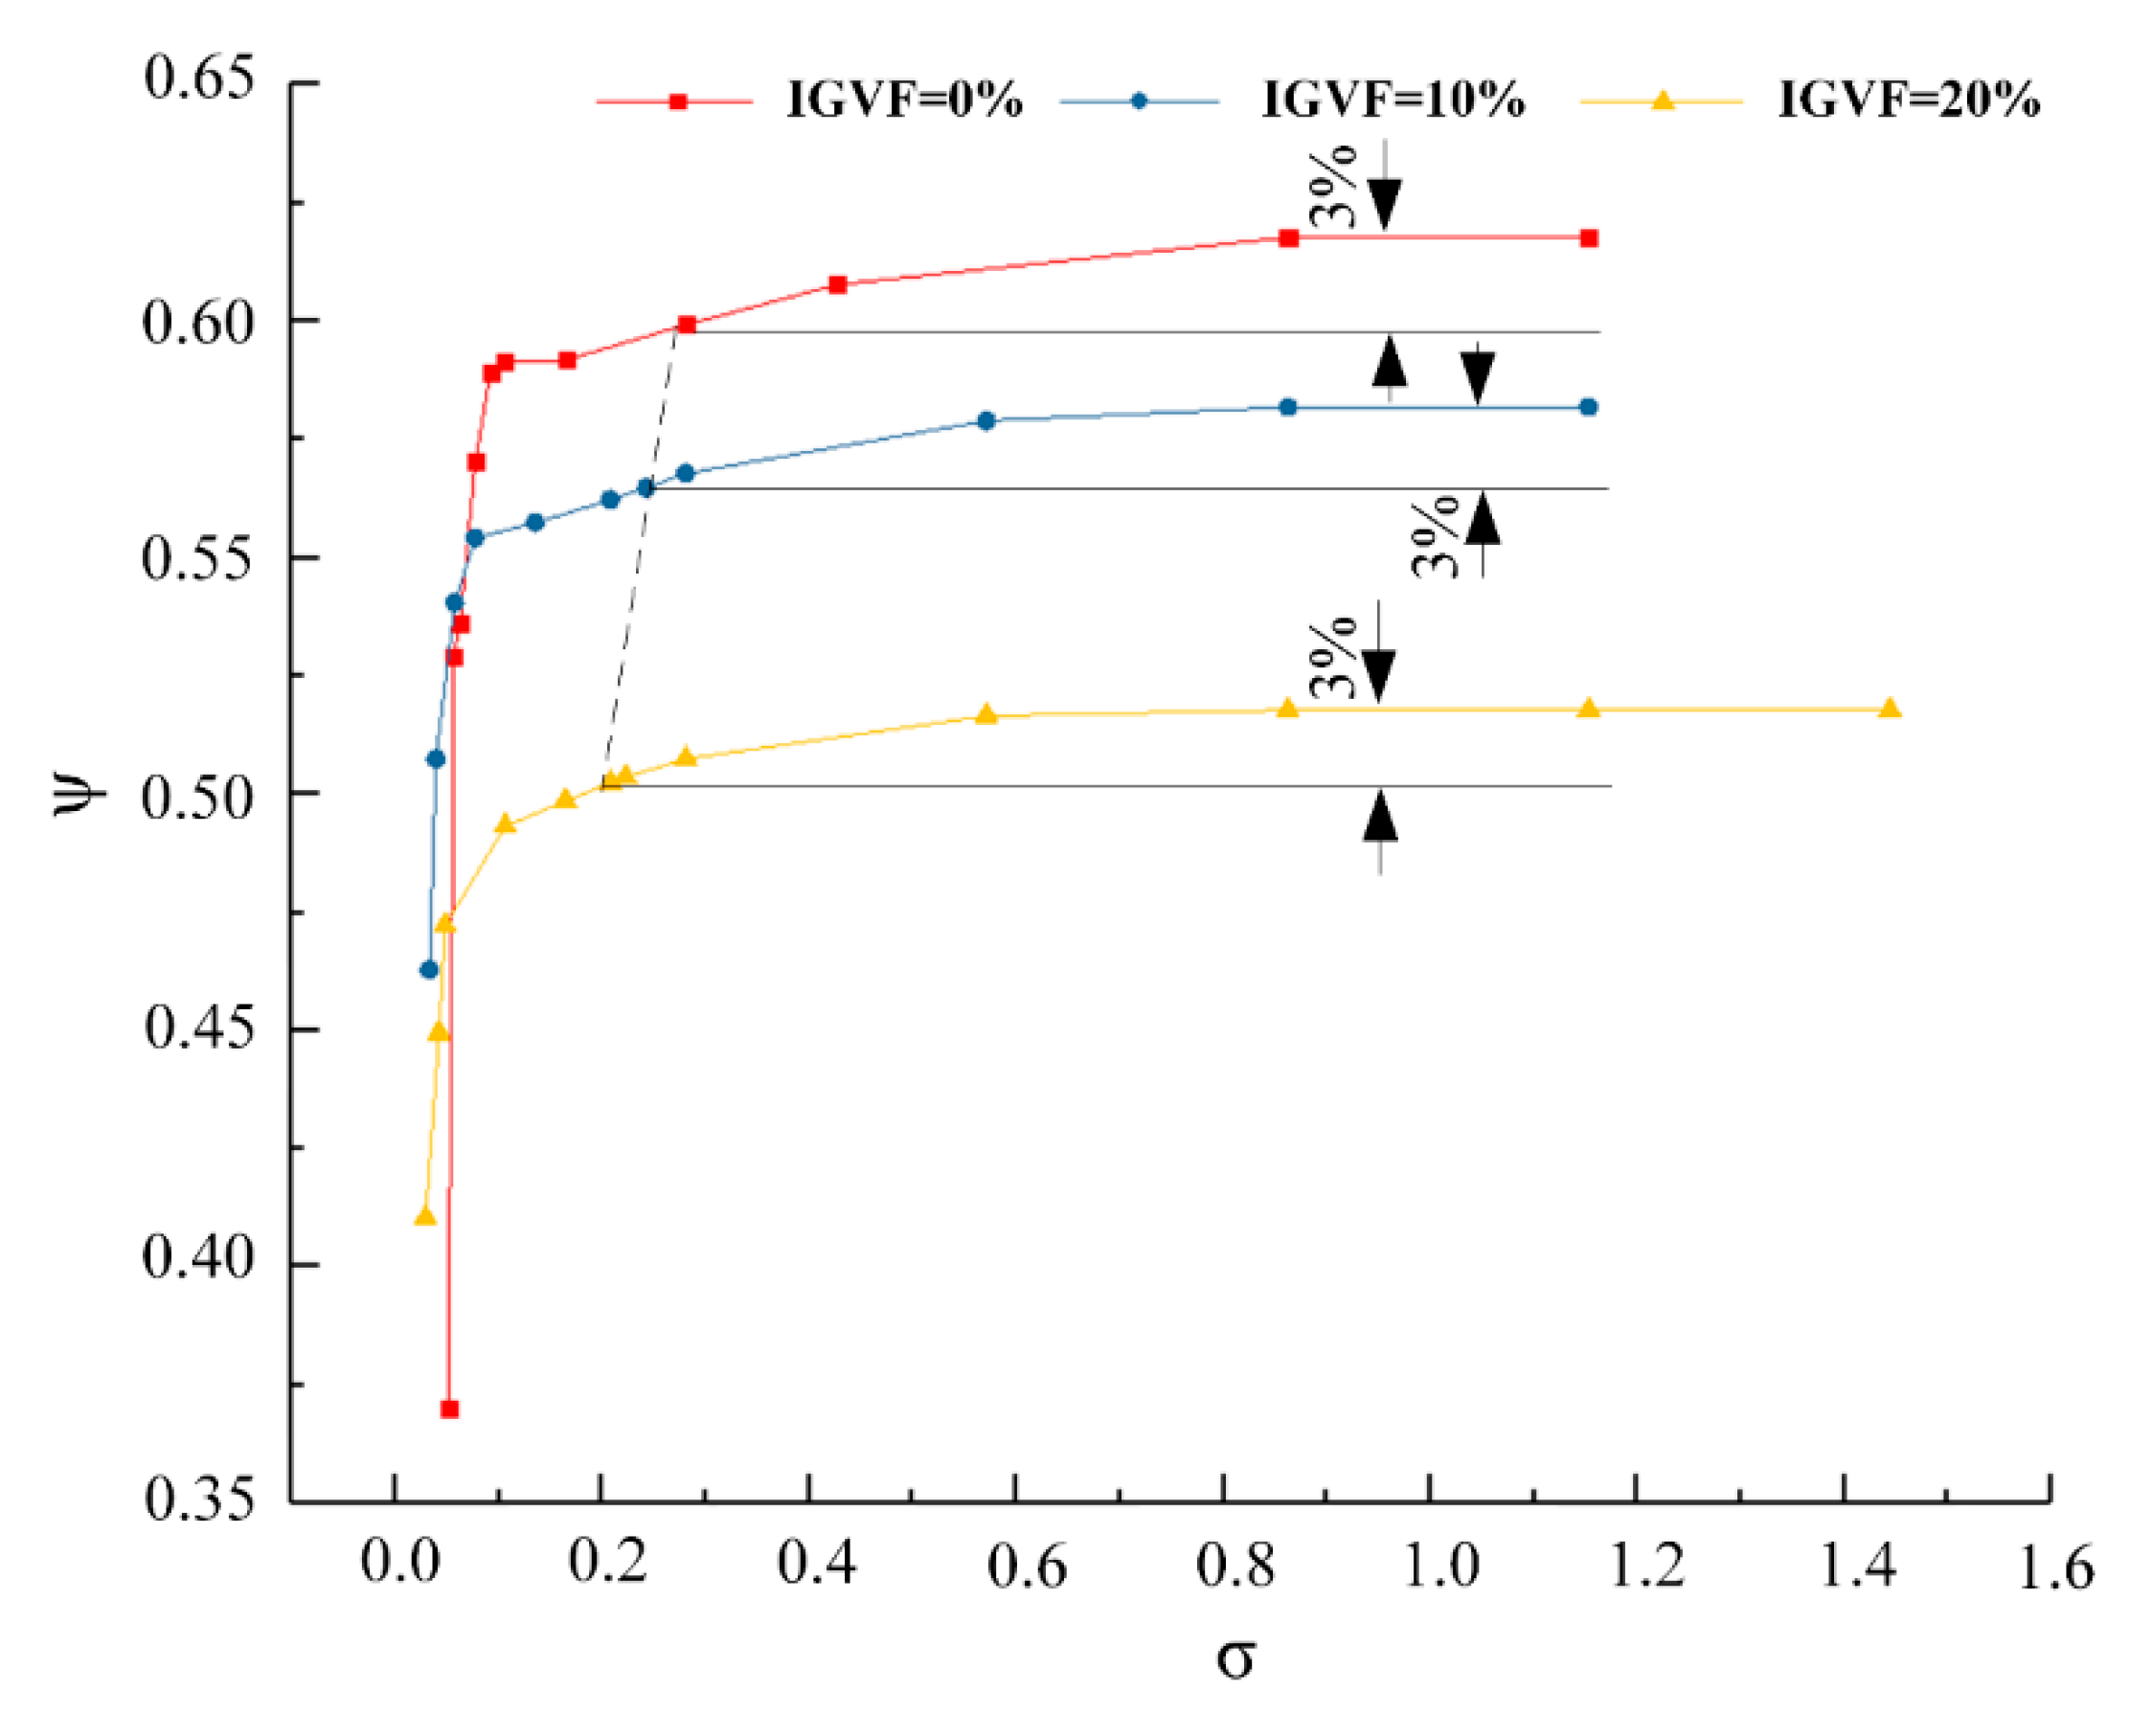
As can be seen from
Figure 7, the head coefficient remained unchanged at first, then dropped steadily, and finally dropped sharply, with the cavitation number decreasing under the conditions where IGVFs were 0%, 10% and 20%. In the condition that the IGVF was 0%, when the cavitation number was greater than 0.86, the head coefficient remained unchanged, indicating that within this range of the cavitation number, there was no the cavitation or the phenomenon of the cavitation was relatively weak such that the head of the multiphase pump was not affected. With the cavitation number further decreasing from 0.86 to 0.106, the head coefficient declined gradually; the head coefficient declined 3% compared to that without cavitation, as the cavitation number was 0.28, i.e., the critical cavitation point in engineering. Additionally, when the cavitation number was less than 0.106, the head coefficient dropped sharply. As the cavitation number decreased to 0.077, the head coefficient declined 7.68% accordingly, while the cavitation was serious in the pump. Moreover, the head coefficient declined more than 20% with the cavitation number decreasing to 0.051. This could indicate that the cavitation status had already been the fracture cavitation in the pump. In the condition that the IGVF was 10%, when the cavitation number was greater than 0.86, the head coefficient remained unchanged. With the cavitation number decreasing from 0.86 to 0.0769, the head coefficient dropped steadily. At this range of the cavitation number, the critical cavitation number was 0.24 while the head coefficient decreased 3%. In addition, the head coefficient dropped sharply as the cavitation number was less than 0.0769; the serious cavitation number was 0.057 when the head coefficient decreased 7.3%, and the fracture cavitation number was 0.033, corresponding to the head coefficient decreasing more than 20%. In the condition that the IGVF was 20%, the head coefficient remained unchanged with a cavitation number greater than 0.86. The head coefficient dropped steadily at the range of the cavitation number from 0.86 to 0.107; the critical cavitation number was 0.208. When the cavitation number decreased to less than 0.107, the head coefficient declined greatly. As the cavitation number decreased to 0.048, the head coefficient declined 7.4% accordingly. Moreover, the head coefficient declined more than 20% when the cavitation number decreased to 0.029. In summary, the cavitation coefficients corresponding to different cavitation stages of the multiphase pump at different IGVFs are shown in
Table 2.
From
Figure 8, it can be seen that the vapor volume fraction within the impeller fluid domain stayed at zero at first, then increased steadily and finally increased greatly with the decrease of the cavitation number under each IGVF; this variation trend was opposite that of the cavitation characteristic curve. Compared with the variation of the vapor volume fraction under each IGVF within the impeller, it could be seen that, with the decrease of the cavitation number, the increasing rate of the vapor volume fraction was the fastest when the IGVF was 0%. Meanwhile, it also could be found that the increasing rate of the vapor volume fraction reduced gradually with the increase of the IGVF when the cavitation number decreased from 0.3 to 0.1.
From the above analysis of the cavitation characteristic curve, it can be seen that the critical cavitation number of the multiphase pump decreased gradually with an increase in the IGVF, indicating that the increase of the IGVF could improve the cavitation performance of the pump. Additionally, from the variation of the vapor volume fraction within the impeller, it can be seen that the increase of the IGVF could restrain the increasing rate of the vapor.
5.2. Effect of IGVFs on the Impeller Output Power
Under different IGVFs and at each cavitation stage, the power worked by the pressure and the viscosity force of the multiphase pump impeller wall was calculated using Equation (1). The output power distribution of the impeller corresponding to the critical, serious and fracture cavitation stages at different IGVFs is shown in
Figure 9.
From
Figure 9, it can be found that the output power of the impeller was mainly composed by the power worked by the impeller surface pressure, while the power worked by the viscosity force accounts for only a small portion of the output power. In addition, with the increase of the IGVF, at the critical and serious cavitation stages, the power worked by the pressure and the viscosity force decreased gradually, further causing the decrease of the output power of the impeller, while the power worked by the viscosity force decreased gradually and the power worked by the pressure increased first, and then decreased at the fracture cavitation stage. Additionally, at different IGVFs, the aggravation of the cavitation resulted in the output power of the impeller gradually decreasing, which means that the development of the cavitation decreased the work performance of the impeller. In conclusion, both the IGVF and the degree of the cavitation had an effect on the output power of the multiphase pump impeller.
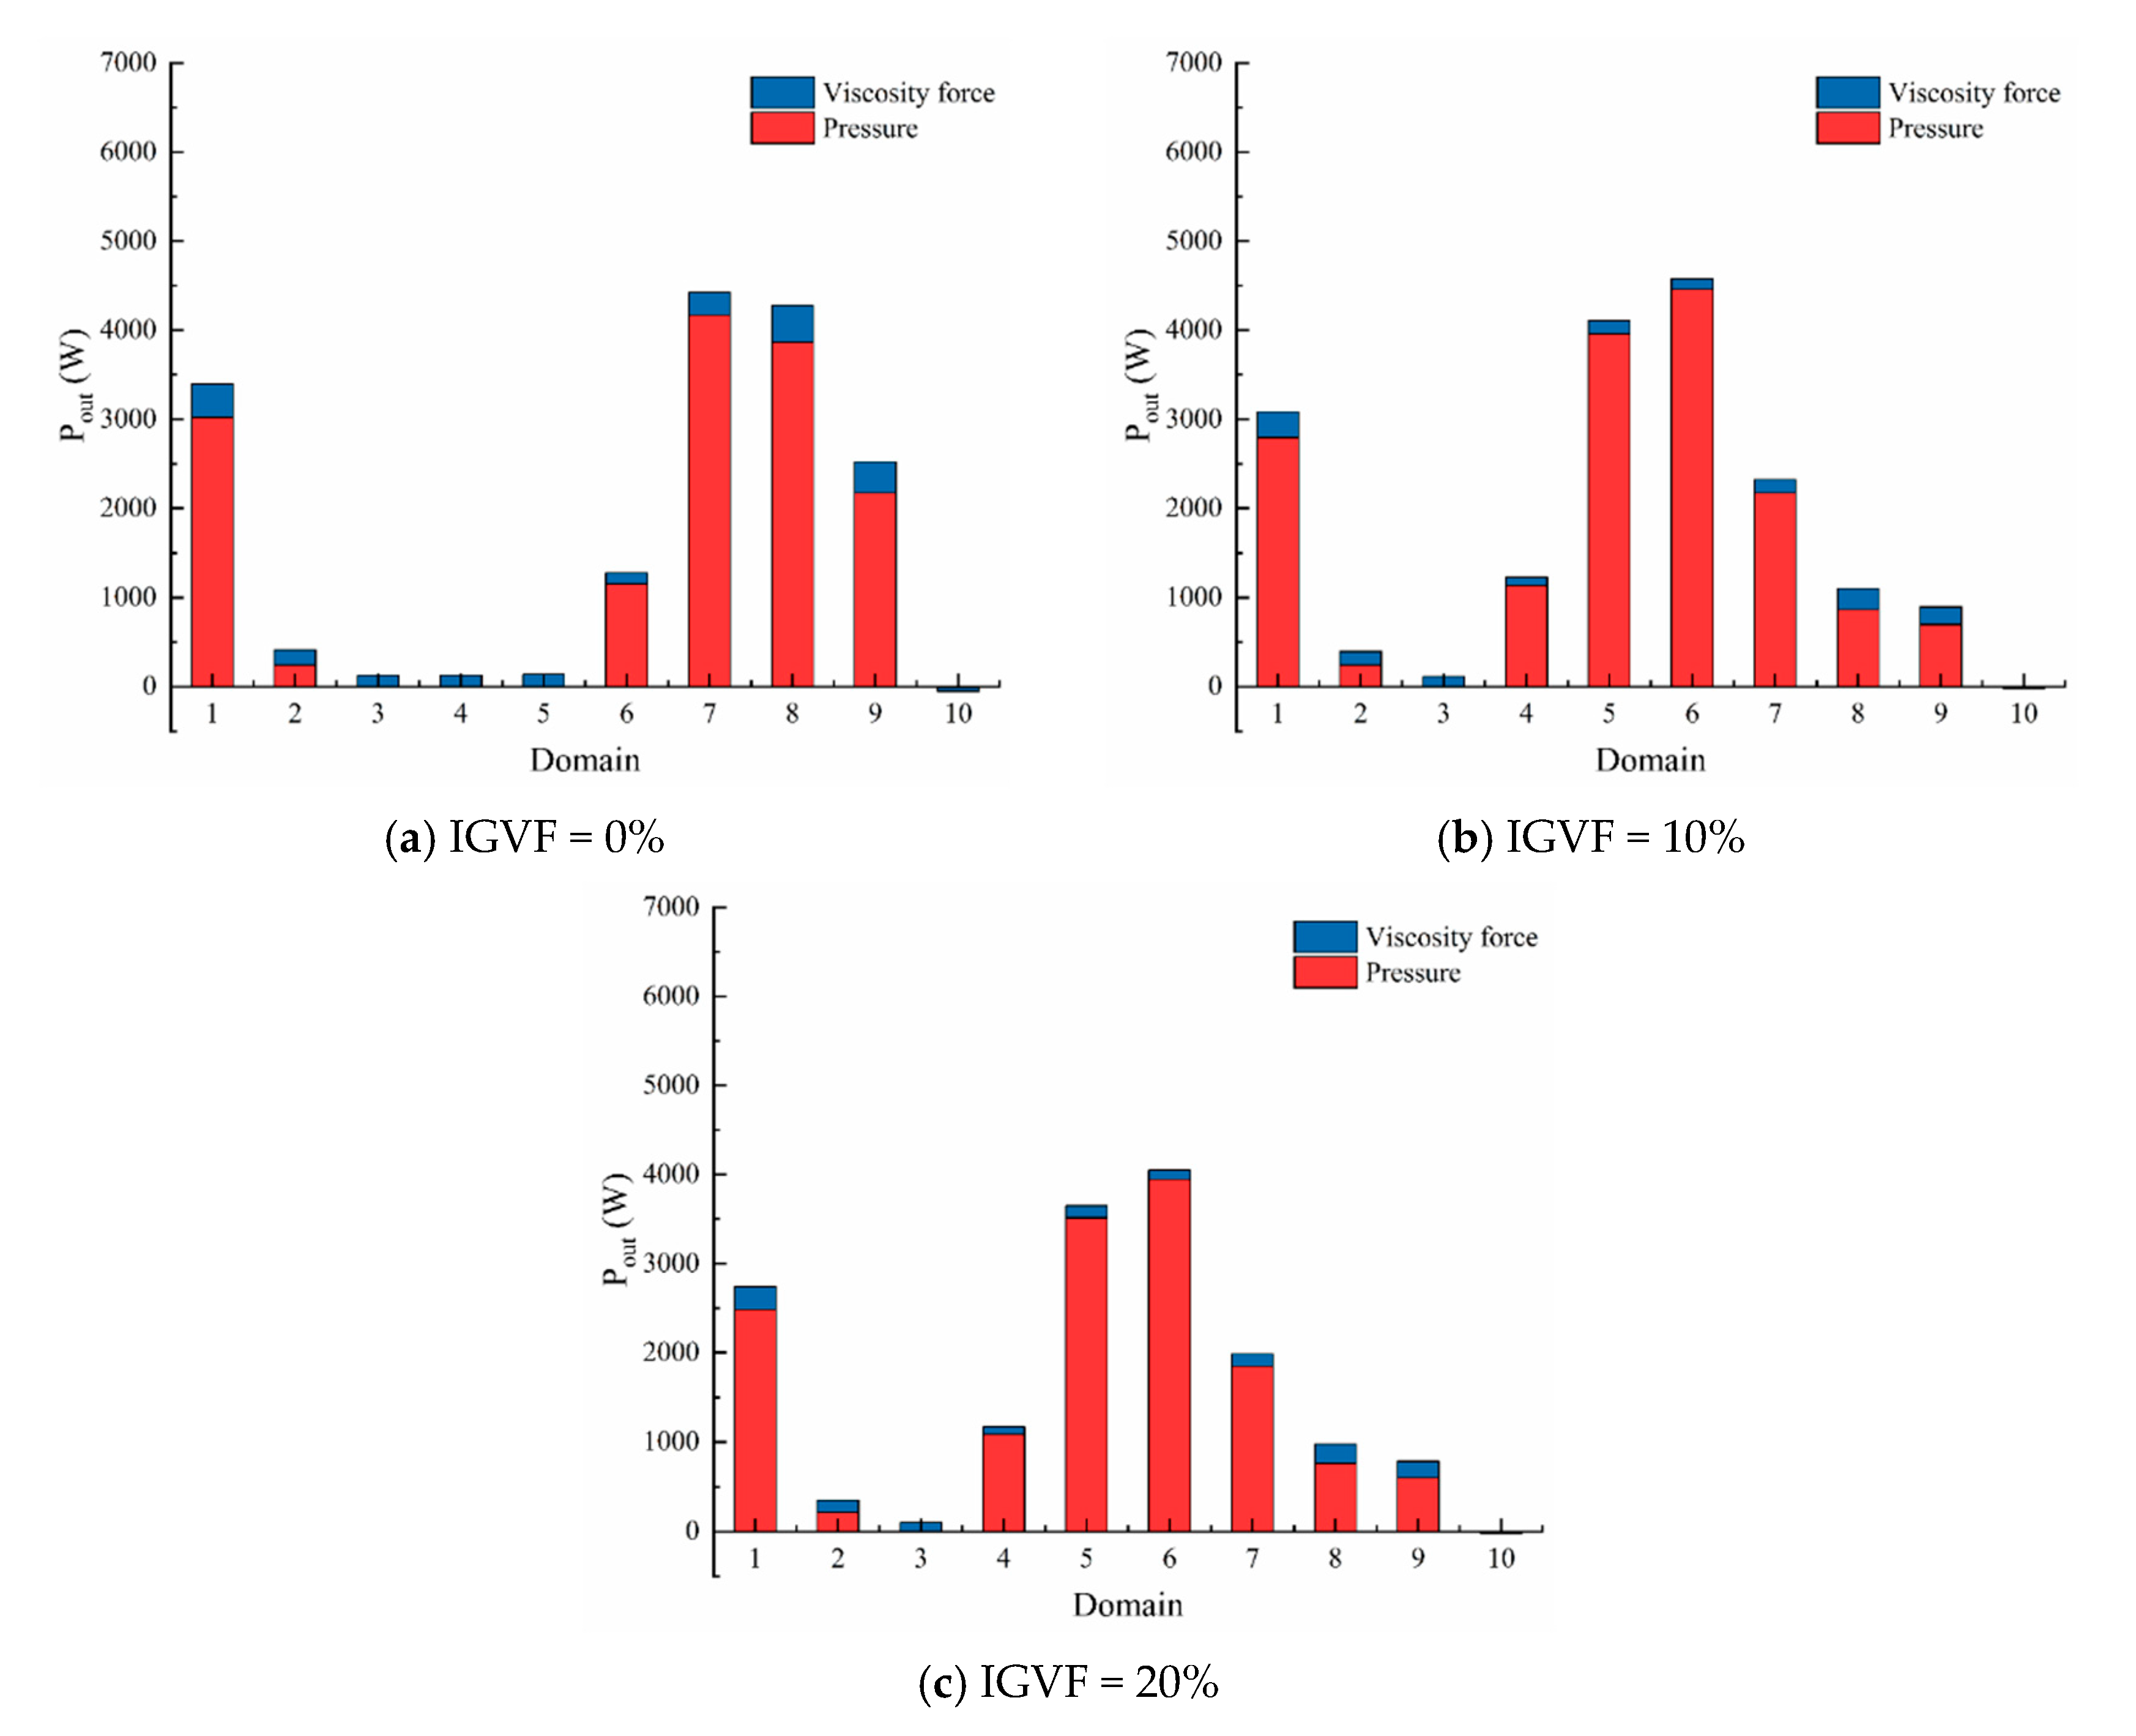
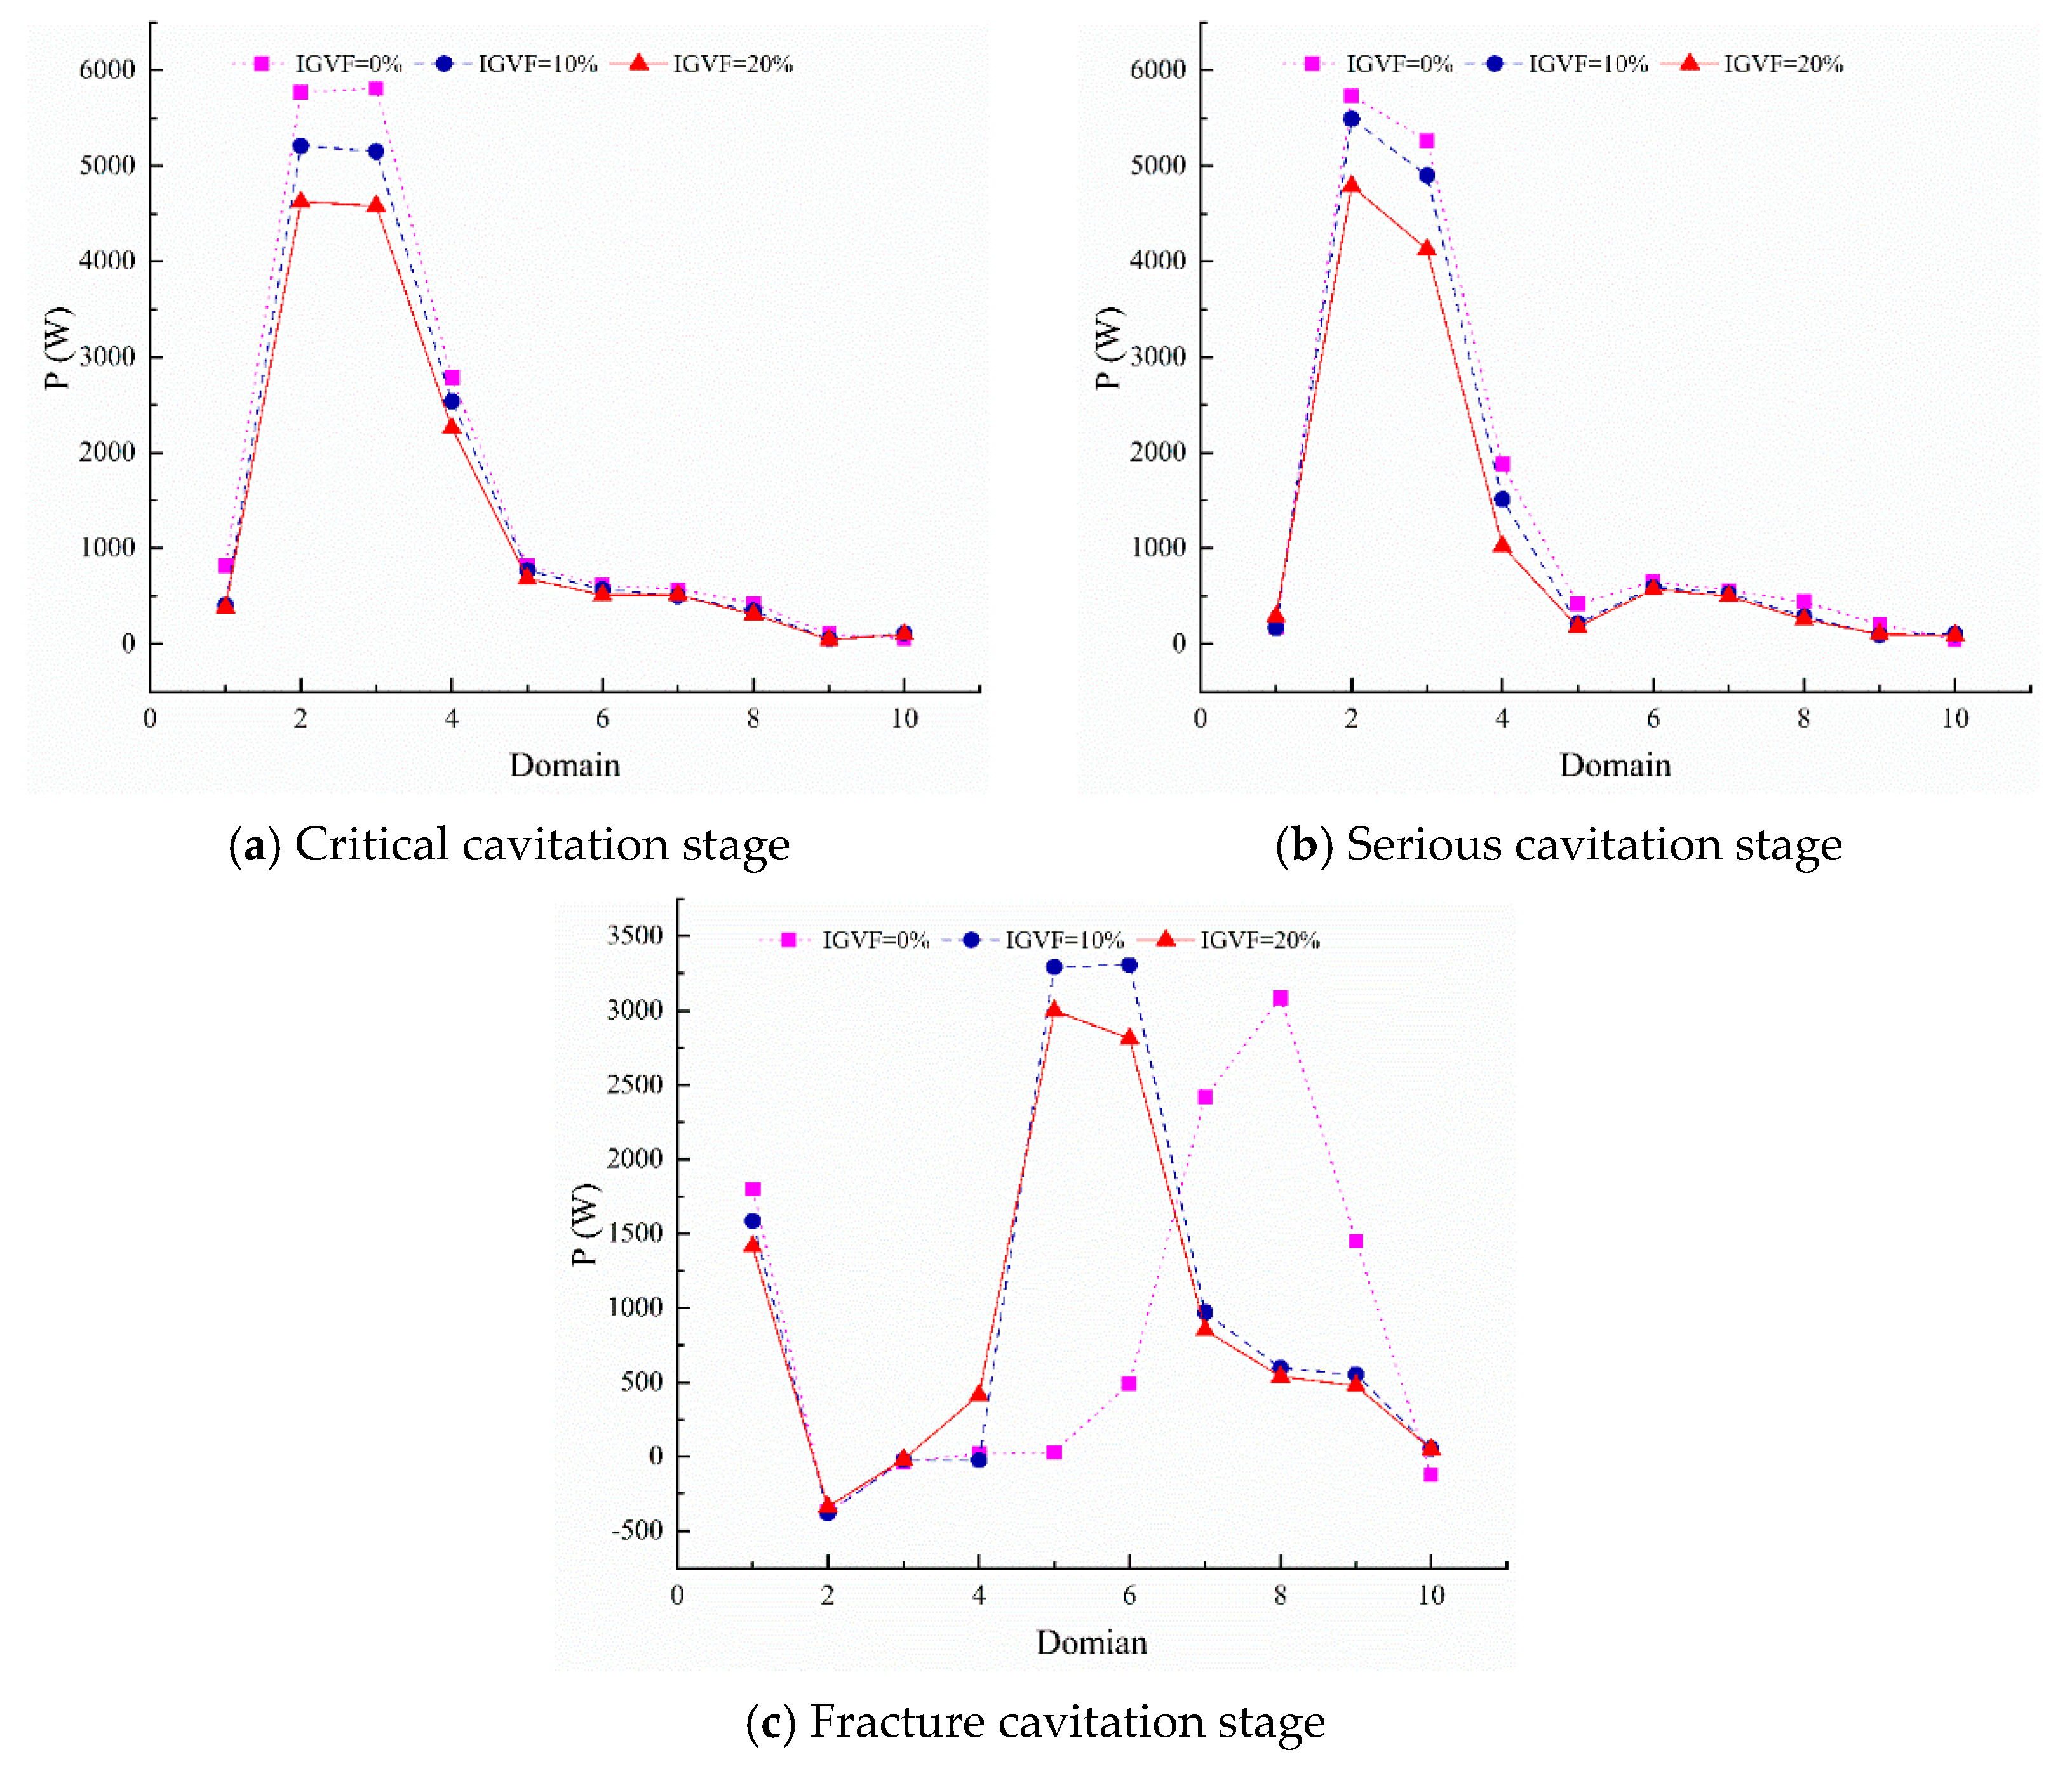
5.3. Variation Rules of the Work Done by the Impeller in Each Fluid Domain under Different IGVFs
To further explore the status of the work done by the pressure and the viscosity force, the power worked by the pressure and the viscosity force of each fluid domain in the impeller were calculated, and the distribution of the output power at each cavitation stage was obtained, as shown in
Figure 10,
Figure 11 and
Figure 12.
From
Figure 10a,
Figure 11a and
Figure 12a, when the IGVF was 0%, it can be seen that the output power distribution increased at first and then decreased at the critical cavitation stage. The larger value of the output power was concentrated from Domain 1 to Domain 4 of the impeller, while the value variation trend of the output power from Domain 5 to Domain 10 was relatively smooth. This was related to the blade load values within each fluid domain at the critical cavitation stage. In other words, the regions of larger blade load values gathered from Domain 1 to Domain 4 within the impeller, while the other domains were the main regions where smaller values of the blade load appeared. Compared with the critical cavitation stage, the power worked by the viscosity force from Domain 1 to Domain 4 decreased in different degrees at the serious cavitation stage. The reason for this was that the kinetic viscosity of the mixed phase decreased with the vapor volume fraction increasing in the condition of the homogeneous flow hypothesis; the vapor volume fraction at the serious cavitation stage was larger than that at the critical cavitation stage, which made that the viscosity force at the serious cavitation stage smaller, further resulting in a decrease in power worked by the viscosity force from Domain 1 to Domain 4. At the fracture cavitation stage, the power worked by the pressure from Domain 2 to Domain 5 within the impeller almost decreased to zero, while the power from Domain 6 to Domain 9 increased by a large margin compared with the first two cavitation stages.
As can be seen from
Figure 10, as the IGVF increased to 10% and 20%, the power worked by the pressure and viscosity force of the same impeller fluid domains almost decreased compared with the IGVF of 0% at the critical cavitation stage, which led to the decrease of the output power within the same domain. This was because the blade load values of each domain reduced with an increase in the IGVF. Furthermore, it can be found from
Figure 11 that the power worked by the viscosity force of each domain increased in different degrees when the IGVF increased from 0% to 10%, while it decreased in different degrees when the IGVF increased from 10% to 20%. Additionally, from
Figure 12, it can be found that when the IGVF increased to 10% and 20%, the output power from Domain 4 to Domain 6 of the impeller greatly increased compared with the IGVF of 0%, while there was a considerable reduction of the output power from the Domain 7 to Domain 9 at the fracture cavitation stage. It can be seen that the variation of the power worked by the pressure was the main factor in the change of the output power with each fluid domain.
Through the above analysis of the work of the impeller under different IGVFs at each cavitation stage, it can be seen that at the critical and serious cavitation stages, the work performance at the impeller fore area was better than that at the back area under different IGVFs, and the work done by the impeller to each fluid domain gradually decreased with the increase of the IGVF. However, at the fracture cavitation, the work performance at the back area of the impeller was better that at the fore area. On the whole, in terms of regularity, the effect of the IGVF on the work performance of the impeller at the fracture cavitation stage was less significant compared with the critical and serious cavitation stages.
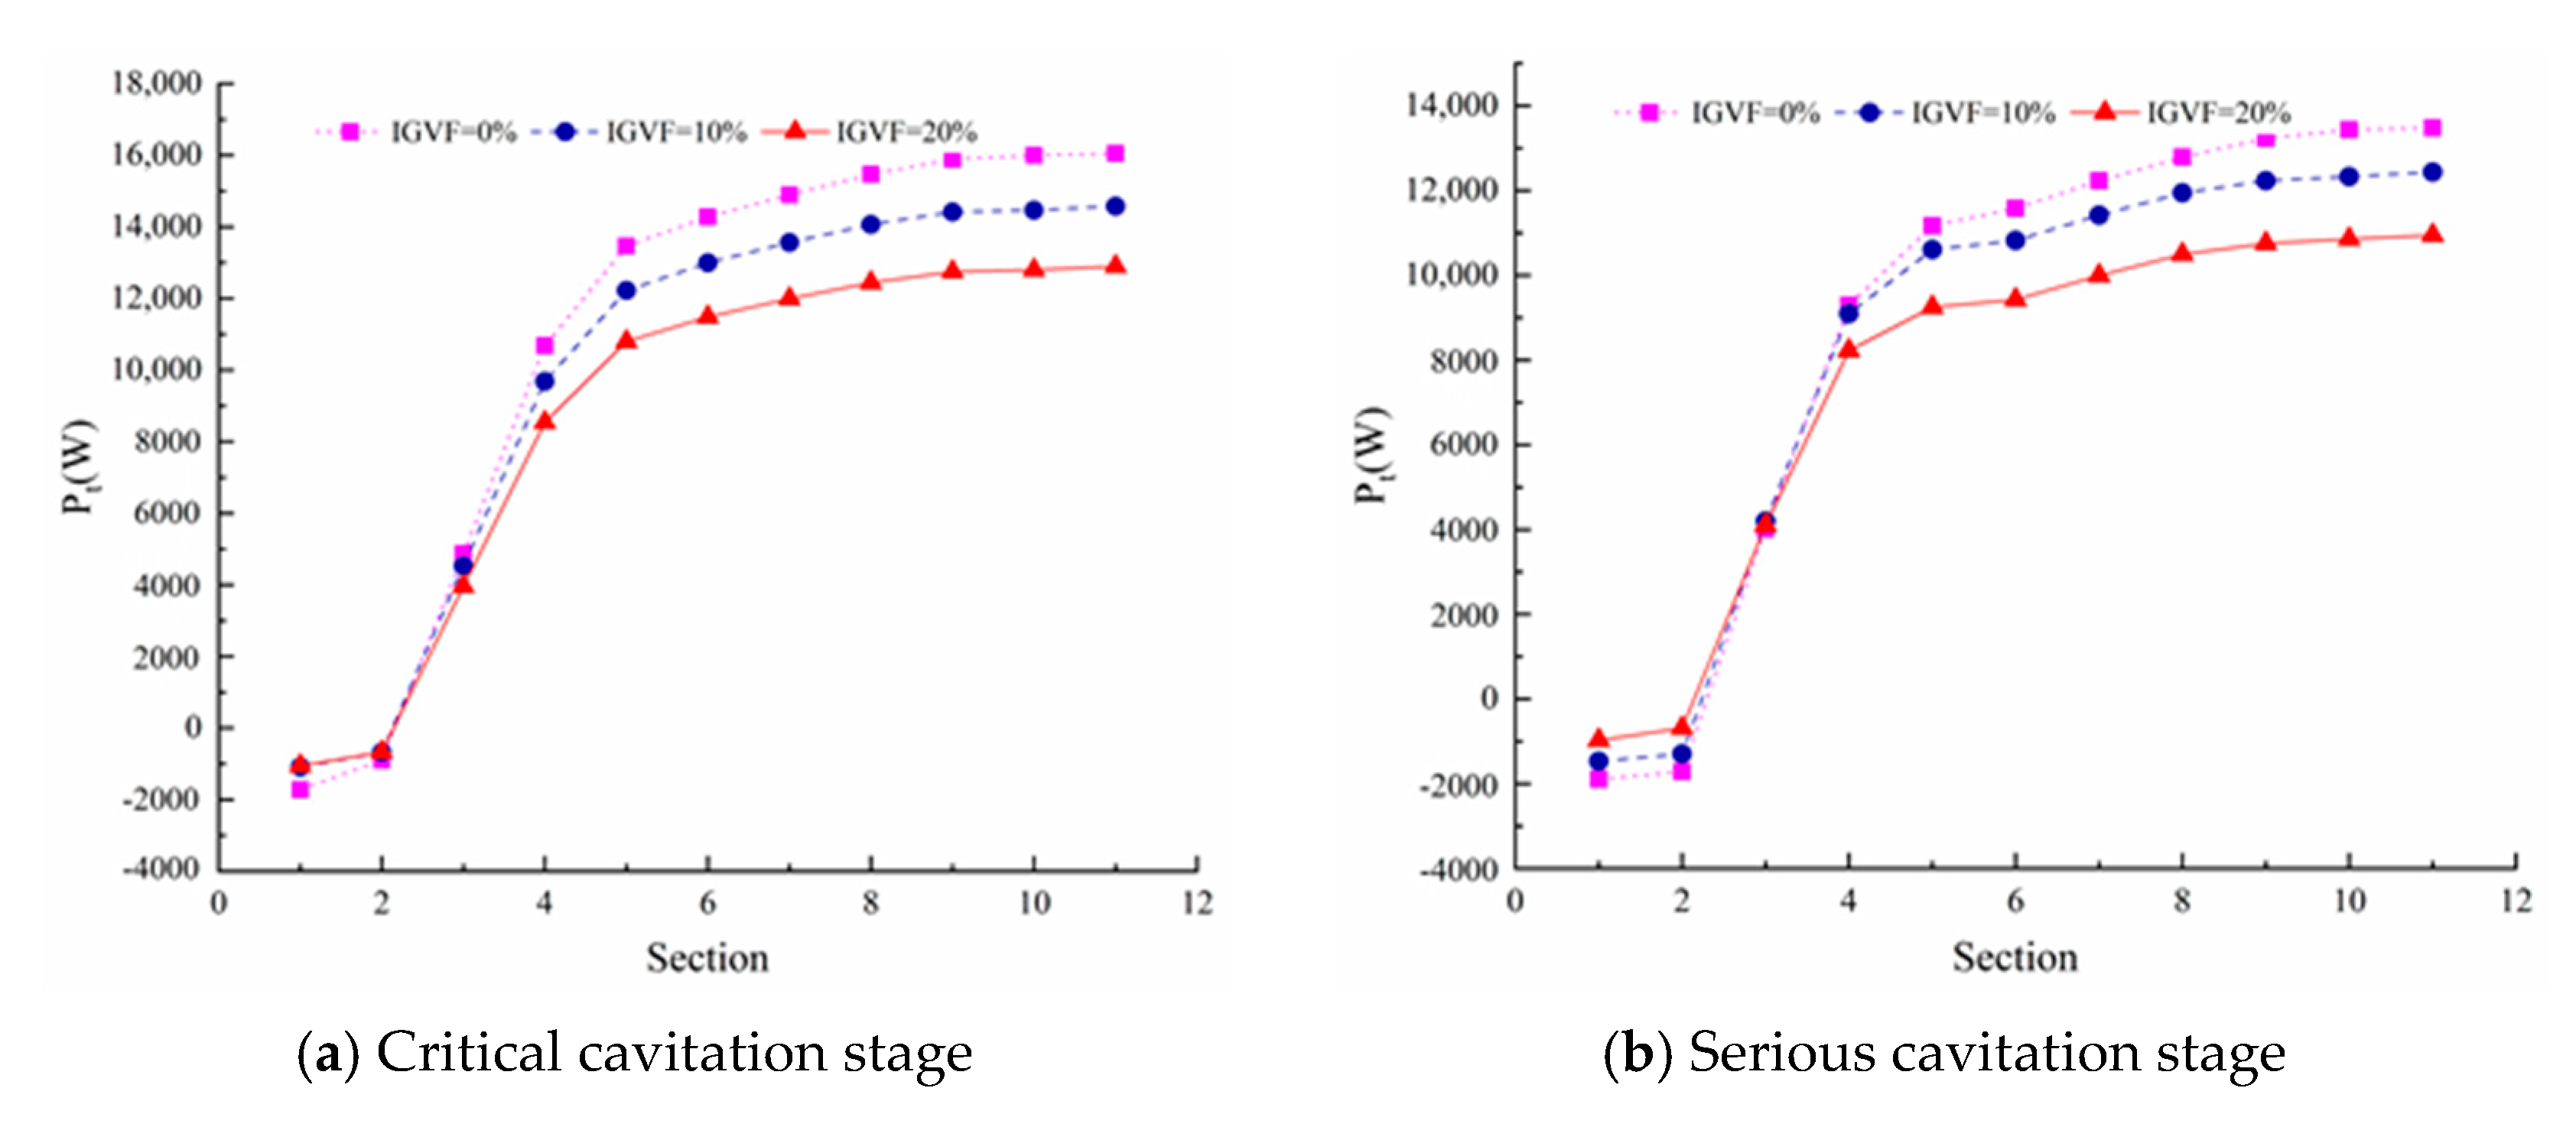
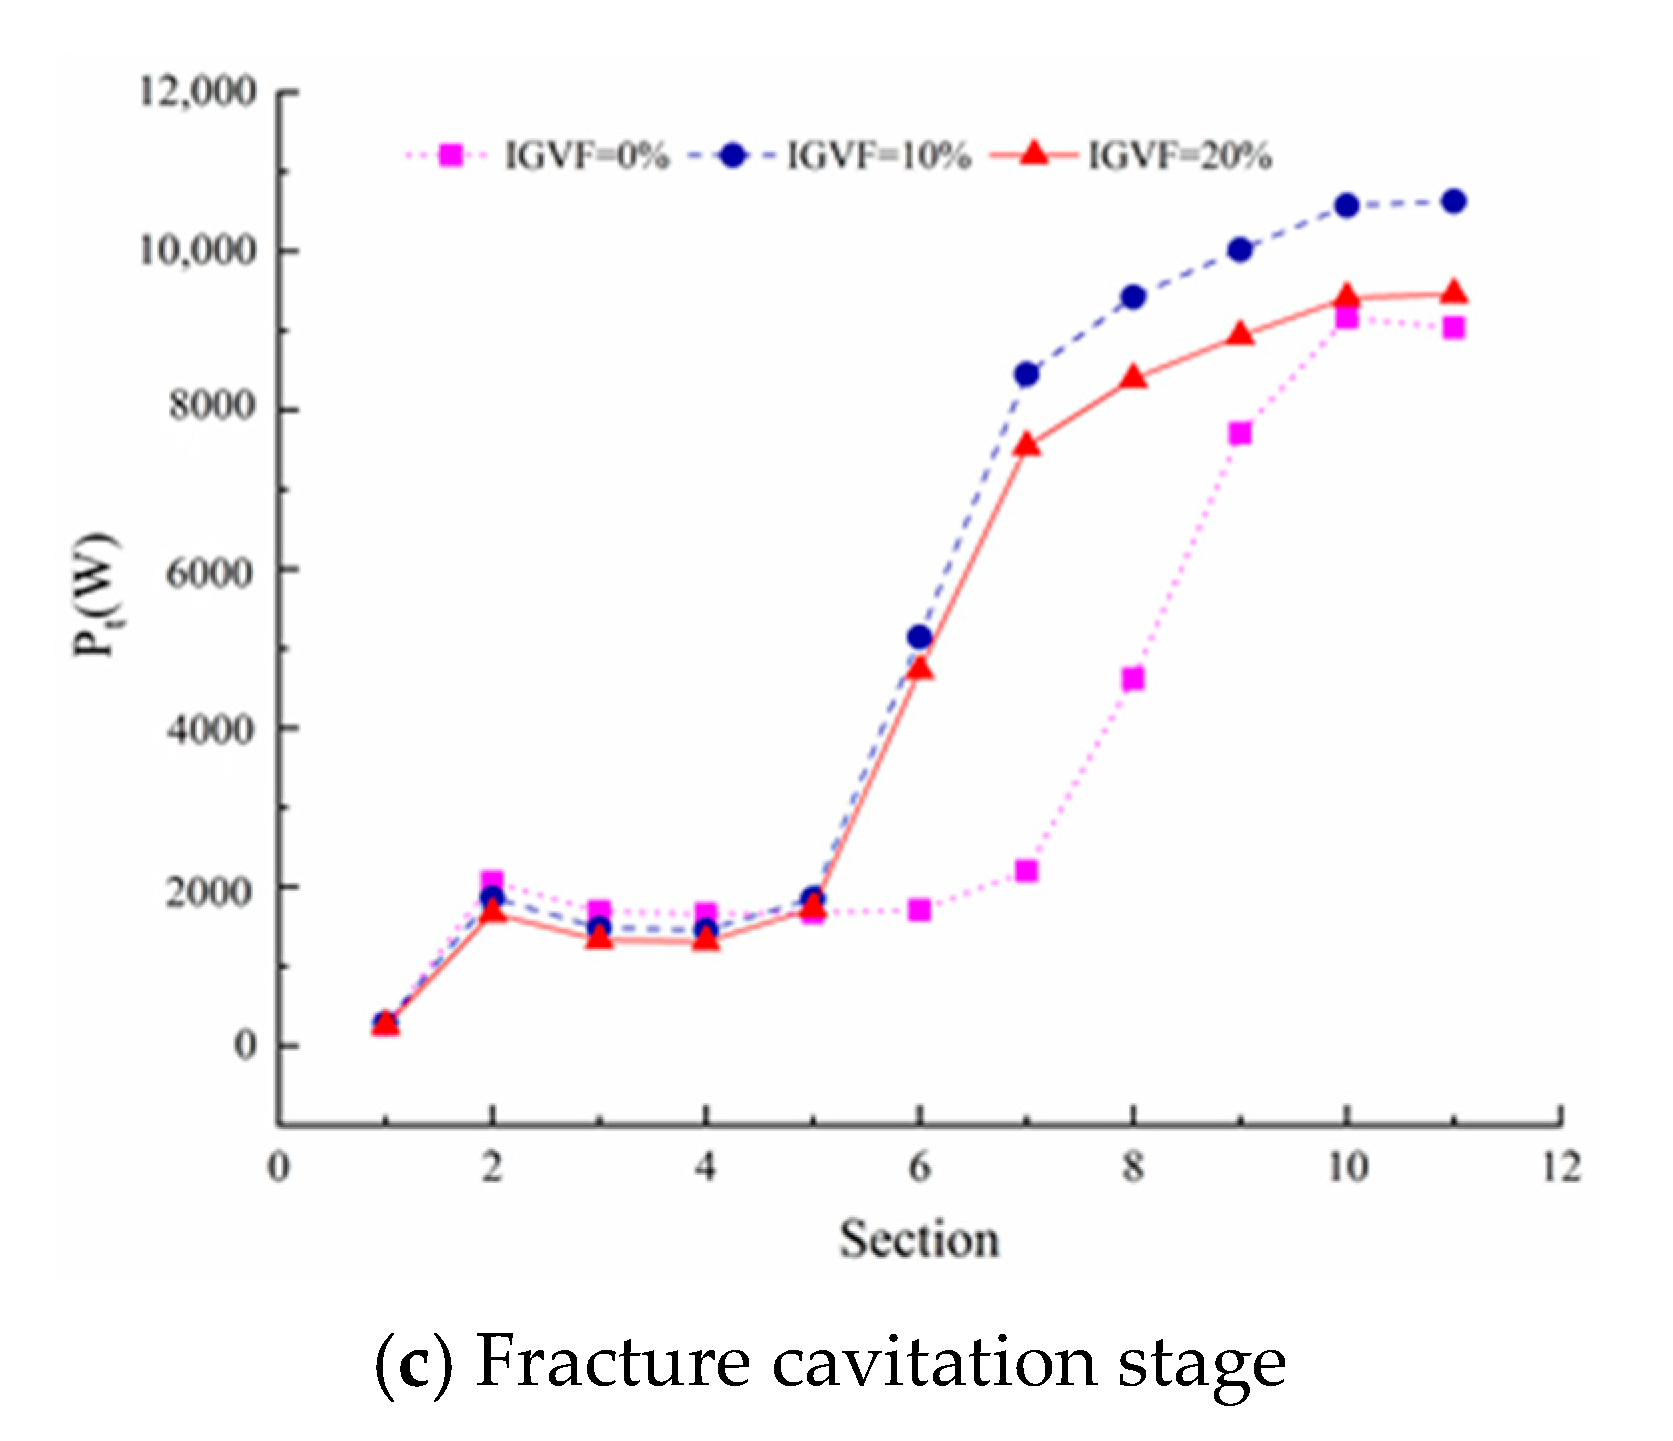
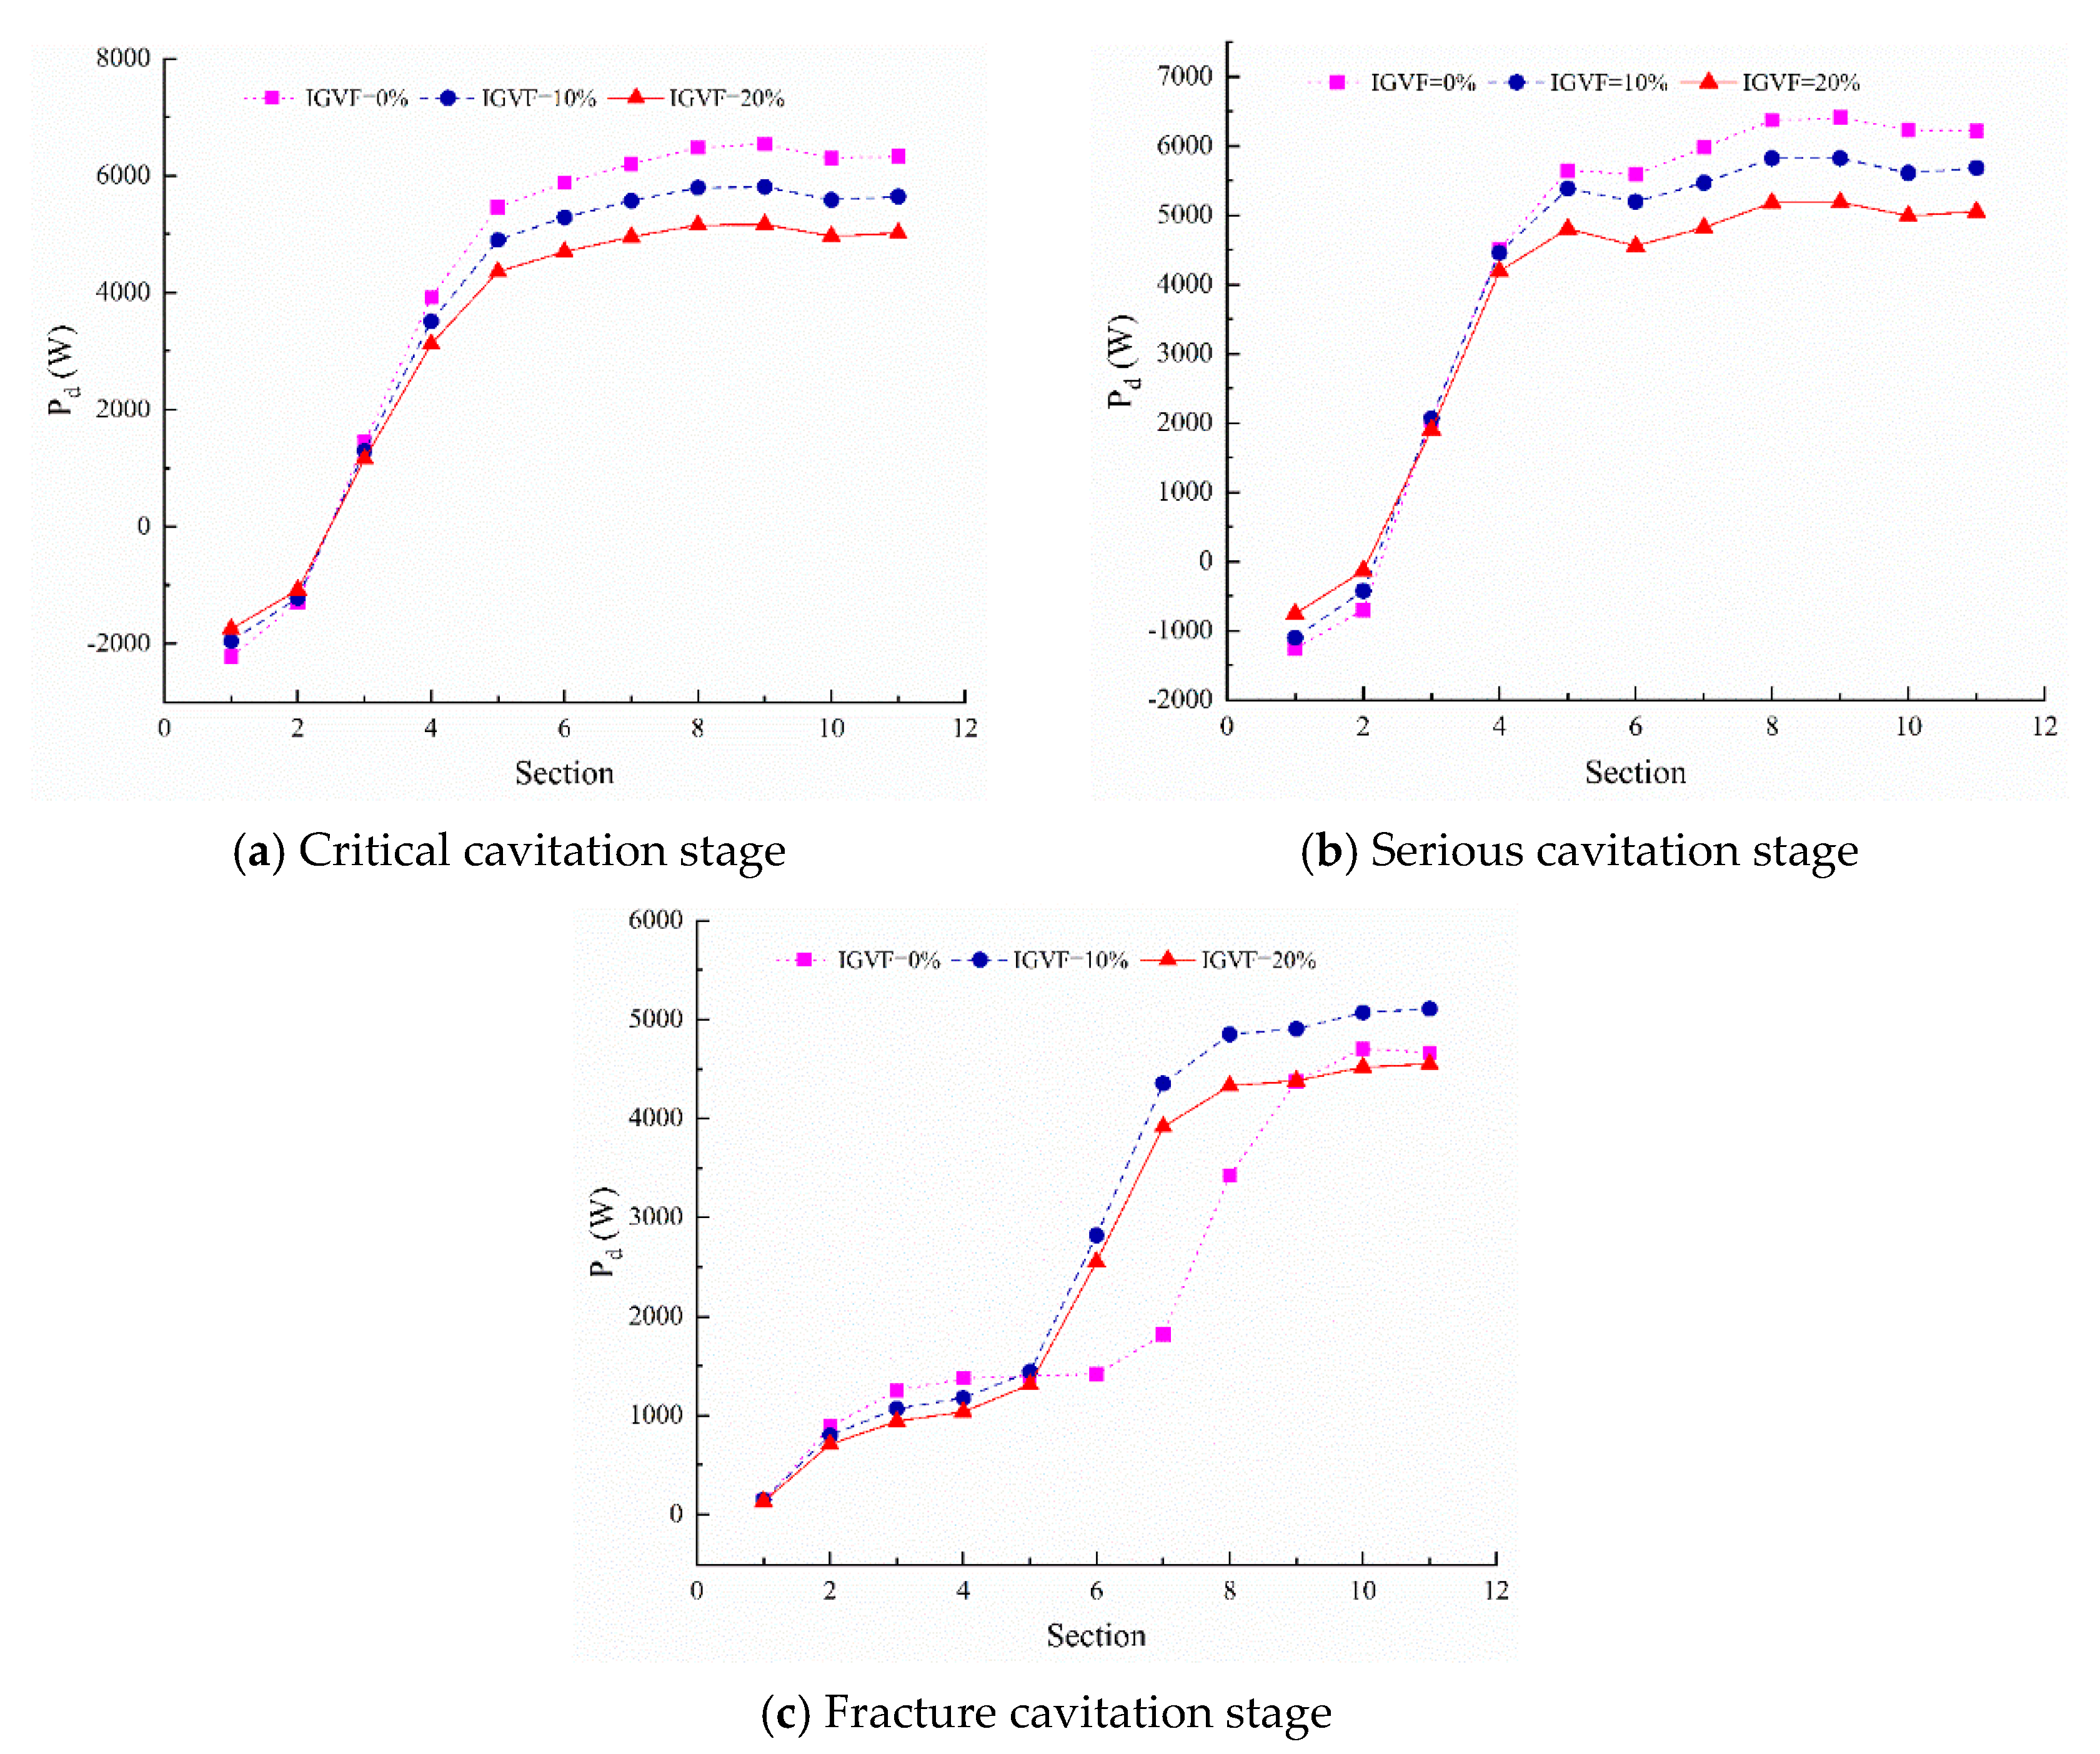
5.4. Effect of IGVFs on the Power through Each Section of the Impeller
To explore the effect of the IGVF on the variation rules of the total pressure power in the impeller domain of the multiphase pump at each cavitation stage, the total pressure power through each section was computed using Equation (2). There were variation curves of the total pressure power through 11 sections, including the inlet and outlet sections of the impeller under different IGVFs at different cavitation stages, as shown in
Figure 13.
As can be seen from
Figure 13, at the critical and serious cavitation stages, the IGVF had little influence on the total pressure power in the range from Section 1 to Section 4. However, the further the section was from the impeller inlet, the greater the effect of the IGVF on the total pressure power. The larger values of the total pressure power were concentrated mainly in the range from Section 5 to Section 11. Additionally, at the fracture cavitation stage, the IGVF had little effect on the total pressure power in the range from Section 1 to Section 5, while the effect became obvious from Section 5 to the outlet of the impeller, especially in the condition of the gas-liquid two phases. Furthermore, it could also be seen that with the development of the cavitation, the total pressure power through each section of the impeller assumed a decreasing trend.
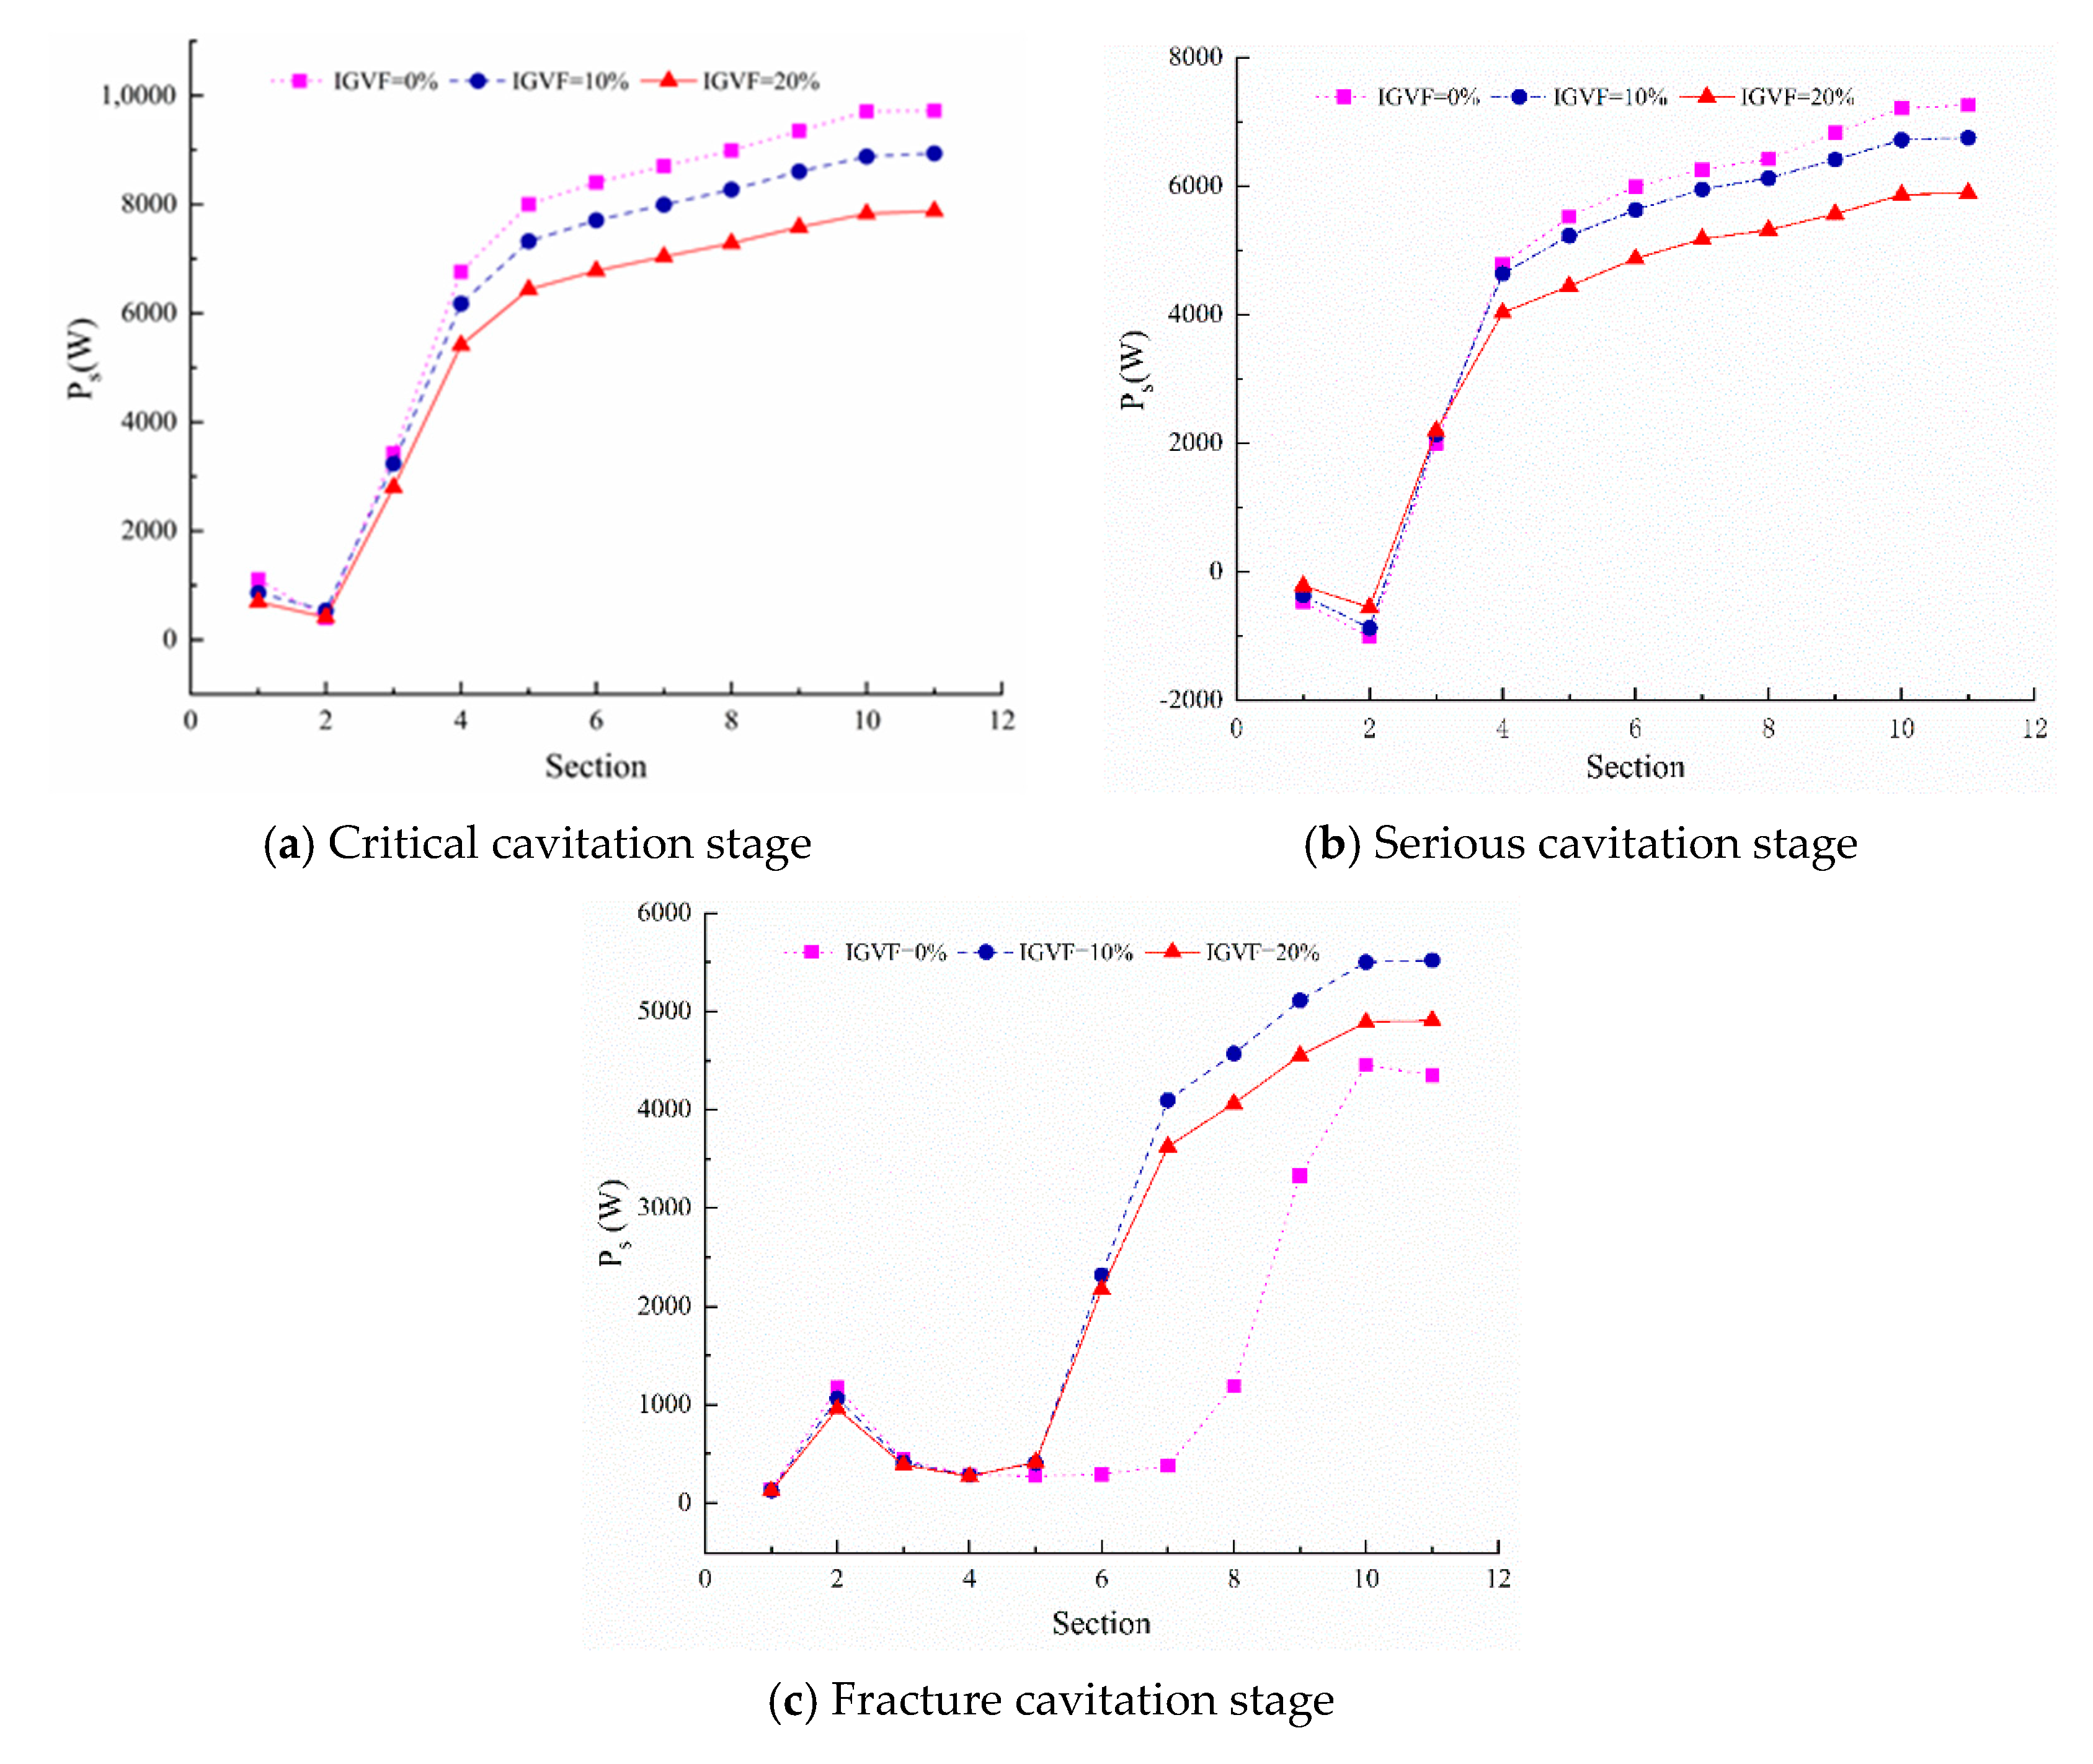
The total pressure power was divided into the static pressure power and dynamic pressure power to investigate the variation rules of the total pressure power through each section in detail. The distribution curves of the static pressure power and dynamic pressure power through each section under different IGVFs at each cavitation stage are provided in
Figure 14 and
Figure 15, respectively.
As seen in
Figure 14, the variation trend of the static pressure power curves through each section of the impeller was the same as that of the total pressure power. However, contrasting
Figure 13 with
Figure 14, it can be seen that with the IGVF increasing, the total pressure power of the impeller inlet increased at the critical cavitation stage, while the static pressure power of the impeller inlet decreased when the cavitation developed to the serious cavitation.
Figure 15 shows that when the IGVF was 0%, the dynamic pressure power of the impeller was nearly increased along the streamwise direction at each cavitation stage. At the same time, the dynamic pressure power through each section increased greatly at first and then had a smooth increasing trend at the critical and serious cavitation stages. However, it increased steadily at first, then increased dramatically and finally became stable at the fracture cavitation stage. At the critical and serious cavitation stages, with the increase of the IGVF, the dynamic pressure power increased within the range from Section 1 to Section 3, while it decreased within the range from Section 4 to Section 11. At the fracture cavitation stage, in the range from Section 1 to Section 5, the variation trend of the dynamic pressure power with the IGVF increasing was opposite that at the first two cavitation stages.
In summary, the IGVF had little effect on the total, static and dynamic pressure power at the fore area of the multiphase pump impeller, while the effect was dramatic at the back area of the impeller, and the effect was greater with the cavitation developing.
5.5. Effect of IGVFs on the Net Energy Gained by the Fluid within the Impeller Domain
To further study the influence of the change of the IGVF on the net energy gained by the fluid within the impeller domain at each cavitation stage, the net energy gained by the fluid within each domain, which is the difference of the total pressure power between two adjacent sections, was analyzed. The variation curves of the net energy gained by the fluid within each domain of the multiphase pump impeller under different IGVFs at different cavitation stages are provided in
Figure 16. From
Figure 16, it can be found that when the IGVF was 0%, the net energy gained by the fluid gathered mainly in the first four domains of the impeller at the critical and serious cavitation stages; compared with the first two cavitation stages, there was the decrease by a large margin of the net energy from Domain 2 to Domain 5 of the impeller, and the net energy from Domain 7 to Domain 10 increased greatly at the fracture cavitation stage. Furthermore, with the IGVF increasing to 10% and 20%, the increasing and decreasing trend of the net energy gained by the fluid within each fluid domain of the impeller was almost the same as that when the IGVF was 0%, and the net energy gradually reduced with the increase of the IGVF at the critical and serious cavitation stages. As the cavitation developed to the fracture cavitation, compared with the IGVF of 0%, the net energy from Domain 4 to Domain 6 presented different degrees of increase, while the net energy from Domain 7 to Domain 9 decreased sharply with the IGVF increasing to 10%. The net energy gained by the fluid was concentrated in the back area of the impeller. However, the main area where the fluid gained the net energy moved from the back area to the fore area of the impeller with an increase in the IGVF.
According to
Figure 10,
Figure 11 and
Figure 12 and
Figure 16, under different cavitation stages and IGVFs, the impeller’s output power to the fluid domain and the net energy obtained by the fluid domain have completely consistent variation trends. In both the critical and serious cavitation stages, the position of the impeller for better work performance was in the fore part of the impeller. In the stage of fracture cavitation, the position of the impeller for better work performance was in the back area. The main work region of the multiphase pump moved from the back area to the fore area of the impeller with an increase in the IGVF.


