Article

Comparative Study of a Life Cycle Assessment for Bio-Plastic Straws and Paper Straws: Malaysia’s Perspective

1
Malaysia-Japan International Institute of Technology, Universiti Teknologi Malaysia, Jalan Sultan Yahya Petra, Kuala Lumpur 54100, Malaysia
2
Faculty of Bioengineering and Technology, Jeli Campus, Universiti Malaysia Kelantan, Jeli, Kelantan 17600, Malaysia
3
Chemical Engineering Department, Universiti Teknologi PETRONAS, Seri Iskandar, Perak 32610, Malaysia
4
School of Engineering, Monash University Malaysia, Jalan Lagoon Selatan, Bandar Sunway, Selangor 47500, Malaysia
*
Author to whom correspondence should be addressed.
Processes 2021, 9(6), 1007; https://doi.org/10.3390/pr9061007
Submission received: 30 March 2021 / Revised: 30 May 2021 / Accepted: 2 June 2021 / Published: 7 June 2021
(This article belongs to the Special Issue New Processes: Working towards a Sustainable Society)

Abstract

:
Plastics are used for various applications, including in the food and beverage industry, for the manufacturing of plastic utensils and straws. The higher utilization of plastic straws has indirectly resulted in the significant disposal of plastic waste, which has become a serious environmental issue. Alternatively, bio-plastic and paper straws have been introduced to reduce plastic waste. However, limited studies are available on the environmental assessment of drinking straws. Life cycle assessment (LCA) studies for bio-plastic and paper straws have not been comprehensively performed previously. Therefore, the impact of both bio-plastic and paper straws on the environment are quantified and compared in this study. Parameters, such as the global warming potential (GWP), acidification potential (AP) and eutrophication potential (EP), were evaluated. The input–output data of the bio-plastic and paper straws processes from a gate-to-grave analysis were obtained from the literature and generated using the SuperPro Designer V9 process simulator. The results show that bio-plastic straws, which are also known as polylactic acid (PLA) straws, had reduced environmental impacts compared to paper straws. The outcomes of this work provide an insight into the application of bio-plastic and paper straws in effectively reducing the impact on the environment and in promoting sustainability, especially from the perspective of Malaysia.

Graphical Abstract

1. Introduction

Plastic pollution is a serious and long-standing issue that threatens human health at a global scale. The issue is alarming as plastic is non-biodegradable and does not completely disintegrate [1]. In fact, Malaysia has been listed as the eighth-worst country worldwide for the mismanagement of plastic waste [2]. It was estimated that there were almost one million tons of mismanaged plastic waste in Malaysia, of which 0.14 to 0.37 million tons may have been washed into the oceans in 2010 [3]. The incineration of plastic waste could emit dioxin, which is carcinogenic and a hormone disruptor, and, with persistent exposure, dioxin can accumulate in human body fat [4] and cause toxicity. Moreover, plastic packaging and straws that have been washed into the ocean and were disposed of in landfills also threaten the lives of the marine and land animals [5]. According to the United States National Oceanographic and Atmospheric Administration, plastic debris kills an estimated 100,000 marine mammals and millions of birds and fishes annually [6].
One of the strategies to reduce plastic waste and the resulting pollution issues is to replace conventional fossil-based plastics, such as polyethylene (PE) and polypropylene (PP), with bio-plastics. Bio-plastics can be produced from renewable feedstocks without depleting natural resources, and they can biodegrade at a much faster rate than conventional plastics. Polylactic acid (PLA) is one of the most commonly used bio-plastics recently due to its versatility and biodegradable properties [7]. A previous study reported that the application of a polybutylene succinate (PBS) and PLA mixture to produce bio-plastic straws resulted in a lower carbon footprint compared to conventional PP straws [8].
In addition to bio-plastic, paper is also an alternative to plastic. In comparison to the conventional fossil-based plastics, paper is manufactured from logs wood, which is also a renewable source. Therefore, paper is usually claimed to be more environmentally friendly. However, the usage of either paper straws or bio-plastic straws can also pose some impacts on the environment [9].
To date, the study of environmental impacts has been conducted using different analytical tools, such as material flow analysis (MFA), environmental impact assessment (EIA), and life cycle assessment (LCA). LCA is defined as the compilation and evaluation of inputs, outputs, and environmental impacts of a product system throughout its life cycle according to the ISO 14,040 standard [10]. It is a structured step-by-step framework, which defines the goal and functional unit and leads to impact assessment [11].
Among the environmental impact categories, global warming potential (GWP) is an important indicator [12]. GWP represents the amount of carbon dioxide (CO2) and other greenhouse gases (GHGs) emitted over a full life cycle of a process or a product. Meanwhile, acidification potential (AP) is associated with atmospheric pollution arising from anthropogenically derived sulfur (S) and nitrogen (N) as nitrogen oxides (NOx) or ammonia (NH3). Anthropogenically derived pollutant deposition was found to enhance the rate of acidification and increase the natural neutralizing capacity of soils [13]. Soil acidification is also one of the major contemporary environmental issues globally. Acidification potential is usually calculated in sulfur dioxide equivalents (SO2-eq) [14].
On the other hand, eutrophication potential (EP) is linked to the release of macronutrients, such as nitrogen (N) and phosphorus (P), into the air, water, and land, which can affect both aquatic and terrestrial environments. A high level of nutrients can cause a deplorable composition shift in species living in a polluted environment. The presence of macronutrients in water systems often causes algal blooms, which impact the aquatic ecosystem and domestic water quality.
About 300 million tons of plastic products are produced every year, and half of them are single-use types, such as cups, straws, and shopping bags. A preliminary investigation of marine litter pollution along a beach in India during the period of observation from January to March 2020 found plastic straws as the third most common debris at 9.3% [15] Meanwhile, straws and stirrers ranked fifth, representing 7.9% among the most common debris found in the International Coastal Ocean Cleanup in year 2019 [16].
In Malaysia, it was estimated that each person uses one straw daily, amounting to 30 million straws being used daily. This usage of straws per capita varies from country to country. For example, it was estimated that the straw usage in the United States of America was at an average daily rate of 1.6 straws per capita. This is a total of 500 million plastic straws being used every day in the United States alone [17]. In addition, collectively, up to 8.3 billion plastic straws were estimated to pollute the world’s beaches [18]. Therefore, aligning with the global effort to reduce plastic waste, in 2019, the Malaysian government implemented a ban on single-use plastic straws [19]. This increased the awareness of sustainability and the use of alternative straws. While some may argue the effectiveness of banning plastic straw usage to promote a reduction in plastic waste, with the ban on single-use plastic straws, the shift towards alternative straws has been gaining momentum. To the best of our knowledge, there is limited environmental analysis of alternative drinking straws, especially from the Malaysian perspective. Thus far, there are limited studies available on the environmental assessment of drinking straws. A search of the keyword “drinking straws” in the Scopus database showed 334 available published documents. However, further filtering using the additional search parameter “life cycle assessment” showed seven published documents, of which only one paper was relevant. Limited results showed environmental assessment for different types of plastics and/or straws. LCA of PP, PLA, paper, glass, and stainless steel from cradle to grave was carried out by Chitaka et al. [20], and the results showed that paper straws had the least impact as compared to the other types of raw materials. However, Rana [21] found that stainless steel straws had a significantly lower overall environmental impact than that of other straws. LCA for PP, stainless steel, borosilicate glass, paper, bamboo, and wheat stem straws from cradle to grave was performed by Zanghelini et al. [22], and it showed that plastic drinking straws posed a lower environmental impact when compared to reusable straws. Meanwhile, Chang and Tan [23] developed an integrated sustainability assessment of drinking straws. The study was carried out to quantify the potential environmental impacts of different drinking straws based on the scenarios of different countries, such as South Africa [20] and Brazil [22]. However, no studies are found on the environmental assessments of drinking straws in a Malaysian scenario.
Information on the environmental impact of bio-plastic and paper is scarce. Hence, a significant research gap was noted in the evaluation of alternative natural drinking straws, especially from a Malaysian perspective. Therefore, this study aims to present the environmental impacts of both bio-plastic and paper straws from cradle to grave using the LCA approach. Specifically, the main environmental protection indicators, such as GWP, AP and EP, were evaluated. The work flow was arranged such that the methodology of the LCA was detailed, followed by the results and discussion. Finally, the conclusion and recommendations are presented.

2. Methodology

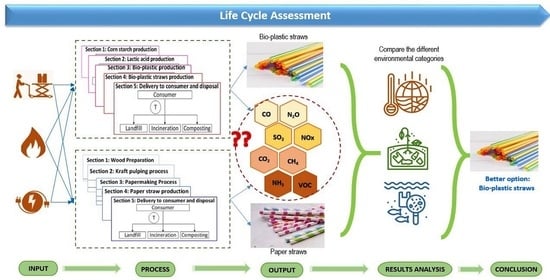
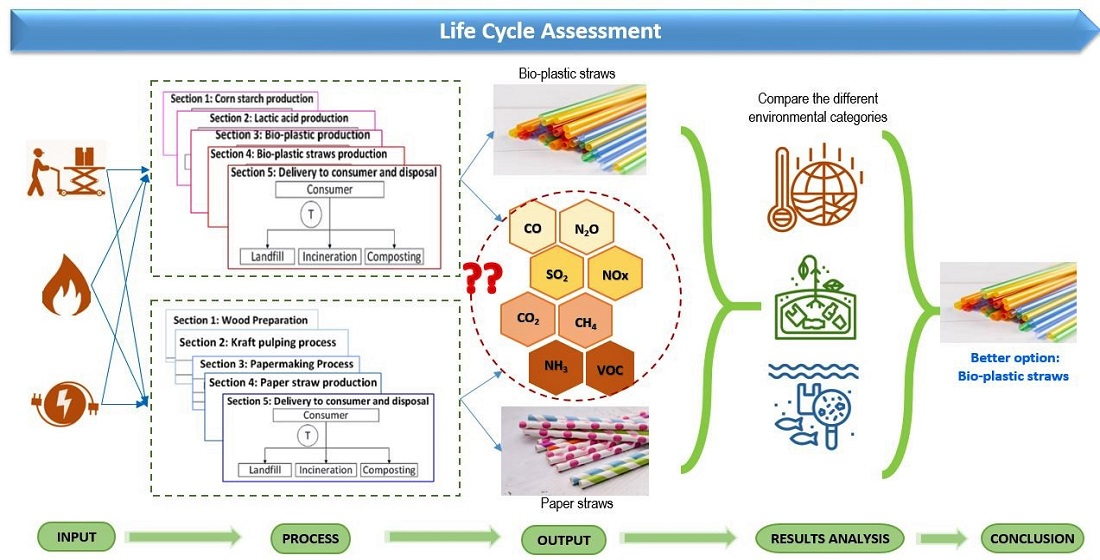
2.1. Life Cycle Assessment

There are four phases in a life cycle assessment, which are the goal and scope definition, inventory analysis, impact assessment and interpretation [11]. In this study, an LCA of bio-plastic and paper straws was carried out to evaluate their impacts on the environment.

2.2. Goal and Scope Definition

The goal of this study was to determine the overall environmental impact of bio-plastic and paper straws from the manufacturing of the raw materials (gate) to their end-of-life (grave). To compare the environmental impacts of bio-plastic and paper drinking straws, data were normalized to a functional unit of 100 units of drinking straws produced which was equivalent to 133 g of bio-plastic straws (given 1.33 g per straw) or 260 g of paper straws (given 2.60 g per straw).
Figure 1 and Figure 2 illustrate the bio-plastic straws and paper straws system boundaries in the study, respectively. The input and output data presented included each process that releases environmental pollutants, such as carbon monoxide (CO), carbon dioxide (CO2), nitrogen oxide (NOx), nitrous oxide (N2O), methane (CH4), ammonia (NH3), sulfur dioxide (SO2) and volatile organic compounds (VOC) into the atmosphere. Based on Figure 1, raw materials (raw corns, NH3 solution, sulfuric acid, and protease), electricity, and diesel fuel are fed into the system. Meanwhile, for the quantification of GWP, AP, and EP, the pollutants (CO, CO2, NOx, N2O, CH4, NH3, SO2, and VOC) were considered as the outputs.
The manufacturing process of bio-plastic straws consists of six main steps: the production of corn starch, the production of lactic acid, the production of bio-plastic, the production of bio-plastic straws, delivery to consumers, disposal, and transportation. During the production of raw corn starch, processes involved include corn steeping and the separation of germ, fiber, gluten, and starch, which were considered for the input–output data analysis [24]. Next, lactic acid was produced from corn starch by saccharification of starch followed by the fermentation of dextrose into lactic acid, microfiltration, acidification, rotary vacuum filtration, and, finally, evaporation. The bio-plastic production also included processes such as condensation, depolymerization, ring-opening polymerization, crystallization and granulation. Before the final step (straw delivery), extrusion, injection molding, labeling, and packaging steps were carried out. As bio-plastic straws are utilized for a single use, different disposal methods (landfills, incineration and composting) were evaluated. The wastes were equally divided among three different disposal methods with 33% for each. Moreover, the transportation of raw materials to the production site and the transportation of products to the consumer and to the disposal site were also considered in this study. It should be noted that there is no transportation between Section 2 (lactic acid preparation), Section 3 (bio-plastic production), and Section 4 (bio-plastic straw production) as these sections are assumed to occur at the same manufacturing facility (as shown in the Figure 1).
In addition, Figure 2 illustrates the overall system boundary of paper straws from the gate to the grave. The setting of the system boundaries was performed in manner similar to that of the bio-plastic straw products. The boundaries consisted of six sections of processes that started from the wood preparation, kraft pulping, papermaking, paper straw production, delivery to consumer and disposal site and transportation. The first three steps are the extraction and manufacturing processes of raw materials for paper straw production. The first step was the wood preparation, which consisted of debarking, chipping and conveying. The next step was the kraft pulping process, which consisted of three main units (energy generation, chemical recovery, and wastewater treatment). The papermaking process also involved paper refining and screening, paper reforming, pressing, finishing and drying before the production of paper straws. In the production of paper straws, there are five main units, which are the paper feeder, glue feeder, winding unit, cutting, and the collection unit. Similar to bio-plastic straws, paper straws are utilized for a single use. Therefore, the disposal methods of the bio-plastic straws, such as landfills, incineration, and composting, were included. The transportation of raw materials to the production site and the transportation of products to the consumer and the disposal site were also considered in this study. Similarly, for the bio-plastic straw, it should be noted that there was no transportation between Section 1 (wood preparation), Section 2 (kraft pulping process), and Section 3 (papermaking process) as these sections are assumed to occur at the same manufacturing facility (as shown in Figure 2).

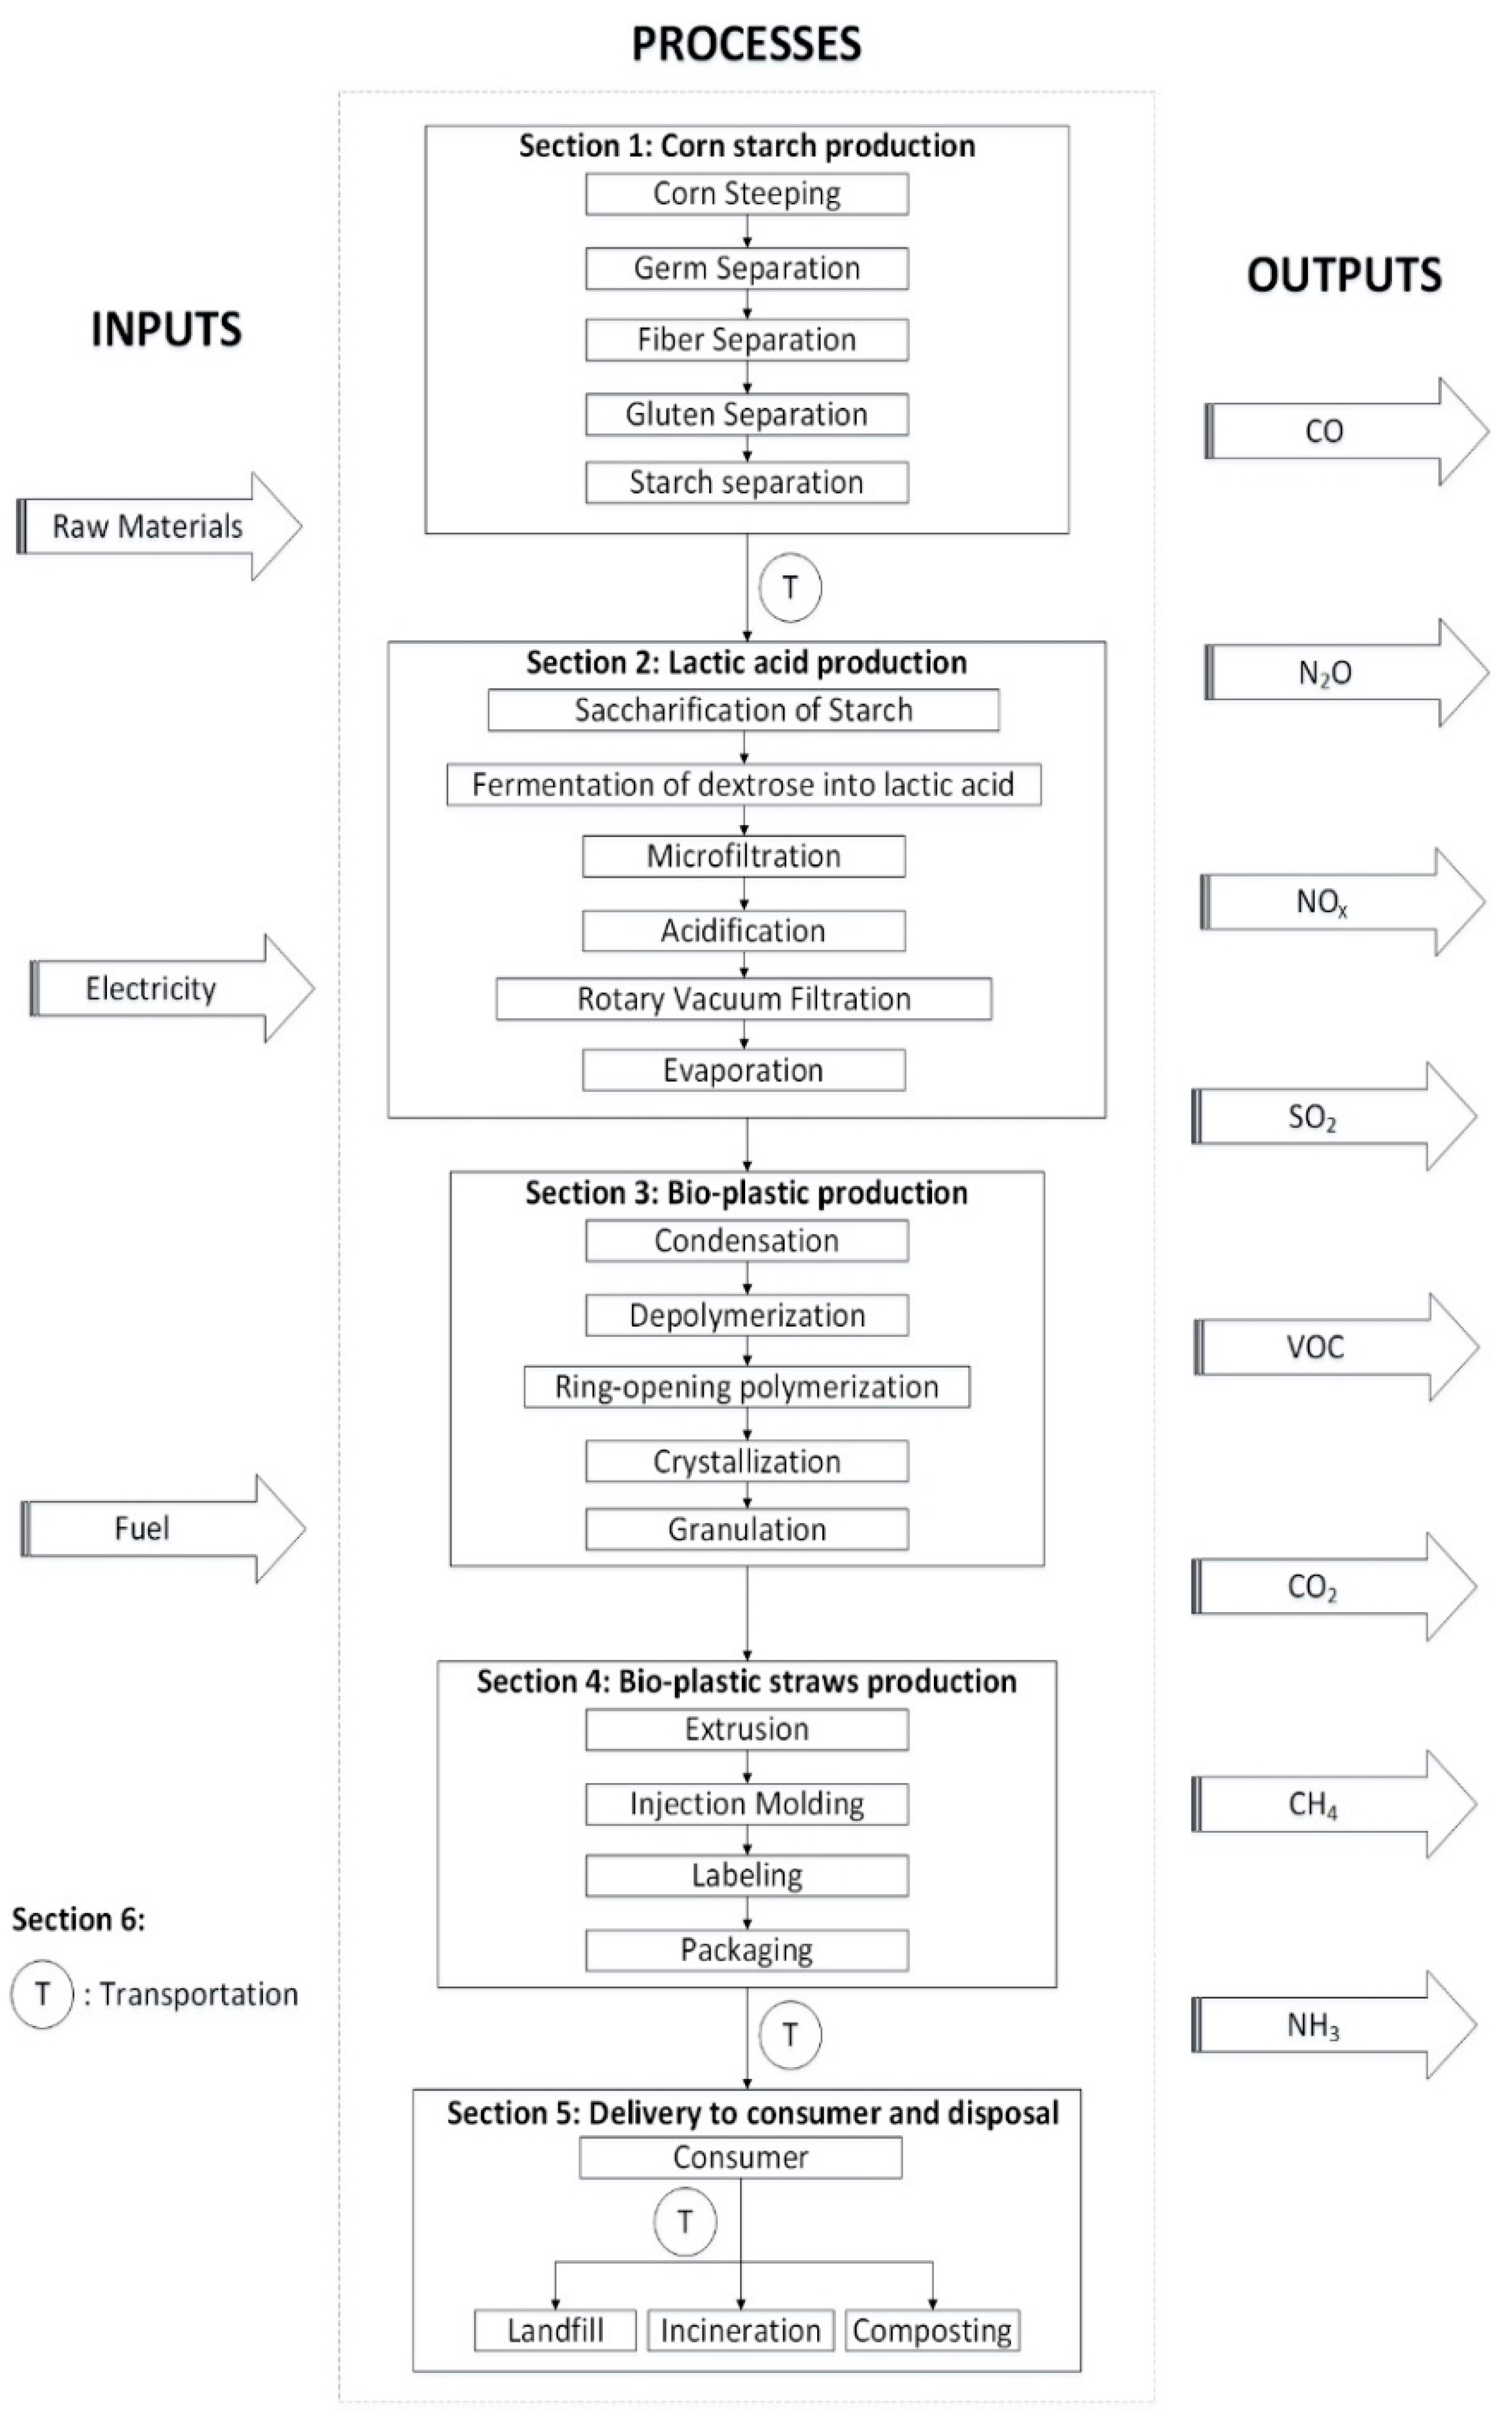
2.3. Inventory Analysis

A process simulation model was developed using a SuperPro Designer V9.0 based on Figure 1 and Figure 2. The process simulation flowsheet of bio-plastic and paper straws is shown in Figures S1–S7 (Supplementary Data). The following assumptions and limitations were made for the inventory analysis:
  • All calculations were based on 100 units of drinking straws produced, which were equal to 133 g of bio-plastic straws and 260 g of paper straws.
  • Corn starch production was adapted from the corn refinery simulation [24].
  • Similar physical properties in the injection molding of the PLA and the PP were assumed as the PLA straws are very flexible and perform similarly to conventional plastic straws made of PP [25].
  • For the kraft pulping process, biomass combustion was used in the energy generation, which is commonly used in the pulp and paper industry [26].
  • The disposal of bio-plastic and paper straws was equally divided between a composite facility, landfill and incineration. A similar amount of bio-plastic paper straws for each disposal method was ensured. The equal division was assumed for different disposal methods in order to analyze how each of the processes contributes to the GWP and AP [27].
  • The landfill sites of bio-plastic and paper straws are located in Malaysia. Thus, both landfill sites have similar site characteristics, i.e., weather, humidity and temperature.
  • The transportation of raw materials to the manufacturing site, the transportation of the product to the customer and the transportation of used bio-plastic and paper straws to disposal sites were based on the actual location of the supply chain in Peninsular Malaysia as a case study.
The equipment set-up in the process simulator SuperPro Designer v9.0 (by Intelligen Inc., Scotch Plains, NJ, USA) is illustrated in the Supplementary Data (Tables S1–S7). Based on the input as stipulated in Tables S1–S7, SuperPro Designer performs thorough material and energy balances and calculates each of the process’s environmentally significant stream properties. Then, the data are tabulated for further analysis. Details of the process data inventory for bio-plastic and paper straws can be obtained from the Supplementary Data (Tables S8 to S10). The quantity of the power consumption and emission of pollutants (mass of pollutant, mi) from each of the unit processes of the bio-plastic and paper straw production are essential to calculate the environmental impact categories.

2.4. Impact Assessment

The purpose of the impact assessment is to convert and aggregate the inventory analysis findings into the relevant environmental indicator. This can be explained as the transformation of the inventory results into the number of contributions to environmental impact categories (GWP, AP and EP). The main environmental effects identified by the European Commission in the Economics and Cross-Media Effects document includes global warming, acidification, and eutrophication [28].
All the identified environmental potential indexes were evaluated using the expressions summarized in Table 1. The main parameters used in the formula are the mass (mi) in kilograms (kg) of a specific pollutant released to the air and pollutant specific weighting factors (GWPi, APi and EPi). These factors are representative of potential environmental effects per mass unit of the specific pollutant.
Each of the environmental potential indexes was evaluated as the sum of the effects of several pollutants based on the data tabulated in Tables S8 to S10. Each pollutant mass (mi) was weighted by a specific weighting factor, which was expressed based on a reference substance. This allows a direct comparison and summation of the effects of several unrelated pollutants according to a cross-media effect assessment approach.
The specific weighting factor values for selected pollutants are listed in Table 2. The weight of various pollutants can be different as displayed in Table 2. In general, the sum of each considered potential index can be calculated once the pollutant mass levels are specified using the expression and specific factors reported in Table 1 and Table 2, respectively. For instance, to calculate the GWP for Section 1 of bio-plastic straws production, all the pollutants related to GWP were taken into the calculation, as shown in Table 3. The total GWP of individual process (such as corn steeping) can be calculated (0.26 × 2 + 0.03 × 3 + 1100)/1000 = 1.1). The total GWP of Section 1 is the summation of the GWP of each individual process.
The generation of 1 MJ of electricity emits a specific amount of pollutants [30,31] and further contributes to the GWP, AP and EP. The GWP is impacted by CO, CO2 and VOC, while the AP is impacted by SO2 and NOx. The EP is impacted by NOx. The GWP is impacted by CO, CO2 and VOC, while the AP is impacted by SO2 and NOx. The EP is impacted by NOx. These data were obtained from the power consumption of Tables S8–S10 (Supplementary Data).
The transportation distances from the corn plantation site to the corn starch production site, corn starch production site to straw manufacturing plant, straw manufacturing plant to consumer and, finally, consumer to the disposal site (i.e., incinerator, composting facility, and landfill) were taken into consideration based on the sites in Malaysia. The total distance of bio-plastic straws is tabulated in Table 4. Similarly, Table 5 illustrates the transportation details of the paper straws, which include the transportation of raw wood to the paper mill, paper to paper straws, paper straws to the consumers, and, lastly, the used paper straws transferred for end-of-life processing.
The details of the different locations are referenced based on the existing sites located in Malaysia (Supplementary Data Figures S9 and S10 for bio-plastic and paper straws, respectively). It was assumed that a medium- and heavy-duty truck was employed throughout the transportation of the raw materials and products. The emission factors of the transport used are shown in Table 6 to calculate the environmental impact based on the total distances in Table 4 and Table 5.

2.5. Data Interpretation

The final step in the LCA according to the ISO 14,044 standard on environmental management is interpretation. There are three main objectives of LCA interpretation. The first objective is to identify significant issues based on the LCA results. Next is the evaluation of completeness, sensitivity and consistency. The results were interpreted according to the goal and scope of the study, which includes an assessment and a sensitivity evaluation of the significant inputs, outputs and methodological choices to understand the uncertainty of the results. According to ISO 14044, the process of the completeness check identifies any missing or incomplete information which is related to the goal and scope of the LCA, and, if there is any, it shall be recorded and justified. The consistency check can also be defined as a process to determine whether the assumptions, methods and data are consistent with the goal and scope. The process addressed the data quality, regional and/or temporal differences, system boundary, and consistency of impact assessment. The findings from this research were compared to those of other similar studies to detect any incomplete or erroneous data. Note that the data input of the equipment setup during the initial simulation is based on the judgement of the researchers after considering the expert input and literature review. As such, the value may vary if the type of the equipment is varied and the efficiency of the equipment is improved. In summary, data validation was conducted and compared with the published research, and then the conclusions were drawn in line with the study objectives.

3. Results and Discussion

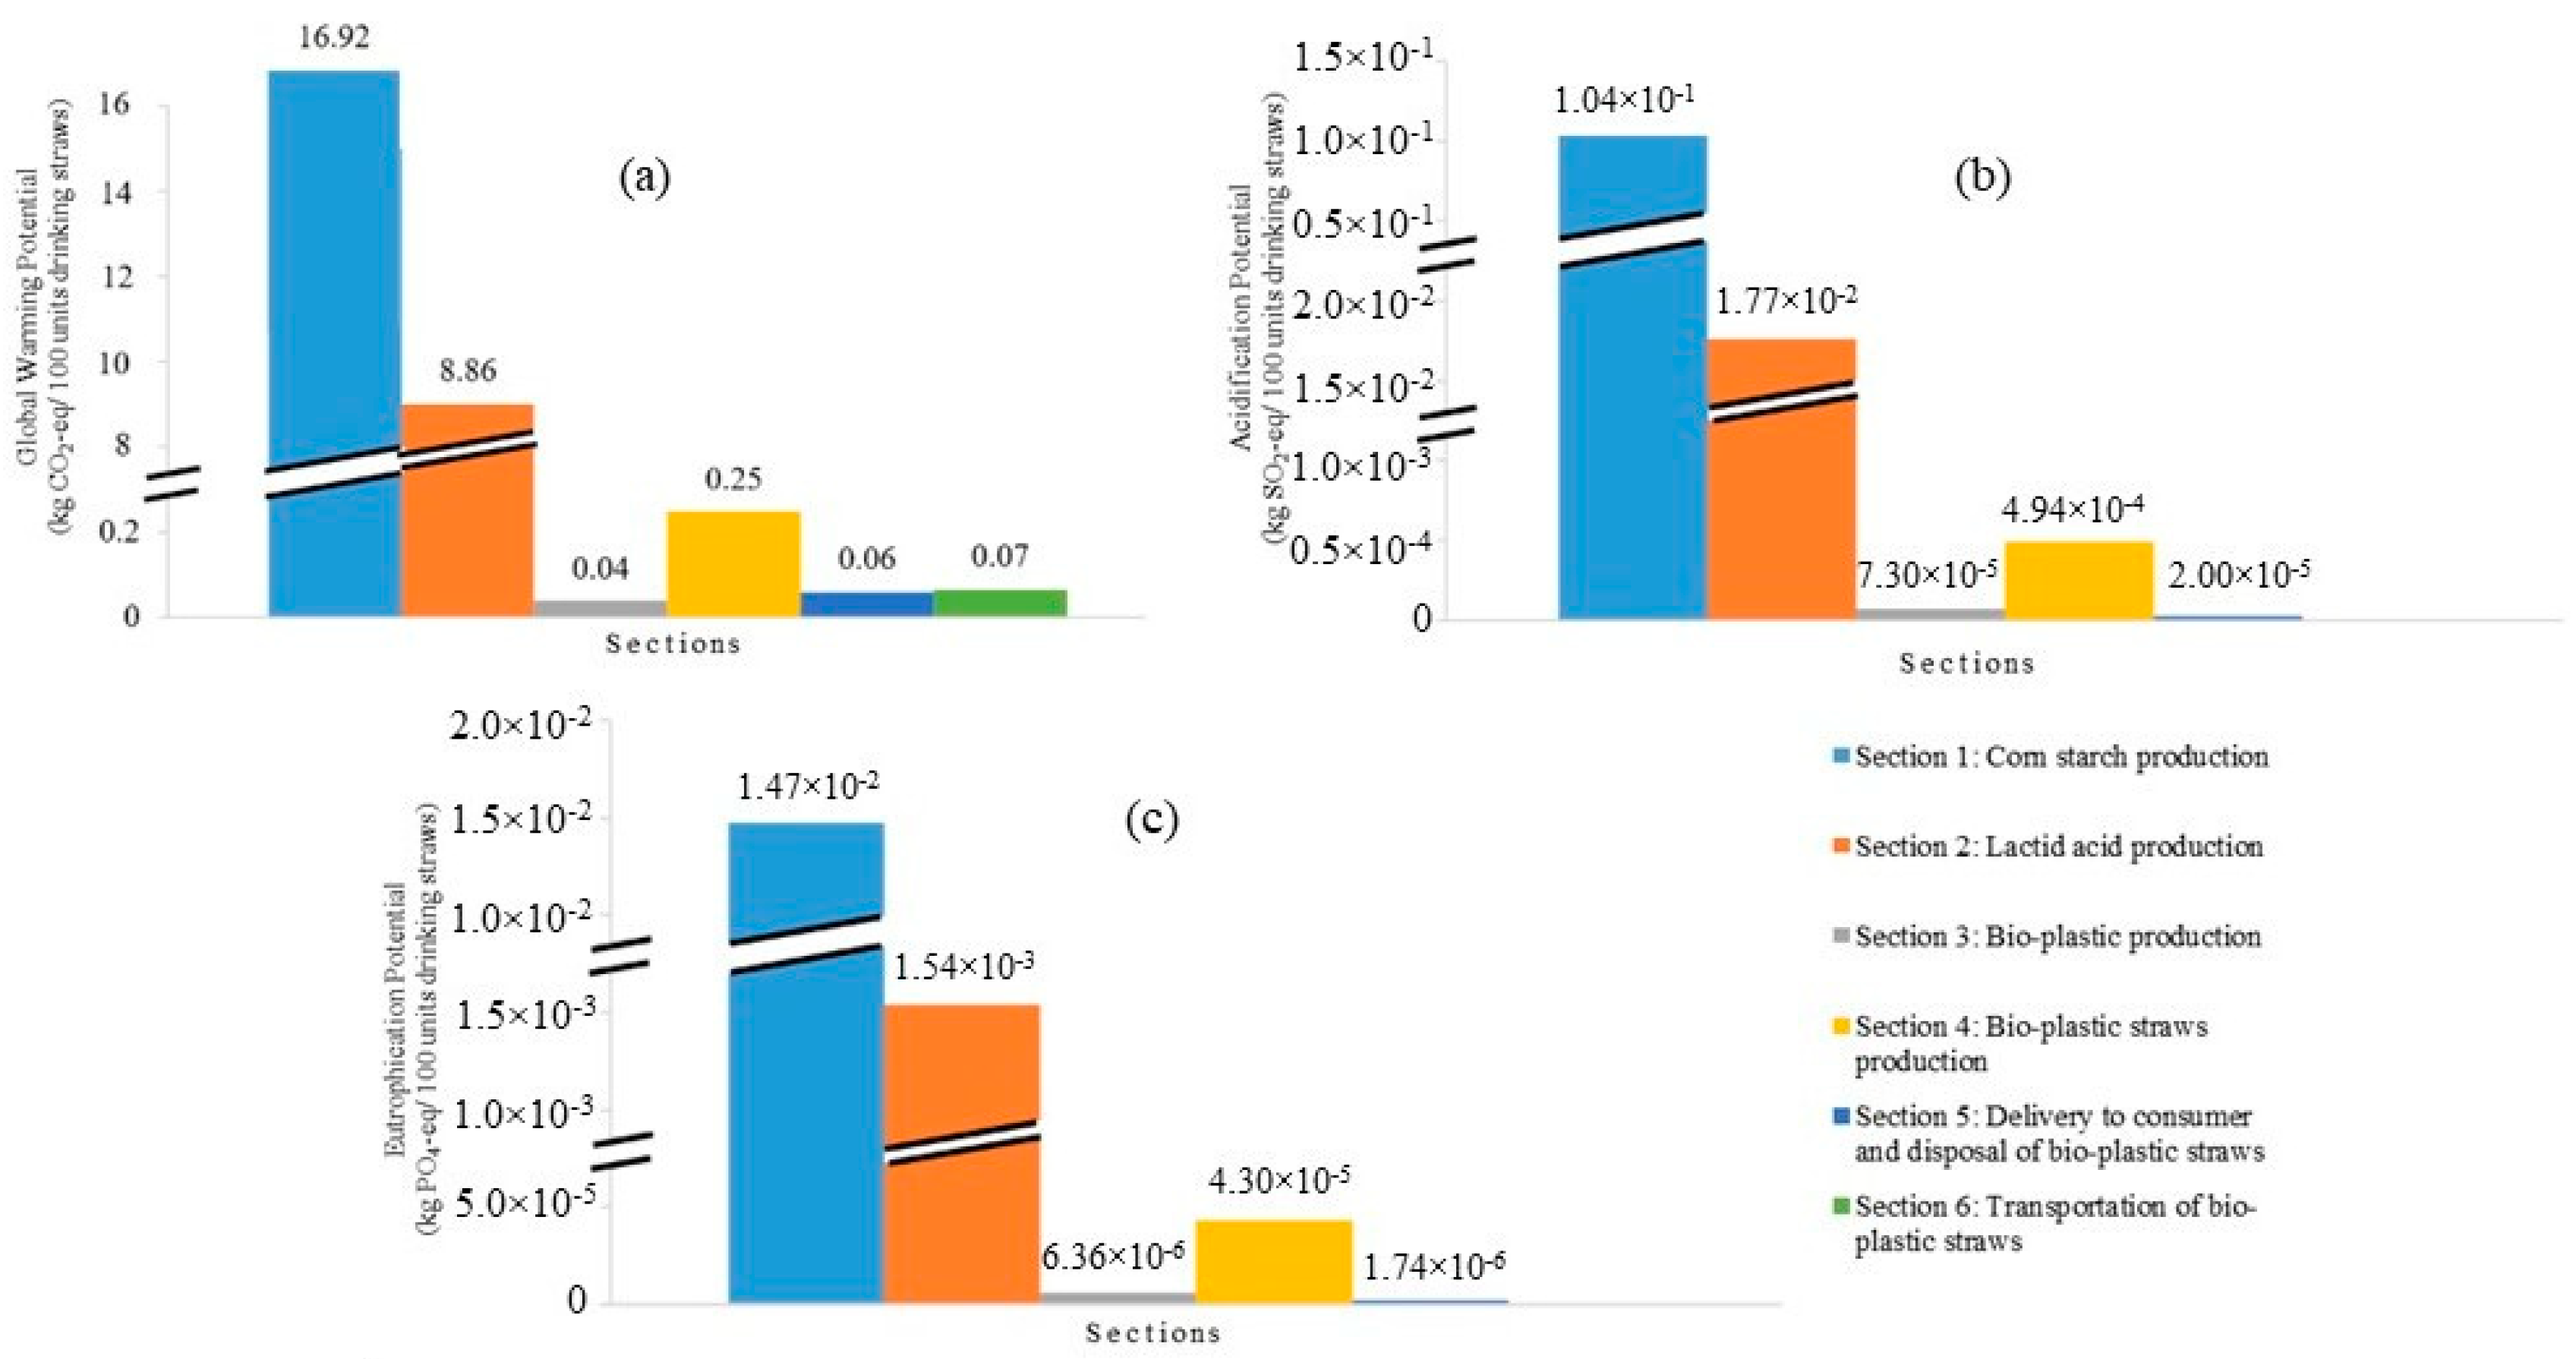
3.1. Overall Result of Bio-Plastic Straws

Figure 3 shows the GWP, AP and EP of bio-plastic straws. The initial sections of the whole process, which are Sections 1 and 2, emitted a high amount of pollutants which contributed to the three impacts. These processes included the production of starch from raw corn followed by the production of lactic acid from the starch, which required a relatively high amount of electricity. The extraction of the lactic acid from the raw corn involves a series of energy-intensive process such as corn steeping, starch separation, saccharification of the starch, fermentation and purification [24]. Therefore, a huge amount of carbon dioxide was emitted to the environment and resulted in a high GWP for the overall process. The amount of AP and EP in Section 1 was much higher than that in Section 2 due to the release of NH3 during germ, gluten and starch separation. Overall, the electricity consumption greatly reduced starting from Section 3 onwards where bio-plastic was produced, until Section 5 of the system boundary (Figure 1) where delivery to the consumer and the disposal of bio-plastic straws took place. This could be attributed to the lower energy-intensive processes in the later sections of the overall manufacturing process of bio-plastic straws.
In Section 4, where the bio-plastic straw production was carried out, small amounts of pollutants contributing to GWP, AP and EP were captured in the inventory list. This could be due to the continuous high amount of heat required to melt the PLA pellets in the extrusion process. Therefore, a high amount of electricity supply was required in Section 4. Lower AP and EP were noted as Section 5 of the system boundary involves delivery to the consumer and the disposal of straws. These were mainly due to a smaller amount of NOx and SOx emitted during the processes in Section 5 of the system boundary. In Section 6 of the system boundary (Figure 1), AP and EP were observed to be zero because CO2, CH4, and N2O were the only pollutants considered during the transportation section.

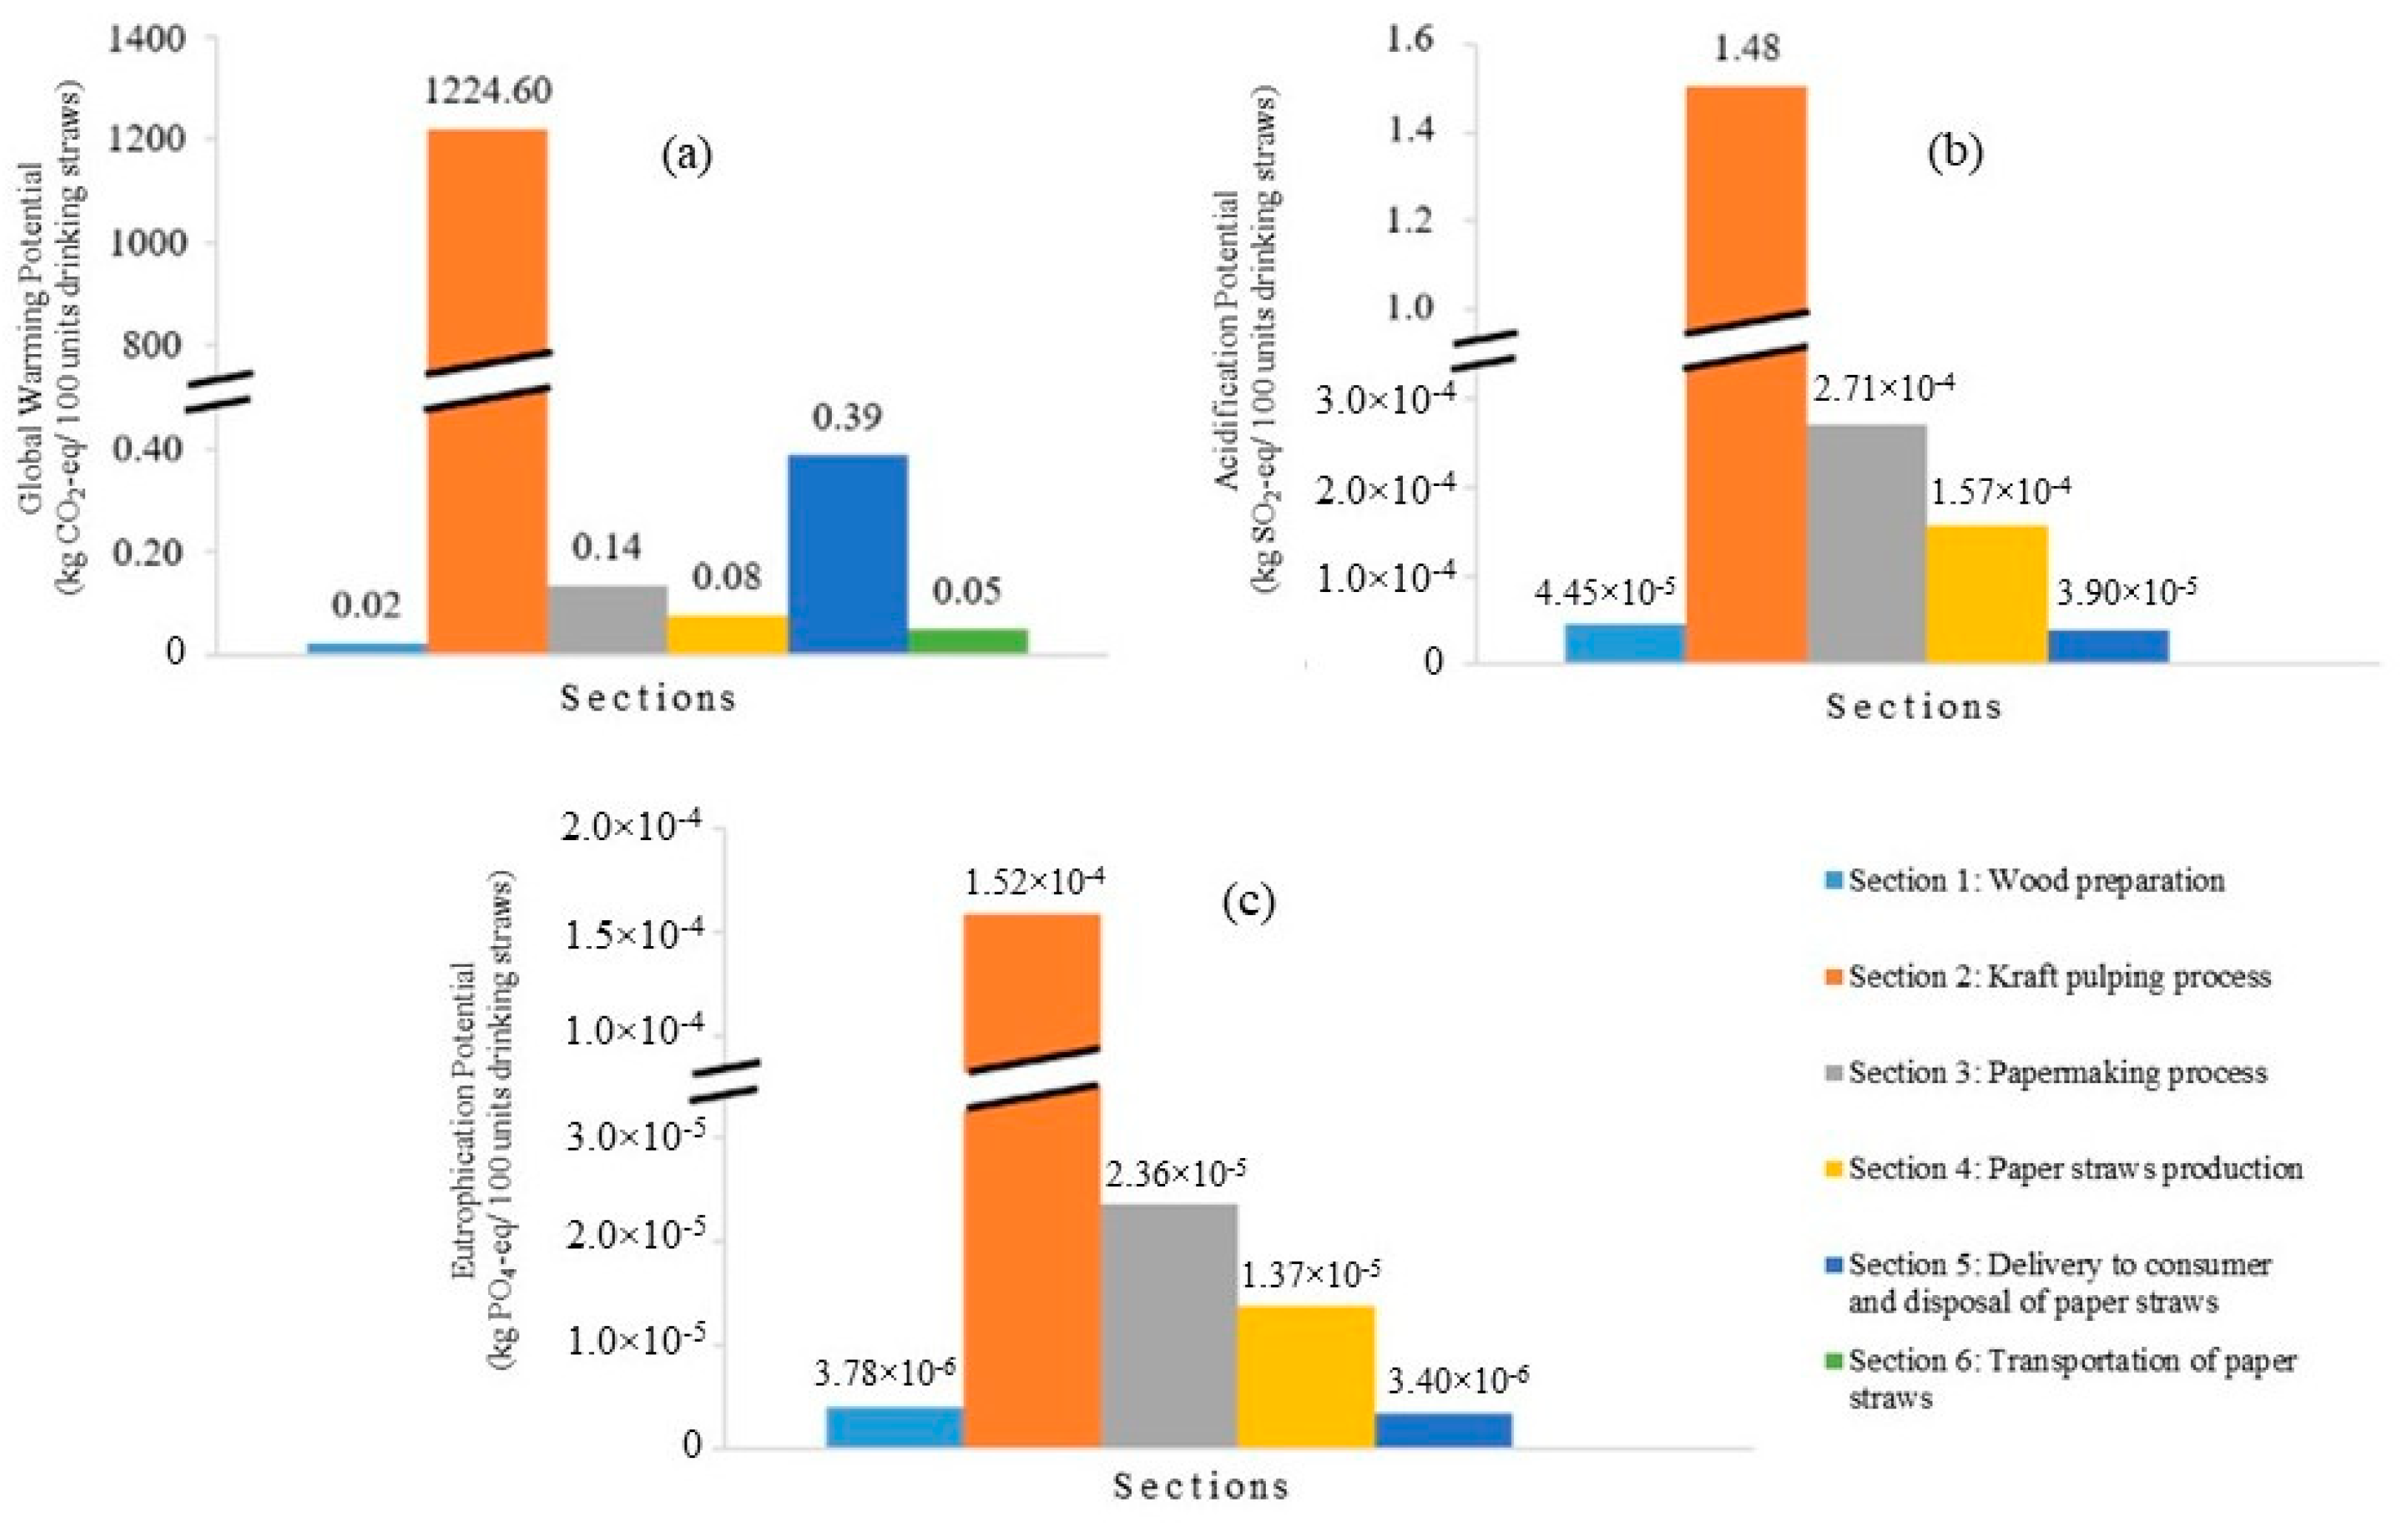
3.2. Overall Result of Paper Straws

Based on Figure 4, it can be observed that Section 2 contributed to the highest GWP, AP and EP compared to other sections. Section 2 involves the kraft pulping process where wood chips were converted into pulp, which was further processed into paper. There are three main units in the kraft pulping process section, which are the energy generation, chemical recovery and wastewater treatment. The energy generation unit contributed to the highest GWP, AP and EP due to the biomass combustion, which released high amounts of carbon dioxide, methane, nitrous oxide and nitrogen oxides [26].
Section 5 of the system boundary, which includes disposal of paper straws by composting, landfill or incineration, contributed to the highest GWP, followed by Sections 3 and 4. The highest GWP noted in Section 5 of the system boundary could be attributed to the emission of methane from the landfill. On the contrary, Section 1 (the wood preparation process) contributed to the least GWP. No emission of pollutants was involved in the wood preparation process except a small amount of electricity that was used for the debarking, chipping, and conveying process [33]. Section 3 (the papermaking process, which consumed a high amount of electricity) contributed to the highest AP compared to other sections. There were several processes in Section 3, which included paper refining and screening, paper forming, pressing, finishing and paper drying. Paper forming, pressing, and finishing processes required the most electricity annually and therefore resulted in a high AP. By contrast, the disposal of paper straws (Section 5 of the system boundary) contributed the least to AP.

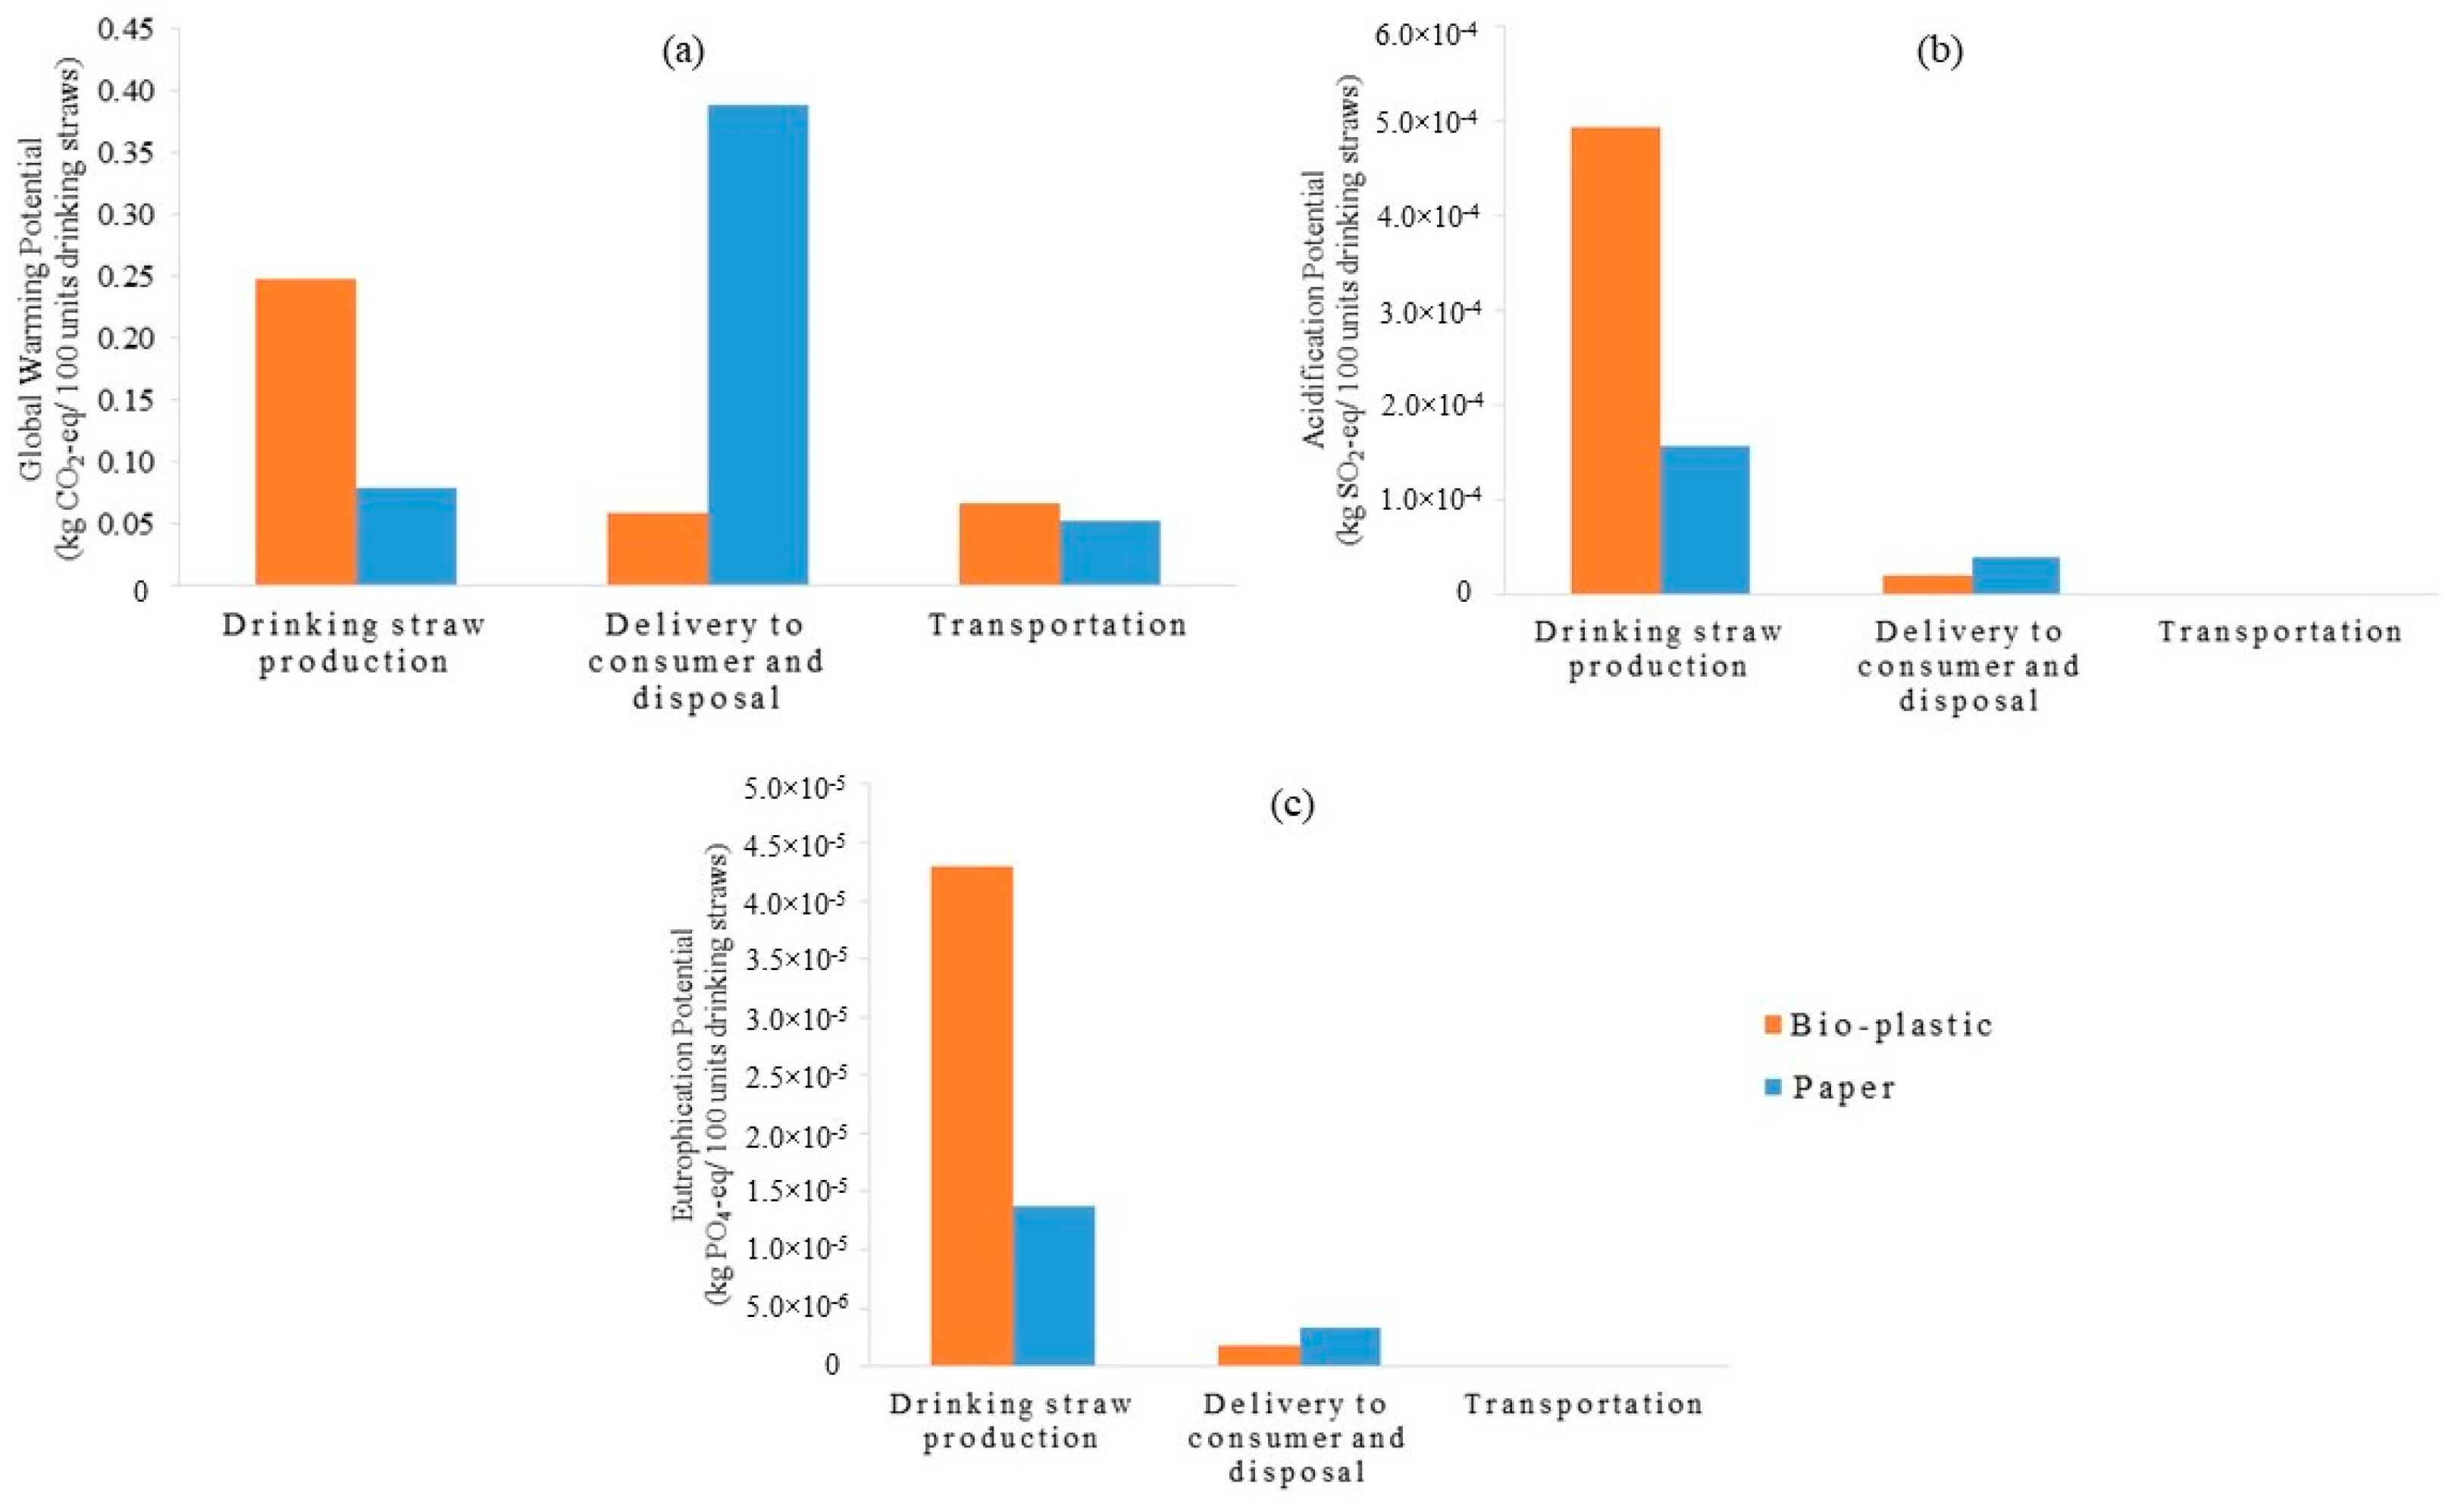
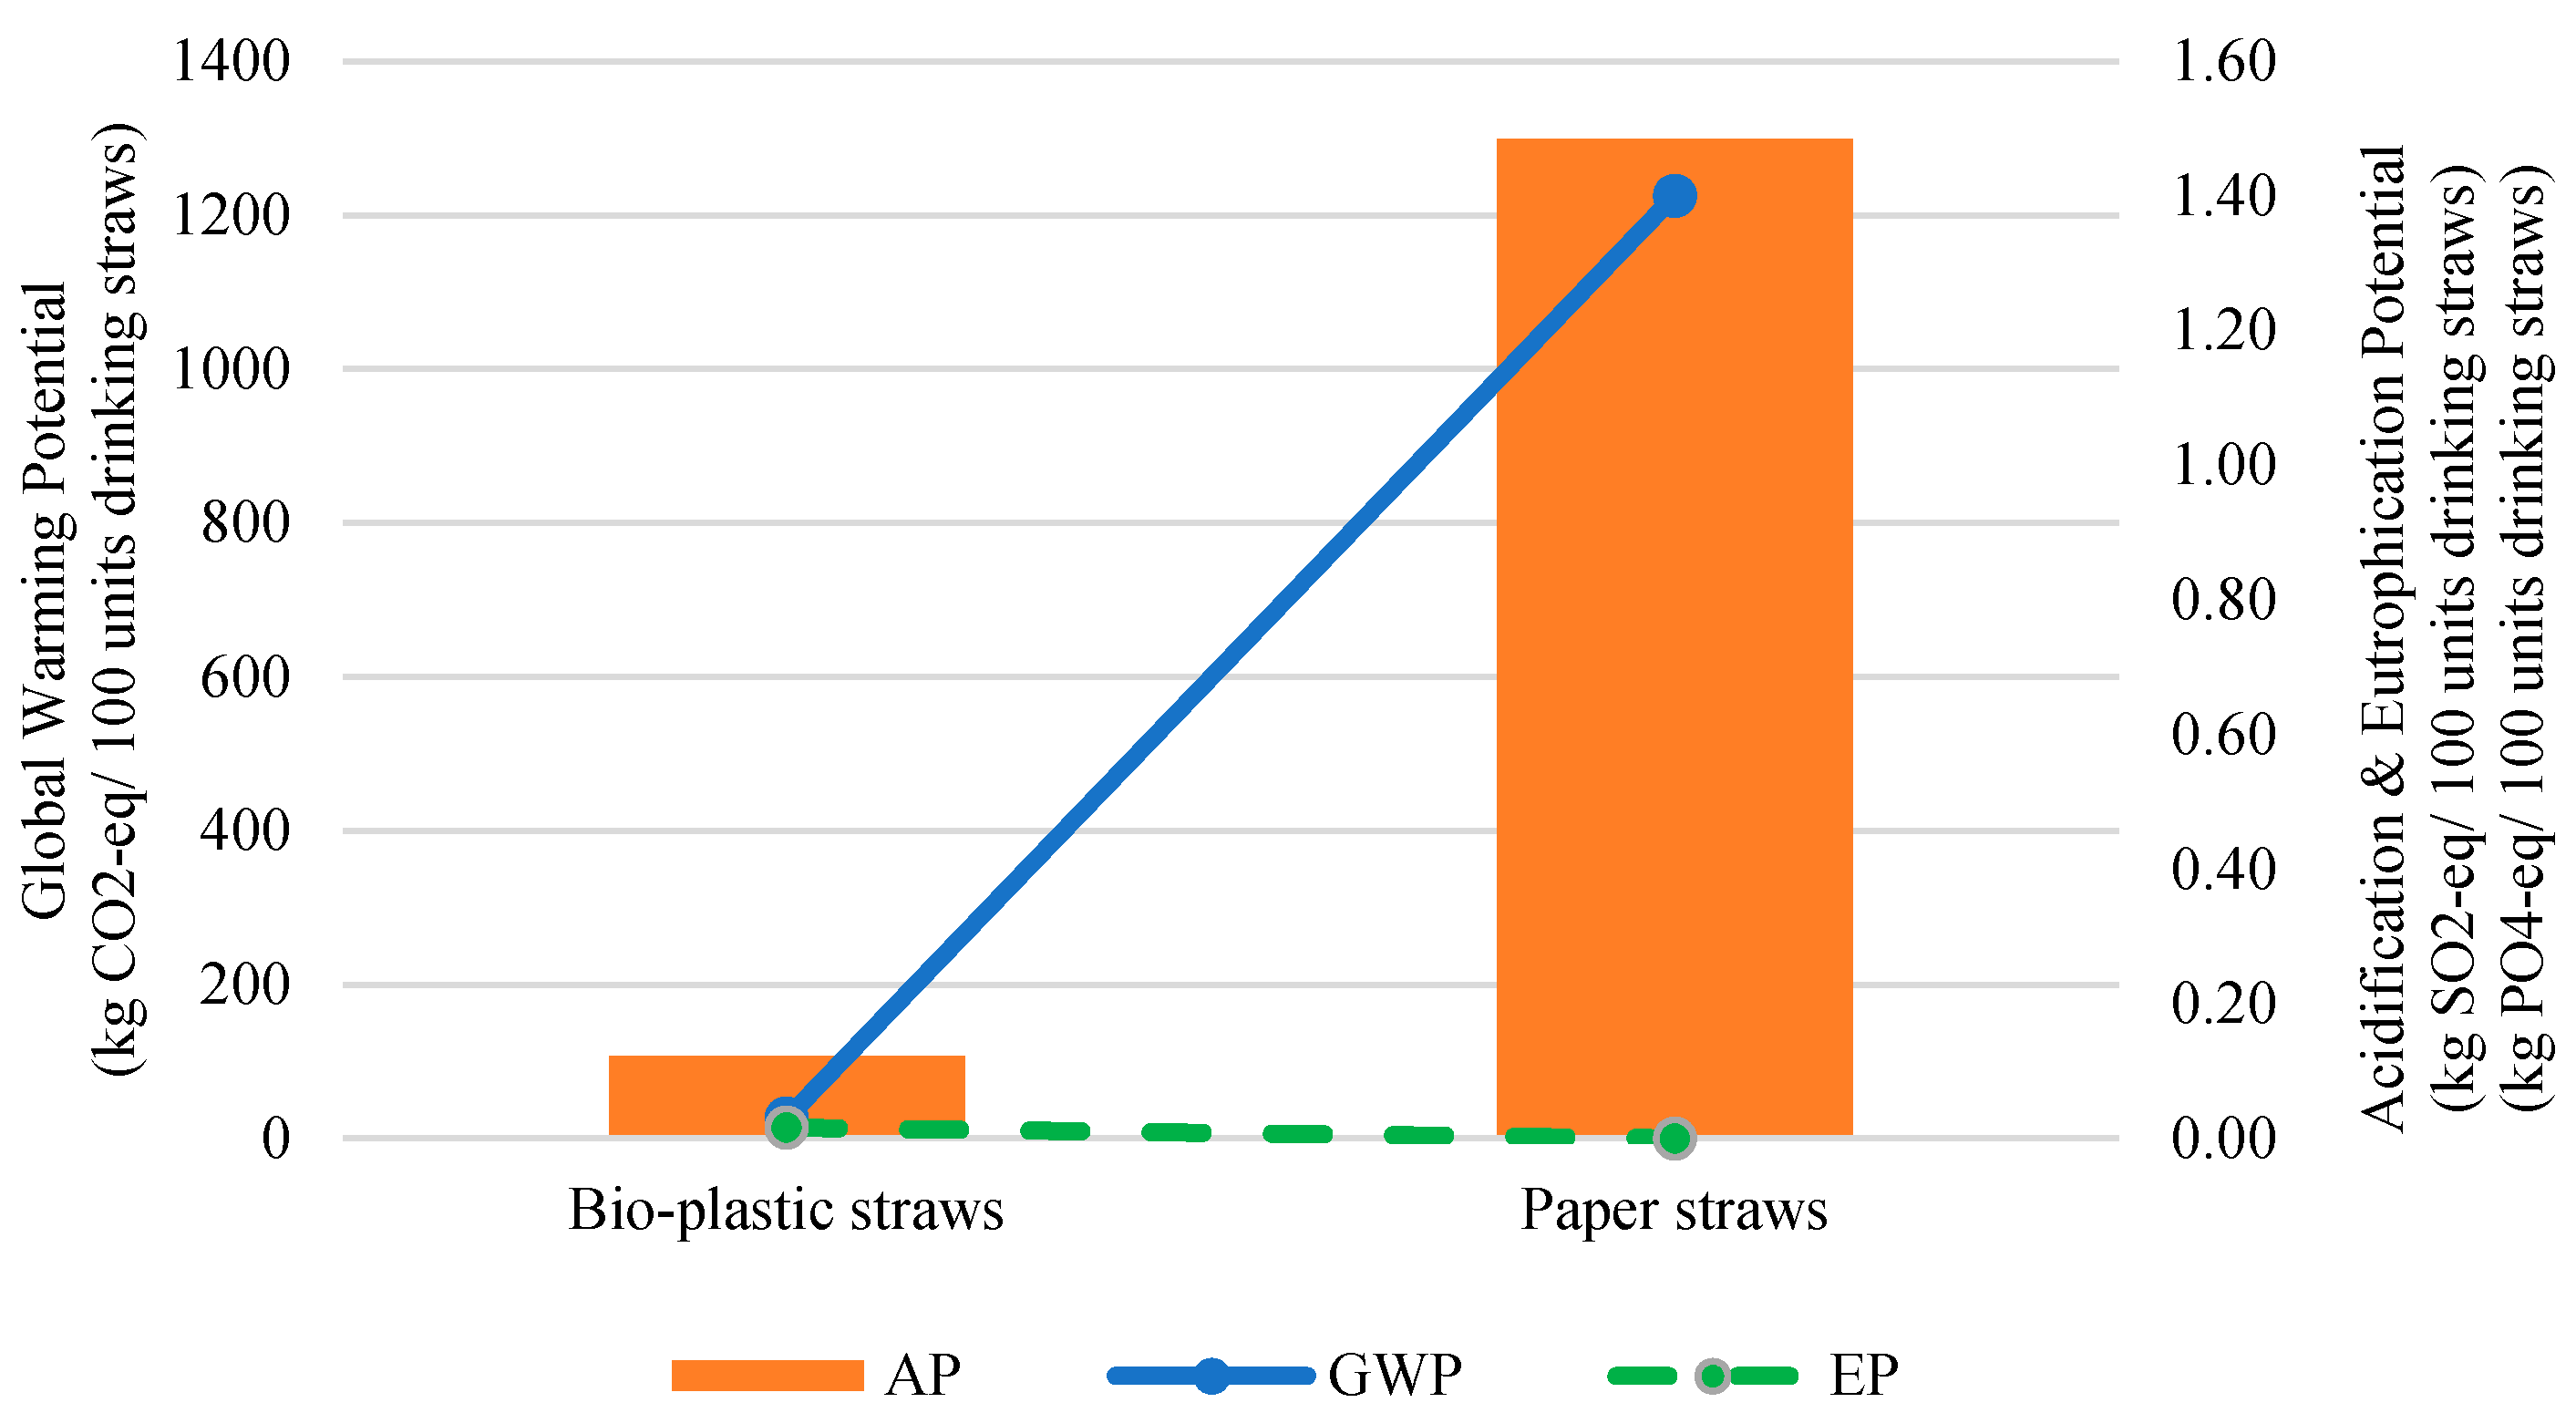
3.3. Overall Comparison of Bio-Plastic Straws and Paper Straws

Six sections of the life cycle of bio-plastic and paper straws were studied regarding the GWP, AP and EP. The first three sections were the extraction and production of raw materials, which were the PLA for bio-plastic straws and paper for paper straws. Therefore, Sections 1–3 were grouped as one for comparison, as shown in Figure 5. Based on Figure 5a,b, paper straws contributed to a higher GWP and AP compared to bio-plastic straws concerning the extraction and production of raw materials. Section 1 for the preparation of corn starch for bio-plastic straws contributed to the higher GWP and AP compared to paper straws (Section 1: wood preparation). The production of starch from raw corn in Section 1 of bio-plastic straws generated a large portion of GWP and AP. This was due to the extraction process of starch, which involved corn steeping and germ, fiber, gluten and starch separation. On the contrary, the kraft pulping process in Section 2 of paper straws generated a large portion of GWP and AP due to higher energy generation that involved the combustion of biomasses. Moreover, the papermaking process for paper straws in Section 3 contributed to a higher GWP and AP than the polymerization of lactic acid for bio-plastic straws due to the higher electricity consumption. However, based on Figure 5c, bio-plastic straws contributed to a higher EP than paper straws, which could be ascribed to the release of NH3 during germ, gluten, and starch separation in Section 1.
As for Section 4 where the production of drinking straws takes place, based on the results shown in Figure 6, bio-plastic straws contributed to higher GWP, AP and EP compared to that of paper straws. This could be explained by the energy-intensive production of bio-plastic straws compared to paper straws which involved the process of extrusion and injection moulding. In contrast, paper straw production does not require high electricity consumption. In Section 5 of the system boundary, delivery to the consumer and the disposal of drinking straws and paper straws contributed to the higher amount of GWP as compared to bio-plastic straws. This was due to the high emission of methane and carbon dioxide as a result of anaerobic decomposition in the landfill for paper straws. However, both paper and bio-plastic straws contributed to the same amount of AP due to similar electricity consumption for composting, landfill and incineration. For Section 6 of the system boundary (transportation), bio-plastic straws contributed to a higher GWP as compared to paper straws. This was due to longer distance travelled in the transport of bio-plastic straws than paper straws, which was affected by the different locations of the plants in the supply chain of the respective drinking straws. There was no AP and EP for either bio-plastic or paper straws due to zero AP pollutants for the transportation section.
The AP findings of the present study are consistent with those reported by Chaffee and Yaros (2007) where an LCA study was conducted to evaluate the environmental impact of grocery bags. However, the authors stated that the GWP of paper grocery bags was lower than that of bio-plastic grocery bags. This was due to the different system boundary as their study involved the extraction of fuels and feedstocks from the earth which included the tree growing process. Therefore, the CO2 emissions, which are one of the main GWP contributors, were greatly reduced, as most of the CO2 was absorbed during the photosynthesis process that takes place during the development of trees. Moreover, the raw material of paper bags consisted of a mixture of paper and recycled paper instead of pure paper that was used for paper straw processing, which also reduced the overall GWP. In contrast, the raw material of bio-plastic does not only consist of PLA but also other compostable plastics [34]. Therefore, the GWP trend for grocery bags is different from that of drinking straws; however, the AP pattern is similar.
Overall, as shown in Figure 7, paper straws have a higher GWP and AP compared to bio-plastic straws. However, bio-plastic straws have a slightly higher EP than paper straws, but, generally, the EP for both types of straw is very small and insignificant compared to the GWP and AP. The GWP and AP were mainly impacted by the extraction and production of raw materials for the production of drinking straws. This included corn starch production and wood preparation for Section 1, lactic acid production and kraft pulping process for Section 2, and polylactic acid production and papermaking process for Section 3. Overall, based on the simulated case study, bio-plastic straws are found to be a better option compared to paper straws for a milder impact on the environment concerning the GWP and AP.

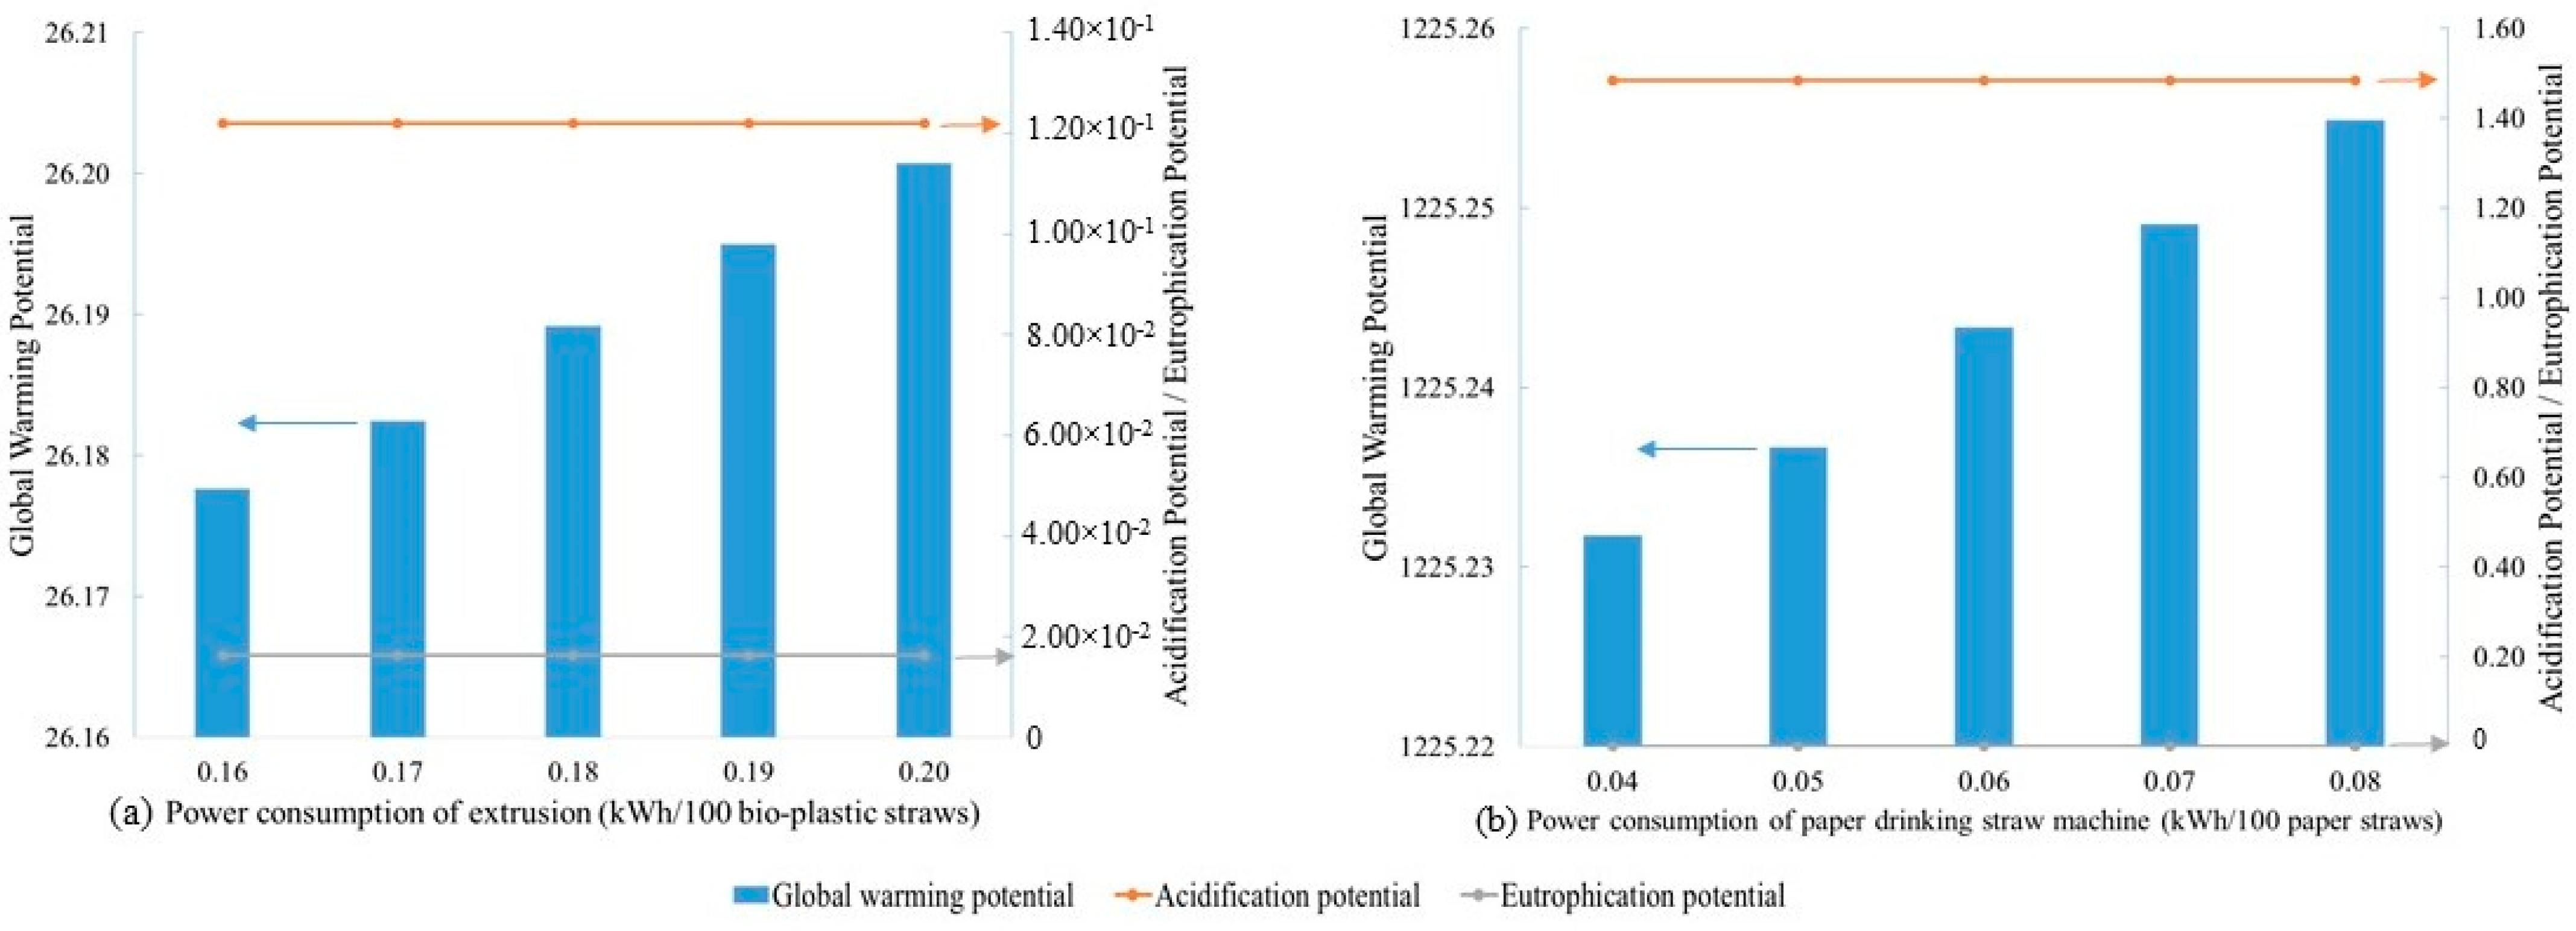
3.4. Sensitivity Analysis

Sensitivity analysis was performed to demonstrate the effects of changing process variables, i.e., power consumption, on the fluctuation of GWP, AP and EP values of bio-plastic straws and paper straws. The results would enable the analysis of uncertainty propagation in an LCA calculation. The results could also indicate how well the process coped with uncertainty under different conditions [35]. The sensitivity analysis was done by switching the simulation model to rating mode and tested for its robustness. The probabilities were calibrated for the LCA outcomes arising from uncertainty in the inventory and from data variation characteristics.
The power consumption for one of the unit operations, which was used for the extrusion process in bio-plastic straws production (Section 4), was varied using SuperPro Designer for sensitivity analysis. The effect of the power consumption variation towards the GWP, AP and EP values of bio-plastic straws is shown in Figure 8a. On the other hand, the power consumption for paper drinking straw machine in paper straws production (Section 4) was also varied using SuperPro Designer for similar sensitivity analysis. The result is shown in Figure 8b. The results shown in Figure 8 indicated that the LCA conducted in this study experienced a slight increase of its GWP, AP and EP values (at the range of 0.0004–0.500%) when the power consumption increased with an interval of 5–10%, respectively. Hence, the sensitivity analysis conducted in this study showed minimal fluctuations of GWP, AP, and EP values with the variation in the power consumption.

4. Conclusions

The GWP, AP, and EP of bio-plastic straws were successfully evaluated using the LCA with data obtained from process simulator. It was found that the corn starch production contributed to the highest GWP, AP and EP, which was ascribed to energy-intensive processes such as corn steeping and the separation of germ, fiber, gluten and starch. Moreover, the GWP, AP, and EP of paper straws were also successfully investigated using the LCA with data obtained from both the literature and the process simulator. The kraft pulping process contributed to the highest GWP, AP, and EP due to the energy generation unit, which involved biomass combustion. The GWP, AP, and EP for both bio-plastic and paper straws were compared for an indication of straws with less environmental impact. It was found that bio-plastic straws have a lower GWP of 26 kg CO2-eq per 100 units of drinking straws, an AP of 0.12 kg SO2-eq per 100 units of drinking straws and an EP of 0.016 kg PO4-eq per 100 units of drinking straws. Additionally, paper straws have a GWP of 1225 kg CO2-eq per 100 units of drinking straws, an AP of 1.5 kg SO2-eq per 100 units of drinking straws and an EP of 0.0002 kg PO4-eq per 100 units of drinking straws. Therefore, concerning the GWP and AP, bio-plastic straws are a better option than paper straws for a milder impact on the environment. Previous studies have shown that plastic straws posed a lower environmental impact compared to reusable straws, and bio-plastic straws showed a lower carbon footprint compared to conventional plastic straws. From this point of view, bio-plastic straws could be a feasible replacement for conventional plastic straws. The outcome of this study is able to serve as a benchmark in selecting alternative straws in efforts towards zero-plastic straws in Malaysia. However, the decision to switch to bio-plastic straws should not be rushed. Comprehensive information related to their biodegradability as well as the water and land footprints could be included for consideration to provide a more holistic sustainability assessment of drinking straws.

Supplementary Materials

The following are available online at https://www.mdpi.com/article/10.3390/pr9061007/s1, Table S1: Equipment details of corn starch production (Section 1) based on SuperPro Designer, Table S2: Equipment details of lactic acid production (Section 2) based on SuperPro Designer, Table S3: Equipment details of bio-plastic production (Section 3) based on SuperPro Designer, Table S4: Equipment details of bio-plastic straws production (Section 4) based on SuperPro Designer, Table S5: Equipment details of delivery to consumer and disposal of bio-plastic straws (Section 5) based on SuperPro Designer, Table S6: Equipment details of paper straws production (Section 4) based on SuperPro Designer, Table S7: Equipment details of delivery to consumer and disposal of paper straws (Section 5) based on SuperPro Designer, Table S8: Process data inventory of bio-plastic straws production obtained from SuperPro Designer simulator (based on 100 drinking straws unit functional), TableS9: Process data inventory of bio-plastic straws production obtained from SuperPro Designer simulator (based on 100 drinking straws unit functional) (continue), Table S10: Process data inventory of paper straws production obtained from SuperPro Designer simulator (based on 100 drinking straws unit functional), Figure S1: Overall process flow diagram of the corn starch production (Section 1), Figure S2: Process flow diagram of the lactic acid production (Section 2), Figure S3: Process flow diagram of the bio-plastic production (Section 3), Figure S4: Process flow diagram of the bio-plastic straws production (Section 4), Figure S5: Process flow diagram of the delivery consumer and disposal of bio-plastic straws (Section 5), Figure S6: Process flow of the production of paper straws (Section 2), Figure S7: Process flow diagram of the delivery to consumer and disposal of paper straws (Section 5), Figure S8: Transportation detail for the overall process for bio-plastic straws from gate to grave, Figure S9: Transportation detail for the overall process for bio-plastic straws from gate to grave.

Author Contributions

C.-H.M.: designed the LCA model and the simulation of the processes and analyzed and interpreted the data. He also wrote the manuscript with input from all authors. L.-S.T.: was involved in planning and supervised the work, reviewed the results and gave final approval of the version to be published. N.F.S.: provided a critical review of the manuscript. A.M.S.: was involved in impact assessment and interpretation. J.T.: contributed to the study design and conceptual framework, reviewed the results and gave final approval of the version to be published. All authors have read and agreed to the published version of the manuscript.

Funding

This research was funded by Universiti Teknologi PETRONAS via the Joint Research Project (JRP8) funding and Universiti Teknologi Malaysia via Matching Grant (PY/2021/00347).

Institutional Review Board Statement

Not applicable.

Informed Consent Statement

Not applicable.

Data Availability Statement

The data presented in this study are available in the article and Supplementary Materials.

Acknowledgments

Inputs and suggestions from Yeap Swee Pin from UCSI University are gratefully appreciated.

Conflicts of Interest

The authors declare no conflict of interest.

References

  1. Pavani, P.; Rajeswari, T.R. Impact of Heavy Metals on Environmental Pollution. J. Chem. Pharm. Sci. 2014, 94, 87–93. [Google Scholar]
  2. Tibbetts, J. Managing Marine Plastic Pollution. Environ. Health Perspect. 2015, 123, A90–A93. [Google Scholar] [CrossRef] [Green Version]
  3. Malaysian Plastics Manufacturers Association. An Advanced Plastics Recycling Industry for Malaysia; Malaysian Plastics Manufacturers Association: Petalin Jaya, Malaysia, 2019; pp. 1–31. [Google Scholar]
  4. Darbre, P.D. Overview of air pollution and endocrine disorders. Int. J. Gen. Med. 2018, 11, 191–207. [Google Scholar] [CrossRef] [PubMed] [Green Version]
  5. Wilcox, C.; van Sebille, E.; Hardesty, B.D.; Estes, J.A. Threat of plastic pollution to seabirds is global, pervasive, and increasing. Proc. Natl. Acad. Sci. USA 2015, 112, 11899–11904. [Google Scholar] [CrossRef] [PubMed] [Green Version]
  6. Butterworth, A.; Clegg, I.; Bass, C. Untangled. Marine Debris: A Global Picture of the Impact on Animal Welfare and of Animal-Focused Solutions; World Society for the Protection of Animals: London, UK, 2012; pp. 1–78. [Google Scholar]
  7. Prendiz, J.; Mena, M.; Vega-Baudrit, J.R. Polylactic Acid (PLA) As A Bioplastic And Its Possible Applications in the Food Industry. Food Sci. Nutr. 2019, 5, 048. [Google Scholar]
  8. Boonniteewanich, J.; Pitivut, S.; Tongjoy, S.; Lapnonkawow, S.; Suttiruengwong, S. Evaluation of carbon footprint of bioplastic straw compared to petroleum based straw products. Energy Procedia 2014, 56, 518–524. [Google Scholar] [CrossRef] [Green Version]
  9. Gironi, F.; Piemonte, V. Bioplastics and petroleum-based plastics: Strengths and weaknesses. Energy Sources A Recover. Util. Environ. Eff. 2011, 33, 1949–1959. [Google Scholar] [CrossRef]
  10. Guinée, J.B. Handbook on Life Cycle Assessment; Kluwer Academic Publishers: Dordrecht, The Netherlands, 2002; Volume 7. [Google Scholar]
  11. Heijungs, R.; Sangwon, S. The Computational Structure of Life Cycle Assessment; Kluwer Academic Publishers: Dordrecht, The Netherlands, 2002; Volume 11. [Google Scholar]
  12. Wu, W. Carbon Footprint A Case Study on the Municipality of Haninge. Master’s Thesis, School of Technology and Health (STH), Stockholm, Sweden, 2011. [Google Scholar]
  13. Kunhikrishnan, A.; Thangarajan, R.; Bolan, N.; Xu, Y.; Mandal, S.; Gleeson, D.; Seshadri, B.; Zaman, M.; Barton, L.; Tang, C.; et al. Functional Relationships of Soil Acidification, Liming, and Greenhouse Gas Flux. Adv. Agron. 2016, 139, 1–71. [Google Scholar]
  14. Hunter, K.A.; Liss, P.S.; Surapipith, L.V.; Dentener, F.; Duce, R.; Kanakidou, M.; Kubilay, N.; Mahowald, N.; Okin, G.; Sarin, M.; et al. Impacts of anthropogenic SOx, NOx and NH3 on acidification of coastal waters and shipping lanes. Geophys. Res. Lett. 2011, 38, 2–7. [Google Scholar] [CrossRef]
  15. Behera, D.P.; Kolandhasamy, P.; Sigamani, S.; Devi, L.P.; Ibrahim, Y.S. A preliminary investigation of marine litter pollution along Mandvi beach, Kachchh, Gujarat. Mar. Pollut. Bull. 2021, 165, 112100. [Google Scholar] [CrossRef]
  16. Statista. 2020. Available online: https://www-statista-com.iclibezp1.cc.ic.ac.uk/statistics/726724/weight-of-most-common-items-found-in-global-oceans/ (accessed on 25 May 2021).
  17. The Star. Spare that Straw, Please. Available online: https://www.thestar.com.my/news/nation/2017/08/20/spare-that-straw-please-a-seemingly-harmless-tool-that-helps-you-enjoy-your-cold-drinks-is-sapping-t/ (accessed on 17 May 2021).
  18. The Sun Daily. The Ban on Single-Use Plastic Straws. Available online: https://www.thesundaily.my/local/the-ban-on-single-use-plastic-straws-DL1836630 (accessed on 17 May 2021).
  19. Wong, H.-Y.; Goh, Y.-N.; Kiumarsi, S. Single-Use Straw Ban: Malaysians Behavioural Intentions Towards Reusable Straws; Contemporary Issues in Business and Management, Graduate School of Business, Universiti Sains Malaysia: Penang, Malaysia, 2019. [Google Scholar]
  20. Chitaka, T.Y.; Russo, V.; von Blottnitz, H. In pursuit of environmentally friendly straws: A comparative life cycle assessment of five straw material options in South Africa. Int. J. Life Cycle Assess. 2020, 25, 1818–1832. [Google Scholar] [CrossRef]
  21. Rana, K. Plasticless: A Comparative Life-Cycle, Socio-Economic, and Policy Analysis of Alternatives to Plastic Straws. Master’s Thesis, Michigan Technological University, Houghton, MI, USA, 2020. [Google Scholar]
  22. Zanghelini, G.M.; Cherubini, E.; Dias, R.; Kabe, Y.H.O.; Delgado, J.J.S. Comparative life cycle assessment of drinking straws in Brazil. J. Clean. Prod. 2020, 276, 123070. [Google Scholar] [CrossRef]
  23. Chang, L.; Tan, J. An Integrated Sustainability Assessment of Drinking Straws. J. Environ. Chem. Eng. 2021, 9, 105527. [Google Scholar] [CrossRef]
  24. Ramírez, E.C.; Johnston, D.B.; McAloon, A.J.; Singh, V. Enzymatic corn wet milling: Engineering process and cost model. Biotechnol. Biofuels 2009, 2, 1–9. [Google Scholar] [CrossRef] [PubMed] [Green Version]
  25. Mofokeng, J.P.; Luyt, A.S.; Tábi, T.; Kovács, J. Comparison of injection moulded, natural fibre-reinforced composites with PP and PLA as matrices. J. Thermoplast. Compos. Mater. 2012, 25, 927–948. [Google Scholar] [CrossRef]
  26. Jawjit, W.; Kroeze, C.; Soontaranun, W.; Hordijk, L. An analysis of the environmental pressure exerted by the eucalyptus-based kraft pulp industry in Thailand. Environ. Dev. Sustain. 2006, 8, 289–311. [Google Scholar] [CrossRef] [Green Version]
  27. Horan, E.; Norrish, M. Waste management options to control greenhouse gas emissions—Landfill, compost or incineration ? In Paper for the International Solid Waste Association (ISWA) Conference; ISWA: Vienna, Austria, 2009. [Google Scholar]
  28. Branchini, L.; Cagnoli, P.; de Pascale, A.; Lussu, F.; Orlandini, V.; Valentini, E. Environmental assessment of renewable fuel energy systems with cross-media effects approach. Energy Procedia 2015, 81, 655–664. [Google Scholar] [CrossRef] [Green Version]
  29. Morawicki, R.O.; Hager, T. Energy and Greenhouse Gases Footprint of Food Processing. Encycl. Agric. Food Syst. 2014, 3, 82–99. [Google Scholar]
  30. Poh, G.K.X.; Chew, I.M.L.; Tan, J. Life Cycle Optimization for Synthetic Rubber Glove Manufacturing. Chem. Eng. Technol. 2019, 42, 1771–1779. [Google Scholar] [CrossRef]
  31. Kuan, C.K.; Foo, D.C.Y.; Tan, R.R.; Kumaresan, S.; Aziz, R.A. Streamlined life cycle assessment of residue utilization options in Tongkat Ali (Eurycoma longifolia) water extract manufacturing process. Clean Technol. Environ. Policy 2007, 9, 225–234. [Google Scholar] [CrossRef]
  32. Perumal, A.; Timmons, D. Contextual Density and US Automotive Carbon Dioxide Emissions across the Rural–Urban Continuum. Int. Reg. Sci. Rev. 2017, 40, 590–615. [Google Scholar] [CrossRef]
  33. U.S. Department of Environment. Energy and Environmental Profile of the U.S. Pulp and Paper Industry; U.S. Department of Environment: Washington, DC, USA, 2005.
  34. Chaffee, C.; Yaros, B.R. Life Cycle Assessment for Three Types of Grocery Bags -Recyclable Plastic; Compostable, Biodegradable Plastic; and Recycled, Recyclable Paper. 2007. Available online: https://plastics.americanchemistry.com/Life-Cycle-Assessment-for-Three-Types-of-Grocery-Bags.pdf (accessed on 2 June 2021).
  35. Ciroth, A.; Fleischer, G.; Steinbach, J. Uncertainty calculation in life cycle assessments: A combined model of simulation and approximation. Int. J. Life Cycle Assess. 2004, 9, 216–226. [Google Scholar] [CrossRef]
Figure 1. Overall system boundary of bio-plastic straws from gate to grave.
Processes 09 01007 g001
Figure 2. Overall system boundary of paper straws from gate to grave.
Processes 09 01007 g002
Figure 3. (a) GWP, (b) AP, and (c) EP of 100 units of bio-plastic straws.
Processes 09 01007 g003
Figure 4. (a) GWP, (b) AP, and (c) EP of 100 units of paper straws.
Processes 09 01007 g004
Figure 5. (a) GWP, (b) AP, and (c) EP of bio-plastic straws and paper straws for extraction and production of raw materials.
Processes 09 01007 g005
Figure 6. (a) GWP, (b) AP, and (c) EP of bio-plastic straws and paper straws for drinking straw production, delivery to the consumer and production and transportation sections.
Processes 09 01007 g006
Figure 7. Overall grand total of GWP, AP, and EP for bio-plastic straws and paper straws.
Processes 09 01007 g007
Figure 8. Overall GWP, AP, and EP values of (a) bio-plastic straws and (b) paper straws versus power consumption.
Processes 09 01007 g008
Table 1. Potential index definitions of the considered environmental effects and respective units of measurement [10,28].
IndexFormulaUnit of Measure
Global Warming PotentialGWP = ∑ GWPi × mikg CO2 equivalent (kg CO2-eq)
Acidification PotentialAP = ∑ APi × mikg SO2 equivalent (kg SO2-eq)
Eutrophication PotentialEP = ∑ EPi × mikg PO4 equivalent (kg PO4-eq)
Table 2. List of specific weighting factors for the pollutants [10,28,29].
Item of MeasurementGWPiAPiEPi
kg CO2-eq/kgkg SO2-eq/kgkg PO4-eq/kg
CO200
NOx00.70.13
SOx010
VOC300
NH301.880.35
CO2100
CH42300
N2O31000
Table 3. Example illustration of calculation for environmental impact category versus pollutants mass.
PollutantsGWPiCorn Starch Production (Section 1)
Corn
Steeping
Germ
Separation
Fiber
Separation
Gluten
Separation
Starch
Separation
CO (g)22.6 × 10−11.57.7 × 10−16.0 × 10−18.0 × 10−1
VOC (g)33.0 × 10−21.7 × 10−18.9 × 10−26.9 × 10−29.2 × 10⁻²
CO2 (g)11.1 × 1036.3 × 1033.4 × 1032.6 × 1033.5 × 103
Total GWP1.16.33.42.63.5
Overall GWP16.9 kg CO2-eq/100 straws
Table 4. Transportation distance for bio-plastic straws.
Starting PointDestinationDistance (km)
Raw CornCorn Starch187
Corn StarchBio-Plastic Straws202
Bio-Plastic StrawsConsumer50
ConsumerIncineration Plant562
Composting Facility315
Landfill27
Total distance (km)1343
Table 5. Transportation distance for paper straws.
Starting PointDestinationDistance (km)
Wood SupplierPaper Mill59
Paper MillPaper Straw119
Paper StrawConsumer50
ConsumerIncineration Plant252
Composting Facility31
Landfill33
Total distance (km)544
Table 6. Product transport emission factors [32].
Vehicle TypeMedium- and Heavy-Duty Truck
CO2 Factor (kg/km)0.904716
CH4 Factor (g/km)0.011185
N2O Factor (g/km)0.006835
Publisher’s Note: MDPI stays neutral with regard to jurisdictional claims in published maps and institutional affiliations.

