Article

Optimization of Texture-Modified Yellowfin Sole (Pleuronectes aspera) by Enzymatic Treatment and Superheated Steam Treating to Improve Quality Characteristics

1
Seafood Research Center, Industry-Academic Cooperation Foundation, Silla University, Busan 46958, Korea
2
EBADA Fishery Co. Ltd., #B202, Advanced Seafood Processing Complex, Wonyang-ro, Amnam-dong, Seo-gu, Busan 49277, Korea
3
Department of Food Biotechnology, College of Medical and Life Sciences, Silla University, Busan 46958, Korea
*
Author to whom correspondence should be addressed.
Processes 2021, 9(5), 763; https://doi.org/10.3390/pr9050763
Submission received: 23 March 2021 / Revised: 26 April 2021 / Accepted: 26 April 2021 / Published: 27 April 2021
(This article belongs to the Special Issue Application of Proteomics and Enzyme Technologies in Foods)

Abstract

:
This study aimed to optimize the texture modification process of yellowfin sole (Pleuronectes aspera) to improve its quality characteristics for easier consumption by the elderly. Yellowfin sole was immersed in enzyme solution (Protamex:Neutrase = 1:2), marinated in herbal extract solution, and roasted by superheated steam. The product was evaluated for microbial, physicochemical, and sensory properties, as well as shelf life. Specifically, the optimal enzymatic treatment comprised a protease concentration of 1.00% (w/v) with an immersion time of 3.16 h. The optimal marination herb was determined to be bay leaves, as indicated by highest overall acceptance. The texture modification process led to lower hardness and higher overall acceptance values (76.23 kN/m2 and 8.38, respectively) compared with nonenzyme processed product (120.43 kN/m2, 7.43), also retaining high nutritional value and low trimethylamine levels. Shelf-life analysis indicated microbial activity was inhibited (not detected), low levels of total volatile basic nitrogen (10.50 mg%), low levels of thiobarbituric acid reactive substances (0.12 mg MDA/kg), and stable pH values (6.5–7.0). Overall, the texture-modified yellowfin sole possessed a soft flesh texture suitable for consumption by the elderly, with acceptable microbial, physicochemical, and sensory qualities.

1. Introduction

Globally, the United Nations estimated the average life expectancy to be 72.6 years in 2019 [1]. Particularly, 30 countries ranked high in life expectancy, with an average life expectancy over 80 years (World Health Organization, 2019) [2]. Furthermore, individuals aged 65 years or older accounted for 6% of the population in 1990, which became 9% of the population in 2019, according to the World Population Ageing Report (United Nations, 2020) [1]. Consequently, issues associated with aging have gained increasing importance, such as dysphagia in elderly individuals whose teeth and gums have weakened. Thus, the development of texture-modified foods and solutions for dealing with this problem have emerged as an important food processing issue worldwide. In Korea and Japan, countries facing a dramatically aging society, recommendations regarding texture-modified foods for the elderly have been regulated and are employed in the industry and market. The International Dysphagia Diet Standardization Initiative (2017) suggested texture-modified food levels (4–7) based on their chewability for dysphagic patients [3]. Moreover, Maksimenko et al. (2020) [4] reported that the market for products targeting “easy swallowing and mastication” is projected to approach USD 252 million by 2025.
Current developments in meat-based texture-modified foods have focused on livestock materials, such as beef and pork, rather than fish material. Sungsinchai et al. (2019) [5] reported that livestock-based food development accounted for approximately 58% of texture modification research, whereas fish-based research represented only 35%. The most common processing method applied in texture modification was high pressure processing, which requires investment in high-cost machinery and facilities. However, they noted that various nonthermal technologies, such as enzyme pretreatment, have also been proven to help decrease the hardness of meat.
Fish is a resource with faster natural reproduction compared to livestock, and has therefore been used as a major food ingredient for centuries. Among fish species of economic value, 127,332 tons of yellowfin sole (Pleuronectes aspera) was reportedly caught worldwide in 2018, accounting for approximately 13% of the global total flatfish (flounder, halibut, and sole) production (Food and Agriculture Organization of the United Nations Fish Stat, 2021) [6]. In Korea, flatfish and mackerel are well-commercialized, and yellowfin sole accounts for approximately 28% of the total imported left-eye-flatfishes (Korea Maritime Institute, 2021) [7]. Yellowfin sole is commonly cooked by roasting, and a minority of recently marketed yellowfin sole products have been processed as ready-to-eat foods.
Hence, this study focused on optimizing the texture modification process via nonthermal enzymatic treatment, based on popular fish resources (yellowfin sole). Furthermore, additional processing methods, such as marination and superheated steam treating, were applied to improve the quality characteristics of the product to enable merchandizing as a ready-to-eat food suitable for the elderly. In this study, commercially available proteolytic enzymes Neutrase and Protamex were used for pretreatment, which are known to be suitable for hydrolysis of fish proteins (Guerard et al., 2001; Liaset et al., 2002) [8,9]. These commercial enzymes reportedly imparted less bitterness than other enzymes, such as Alcalase and Bromelain, in animal protein hydrolysis studies (Fu et al., 2018) [10]. The study also analyzed the quality characteristics of the product and performed a shelf-life prediction. International recommendations for certain parameters and objectively integrated information, such as national research results, were taken into consideration.

2. Materials and Methods

2.1. Preparation of Sample

Yellowfin sole were obtained from EBADA Fishery Co., Ltd. (Busan, Korea). Similar-sized fish were selected based on length (17.1 ± 2 cm), height (12.6 ± 1 cm), and weight (117.1 ± 17 g defrosted weight). Commercial food-grade proteases, Protamex (optimal temperature and pH: 40 °C, 6.0–7.0) and Neutrase 0.8 L (optimal temperature and pH: 45–55 °C, 6.0), were purchased from Novozymes (Bagsvaerd, Denmark).
Bay leaves, coriander powder, fennel whole, thyme whole, cumin seeds, basil whole, basil powder, and star anise were purchased from Solpyo Foods (Gyeonggido, Namyangjusi, Korea), and sea buckthorn fruit powder was obtained from Hub-in-Korea (Gyeonggido, Gimposi, Korea). Each herb type (3% w/v) was placed in a filter bag made of nonwoven fabric and immersed in hot water (100 °C) for 20 min. The herbal extract solutions were then cooled to room temperature (RT).

2.2. Preparation for Treatment

Yellowfin sole were immersed in enzyme solution at RT (pH 6.7–7.7; 20 ± 1 °C) containing Protamex and Neutrase mixed in 1:2 ratio with tap water. After immersion, the fish were rinsed with cold tap water more than three times. The optimum enzyme concentration and immersion time were determined using response surface methodology (RSM).
Yellowfin sole prepared by the optimum enzymatic treatment were marinated in the different herbal extract solutions for 20 min in cold conditions prior to treating by superheated steam, followed by sensory evaluation.
A steam roaster using superheated steam (DFC-560A-2R/L, Naomoto Corporation, Osaka, Japan) was used for the final processing stage of the texture-modified yellowfin sole. Heating was performed at 350 °C for 4 min. The processed fish were then cooled at RT and packaged in vacuum-sealed plastic bags. The products were pasteurized for 20 min in a 90 °C water bath.

2.3. Design of Experiments for Optimization of Enzymatic Treatment

Optimization of the texture modification process by enzymatic treatment was carried out using a central composite design (CCD) with RSM. As independent variables, the enzyme solution concentration (X1) and immersion time (X2) were coded as −1.414, −1, 0, 1, and 1.414, as shown in Table 1. This condition was set by considering the preliminary experiment regarding enzyme mixture ratio (Table A1). The samples were treated with different code combinations, followed by roasting without a marinating step to assess the bitter taste of the enzymes. Then, dependent variables hardness (Y1) and overall acceptance (Y2) were measured using a texture analyzer and sensory evaluation, respectively. The response was expressed as a function of the independent variables using a quadratic polynomial Equation (1):
Y = β 0 + i = 1 k β i X i + i = 1 k β ii X i 2 + i = 1 k 1 j = 2 k β ij X i X j
where Y is the response (hardness, overall acceptance), and β0, βi, βii, and βij represent the regression coefficients for intercept, linear, quadratic, and interaction terms, respectively. The obtained responses were evaluated statistically by analysis of variance (ANOVA) with a significance level of p < 0.05, using MINITAB 18 (Minitab Inc., State College, PA, USA). Eventually, the model equation produced the optimum conditions for the response-optimizing type (maximizing, targeting), and the calculated conditions were validated by comparing predicted and experimental responses.

2.4. Sensory Evaluation

Twenty-one well-trained panelists from the Industry–Academic Cooperation Foundation at Silla University (Busan, Korea) performed sensory evaluation on the fish samples, including color, odor, taste, texture, and overall acceptance. Panelists evaluated samples using a 9-point scale, with 9 rated as best quality and 1 rated as worst quality.

2.5. Texture Analysis

Hardness was measured using a texture analyzer (Brookfield Engineering, Middleborough, MA, USA), expressed as the peak stress level (kN/m2). The probe (12.7 mm diameter, 35 mm length) compressed the sample vertically up to 50% of the sample height at a speed of 1.0 mm/s. The test was performed in triplicate at RT.

2.6. Microbial Analysis

Total bacterial counts (TBC) and total coliform groups (TCG) were analyzed according to AOAC protocols 990.12 (2002) [11] and 991.14 (2002) [12], respectively. Dilutions of homogenized samples were dispensed onto dry rehydratable film media (Aerobic Count Plates or E. coli/Coliform Count Plates; 3M, Saint Paul, MN, USA) and incubated at 37 ± 1 °C. Colonies exhibiting red color or gas were counted as TBC- or TCG-positive, respectively.

2.7. Thiobarbituric acid Reactive Substances

Measurement of thiobarbituric acid reactive substances (TBARS) was performed in accordance with the method described by Yildiz (2015) [13] with slight modifications (Mohibbullah et al., 2018) [14]. Samples were mixed with 20% trichloroacetic acid (TCA) in 2 M phosphoric acid solution, homogenized, and centrifuged. The pellet was mixed with 0.005 M TBA solution and incubated at 95 °C for 30 min. After cooling to RT, the absorbance of the sample was measured at 530 nm using a SPECTROstar Nano microplate reader (BMG Labtech, Ortenberg, Germany).

2.8. Total Volatile Basic Nitrogen

The Conway microdiffusion method was employed to measure total volatile basic nitrogen (TVBN) levels, complying with the regulations of the Ministry of Food and Drug Safety (MFDS, Korea, 2020) [15]. Samples were incubated at 37 °C in the Conway chamber, and TVBN was measured by adding Brunswick reagent followed by titration with 0.01 N NaOH.

2.9. Hydrogen Ion Concentration (pH)

Measurement of pH was performed using an OHAUS Starter 3100 pH meter with a glass electrode (Ohaus, Seoul, Korea), following the method described by the Ministry of Food and Drug Safety (MFDS, Korea, 2020) [15]. Samples were mixed with distilled water, homogenized, and filtered; the filtrate was then used to measure the pH value.

2.10. Analysis of Nutritional Quality

Quantitative measurement of nutritional composition (moisture, ash, salinity, calories, sodium, carbohydrates, sugars, dietary fiber, crude fat, trans fat, saturated fat, cholesterol, crude protein, calcium, iron, potassium, and vitamin D) of the final product was performed in accordance with AOAC protocols 925.09, 923.03,979.09, 962.09, and 923.05 (2000) [16].

2.11. Fatty Acid Analysis

Fatty acids were analyzed according to the method described by Sutikno et al., (2019) [17] and AOAC protocol 963.22 (1995) [18]. Ether was used to extract fatty acids from the samples, which were methylated to fatty acid methyl esters (FAMEs). FAMEs were analyzed by gas chromatography (GC) (Shimadzu Corp., Kyoto, Japan) coupled with a flame ionization detector (FID) at 240 °C using a highly polar SP-2560 column (100 m × 0.25 mm × 0.25 μm; Supelco, Bellefonte, PA, USA). FAME composition was evaluated by comparing retention times with those of standard compounds.

2.12. Amino Acid Analysis

Amino acid analysis was performed using ninhydrin postcolumn reaction detection according to AOAC protocol 994.12 (2005) [19]. The sample (0.2 g) was mixed in a tube with 10 mL 6 N HCl, nitrogen gas was injected into the tube, and the sample was hydrolyzed at 110 °C for 24 h. After vacuum evaporation, the volume was adjusted to 50 mL with 0.2 M sodium citrate buffer. The sample was filtered through a 0.20 μm cellulose filter and then analyzed using an L-8900 Amino Acids Analyzer (Hitachi High-Tech Corp., Tokyo, Japan). Measurement of methionine and cysteine, which are sulfur-containing compounds, was carried out by performing acid oxidation.

2.13. Trimethylamine

Trimethylamine (TMA) content was analyzed by headspace solid-phase microextraction (SPME) with GC–MS, as described by Mohibbullah et al. (2018) [14]. The fiber (50/30 μm DVB/CAR/PDMS) was exposed to the headspace of the sample vial with stirring at 50 °C for 30 min to absorb the TMA. Subsequently, the TMA was desorbed from the fiber in the 240 °C injector inlet using an Agilent 7890B system (Waldbronn, Germany) with a DB-WAX UI column (30 m × 0.25 µm ID; 0.25 µm film thickness). The separated TMA was quantified using a Pegasus 4D-TOFMS mass spectrometer (LECO, St. Joseph, MI, USA) with an electron energy of 70 eV. Ion peaks at m/z = 58 were confirmed using the National Institute of Standards and Technology (NIST) library. The concentration of TMA was calculated using a calibration curve of TMA standards (Sigma-Aldrich, St. Louis, MO, USA).

2.14. Shelf-Life Analysis

Based on the Ministry of Food and Drug Safety guidelines (MFDS, Cheongju-si, Chungcheongbuk-do, Korea, 2020) [20], shelf-life analysis was performed every 30 days on packaged final product stored at −23 °C, −18 °C, and −13 °C for 150 days. The quality parameters tested included microbial (total bacteria count and total coliform groups), chemical (TVBN, TBARS, and pH), and sensory properties (appearance, odor, taste, texture, and overall acceptance). The predicted shelf life of the product was calculated using Shelf-life Prediction program that is available at MFDS webpage (https://www.foodsafetykorea.go.kr/main.do (accessed on 22 March 2021)) [21], which is subjected to Arrhenius equation modeling for food preservation greater than three months, as described by Jafari et al., (2019) [22].

2.15. Statistical Analysis

All analyses were performed at least in triplicate. The results are expressed as the mean value ± standard error (SE). One-way ANOVA and t-tests were employed using IBM SPSS Statistics version 23.0 (IBM Corp., Armonk, NY, USA). A p-value < 0.05 was considered statistically significant.

3. Results and Discussion

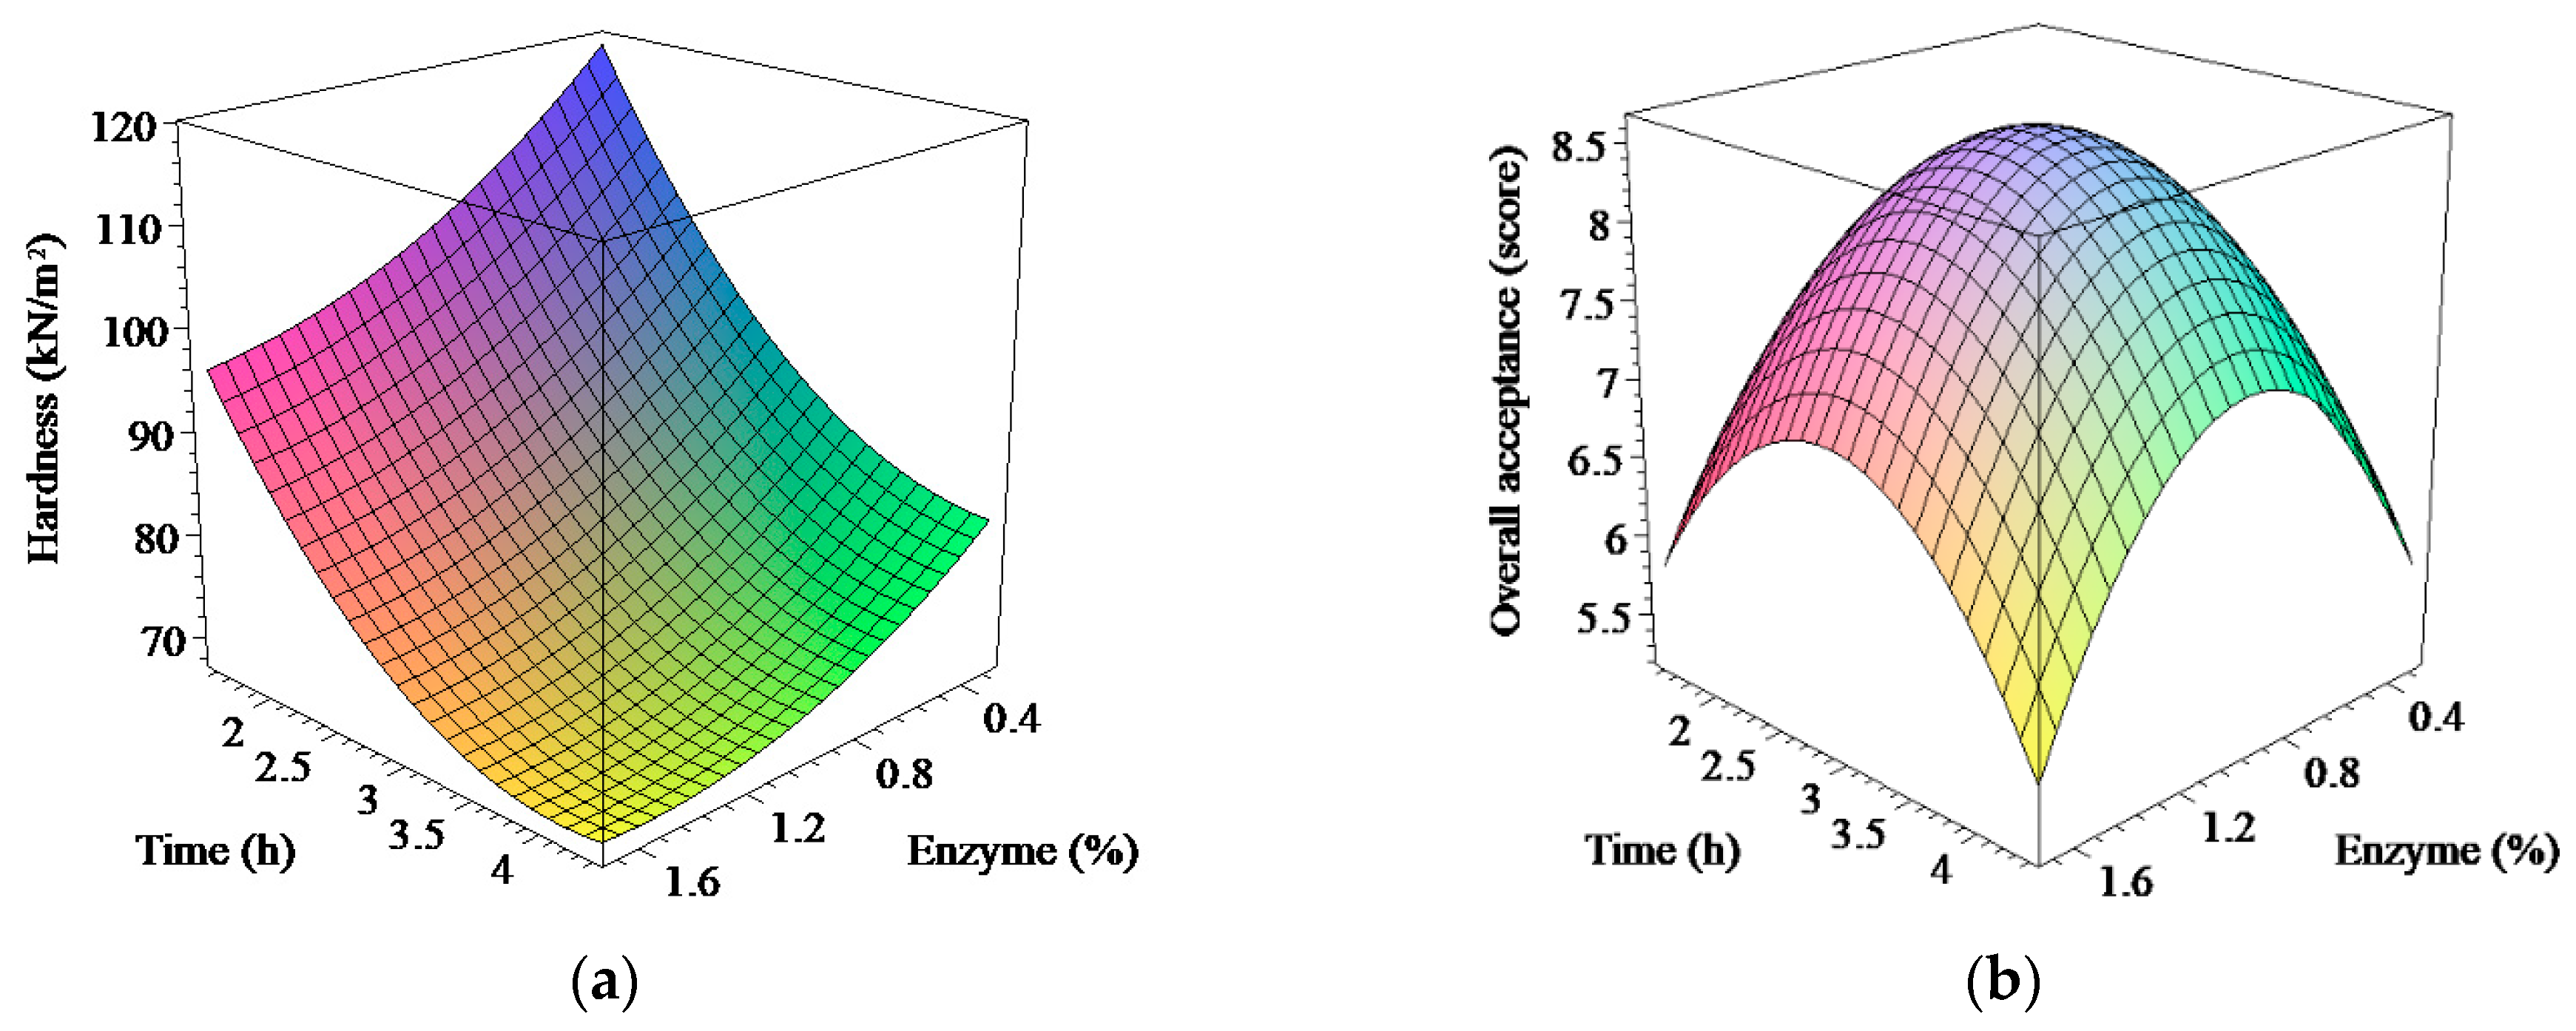
3.1. Optimization of Texture Modification Process by Enzymatic Treatment

The hardness (Y1) and overall acceptance (Y2) values of roasted yellowfin sole treated with different enzyme concentrations (X1) and immersion times (X2) are shown in Table 2, with their predicted response values obtained using the following regression equations:
Y1 = 78,845 − 6310X1 − 11,524X2 + 2084X12 + 4372X22 + 1079X1X2
Y2 = 8.62000 + 0.06269X1 + 0.06658X2 − 0.82187X12 − 0.66688X22 − 0.10750X1X2
where Y1, Y2, X1, and X2 are the hardness, overall acceptance, enzyme concentration, and immersion time, respectively. The model was statistically assessed to examine the factors that significantly affected hardness and overall acceptance. As shown in Table 3, the models demonstrated good R2 values and significance level (p < 0.05). According to Joglekar and May (1987) [23], an R2 value > 0.80 indicates a good model. Furthermore, the lack-of-fit value was nonsignificant (p > 0.05), indicating that the model was adequately fitted to predict the condition of the texture-modified yellowfin sole by enzymatic treatment.
According to the ANOVA results, the linear (X1, X2) coefficients had significant effects (p < 0.05) on hardness (Y1), whereas only quadratic coefficients (X12, X22) significantly affected overall acceptance (Y2). All interaction terms (X1X2) for hardness and overall acceptance were insignificant (p > 0.05).
Three-dimensional response surface plots for hardness and overall acceptance with regard to the independent variables are shown in Figure 1. The effects of enzyme concentration and immersion time on the response (hardness, overall acceptance) are shown in Figure 1a,b, respectively, when enzymatic treatment was employed for muscle softening of texture-modified yellowfin sole. Specifically, Figure 1a demonstrates that hardness decreased with an increase in factors (enzyme concentration and immersion time) in a linear manner (Table 3).
The minimum level of hardness was reached after immersion for almost 3 h, and the rate of decreasing hardness gradually declined. Enzymatic treatment cannot maintain a constant rate of reaction due to the increasing saturation rate of enzyme molecules to substrate (Ball et al., 2011) [24]. Contrary to hardness, Figure 1b demonstrates that overall acceptance increased with an increase in factors up to almost 1.0% (w/v) enzyme concentration and 3 h immersion time, which were the optimum conditions for overall acceptance (8.62), and then began to decrease beyond this level because of the bitter taste and excessively soft texture. Typically, enzymatic hydrolysis imparts bitterness and results in poor sensory properties in foods (Kilara 1985) [25]. The bitterness is caused by hydrophobic amino acids in the peptide chains. Normally, amino acids that have a bitter taste, such as valine, leucine, threonine, tryptophan, and tyrosine (Schiffman et al., 1975) [26] are cleaved by endo-proteinase enzymes such as Protamex and Neutrase. Hence, the quadratic model better fitted the overall acceptance response than the linear model, as presented in Table 3.
To ensure the model equation was suitable for predicting the optimum conditions, experimental values were tested to determine whether they were close to the predicted value with higher desirability, obtained using the response optimizer tool in MINITAB software. High desirability (up to 1.0) indicated that the calculated conditions fit the optimum conditions. Table 4 illustrates that the optimum coded condition (X1 = 1.00, X2 = 3.16), predicted value (Y1 = 77.14, Y2 = 8.61), experimental value (Y1 = 76.23 ± 3.02, Y2 = 8.38 ± 0.19), and desirability (Y1 = 0.99, Y2 = 0.82, Composite = 0.91) met the maximum overall acceptance (9) and target hardness level (77.15 kN/m2) of the texture-modified yellowfin sole on the multiple response prediction. The hardness level that corresponded with the condition that achieved the highest overall acceptance in Table 2 was set as the target hardness value.
The experimental and predicted responses were in agreement, thus confirming that the model equation derived from CCD could be used to determine the optimum enzymatic treatment conditions. The optimum conditions for texture-modified yellowfin sole by enzymatic hydrolysis were determined to be an enzyme concentration of 1.00% (w/v) and an immersion time of 3.16 h (3 h 10 min).
This study has consistently focused on investigating the responses that differs from enzyme concentration over time. Further research is needed to put enzyme ratio as an independent variable to the CCD.

3.2. Effect of Marination with Herbal Extract Solutions on Sensory Evaluation

The sensory evaluation results of the texture-modified yellowfin sole prepared by enzymatic treatment followed by marination with different herbal extract solutions are shown in Table 5. All sensory scores were >5, which is the threshold score indicating acceptability for commercial foods. Marination with bay leaves resulted in significantly higher odor, taste, and overall acceptance properties than marination with other herbs, including the control (p < 0.05). In terms of texture, marination with bay leaves resulted in the highest sensory score, but this result did not differ significantly from those achieved by marination with other herbs (p < 0.05). The largest quality parameter difference was in odor, with bay leaf marination achieving a mean score of 7.76, while marination with coriander powder achieved the next highest rating (6.90). In other words, marination with other herbs did not result in significant quality differences compared with the control group in odor (p < 0.05). Even with taste, marination with bay leaves achieved the highest score (7.43), followed by sea buckthorn fruit powder (7.14). In addition, the property that has the most effect on overall acceptance differs depending on the sample material. In the study by Pereira et al. (2020) [27], overall acceptance was regarded as a comprehensive index that simultaneously considers all properties (e.g., appearance, odor, taste, and texture). In the current study, marination with bay leaves resulted in the highest overall acceptance (7.90), although it only ranked third in appearance. These results suggested that bay leaves are the optimum marination ingredient for enzymatically treated yellowfin sole.

3.3. Analysis of Quality Characteristics of Final Product.

After determining the optimal processing conditions, we evaluated the quality characteristics (microbial, physicochemical, and overall acceptance) of the raw material, nonenzyme processed product, and final product (Table 6).

3.3.1. Total Bacteria Counts

No bacteria were detected in the final product nor in the nonenzyme processed product, while the raw material demonstrated 4.06 ± 0.32 log CFU/g. The heating using superheated steam during the final step exerted a strong sterilizing effect on both products, using enzymatic treatment or not. However, this result did not concur with that reported in studies by Mohibbullah et al., (2018) [14] and Tirtawijaya et al., (2020) [28], in which superheated steam-roasted products continued to show low TBC levels. This difference might be due to sample handling methods after cooking. In the current study, all product roasted by superheated steam was moved to a disinfected sample bowl as soon as possible and stored at low temperature throughout the experiment.

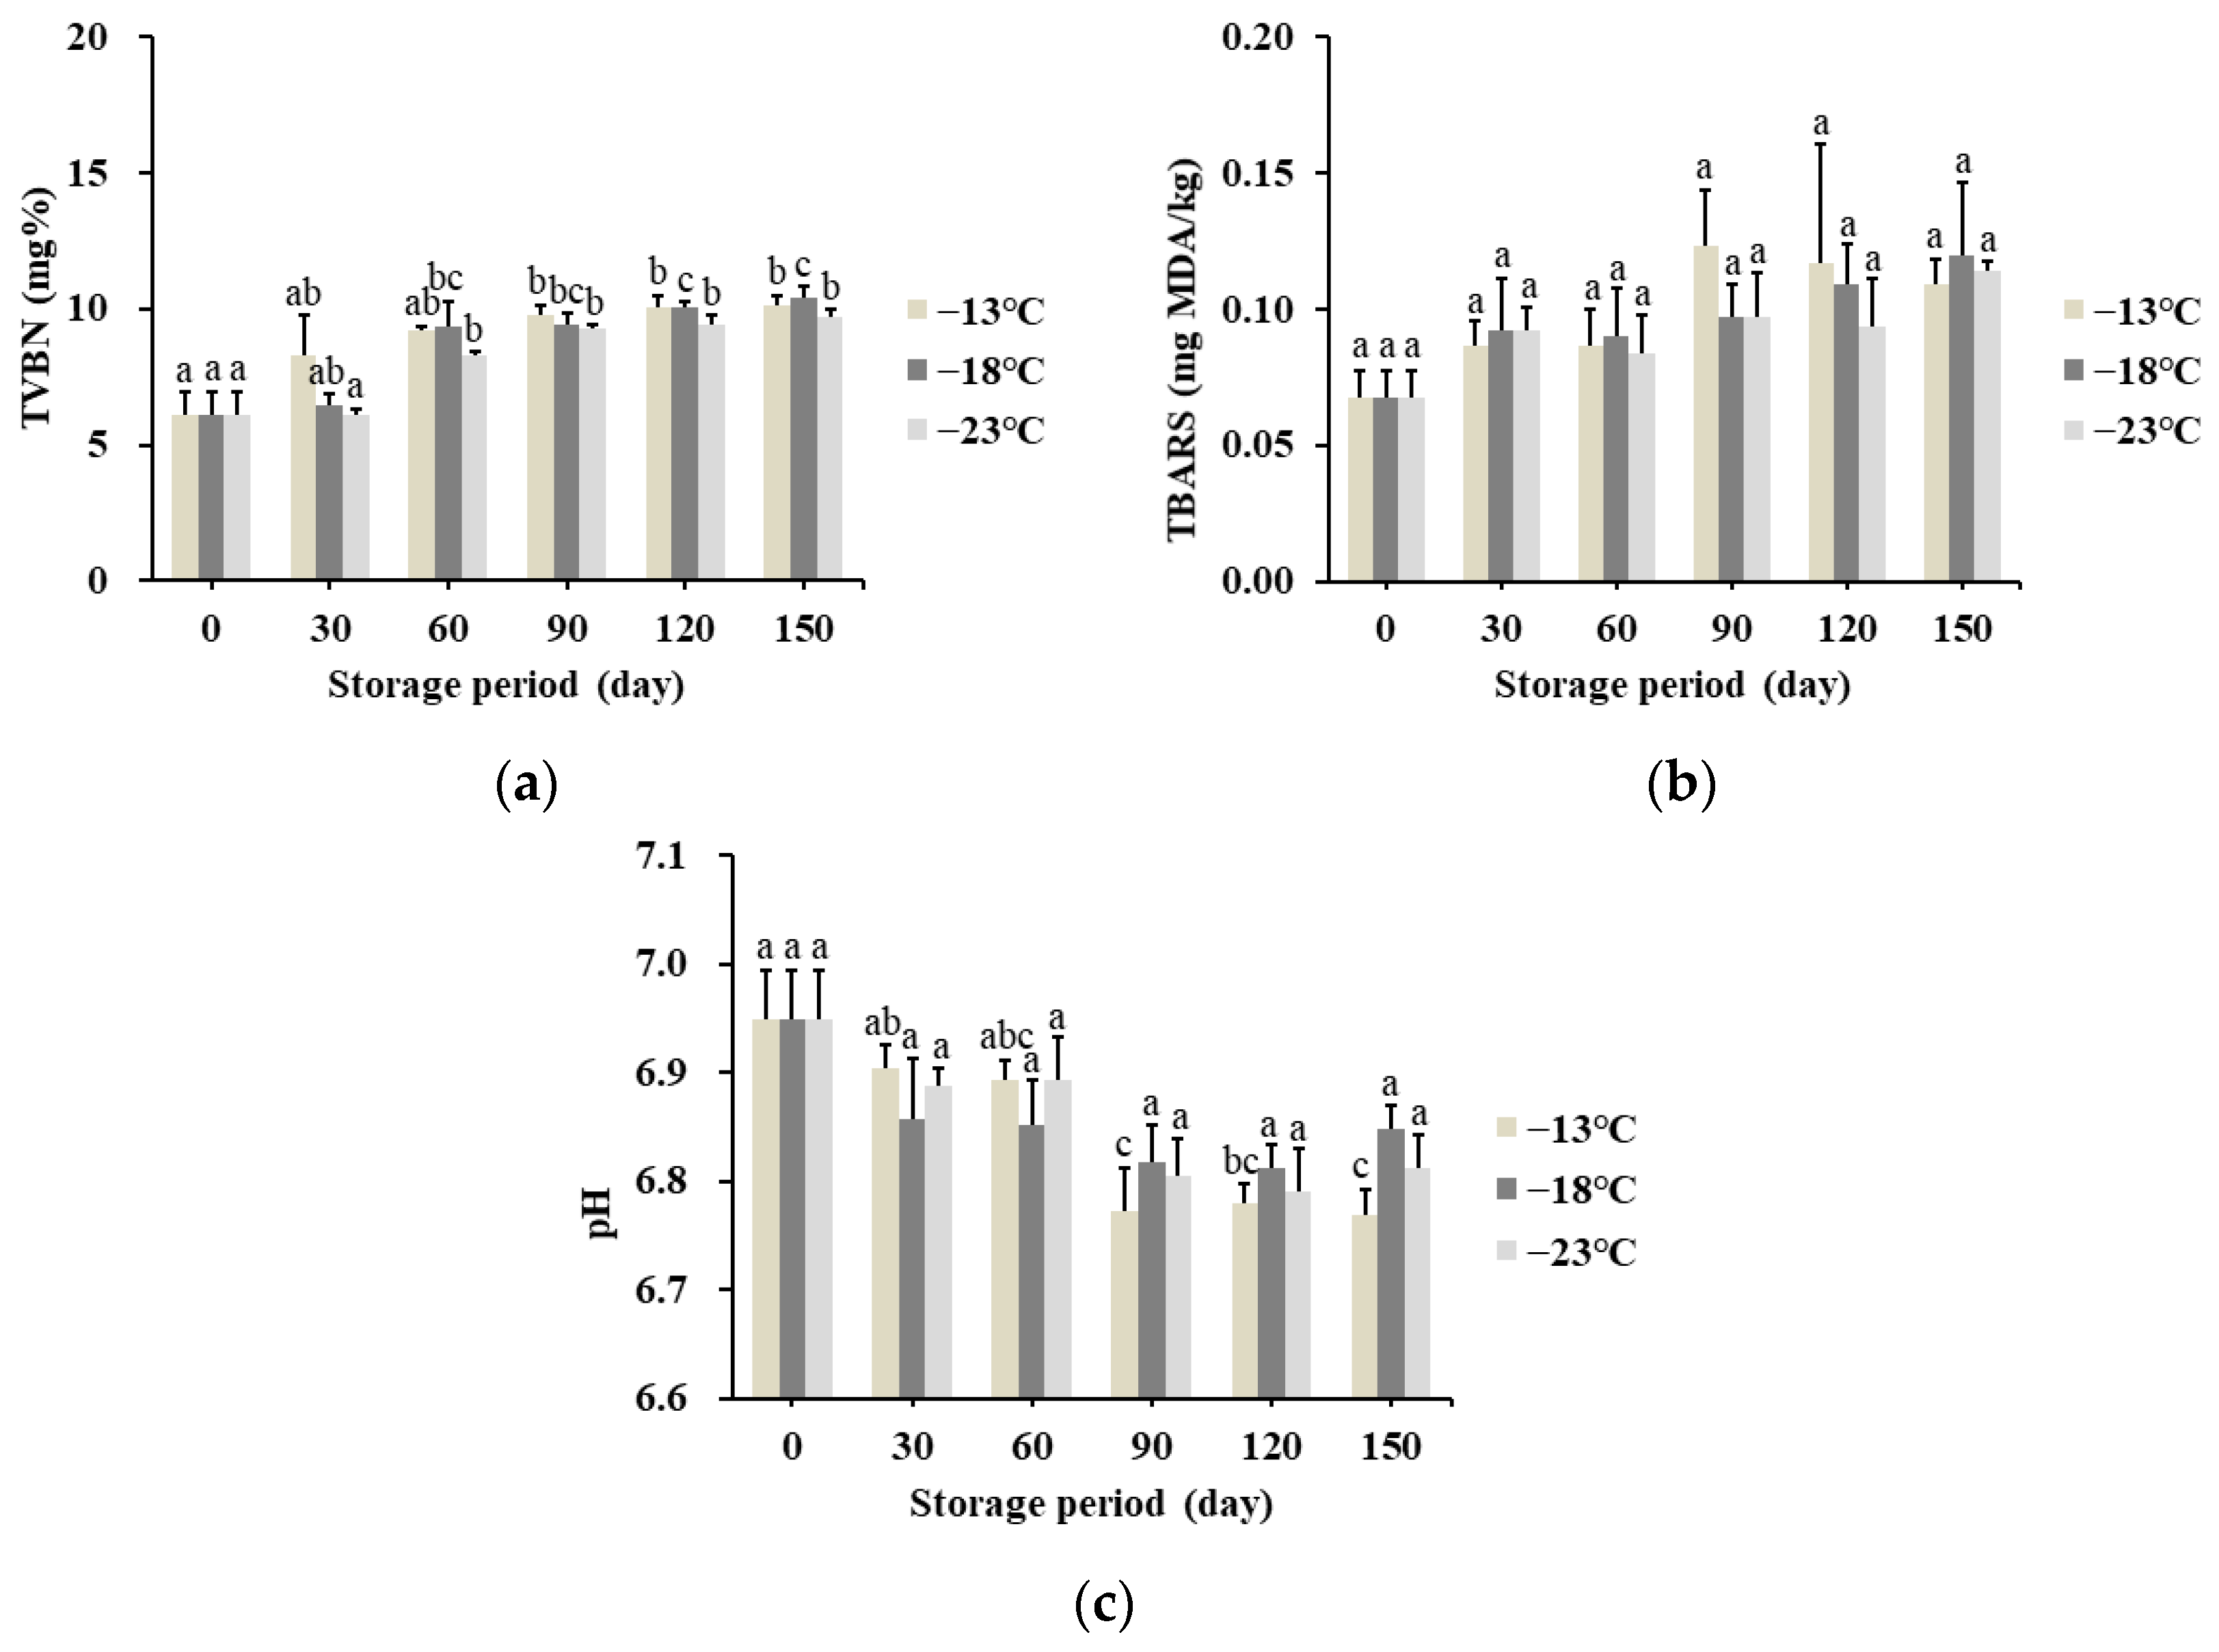
3.3.2. Total Volatile Basic Nitrogen

Total volatile basic nitrogen (TVBN) is one of the representative chemical parameters used to measure the spoilage level of food. TVBN content is regarded as a byproduct of nitrogenous decomposition generated by microbial and endogenous enzymes (Zhao et al., 2019) [29]. In this study, TVBN values were 8.66 ± 0.77 mg% in the raw material, 7.84 ± 0.31 mg% in nonenzyme processed yellowfin sole, and 6.08 ± 0.84 mg% in the final product. Considering our product was treated with endogenous enzymes such as Protamex and Neutrase, the TVBN content of the final product should logically have been higher than that of the nonenzyme-processed product. However, the results were not in accordance with previous study. Limam et al., (2008) [30] reported that the TVBN level of shrimp head protein hydrolysate was remarkably higher than that of raw shrimp head. For this difference, we have assumed that the cooking method, such as superheated steam treating might have contributed to the different results compared with a common trend. Tirtawijaya et al., (2020) [28] reported that superheated processed seafood had lower TVBN values than raw materials. Therefore, further studies connected to various processing methods are required to obviously prove this result.
On the other hand, the TVBN values for all three groups (raw, nonenzyme processed, final) were within the acceptable level (20 mg%). The TVBN content of freshly caught fish is normally in the range of 5–20 mg/100 g (Boran and Köse 2007) [31].

3.3.3. Thiobarbituric Acid Reactive Substances

Concerning thiobarbituric acid reactive substances (TBARS), similar trends to TVBN were observed. The TBARS level is indicative of fat oxidation in food and is expressed as malondialdehyde (MDA), which is one of the final products of polyunsaturated fatty acid (PUFA) peroxidation. Herein, raw yellowfin sole showed a comparatively higher TBARS value (0.13 ± 0.02 mg MDA/kg) than nonenzyme treated product (0.08 ± 0.01 mg MDA/kg) and final product (0.07 ± 0.01 mg MDA/kg). This result appears to differ from that reported by Okolie and Okugbo (2013) [32], in which cooking methods such as boiling, frying, and roasting increased the MDA levels in fish and livestock, such as beef, pork, and chicken. However, a decrease in TBARS was reported with superheated steam roasting in the study by Sutikno et al., (2019) [17]. To our knowledge, lipid oxidation with respect to enzymatic treatment for cooked yellowfin sole or flatfish has not been reported. Zhang et al., (2010) [33] demonstrated that the hydrolysates prepared by microbial proteases including Neutrase effectively inhibited lipid peroxidation in cooked beef. However, our results are not sufficient proof that enzymatic action inhibits lipid peroxidation, which should be further studied in the future with focus on the role of antioxidants. Schormuller et al., (1968) [34] reported that good quality frozen and chilled fish has a typical TBARS range of 5–8 mg MDA/kg, and the acceptable threshold is considered to be 8 mg MDA/kg. Yildiz et al., (2015) [13] categorized TBARS levels into four groups: perfect (<3 mg MDA/kg), good (3–5 mg MDA/kg), acceptable (7 or 8 mg MDA/kg) and unacceptable (>8 mg MDA/kg). Based on these parameters, the enzyme-processed yellowfin sole was safe and superior to the nonenzyme-processed product and raw material.

3.3.4. pH Values

The pH value is an indicator of the level of spoilage and freshness of fish products. The typical pH range of fresh fish is 5.5–6.6 (Yildiz et al., 2015) [13]. The present study revealed that cooked yellowfin sole, both nonenzyme-processed (7.02 ± 0.06) and final (6.95 ± 0.07) products, had higher pH values than the raw material (6.64 ± 0.10). Particularly, the nonenzyme-processed product had a significantly higher pH than the raw material and final product (p < 0.05). One of the main reasons for this shift is likely the cooking method. In a study by Tirtawijaya et al., (2020) [28], the pH value was remarkably increased in superheated steam roasted hagfish. Additionally, the pH difference between nonenzyme processed and final products might be driven by the accumulation of lactic acid during protein decomposition. In this study, the pH values of all three groups exceeded the typical range, which may have resulted from unfreshness of raw materials.

3.3.5. Hardness

Texture profile analysis (TPA) was employed to measure hardness, which is commonly used to characterize the texture attributes of food (Burey et al., 2009) [35]. In the present study, the hardness levels for the three groups were 143.51 ± 7.17 kN/m2 (raw material), 120.41 ± 15.32 kN/m2 (nonenzyme processed product), and 76.28 ± 3.03 kN/m2 (final product). The final product displayed significantly lower hardness than the other groups (p < 0.05). Tirtawijaya et al., (2020) [28] reported that humid conditions occur inside a superheated steam roaster, and Choi et al., (2016) [36] revealed that the hardness of cooked chicken steak was lower after superheated steam roasting than after other cooking methods, such as convective oven, grilling, and microwave oven. In addition to superheated steam treating, enzymatic treatment that is the most important processing method of this study also appeared to have a major impact on hardness level. In the study by Eom et al., (2015) [37], jumbo squid treated by injection of various commercial enzymes, including Neutase and Protamex, demonstrated significantly lower hardness values than nonenzyme-processed squid.
Moreover, all hardness levels for the three groups were within the maximum peak stress (<500 kN/m2) of elderly friendly foods, regulated by both the Japan Care Food Conference [38] and Korean Industrial Standards [39]. Particularly, the texture-modified yellowfin sole had the closest hardness value to the second softness criterion (<50 kN/m2) of elderly friendly food, indicating that human gums should be able to masticate the product.

3.3.6. Overall Acceptance

Comparison of overall acceptance between nonenzyme processed and final products was conducted to confirm whether the texture-modified yellowfin sole by enzymatic treatment was suitable for commercial applications. As shown in Table 6, the final product received a significantly higher overall acceptance (8.38 ± 0.19) from sensory panelists than the nonenzyme processed product (7.43 ± 0.43), owing to the soft texture and easy chewiness produced by enzymatic treatment. Grygier et al., (2020) [40] reported that the softened mantle of squid, whose hardness was decreased by enzyme treatment, resulted in significantly higher overall acceptance than the control group (no enzyme treatment), and that panelists over 70 years of age preferred chewy and mushy squid.

3.4. Trimethylamine (TMA) Composition

In general, trimethylamine (TMA) is considered the representative odor parameter of spoilage, as it is generated during protein decomposition and is thus used to determine the freshness of food. As the major odor content of fish, TMA is subsequently generated from trimethylamine oxide (TMAO) by microbial reduction activity (Park et al., 2020) [41]. Figure 2 displays the TMA chromatogram for the texture-modified yellowfin sole. Our study also compared the TMA concentrations of the raw material, nonenzyme treated product and the final product, respectively. As the results of calculation to the TMA peaks appeared within the closest retention time range (1:29–1:34), the peak area of three groups were 9,430,274 ± 864,440 for the raw material, 270,887 ± 78,293 for nonenzyme treated product, and 252,441 ± 44,721 for the final product. Based on the calibration curve, the TMA concentrations computed with the above peak areas were 5.38 ± 0.28 mg/100 g (raw material), 0.09 ± 0.04 mg/100 g (nonenzyme treated product), and 0.08 ± 0.02 mg/100 g (final product), respectively. According to Muzaddadi et al., (2016) [42], the recommended TMA content of good fish ranges between 1.25 and 2.00 mg/100 g, while the safe and acceptable level is considered 10–15 mg/100 g. Therefore, the texture-modified yellowfin sole showed comparatively lower TMA value than raw material. On the other hand, the difference between nonenzyme treated product and the final product was not significant. Actually, we have not found the study for comparing TMA content between raw fish and superheated steam treated sample. However, Mohibbullah et al., (2018) [14] reported that that superheated steam treated fish showed TMAO levels much lower than the acceptable limit. Taking into consideration the relationship between TMAO and TMA, it is assumed that superheated steam treatment places considerably affects the TMA content of texture-modified yellowfin sole and nonenzyme processed product. Overall, it seems that the superheated steam treatment remarkably decreases TMA values of fish meat regardless of its condition before treatment.

3.5. Amino Acid Analysis

The amino acid composition of the texture-modified yellowfin sole is listed in Table 7. The sum of amino acids in this product was 21.59 g per 100 g, which consisted of the following: aspartate, threonine, serine, glutamic acid, proline, glycine, alanine, valine, isoleucine, leucine, tyrosine, phenylalanine, histidine, lysine, arginine, cysteine, methionine, and tryptophan. Among these amino acids, glutamic acid was the most abundant amino acid (3.36 g, 15.6%), followed by aspartate, lysine, and leucine. From a nutritional perspective, it was confirmed that the ratio of essential to nonessential amino acids (45.67:54.33) of the texture-modified yellowfin sole was close to the reasonable balance (50:50) suggested by Mercer et al. (1989) [43]. These results suggest that texture-modified yellowfin sole contains a well-balanced amino acid dietary profile.
Generally, enzymatic treatment with proteases negatively impacts the flavor of food, for example, by increasing the bitterness. With respect to amino acid taste, the texture-modified yellowfin sole had higher amounts of sweet-tasting amino acids than those with bitter or umami taste. Shen et al., (2012) [44] reported that the enzymatic hydrolysate of fish muscle treated with Neutrase showed comparatively higher amounts of sweet- and umami-tasting amino acid content (SUA), such as alanine, aspartic, and glutamic acid, than fish muscle treated with Alcalase, Protamex, and Flavourzyme.
Moreover, the estimated daily requirements of essential amino acids for an adult man weighing 70 kg were expressed as units (g/kg body weight) [45]. The sum of amino acids from the texture-modified yellowfin sole (100 g) accounted for 42.56% of the estimated daily requirements of essential amino acids for an adult (70 kg body weight), indicating that at least 235 g of texture-modified yellowfin sole should be consumed to meet dietary requirements.
Protein quality can be measured using an indicator of the chemical score (Pyz-Łukasik and Paszkiewicz 2018) [46], which is a ratio calculated by the amount of limiting amino acid in the sample compared to the same amount of the corresponding amino acid in a standard protein. In the present study, the recommended amino acid scoring patterns (mg/g protein) for an adult were used as the reference protein value (FAO 2011) [47] to calculate the chemical score of the texture-modified yellowfin sole. As shown in Table 7, all the computed chemical scores of amino acids from the texture-modified yellowfin sole were >100%, except tryptophan (12.6%), which was the limiting amino acid for the texture-modified yellowfin sole.

3.6. Fatty Acid Analysis

In this analysis, both saturated and unsaturated fatty acids of the texture-modified yellowfin sole were measured. The fatty acid composition of the product is shown in Table 8. From the results, total saturated fatty acid (SFA) content accounted for 22.1% of total fatty acid, confirming that palmitic acid accounted for 10.2% of the saturated fatty acids. The number of double bonds determines whether the unsaturated fatty acid is a mono-unsaturated fatty acid (MUFA) or a PUFA. In the texture-modified yellowfin sole, the unsaturated fatty acids were composed of 33.7% MUFAs and 44.2% PUFAs. The total amount of fatty acids in the product was 3.44 g (/100 g).
The most abundant MUFA was oleic acid (16.3%), followed by palmitoleic acid (7.8%). PUFAs are also separated into n-3 (omega-3) and n-6 (omega-6), which differ according to the position of the last double bond in a fatty acid molecule. The texture-modified yellowfin sole showed that n-3 PUFAs were five times more abundant than n-6 PUFAs, with 37.7% n-3 PUFAs and 6.5% n-6 PUFAs. Particularly, eicosapentaenoic acid (EPA) (22.4%) comprised the highest proportion of unsaturated fatty acids. According to Lands (2005) [48], the reasonable ratio of n-3/n-6 PUFAs ranges between 1:1 and 4:1. However, Hibbeln et al., (2006) [49] reported that western diet typically consists of high n-6 and low n-3 PUFAs, with a ratio ranging between 10:1 and 30:1. Thus, modern diet should provide more n-3 than n-6 PUFAs: therefore, texture-modified yellowfin sole could be considered a sufficient n-3 PUFAs supplier for the nutritional perspective.

3.7. Nutritional Value

The nutritional values (ash, calories, sodium, carbohydrate, sugar, dietary fiber, crude fat, saturated fat, cholesterol, crude protein, vitamin D, potassium, iron, and calcium) of the texture-modified yellowfin sole are shown in Table 9 with the respective daily values. Daily values (DV) are representative indicators of nutrition recommendations defined by the US Food and Drug Administration (2016) [50]. In terms of the standard daily intake of 2000 calories, the amount of protein (20.7 g) in the texture-modified product was comparatively high per serving and accounted for a high percentage (41.4%) of its corresponding calorie content (118.5 cal). Likewise, the amount of saturated fat (0.8 g) represented a small percentage (4.0%) of the DV, in accordance with the low-saturated fat food label claim of 1 g or less of saturated fat per 100 g serving (National Heart, Lung, and Blood Institute, National Institutes of Health, Bethesda, MD, USA) [51].

3.8. Shelf-Life Analysis of Texture-Modified Yellowfin Sole

Our results demonstrated that the texture-modified yellowfin sole by enzymatic treatment was of high quality and potentially suitable for commercial applications. Next, the product’s shelf-life stability was verified. Quality characteristics, including microbial, physicochemical, and sensory properties, of the packaged product were investigated at three storage temperatures (−13, −18, and −23 °C) every 30 days for 150 days.

3.8.1. Microbial Properties

No bacterial colonies (aerobic bacteria, coliform group) were detected in any of the temperature groups during the storage period, likely due to the superheated steam treating, vacuum packaging, pasteurization, and frozen storage. Superheated steam treating affected the initial bacterial content of the product with an outstanding decrease, as presented in Table 6. Vacuum packaging causes anaerobic conditions inside the product package, resulting in inhibition of aerobic bacterial growth. Parker et al., (1994) [52] reported that vacuum-packaged oysters stored under frozen conditions for 70 days showed a decrease in aerobic bacteria. Regardless of hygienic control of the cooking process, it is impossible to maintain a perfectly sterilized condition due to bacterial contamination from the atmosphere without secondary sterilization after packaging. Thus, to inhibit bacterial enrichment after roasting, the product was pasteurized for 20 min in a 90 °C water bath. Lastly, frozen storage is one of the most common storage methods employed to extend product shelf life.

3.8.2. Physicochemical Properties

Chemical changes in the product stored at different temperatures for 150 days are shown in Figure 3. The TVBN values of all three temperature groups demonstrated a significant increase compared with the initial values over 150 days (Figure 3a). Overall, the TVBN content of the −23 °C group was lower than that of the other temperature groups, whereas the majority of samples stored at −13 °C showed slightly higher TVBN values than those stored at other temperatures. This indicated that the lower frozen storage temperature resulted in greater inhibition of protein decomposition by microbial activity. A similar trend was observed in the study by Mohibbullah et al., (2018) [14], in which the TVBN content of the adductor muscle of the pen shell was lower when stored at colder temperatures. All final TVBN values for the three temperature groups on day 150 were approximately half of the recommended level of freshness (<20 mg%).
In terms of lipid oxidation change, the TBARS values of product stored at different temperatures for 150 days are presented in Figure 3b. Samples stored at −18 and −23 °C displayed slightly irregular TBARS patterns, while samples stored at −13 °C exhibited an almost increasing trend for 150 days. Interestingly, none of the TBARS values changed significantly (p < 0.05). The maximum TBARS value was 0.123 mg MDA/kg for the sample stored at −13 °C on day 90, which was within the common recommendation value (8 mg MDA/kg), as previously mentioned in Section 3.3.3. This suggests that our processing significantly inhibited lipid oxidation and might have inactivated the lipolytic enzymes. In a study by Karlsdottir et al., (2012) [53], the quality of fish filets was affected by lipolytic enzyme activity under frozen storage conditions. In addition, the absolute TBARS content may be related to fish species. Yamaguchi et al., (1984) [54] reported that TBARS levels in the skin of lean fish were always lower than those of fatty fish; however, TBARS per unit lipid in the skin was higher in lean fish than in fatty fish during cold storage. According to Etemadian and Shabanpour (2014) [55], vacuum packaging also has a considerable effect on TBARS levels, demonstrating that the rate of TBARS increase was lower in vacuum-packaged fish filets than in nonvacuum-packaged filets under ice storage conditions for 15 days. Overall, the outstandingly low TBARS levels observed during this shelf-life analysis period were attributed to the species (lean fish) and packaging type (vacuum packaging).
The pH changes of the texture-modified yellowfin sole in the test period are shown in Figure 3c. Overall, the pH values displayed a decreasing trend at all storage temperatures for 150 days, which may have been caused by accumulation of lactic acid resulting from glycogen breakdown in fish muscle. The decreasing pH during frozen storage was also observed in the study by Shi et al., (2020) [56], in which channel catfish exhibited a decrease in pH over eight weeks. Meanwhile, a significant pH change was confirmed in only one storage condition (−13 °C), ranging from 6.95 to 6.77 for 150 days. Eventually, these results gradually approached the normal pH range of fish (5.5–6.6).
Figure 4 illustrates the difference in hardness levels at different storage temperatures for 150 days. All storage groups showed a similar decrease in hardness after storage days and this is considered the result of freezing. Dalvi-Isfahan et al. (2016) [57] reviewed some studies and concluded that the tenderness of meat increases with freezing and thawing, as the decrease of hardness for frozen meat is related to the loss of structural integrity caused by ice crystal formation (Leygoni et al. 2012) [58]. In this study, all frozen samples basically showed decrease in hardness regardless of the different temperatures; the hardness levels of samples stored at different temperatures ranged between 64.53 and 76.28 kN/m2 after 150 days and did not differ significantly among temperature groups (p < 0.05).

3.8.3. Sensory Properties

Sensory properties are one of the most important factors for evaluating the shelf life of a product. Table 10 presents the changes in sensory evaluation scores during the storage period. The appearance, taste, and texture properties did not differ among the temperature groups for 150 days (p < 0.05). Specifically, in terms of odor properties, only the group stored at −13 °C received a significantly decreased score (7.95) on day 150, whereas the odor properties did not differ significantly between the groups stored at −18 and −23 °C. The largest difference in overall acceptance also appeared in the product stored at −13 °C, which decreased from 8.57 to 7.95 for 150 days. The overall acceptance of the product stored at −18 °C was not significantly affected during the same period. These results indicated that the texture-modified yellowfin sole stored at −18 °C would provide higher sensory qualities for consumers after 150 days than storage at −13 or −23 °C.

3.9. Shelf-Life Analysis of Texture-Modified Yellowfin Sole

Based on the results of microbial, physicochemical, and sensory parameter tests, the predicted shelf life of the texture-modified yellowfin sole is shown in Table 11. Industrially, TVBN has been commonly used as a representative parameter owing to its statistical significance in Korea. Park et al., (2014) [59] reported that a model showing a high R2 value is appropriate for predicting the shelf life for zero- and first-order models. In this study, the results computed using the zero-order model were used to determine the predicted shelf life (16.52 months), showing a higher R2 at each storage temperature than when the first-order model was used. However, there are various factors that affect shelf-life conditions, regardless of how well the product is handled throughout production, transportation, and storage. Thus, the final shelf life was multiplied by a safety factor (0.8), and was calculated to be approximately 13 months.

4. Conclusions

This study presents the optimization of texture modification by enzymatic treatment of yellowfin sole and selection of the optimum marination herb, assessed by comparing various chemical and quality characteristics, as well as shelf-life prediction of the final product. The optimum conditions for texture modification using a mixture of Protamex and Neutrase proteases were 1.0% (w/v) enzyme solution and 3.16 h immersion time, achieving excellent sensory properties and optimal hardness levels. Additionally, bay leaf was selected as the preferred marination ingredient to improve the bitter taste imparted by enzymatic treatment. The final product was deemed to be superior to the raw material and the nonenzymatically processed product. Based on various analyses at different storage conditions, the frozen shelf life was calculated to be approximately 13 months. Overall, these results indicate that the texture-modified yellowfin sole developed in the current study is a suitable and safe food, especially for elderly patients with dysphagia.

Author Contributions

Conceptualization, S.-J.Y. and J.-S.C.; methodology, J.-S.C.; software, W.-H.C.; validation, W.-H.C. and J.-S.C.; formal analysis, W.-H.C.; investigation, W.-H.C., J.-S.C.; resources, S.-J.Y.; data curation, W.-H.C., J.-S.C.; writing—original draft preparation, W.-H.C.; writing—review and editing, J.-S.C.; visualization, W.-H.C.; supervision, J.-S.C.; project administration, J.-S.C.; funding acquisition, S.-J.Y. All authors have read and agreed to the published version of the manuscript.

Funding

This study was funded by the Ministry of Oceans and Fisheries (MOF), Republic of Korea, under the Project no. 20200130 entitled “Development and commercialization of texture-modified seafood HMR product customizing overseas needs” supervised by the Korea Institute of Marine Science and Technology promotion (KIMST).

Institutional Review Board Statement

The study was conducted according to the guidelines of the Declaration of Helsinki, and approved by the Institutional Review Board of Silla University (protocol code 1041449-202009-HR-007 and 21 September 2020).

Informed Consent Statement

Informed consent was obtained from all subjects involved in the study.

Data Availability Statement

Data supporting reported results are available upon request.

Conflicts of Interest

The authors declare no conflict of interest for this article.

Appendix A

Table A1. Sensory evaluation of texture-modified yellowfin sole treated by different enzyme mixture ratios (Protamex: Neutrase).
GroupsAppearanceOdorTasteTextureOverall
Acceptance
Control8.48 d ± 0.166.19 a ± 0.118.05 c ± 0.206.62 a ± 0.207.38 ab ± 0.15
1:06.10 a ± 0.125.95 a ± 0.155.48 a ± 0.158.38 d ± 0.167.00 a ± 0.22
1:17.29 bc ± 0.236.10 a ± 0.157.05 b ± 0.248.00 cd ± 0.157.14 a ± 0.21
1:27.05 b ± 0.227.00 b ± 0.227.38 b ± 0.157.67 bc ± 0.208.00 b ± 0.17
1:37.81 cd ± 0.207.00 b ± 0.207.19 b ± 0.167.00 ab ± 0.177.33 ab ± 0.14
Values are mean ± SE. Different letters (a–d) in each column indicate significant differences among means by Tukey’s test (p < 0.05). ll sample groups were treated in 1.0% (w/v) of enzyme solution concentration for 3 h; the other methods are described in the Materials and Methods, Section 2.

References

  1. United Nations Population Division. World Population Prospects 2019: Highlights, the United Nations; United Nations Population Division: Geneva, Switzerland, 2019; p. 28. [Google Scholar]
  2. Life Expectancy and Healthy Life Expectancy Data by Country. Available online: https://apps.who.int/gho/data/node.main.688 (accessed on 16 March 2021).
  3. Cichero, J.A.Y.; Lam, P.; Steele, C.M.; Hanson, B.; Chen, J.; Dantas, R.O.; Pillay, M. Development of international terminology and definitions for texture-modified foods and thickened fluids used in dysphagia management: The IDDSI framework. Dysphagia 2017, 32, 293–314. [Google Scholar] [CrossRef] [Green Version]
  4. Maksimenko, A.; Lyude, A.; Nishiumi, T. Texture-modified foods for the elderly and people with dysphagia: Insights from Japan on the current status of regulations and opportunities of the high pressure technology. IOP Conf. Ser. Earth Environ. Sci. 2020, 548, 022106. [Google Scholar] [CrossRef]
  5. Sungsinchai, S.; Niamnuy, C.; Wattanapan, P.; Charoenchaitrakool, M.; Devahastin, S. Texture modification technologies and their opportunities for the production of dysphagia foods: A review. Compr. Rev. Food Sci. Food Saf. 2019, 18, 1898–1912. [Google Scholar] [CrossRef] [PubMed] [Green Version]
  6. Food & Agriculture Organization of the United Nations (FAO). FAO Yearbook of Fishery and Aquaculture Statistics 2018; FAO: Rome, Italy, 2021; p. 36. [Google Scholar]
  7. Korea Maritime Institute (KMI). Trend of Fisheries Import from FTA Partners 4th Quarter 2020; KMI: Yeongdo-gu, Korea, 2020; p. 33. [Google Scholar]
  8. Guérard, F.; Dufosse, L.; De La Broise, D.; Binet, A. Enzymatic hydrolysis of proteins from yellowfin tuna (Thunnus albacares) wastes using Alcalase. J. Mol. Catal. B Enzym. 2001, 11, 1051–1059. [Google Scholar] [CrossRef]
  9. Liaset, B.; Nortvedt, R.; Lied, E.; Espe, M. Studies on the nitrogen recovery in enzymic hydrolysis of Atlantic salmon (Salmo salar L.) frames by Protamex™ protease. Process Biochem. 2002, 37, 1263–1269. [Google Scholar] [CrossRef]
  10. Fu, Y.; Liu, J.; Hansen, E.T.; Bredie, W.L.; Lametsch, R. Structural characteristics of low bitter and high umami protein hydrolysates prepared from bovine muscle and porcine plasma. Food Chem. 2018, 257, 163–171. [Google Scholar] [CrossRef] [PubMed]
  11. AOAC International. International Official Methods of Analysis Official Methods 990.12, 18th ed.; Association of Official Analytical Chemists: Arlington, VA, USA, 2002. [Google Scholar]
  12. AOAC International. International Official Methods of Analysis Official Methods 991.14, 18th ed.; Association of Official Analytical Chemists: Arlington, VA, USA, 2002. [Google Scholar]
  13. Oğuzhan Yildiz, P. Effect of essential oils and packaging on hot smoked rainbow trout during storage. J. Food Process. Preserv. 2015, 39, 806–815. [Google Scholar] [CrossRef]
  14. Mohibbullah, M.; Won, N.E.; Jeon, J.H.; An, J.H.; Park, Y.; Kim, H.; Bashir, K.M.I.; Park, S.M.; Kim, Y.S.; Yoon, S.J.; et al. Effect of superheated steam roasting with hot smoking treatment on improving physicochemical properties of the adductor muscle of pen shell (Atrina pectinate). Food Sci. Nutr. 2018, 6, 1317–1327. [Google Scholar] [CrossRef]
  15. Ministry of Food and Drug Safety (MFDS). 8th General Analysis Method. Foodcode (Sik-Poom-Gong-Jeon); MFDS: Cheongju, Korea, 2020; pp. 259–260. Available online: https://www.foodsafetykorea.go.kr/foodcode/01_03.jsp?idx=11142 (accessed on 28 September 2020).
  16. AOAC International. International Official Methods of Analysis Official Methods 925.09, 923.03, 979.09, 962.09, and 923.05, 17th ed.; Association of Official Analytical Chemists: Washington, DC, USA, 2000. [Google Scholar]
  17. Sutikno, L.A.; Bashir, K.M.I.; Kim, H.; Park, Y.; Won, N.E.; An, J.H.; Jeon, J.H.; Yoon, S.J.; Park, S.M.; Sohn, J.H.; et al. Improvement in Physicochemical, Microbial, and Sensory Properties of Common Squid (Todarodes pacificus) by Superheated Steam Roasting in Combination with Smoking Treatment. J. Food Qual. 2019, 2019, 8721725. [Google Scholar] [CrossRef]
  18. AOAC International. International Official Methods of Analysis Official Methods 963.22, 16th ed.; Association of Official Analytical Chemists: Arlington, VA, USA, 1995. [Google Scholar]
  19. AOAC International. International Official Methods of Analysis Official Methods 994.12, 17th ed.; Association of Official Analytical Chemists: Washington, DC, USA, 2000. [Google Scholar]
  20. Ministry of Food and Drug Safety (MFDS). The Guideline for Shelf-Life Analysis of General Food, Livestock Meat and Health Functional Food, 5th ed.; MFDS: Cheongju, Korea, 2019. [Google Scholar]
  21. MFDS Food Safety Korea. Available online: https://www.foodsafetykorea.go.kr/main.do (accessed on 22 March 2021).
  22. Jafari, S.M.; Ganje, M.; Dehnad, D.; Ghanbari, V.; Hajitabar, J. Arrhenius equation modeling for the shelf life prediction of tomato paste containing a natural preservative. J. Sci. Food Agric. 2017, 97, 5216–5222. [Google Scholar] [CrossRef]
  23. Joglekar, A.M.; May, A.T. Product excellence through design of experiments. Cereal Foods World 1987, 32, 857–868. [Google Scholar]
  24. Ball, D.W.; Hill, J.W.; Scott, R.J. 18.6: Enzyme Activity. In The Basics of General, Organic, and Biological Chemistry, 1st ed.; Saylor Academy: Washington, DC, USA, 2011. [Google Scholar]
  25. Kilara, A. Enzyme-Modified Protein Food Ingredients. Process Biochem. 1985, 20, 149–157. Available online: http://pascal-francis.inist.fr/vibad/index.php?action=getRecordDetail&idt=8473076 (accessed on 29 September 2020).
  26. Schiffman, S.S.; Dackis, C. Taste of nutrients: Amino acids, vitamins, and fatty acids. Percept. Psychophys. 1975, 17, 140–146. [Google Scholar] [CrossRef]
  27. Pereira, P.A.P.; Souza, V.R.D.; Carneiro, J.D.S. Sensory perception of Brazilian petit suisse cheese by a consumer panel using three-way internal and external preference maps. MOJ Food Process Technol. 2020, 8, 109–112. [Google Scholar] [CrossRef]
  28. Tirtawijaya, G.; Park, Y.; Won, N.E.; Kim, H.; An, J.H.; Jeon, J.H.; Park, S.M.; Yoon, S.J.; Sohn, J.H.; Kim, J.S.; et al. Effect of steaming and hot smoking treatment combination on the quality characteristics of hagfish (Myxine glutinosa). J. Food Process. Preserv. 2020, 44, 1–12. [Google Scholar] [CrossRef]
  29. Zhao, C.C.; Benjakul, S.; Eun, J.B. Changes in protein compositions and textural properties of the muscle of skate fermented at 10 °C. Int. J. Food Prop. 2019, 22, 173–185. [Google Scholar] [CrossRef]
  30. Limam, Z.; Sadok, S.; Abed, A.E. Enzymatic hydrolysis of shrimp head waste: Functional and biochemical properties. Food Biotechnol. 2008, 22, 352–362. [Google Scholar] [CrossRef]
  31. Boran, M.; Köse, S. Storage Properties of Three Types of Fried Whiting Balls at Refrigerated Temperatures. Turk. J. Fish. Aquat. Sci. 2007, 7, 65–70. Available online: https://www.trjfas.org/abstract.php?lang=en&id=314 (accessed on 28 September 2020).
  32. Okolie, N.P.; Okugbo, T.O. A comparative study of malondialdehyde contents of some meat and fish samples processed by different methods. J. Pharm. Sci. Innov. 2013, 2, 26–29. [Google Scholar] [CrossRef]
  33. Zhang, L.; Li, J.; Zhou, K. Chelating and radical scavenging activities of soy protein hydrolysates prepared from microbial proteases and their effect on meat lipid peroxidation. Bioresour. Technol. 2010, 101, 2084–2089. [Google Scholar] [CrossRef]
  34. Schormüller, J. (Ed.) Fette und lipoide (lipids). In Handbuch der Lebensmittel Chemie; Band II/2 Teil; Springer: Berlin/Heidelberg, Germany; New York, NY, USA, 1965; pp. 872–878. [Google Scholar]
  35. Burey, P.; Bhandari, B.R.; Rutgers, R.P.G.; Halley, P.J.; Torley, P.J. Confectionery gels: A review on formulation, rheological and structural aspects. Int. J. Food Prop. 2009, 12, 176–210. [Google Scholar] [CrossRef] [Green Version]
  36. Choi, Y.S.; Hwang, K.E.; Jeong, T.J.; Kim, Y.B.; Jeon, K.H.; Kim, E.M.; Kim, C.J. Comparative study on the effects of boiling, steaming, grilling, microwaving and superheated steaming on quality characteristics of marinated chicken steak. Korean J. Food Sci. Anim. Resour. 2016, 36, 1–7. [Google Scholar] [CrossRef]
  37. Eom, S.H.; Lee, S.H.; Chun, Y.G.; Park, C.E.; Park, D.J. Softening of jumbo squid Dosidicus gigas via enzyme injection. Fish. Aquat. Sci. 2015, 18, 229–233. [Google Scholar] [CrossRef]
  38. Japan Care Food Conference. Available online: https://www.udf.jp/outline/udf.html (accessed on 22 March 2021).
  39. Korean Industrial Standards for Seniors Friendly Foods (KS H 4897). Available online: https://e-ks.kr/streamdocs/view/sd;streamdocsId=72059203773233835 (accessed on 22 March 2021).
  40. Grygier, M.J.; Fan, Y.W.; Sung, W.C. Effects of Different Softening Processes on the Hardness and Quality of Thawed Neritic Squid (Uroteuthis edulis) Muscle. Processes 2020, 8, 135. [Google Scholar] [CrossRef] [Green Version]
  41. Park, S.K.; Jo, D.M.; Yu, D.; Khan, F.; Lee, Y.B.; Kim, Y.M. Reduction of Trimethylamine Off-Odor by Lactic Acid Bacteria Isolated from Korean Traditional Fermented Food and Their In Situ Application. J. Microbiol. Biotechnol. 2020, 30, 1510–1515. [Google Scholar] [CrossRef] [PubMed]
  42. Muzaddadi, A.U.; Devatkal, S.; Oberoi, H.S. Agro-Industrial Wastes as Feedstock for Enzyme Production, 1st ed.; Academic Press: Cambridge, MA, USA, 2016. [Google Scholar] [CrossRef]
  43. Mercer, L.P.; Dodds, S.J.; Smith, D.I. Dispensable, indispensable, and conditionally indispensable amino acid ratios in the diet. Absorpt. Util. Amino Acids 1989, 1, 1–13. [Google Scholar]
  44. Shen, Q.; Guo, R.; Dai, Z.; Zhang, Y. Investigation of enzymatic hydrolysis conditions on the properties of protein hydrolysate from fish muscle (Collichthys niveatus) and evaluation of its functional properties. J. Agric. Food Chem. 2012, 60, 5192–5198. [Google Scholar] [CrossRef]
  45. World Health Organization; United Nations University. Protein and Amino Acid Requirements in Human Nutrition; World Health Organization: Geneva, Switzerland, 2007; Volume 935, p. 150. Available online: https://apps.who.int/iris/handle/10665/43411 (accessed on 29 September 2020).
  46. Pyz-Łukasik, R.; Paszkiewicz, W. Species variations in the proximate composition, amino acid profile, and protein quality of the muscle tissue of grass carp, bighead carp, siberian sturgeon, and wels catfish. J. Food Qual. 2018, 2018, 2625401. [Google Scholar] [CrossRef]
  47. Consultation, F.E. Dietary Protein Quality Evaluation in Human Nutrition; FAO Food and Nutrition Paper; FAO: Rome, Italy, 2011; p. 29. [Google Scholar]
  48. Lands, W.E. Fish, Omega-3 and Human Health; Champaign, AOCS Press: Urbana, IL, USA, 2005; Volume 220. [Google Scholar]
  49. Hibbeln, J.R.; Nieminen, L.R.; Blasbalg, T.L.; Riggs, J.A.; Lands, W.E. Healthy intakes of n−3 and n–6 fatty acids: Estimations considering worldwide diversity. Am. J. Clin. Nutr. 2006, 83, 1483S–1493S. [Google Scholar] [CrossRef]
  50. Industry Resources on the Changes to the Nutrition Facts Label. Available online: https://www.fda.gov/food/food-labeling-nutrition/industry-resources-changes-nutrition-facts-label (accessed on 22 March 2021).
  51. CFR—Code of Federal Regulations Title 21. Available online: https://www.accessdata.fda.gov/scripts/cdrh/cfdocs/cfcfr/cfrsearch.cfm?fr=101.62 (accessed on 22 March 2021).
  52. Parker, R.W.; Maurer, E.M.; Childers, A.; Lewisi, D.H. Effect of frozen storage and vacuum-packaging on survival of Vibrio vulnificus in Gulf Coast oysters (Crassostrea virginica). J. Food Prot. 1994, 57, 604–606. [Google Scholar] [CrossRef] [PubMed]
  53. Karlsdottir, M.G.; Sveinsdottir, K.; Kristinsson, H.G.; Villot, D.; Craft, B.D.; Arason, S. Effects of temperature during frozen storage on lipid deterioration of saithe (Pollachius virens) and hoki (Macruronus novaezelandiae) muscles. Food Chem. 2012, 156, 234–242. [Google Scholar] [CrossRef] [PubMed]
  54. Yamaguchi, K.; Toyomizu, M. A role of phospholipid in antioxygenic action of lipids from the ordinary muscle of lean fish (plaice, Paralichthys olivaceus). Bull. Jpn. Soc. Sci. Fish. 1984, 50, 1897–1903. [Google Scholar] [CrossRef]
  55. Etemadian, Y.; Shabanpour, B. Changes in physicochemical properties and shelf life ability of kutum (Rutilus frisiikutum) slices during packaging and storage in ice. J. Food Process. Preserv. 2014, 38, 159–168. [Google Scholar] [CrossRef]
  56. Shi, L.; Yin, T.; Wang, L.; Xiong, G.; Gao, R.; Ding, A.; Jiao, C. Effect of pre-chilling time on the physicochemical properties of channel catfish during frozen storage. Int. J. Refrig. 2020, 115, 56–62. [Google Scholar] [CrossRef]
  57. Dalvi-Isfahan, M.; Hamdami, N.; Le-Bail, A. Effect of freezing under electrostatic field on the quality of lamb meat. Innov. Food Sci. Emerg. Technol. 2016, 37, 68–73. [Google Scholar] [CrossRef]
  58. Leygonie, C.; Britz, T.J.; Hoffman, L.C. Impact of freezing and thawing on the quality of meat. Meat Sci. 2012, 91, 93–98. [Google Scholar] [CrossRef] [PubMed]
  59. Park, J.H.; An, D.S.; Lee, D.S.; Park, E. Prediction of shelf-life of sea tangle drink. J. Korean Soc. Food Sci. Nutr. 2014, 43, 784–790. [Google Scholar] [CrossRef] [Green Version]
Figure 1. Three-dimensional response surface plots of texture-modified yellowfin sole with respect to concentration and time of enzyme treatment: (a) hardness values and (b) overall acceptance values.
Processes 09 00763 g001
Figure 2. Chromatogram of trimethylamine (TMA) levels for texture-modified yellowfin sole by quantitative analysis using HS–SPME GC–MS.
Processes 09 00763 g002
Figure 3. Changes in the chemical properties of texture-modified yellowfin sole stored at different temperatures for 150 days. Values of (a) total volatile basic nitrogen (TVBN), (b) thiobarbituric acid reactive substances (TBARS), and (c) pH. Data are presented as mean ± SE. Different letters (ac) indicate significant differences among means by Tukey’s test (p < 0.05); −13 °C, −18 °C, −23 °C.
Processes 09 00763 g003
Figure 4. Changes in the hardness property of texture-modified yellowfin sole stored at different temperatures (–13, −18, and −23 °C). Data are presented as mean ± SE. The letter (a) indicates significant differences among means by Tukey’s test (p < 0.05); 0 day storage, 150 day storage.
Processes 09 00763 g004
Table 1. Independent variables, codes, and actual levels for optimization of texture modification by enzymatic treatment of yellowfin sole.
Independent VariablesSymbolUnitRange Level
−1.414−10+1+1.414
ConcentrationX1%0.30.51.01.51.7
TimeX2h1.62.03.04.04.4
Table 2. Central composite design of independent variables and response of dependent variables during optimization of texture modification by enzymatic treatment of yellowfin sole.
Run No.Independent VariablesDependent Variables
Coded ValuesActual ValuesPredicted ValuesActual Values
X1X2X1X2Y1Y2Y1Y2
1−1−10.52.0104.216.89109.977.00
2+1−11.52.089.447.2390.617.19
3−1+10.54.079.017.2481.597.05
4+1+11.54.068.557.1566.556.81
5−1.41400.33.091.946.8986.826.90
6+1.41401.73.074.097.0675.447.29
70−1.4141.01.6103.897.1999.777.10
80+1.4141.04.471.297.3871.657.71
9001.03.078.858.6282.648.33
10001.03.078.858.6276.758.67
11001.03.078.858.6277.158.86
Table 3. Analysis of variance for response of dependent variables during optimization of texture modification by enzymatic treatment yellowfin sole.
ResponsesSourcesDegree of FreedomSum of SquareMean SquareF-Valuep-Value
Y1
(Hardness)
Model51,497,399,512299,479,90213.390.006
Linear21,380,861,537690,430,76930.860.002
  X11318,487,830318,487,83014.24<0.013
  X211,062,373,7071,062,373,70747.49<0.001
Quadratic2111,882,43555,941,2172.50.177
  X1X1124,524,21824,524,2181.10.343
  X2X21107,945,524107,945,5244.830.079
Interaction14,655,5404,655,5400.210.667
  X1X214,655,5404,655,5400.210.667
Error5111,856,61622,371,323
Lack of fit390,212,04430,070,6812.780.276
Pure error221,644,57210,822,286
R2= 0.931Total101,609,256,128
Y2
(Overall acceptance)
Model55.044971.0089910.510.011
Linear20.066910.033460.350.722
  X110.031440.031440.330.592
  X210.035470.035470.370.570
Quadratic24.931832.4659225.680.002
  X1X113.814473.8144739.73<0.001
  X2X212.511372.5113726.16<0.004
Interaction10.046230.046230.480.519
  X1X210.046230.046230.480.519
Error50.480050.09601
Lack of fit30.335850.111951.550.415
Pure error20.144200.07210
R2= 0.913Total105.52502
Table 4. Optimum conditions for enzymatic treatment of texture-modified yellowfin sole using response surface methodology.
ResponsesOptimizingOptimum Code ValuesPredicted ValueExperimental ValueDesirability
X1X2
Y1Targeting (77.15)1.003.1677.1476.23 ± 3.020.990.91
Y2Maximizing8.618.38 ± 0.190.82
Table 5. Sensory evaluation of texture-modified yellowfin sole marinated with different herbal extract solutions.
HerbsAppearanceOdorTasteTextureOverall Acceptance
Control6.81 abc ± 0.146.62 ab ± 0.335.90 ab ± 0.247.86 a ± 0.216.67 abc ± 0.19
Bay leaves7.05 bc ± 0.137.76 b ± 0.097.43 d ± 0.198.19 a ± 0.207.90 d ± 0.15
Coriander powder6.95 bc ± 0.146.90 ab ± 0.166.05 ab ± 0.168.05 a ± 0.177.24 cd ± 0.23
Fennel whole6.14 a ± 0.195.95 a ± 0.266.05 ab ± 0.297.81 a ± 0.096.67 abc ± 0.18
Thyme whole7.24 c ± 0.116.48 a ± 0.375.90 ab ± 0.187.81 a ± 0.136.38 abc ± 0.23
Cumin seeds6.67 abc ± 0.175.95 a ± 0.355.67 ab ± 0.257.62 a ± 0.146.19 ab ± 0.27
Basil whole7.14 bc ± 0.196.05 a ± 0.165.48 a ± 0.147.76 a ± 0.156.48 abc ± 0.19
Basil powder6.81 abc ± 0.146.86 ab ± 0.257.14 cd ± 0.107.95 a ± 0.117.24 cd ± 0.13
Star anise6.05 a ± 0.216.19 a ± 0.235.90 ab ± 0.157.95 a ± 0.176.10 a ± 0.15
Sea buckthorn
fruit powder
6.43 ab ± 0.266.19 a ± 0.256.48 bc ± 0.197.71 a ± 0.147.10 bcd ± 0.23
Values are mean ± SE. Different letters (a–d) in each column indicate significant differences among means by Tukey’s test (p < 0.05).
Table 6. Microbial, physicochemical, and sensory properties of raw, nonenzyme processed, and texture-modified yellowfin sole by enzymatic treatment.
ParametersRaw Yellowfin SoleNonenzyme Processed
Yellowfin Sole
Texture-Modified
Yellowfin Sole
Total bacteria counts
(log CFU/g)
4.06 ± 0.32NDND
Total volatile basic nitrogen
(mg%)
8.66 a ± 0.777.84 a ± 0.316.08 a ± 0.84
pH6.64 a ± 0.107.02 b ± 0.066.95 a ± 0.07
Thiobarbituric acid reactive
substances
(mg MDA/kg)
0.13 a ± 0.020.08 a ± 0.010.07 a ± 0.01
Hardness
(kN/m2)
143.51 a ± 7.17120.41 a ± 15.3276.28 b ± 3.03
Overall acceptance
(score)
-7.43 a ± 0.288.38 b ± 0.19
Values are mean ± SE. Different letters (a,b) in each row indicate significant differences among means by Tukey’s test and t-test (p < 0.05); ND, not detected.
Table 7. Amino acid composition of texture-modified yellowfin sole with the recommended daily requirements and chemical scores for essential amino acids.
Amino AcidsTaste of Amino AcidTexture-Modified
Yellowfin Sole(g/100 g)
Recommended
Daily Requirement 1
(g/70 kg Body Weight)
Chemical Score
for Protein 2
(%)
HistidineBitter0.461.05133.1
IsoleucineBitter0.892.10137.3
LeucineBitter1.774.13134.4
LysineBitter2.033.15195.8
SAA 3Bitter0.951.54191.3
AAA 4Bitter1.552.66175.1
ThreonineSweet1.011.61187.2
TryptophanBitter0.184.2012.6
ValineBitter1.022.73118.0
∑ EAA 5 9.8623.17
AspartateUmami2.19
SerineSweet1.06
GlutamicSweet3.36
ProlineSweet0.87
GlycineSweet1.33
AlanineSweet1.46
ArginineSweet1.46
∑ NAA 6 11.73
EAA/NAA 0.84
(45.67:54.33)
1 According to Protein and Amino Acid Requirements in Human Nutrition (WHO 2007). 2 Chemical score (%) = the essential amino acid value of sample (g/100 g protein)/the same amount of the corresponding amino acid in a standard protein (g/100 g protein). 3 SAA: sulfur amino acids (cysteine, methionine). 4 AAA: aromatic amino acids (tyrosine, phenylalanine). 5 EAA: essential amino acids. 6 NAA: nonessential amino acids.
Table 8. Fatty acid composition of texture-modified yellowfin sole (% of total fatty acid).
Fatty AcidsShorthandTexture-Modified Yellowfin Sole
%
Lauric acidC12:00.1
Myristic acidC14:03.5
Pentadecanoic acidC15:00.7
Palmitic acidC16:010.2
Magaric acidC17:01.5
Stearic acidC18:05.5
Arachidic acidC20:00.3
Heneicosylic acidC21:00.2
Behenic acidC22:00.1
∑ SFA 1 22.1
Myristoleic acidC14:11.5
Pentadecenoic acidC15:10.7
Palmitoleic acidC16:17.8
Magaoleic acidC17:11.5
Oleic acidC18:116.3
Eicosenoic acidC20:13.8
Eicosadienoic acidC20:21.2
Erucic acidC22:10.9
∑ MUFA 2 33.7
Linoleic acidC18:2 n-62.4
γ-Linolenic acidC18:3 n-60.3
Dihomo γ-Linolenic acidC20:3 n-60.3
Arachidonic acidC20:4 n-63.5
∑ n-6 6.5
Linolenic acidC18:3 n-34.5
Eicosatrienoic acidC20:3 n-30.6
Eicosapentaenoic acid (EPA)C20:5 n-322.4
Docosapentaenoic acid (DPA)C22:5 n-32.6
Docosahexaenoic acid (DHA)C22:6 n-37.6
∑ n-3 37.7
∑ PUFA 3 44.2
Total fatty acid (%) 100.0
n-3/n-6 5.8
1 SFA: saturated fatty acid. 2 MUFA: monounsaturated fatty acid. 3 PUFA: polyunsaturated fatty acid.
Table 9. Nutritional values of texture-modified yellowfin sole (100 g).
Parameters Texture-Modified Yellowfin Sole (100 g)Daily Values 1
Amount% DV 2
Ashg1.6--
Caloriescal118.5--
Sodiumg0.28.72.3
Carbohydrateg0.60.2275
Sugarg0.30.650
Dietary fiberg1.55.428
Crude fatg3.74.778
Trans fatg--2
Saturated fatg0.84.020
Cholesterolmg86.928.9300
Crude proteing20.741.450
Vitamin Dμg--20
Potassiumg0.12.14.7
Ironmg1.79.418
Calciumg0.323.11.3
1 According to Nutrition Facts Labeling Requirements, US Food and Drug Administration. 2 The % daily value (DV) is how much a nutrient in a serving of food contributes to a daily diet. Normally, 2000 calories a day is used for general nutrition advice [50].
Table 10. Sensory evaluation changes of texture-modified yellowfin sole stored at different temperatures (−13, −18, and −23 °C) for 150 days.
TemperatureDayAppearanceOdorTasteTextureOverall
Acceptance
−13 °C08.19 a ± 0.118.29 a ± 0.128.19 a ± 0.138.43 a ± 0.138.57 a ± 0.11
308.10 a ± 0.128.00 ab ± 0.157.95 a ± 0.138.29 a ± 0.128.33 ab ± 0.14
608.05 a ± 0.198.00 ab ± 0.177.81 a ± 0.158.24 a ± 0.188.38 ab ± 0.13
907.95 a ± 0.187.90 ab ± 0.147.81 a ± 0.158.14 a ± 0.198.29 ab ± 0.12
1207.90 a ± 0.177.71 ab ± 0.127.76 a ± 0.157.90 a ± 0.188.19 ab ± 0.11
1507.95 a ± 0.157.67 b ± 0.167.76 a ± 0.187.81 a ± 0.187.95 b ± 0.18
−18 °C08.19 a ± 0.118.29 a ± 0.128.19 a ± 0.138.43 a ± 0.138.57 a ± 0.11
308.14 a ± 0.168.14 a ± 0.138.05 a ± 0.158.38 a ± 0.118.43 a ± 0.15
608.19 a ± 0.118.05 a ± 0.138.00 a ± 0.178.29 a ± 0.148.33 a ± 0.13
908.00 a ± 0.177.95 a ± 0.168.00 a ± 0.178.10 a ± 0.178.33 a ± 0.11
1208.00 a ± 0.157.76 a ± 0.147.67 a ± 0.147.95 a ± 0.218.19 a ± 0.15
1508.05 a ± 0.187.71 a ± 0.177.67 a ± 0.177.86 a ± 0.168.14 a ± 0.19
−23 °C08.19 a ± 0.118.29 a ± 0.128.19 a ± 0.138.43 a ± 0.138.57 a ± 0.11
308.19 a ± 0.188.10 a ± 0.178.10 a ± 0.148.29 a ± 0.168.38 ab ± 0.15
608.05 a ± 0.167.95 a ± 0.168.00 a ± 0.188.29 a ± 0.128.19 ab ± 0.15
908.05 a ± 0.157.71 a ± 0.208.05 a ± 0.158.19 a ± 0.168.29 ab ± 0.14
1207.90 a ± 0.177.81 a ± 0.197.81 a ± 0.198.10 a ± 0.228.19 ab ± 0.13
1508.00 a ± 0.147.71 a ± 0.147.57 a ± 0.198.14 a ± 0.168.00 b ± 0.14
Values are mean ± SE. Different letters (a,b) in each column at each temperature indicate significant differences among means by Tukey’s test (p < 0.05).
Table 11. Shelf-life prediction based on accelerated experiment (Shelf-Life Prediction program provided by MFDS).
Determined ParameterResponse OrderTemperature (°C)R2Predicted Shelf-Life (Month)
Total Volatile
Basic Nitrogen
Zero order−130.810216.52
−180.8589
−230.8705
First order−130.762611.30
−180.8363
−230.8490
Publisher’s Note: MDPI stays neutral with regard to jurisdictional claims in published maps and institutional affiliations.

