Article

Optimization of Solvent and Extractive Distillation Sequence Considering Its Integration with Reactor

School of Chemical Engineering and Technology, Xi’an Jiaotong University, Xi’an 710049, China
*
Author to whom correspondence should be addressed.
Processes 2021, 9(3), 565; https://doi.org/10.3390/pr9030565
Submission received: 9 February 2021 / Revised: 19 March 2021 / Accepted: 19 March 2021 / Published: 23 March 2021

Abstract

:
The integration of reaction and extractive distillation system is beneficial for reducing the process cost. A systematic method is proposed to identify the optimal solvent, solvent-to-feed ratio, extractive distillation sequence and reactor operating conditions based on the integration of reactor and extractive distillation. The non-key component matrix method is used to generate the extractive distillation sequences. The proposed method can be used to evaluate different solvents, solvent-to-feed ratios, as well as the extractive distillation sequences; the optimal extractive distillation parameters corresponding to the minimum total annualized cost (TAC) can be identified considering different operating conditions. For the selective hydrogenation of benzene to cyclohexene process, the minimum total annualized cost of unit desired product, 4.01 $·kmol−1, is achieved when the reactor’s inlet temperature is 333 K, solvent N-Formylmorpholine and sequence S2 are employed, and the solvent-to-feed ratio is 4.

1. Introduction

Extractive distillation can be applied to separate mixtures that are difficult to separate by common distillation. Different solvents can be used to increase components’ relative volatility to different levels, and multiple distillation sequences can be used to achieve the separation. A solvent can make separation easier, while its application might lead to an undesired growth of the heat load of the distillation columns. Different solvent-to-feed ratios lead to varied energy consumption. In view of these characteristics, it is important to select the optimal extractive solvent, solvent-to-feed ratio and distillation sequence.
In chemical process, the mixture to be separated is generally the reactor’s effluent or part of it, which changes along reactor operating conditions. Because of this, the total annualized cost (TAC) of the reactor and that of the extractive distillation system changes as well. The identification of optimal extractive solvent, solvent-to-feed ratio and distillation sequence should be based on the integration and optimization of the reactor and the extractive distillation system.
Research on extraction distillation mainly focuses on the choice of solvent and its flowrate. De Figueiredo et al. evaluated the effect of solvent on the separation efficiency and energy consumption [1]. Zhao et al. identified the optimal composition of mixed solvent for a tetrahydrofuran-ethanol-water ternary system [2]. Zhang et al. proposed a method for identifying the optimal solvent on the basis of isovolatility curves [3]. Based on vapor–liquid equilibrium diagrams and infinite dilution factors, Wang et al. selected the feasible solvent to separate the specified mixture and targeted the optimal distillation sequence with minimum TAC [4]. In view of controllability and economy, Wang et al. simulated two possible extractive distillation sequences for separating toluene–methanol–water ternary azeotropic mixture to identify suitable flowrate of solvent [5]. Woo and Kim presented a new procedure to search for new solvent using molecular simulation, and evaluated the procedure’s performance using highly energy-intensive processes [6]. A multi-objective optimization-based molecular design method was developed by Zhou et al. [7] and can be applied to find a list of Pareto-optimal solvents. With the thermodynamic analysis combined with residue curve maps, isovolatility line, univolatility line and material balance lines, Sun et al. determined the optimal solvent and extractive distillation sequence for acetonitrile–ethanol–water ternary azeotropic mixture [8]. In these studies, the optimal solvent and its flowrate were selected based on the isovolatility curves, vapor–liquid equilibrium diagrams, etc., and the effects of the solvent on components’ volatility and energy consumption of extractive distillation columns were studied. However, the synthesis methods of extractive distillation sequences are seldom studied. Most of the studies are enumerated by exhaustive method and compared by simulation calculation.
Multiple distillation sequences can be used to separate the same mixture; their representation and evaluation are the key to optimization. Gutierrez-Guerra et al. designed the conventional and thermally coupled extractive distillation sequences, and minimized their energy consumption [9]. Skvortsova et al. proposed algorithms to generate extractive distillation flowsheets for separating n-component mixtures with single binary azeotrope [10]. Wang et al. proposed a methodology to automatically optimize the distillation sequences including simple columns and dividing wall columns [11]. In this method, the mixed integer nonlinear programming (MINLP) problem is decomposed into integer programming (IP) and nonlinear programming (NLP) problems. Özçelik and Mert developed a genetic-algorithm-based solver to make an exergoeconomic multi-objective optimization in terms of targeting the optimal distillation sequence [12]. Kong and Maravelias proposed a novel approach to synthesize distillation networks with more than one feed source [13], and connections between feed sources and distillation columns are automatically determined according to this approach.
Some studies considered the intersection between reactor and separation system [14,15]. Recker et al. presented an approach for screening alternative reaction-separation flowsheets with the shortcut method first and then using the rigorous optimization method to determine the best one [16]. Bertran et al. presented a framework for synthesizing the processing route with reaction and separation subsystems [17]. In fact, it is more of an exhaustive method to enumerate all processing routes in the superstructure represented by the Processing Step-Interval Network. Kong and Shah proposed a mixed integer linear programming (MILP) optimization model to scan all reaction paths and different distillation sequences [18]. Nezhadfard et al. presented a comprehensive algorithm to generate all feasible flowsheets by reaction/distillation matrix [19], and extended it to identify complicated systems involving multiple reactions [20]. Considering the variation of reactor operating conditions, Lv and Liu presented a matrix method to illustrate splits and distillation sequences and identify the optimal distillation sequences with minimal vapor flowrate [21].
In the open literature, a lot of studies have been done on the extractive distillation and distillation sequences, and some of these studies concentrate on the integration of reaction and separation systems. However, the synthesis of extractive distillation sequences, as well as the integration of reactor and extractive distillation system are rarely reported.
This paper aims to propose a method for identifying the optimal extractive distillation sequence based on the integration of the reactor and the extractive distillation system. Procedures will be developed to analyze the impact of variations in reactor operating conditions, solvent and solvent-to-feed ratio to the cost; and the reactor and extractive distillation systems composed of different sequences will be evaluated based on the TAC. A selective hydrogenation of benzene to cyclohexene process will be studied to illustrate the application of proposed method.

2. Governing Equations

2.1. Identification of Distillation Sequences Based on Non-Key Component

Various distillation sequences with simple columns are feasible to separate an n-component mixture, and their number (Sn) equals [ 2 ( n 1 ) ] ! / [ n ! ( n 1 ) ! ] . They have the same key components, while different non-key components. With the separation of four components as an example, there are five possible distillation sequences, the key components and non-key components corresponding to each sequence are shown in Table 1. This difference of non-key components leads to different energy consumption.
The non-key component matrix, NNn, as shown by Equation (1), can be used to represent all distillation sequences with columns performing sharp split [22]. Rows represent distillation sequences, columns represent components, and each element represents the time that the corresponding component acts as a non-key component.
N N n = 1 2 i S n A 1 [ λ 1 , 1 λ 2 , 1 λ i , 1 λ S n , 1 λ 2 λ 1 , 2 λ 2 , 2 λ i , 2 λ S n , 2 λ j λ 1 , j λ 2 , j λ i , j λ S n , j A n λ 1 , n λ 2 , n λ i , n λ S n , n ]
According to the non-key component matrix and the method proposed by Yin and Liu [22], the matrix representing all distillation sequences can be generated, as shown by Equation (2). In this matrix, rows and columns correspond to distillation sequences and splits, respectively, and each element represents a split point.
D n = 1 2 i S n [ ζ 1 , 1 ζ 1 , 2 ζ 1 , j ζ 1 , n 1 ζ 2 , 1 ζ 2 , 2 ζ 2 , j ζ 2 , n 1 ζ i , 1 ζ i , 2 ζ i , j ζ i , n 1 ζ S n , 1 ζ S n , 2 ζ S n , j ζ S n , n 1 ]
Herein, ζ i , j is the jth split in distillation sequence i.

2.2. Calculation of Relative Volatility

The relative volatility between components Ai and Aj is the ratio of their gas–liquid equilibrium constant, as shown in Equation (3). Under atmospheric or low pressure, the gas can be considered as ideal mixture, and the liquid can be taken as non-ideal, the gas-liquid equilibrium constant can be calculated by Equation (4).
Substituting Equation (4) into Equation (3), Equation (5) is obtained to calculate the relative volatility between components Ai and Aj after the addition of the solvent, ( α i j ) S .
( α i j ) S = K i K j
K i = P i S γ i P
( α i j ) S = P i S P j S γ i γ j
where Ki is the gas–liquid equilibrium constant of component Ai; P denotes pressure. For components Aiand Aj, γ i and γ j are their activity coefficients and can be calculated by modified UNIFAC model [23]; PiS and PjS are their saturated vapor pressures and can be calculated by Equation (6).
lg ( P i S ) = A i + B i T + C i lg ( T ) + D i T + E i T 2
where Ai, Bi, Ci, Di and Ei are Antoine constants, and T is temperature.

2.3. Shortcut Design of Distillation Column

For extractive distillation column, the mixture to be separated and the solvent are inlet separately, and the latter is added to the upper part of the feed stage. The Fenske equation [24], Underwood equations [25] and Gilliland correlation [26,27] can be used to calculate the plate number and reflux ratio of each column, and these equations are shown in Equations (7)–(10).
N min = lg ( ξ l k ξ h k × 1 ξ h k 1 ξ l k ) lg ( α a v g ) S 1
i = 1 n ( α i ) S x F ( i ) ( α i ) S θ = 1 q
i = 1 n ( α i ) S x D ( i ) ( α i ) S θ = R min + 1
N T N min N T + 1 = 0.75 [ 1 ( R R min R + 1 ) 0.5668 ]
Herein, Nmin is the minimum number of theoretical plates; ξ l k represents the recovery of light key component at the top, and ξ h k represents that of heavy key component at the bottom; ( α a v g ) S is the average relative volatility of the light-to-heavy key component, and can be calculated by Equation (11); ( α D ) S , ( α F ) S and ( α B ) S are the relative volatility at the top, feed and bottom. Rmin is the minimum reflux ratio; ( α i ) S is the relative volatility of Ai to the heaviest component at the average temperature of column; x F ( i ) and x D ( i ) are the mole fraction of Ai in feed stream and distillate; θ is the root of Underwood equations. q represents the feed thermal state. NT denotes the number of theoretical plates. R is the reflux ratio and R = 1.1 ~ 2 R min .
( α a v g ) S = [ ( α D ) S ( α F ) S ( α B ) S ] 1 / 3
The position of the feed stage can be estimated by Equation (12) and the Kirkbride equation [28], as shown by Equation (13).
N D + N B = N T
N D N B = [ B D ( x F ( h k ) x F ( l k ) ) ( x B ( l k ) x D ( h k ) ) 2 ] 0.206
where ND and NB are the numbers of theoretical plates above and below the feed, B is the flowrate at the bottom and D at the top. x is the mole fraction, subscripts F, D and B represent the flowrates of the feed, top and bottom products, respectively; subscripts lk and hk represent the light and heavy key components.

3. Effect of Solvent and Distillation Sequence

3.1. Generation of Extractive Distillation Sequence

When solvents are added, extractive distillation columns and solvent recovery columns should be added in each distillation sequence, and the latter usually follows the former. According to this, the extractive distillation sequences can be generated in two steps. In the first step, the separation order of the components (excluding solvent) is generated based on the non-key component matrix introduced in Section 2.1. In the second step, the solvent is added to the column separating the components with smaller relative volatilities, and this column changes to an extractive distillation column; the solvent recovery column is added following this column. The specific steps are as follows:
(1)
Generate non-key component matrix according to the components to be separated, and identify the separation order;
(2)
Identify the extractive distillation columns in each sequence, and add the solvent to the column; accompany a solvent recovery column after each extractive distillation column.
The separation of the three-component mixture is taken as an illustrative example. For each pair of components in this mixture, the relative volatility is quite small, and the addition of a solvent is necessary. With a solvent added, the volatility order of these components might be A1 > A2 > A3.
In the first step, the non-key component matrix is identified, as shown by Equation (14).
N N 3 = 1 2 A 1 [ 0 1 A 2 0 0 A 3 1 0 ]
The mixture needs two extractive distillation columns to separate them, i.e., solvents should be added in each column to form extractive distillation. Finally, two extractive distillation sequences are generated, as shown in Figure 1. In Sequence 1, A1 is separated first, and then A2 and A3, while in Sequence 2, A3 is separated first, and then A1 and A2.
If the solvents used in two extractive distillation columns are the same, there is the possibility of merging two solvent recovery columns into one. In Sequence 1 shown in Figure 1, if the solvent used for separating A2 and A3 is same with that used in the first extractive column, the first solvent recovery column with the red dotted box can be omitted, the bottom product of the first extractive distillation column can be directly sent to the second extractive distillation column, and the solvent recovered by the remaining solvent recovery column is recycled to the first extractive distillation column to be reused. The change of flowsheet is shown by a red line.

3.2. Effect of Solvent to Extractive Distillation

Since solvent can increase the relative volatilities between components, the reflux ratio of an extractive distillation column will decrease after its addition, as well as the energy consumption and cost. Different solvents and their flowrates have different effects on components’ vapor–liquid equilibrium, even the volatility order. This can be used to evaluate solvents’ performance and their flowrates.
The solvent-to-feed ratio (SF) is defined as the ratio of the molar flowrate of solvent (FS) to that of the mixture (FM), as shown by Equation (15).
S F = F S F M
According to Equations (4), (6) and (15), the vapor–liquid equilibrium curves can be plotted to demonstrate the influence of solvent and solvent-to-feed ratio. The acetonitrile–methanol–benzene ternary mixture with three binary azeotropes is taken as an illustrative example; aniline (AN) and chlorobenzene (CB) are candidate solvents. The vapor–liquid equilibrium of pairwise combination among three components are plotted in Figure 2. It can be seen that when solvents are added, the vapor–liquid equilibrium curves are obviously modified, and the binary azeotrope disappears when solvent-to-feed ratio increases. When the solvent is AN, the volatility order from light to heavy is methanol, benzene, acetonitrile; but when CB is used, the order is methanol, acetonitrile, benzene.
To give a more intuitive representation, the variations of relative volatilities along the solvent-to-feed ratio are shown by Figure 3. In the calculation, the molar composition of the mixture to be separated is 40% methanol, 30% benzene and 30% acetonitrile. As can be seen, with solvent AN, the relative volatility between benzene and acetonitrile increases slightly along the solvent-to-feed ratio, while that between methanol and benzene increases first and then decreases; with solvent CB, both relative volatilities increase significantly.
For a given solvent, its flowrate affects both relative volatilities and the load of separation. For different solvents and SFs, the volatility order and the increment of relative volatility are different. In order to identify the optimal extractive distillation sequence and solvent, the intricate influence of solvent to the cost of each extractive distillation sequence needs to be analyzed carefully.

3.3. Effect of Solvent on Extractive Distillation System

The extractive distillation sequence together with feed preheater, reboilers and condensers compose the extractive distillation system. The selection of solvents and extractive distillation sequences have a great impact on its cost. It is worth conducting an in-depth analysis of their effect based on the TAC, which is shown by Equation (16).
TAC = β C C A P + C O P
where CCAP is the capital cost of equipment, β is the annual depreciation coefficient; COP denotes the annualized operating cost of extractive distillation sequence, including the energy cost of the feed heater, reboilers and condensers, and the cost of solvent material.
For each column, the shortcut method shown in Section 2.3 is used to calculate reflux ratio and theoretical plates’ number. To simplify the optimization, the feed can be taken as a saturated liquid. Detailed calculation of the capital and operating costs of the equipment are introduced in the Appendix A. For the separation of a given mixture, the optimal extractive distillation sequence, suitable solvent and solvent-to-feed ratio can be identified by analyzing the effect of solvent and comparing distillation sequences.
For the methanol–acetonitrile–benzene mixture, when the solvent is AN, A1, A2, A3 correspond to methanol, benzene and acetonitrile, respectively; when the solvent is CB, they correspond to methanol, acetonitrile and benzene, respectively. The TACs of all distillation sequences are calculated according to Equation (16) and the detailed calculation procedure introduced in the Appendix A; the variation curves of TAC along the solvent-to-feed ratio are plotted in Figure 4.
Figure 4 shows that the TACs of all distillation sequences decrease first and then increase along the solvent-to-feed ratio. By comparing TACs corresponding to different solvents, solvent-to-feed ratios and extractive distillation sequences, the minimum TAC is achieved when solvent is CB, solvent-to-feed ratio is 2, and Sequence 2 is applied.

4. Optimization of Reaction and Extractive Distillation System

In chemical process, the mixture to be separated by distillation sequence is generally the reactor effluent; reactor operating conditions affect its composition, and further affect the separation system. When the extractive distillation is used, solvent and the distillation sequence affect the system’s cost. To achieve economic optimization, all these factors should be considered together.
For a reactor with m reactions and n components (A1, A2, …, An, arranged in the order of decreasing volatility), all reactions can be expressed as Equation (17).
i = 1 n ν i k A i = 0 ( k = 1 , 2 , , m )
Herein, ν i k represents the stoichiometric coefficient of component Ai in reaction k.
According to reaction kinetics, the reaction rate of each component is a function of a reactor’s temperature and concentration, as shown by Equation (18).
r i = f ( T R , c )
where r i is the reaction rate of Ai, TR is the reactor temperature, and c represents components’ concentration.
The flowrate of the reactor effluents can be calculated according to the mass and energy balance equations. Two ideal reactors, plug flow reactor (PFR) and continuous stirred tank reactor (CSTR), are illustrated. For PFR reactor, its mass and energy balances are shown by Equations (19) and (20), respectively. With these two equations integrated, the composition of the reactor effluent can be obtained.
d F i d V = r i
i = 1 n F i C p i d T R d V = U a ( T a T R ) + w s k = 1 m R k ( Δ H R ) k
where Fi represents the flowrate of Ai; V is the effective volume of reactor; Cpi represents the molar heat capacity of Ai at constant pressure; U is the heat transfer coefficient; a is the effective heat transfer area per unit of reactor volume; Ta is utility temperature for heat exchange of the reactor. w s is the shaft work per unit volume; Rk and (ΔHR)k denote the reaction rate and reaction heat of reaction k.
For CSTR reactor carried out under the isothermal condition, the mass and energy balance are shown by Equations (21) and (22). Similarly, the composition of reactor effluent can be obtained based on these equations.
V F p 0 = X p r p
F 0 C p t ( T R T 0 ) + V k = 1 m R k ( Δ H R ) k = U S ( T a T R ) + w s
where Fp0 is the flowrate of key reactant Ap before the reactions, Xp is the conversion of key reactant Ap, r p is the reaction rate of Ap, F0 is the feed flowrate, S is the heat transfer area, T0 is the feed temperature.
When operating reactor conditions change, the energy consumption and investment of the reactor will change accordingly, as well as the reactor’s effluent. The latter affects the extractive distillation sequence. At the same time, the application of different solvents and solvent-to-feed ratios leads to different relative volatilities, different energy consumptions and different costs of the reaction and extractive distillation system.
The TAC of the reaction and extractive distillation system can be calculated according to Equation (16). The investment cost of the system includes the cost of the reactor, distillation column, feed preheater, reboilers and condensers; the operating cost covers the cost of energy supplied to the equipment and the cost of solvent.
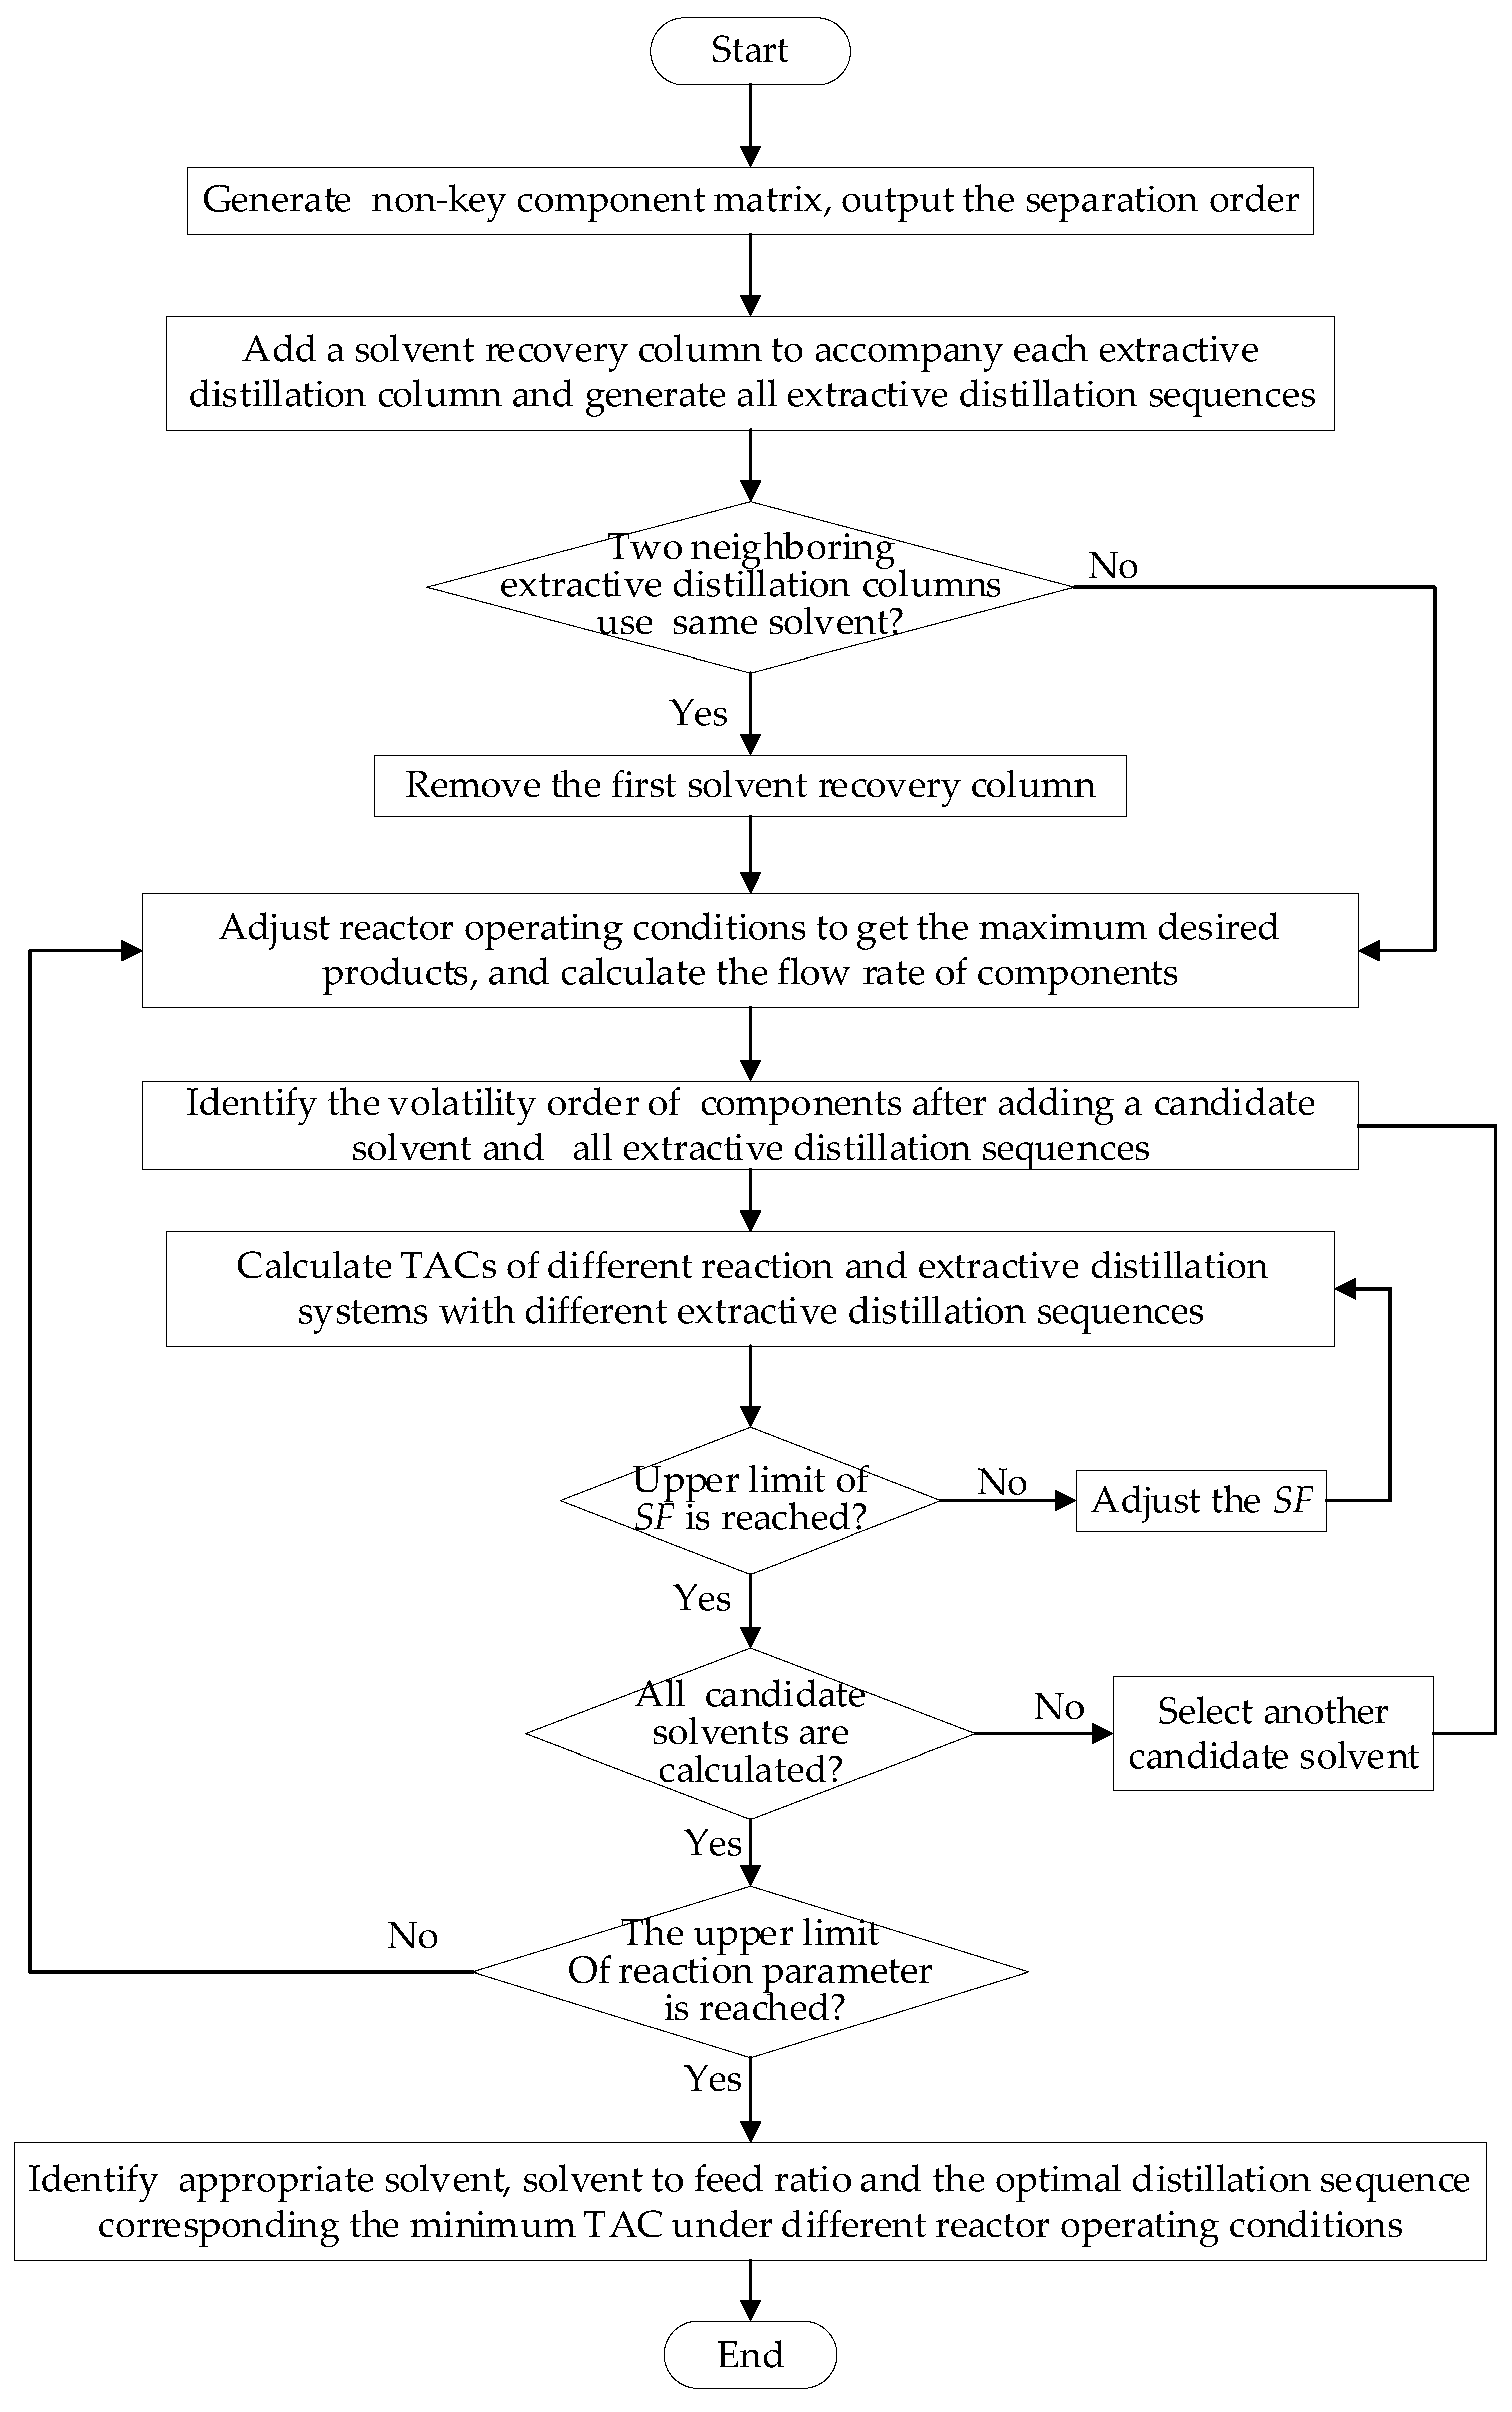
In the integration of the reactor and the extractive distillation system, the separation order of the reactor effluent is identified first based on the non-key component matrix method. Then, the addition of solvent is considered, and the extractive distillation columns and solvent recovery columns are configured to form extractive distillation sequences. For a set of given reactor operating conditions, the composition of reactor effluent with maximum desired product is identified through adjusting other reactor operating conditions; then the volatility orders of components are determined after the solvent is added, and the extractive distillation sequences are generated. The reactor and identified extractive distillation sequences constitute different configurations. The TACs of the systems with different reactor operating conditions, candidate solvents, solvent-to-feed ratios and extractive distillation sequences are calculated, and the optimal system with minimum TAC and the corresponding parameters can be identified. The procedure is shown in Figure 5. The calculation can be implemented by MATLAB R2020b.
It should be noted that the proposed method cannot be applied to the system when the distillation column has side stream or the column performs non-sharp split. The reason is that the non-key component matrix can only be used for the simple column with sharp split. Besides, in the integration of the reactor and the extractive distillation system, the recycling of unreacted reactants is not taken into account. These limitations will be improved in further studies.

5. Case Study

Cyclohexene (HE, C6H10) is generally produced by selective hydrogenation of benzene (BZ, C6H6). The reactions are shown below [29]:
C 6 H 6 + 2 H 2 1 C 6 H 10 C 6 H 10 + H 2 2 C 6 H 12
where C6H12 is cyclohexane (HA).
When catalyst Ru-M-B/ZrO2 is used, the reaction rates under high pressure (>4 MPa) are shown by Equations (23) and (24) [29]. The feed flowrate and the inlet concentration of benzene (BZ) are taken as 33.33 mol·s−1 and 0.078 mol·m−3, respectively.
r B Z = 12.25 exp ( 3924.7 T R ) c B Z
r H A = 7.97 exp ( 2541.5 T R )
where r B Z and r H A are the reaction rates of BZ and HA, c B Z is the concentration of BZ, and TR is the reaction temperature.
At 298 K and 5 MPa, the reaction heat for reaction 1 and 2 are −95,000 J·mol−1 and −120,000 J·mol−1, respectively. To simplify the calculation, the molar heat capacity of each component is taken as constant, and the reaction heat for reaction 1 and 2 in reaction temperature can be obtained by Equations (25) and (26).
( Δ H R ) 1 = 95000 + ( C p H E C P B A 2 C P H 2 ) ( T R 298 )
( Δ H R ) 2 = 120000 + ( C p H A C P H E C P H 2 ) ( T R 298 )
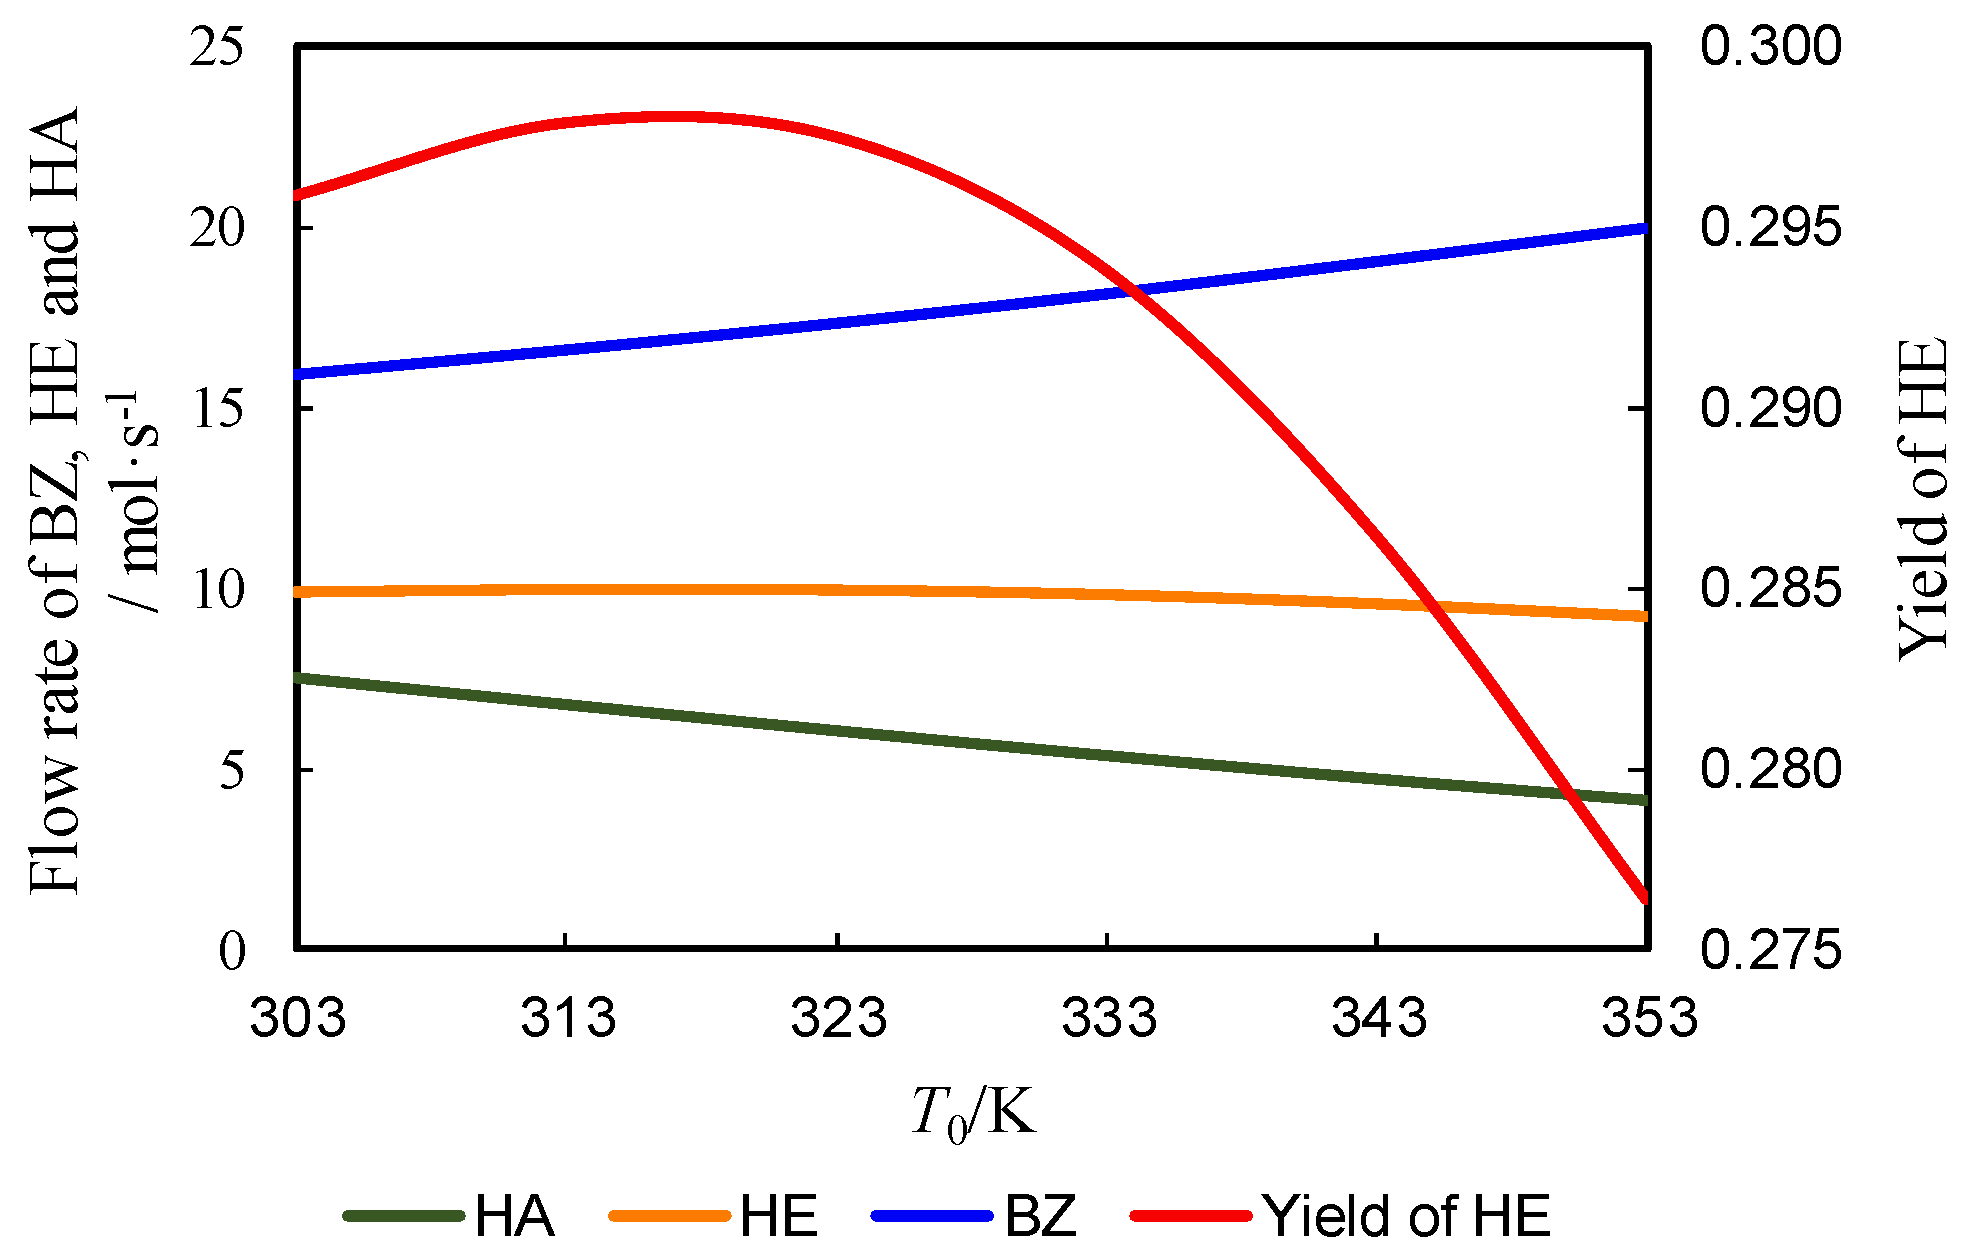
The reaction system can be taken as a quasi-homogeneous system and the reactor can be taken as PFR. On the basis of Equations (23)–(26), the reactor volume can be adjusted to maximize the target product HE; the flowrate of BZ, HE and HA can be calculated according to the mass and energy balances, as shown by Equations (19) and (20) in Section 4. With the reactor outlet temperature keeping to be 473 K and the inlet temperature (T0) changing from 303 K to 353 K in the step of 10 K, the product composition is calculated and plotted in Figure 6.
It can be seen from this figure that, along with the variation of the reactor’s inlet temperature, the flowrate of desired product (HE) decreases slowly, while its yield increases first and then decreases. When the inlet temperature is 313 K, the maximum yield of HE, 0.298, is obtained.
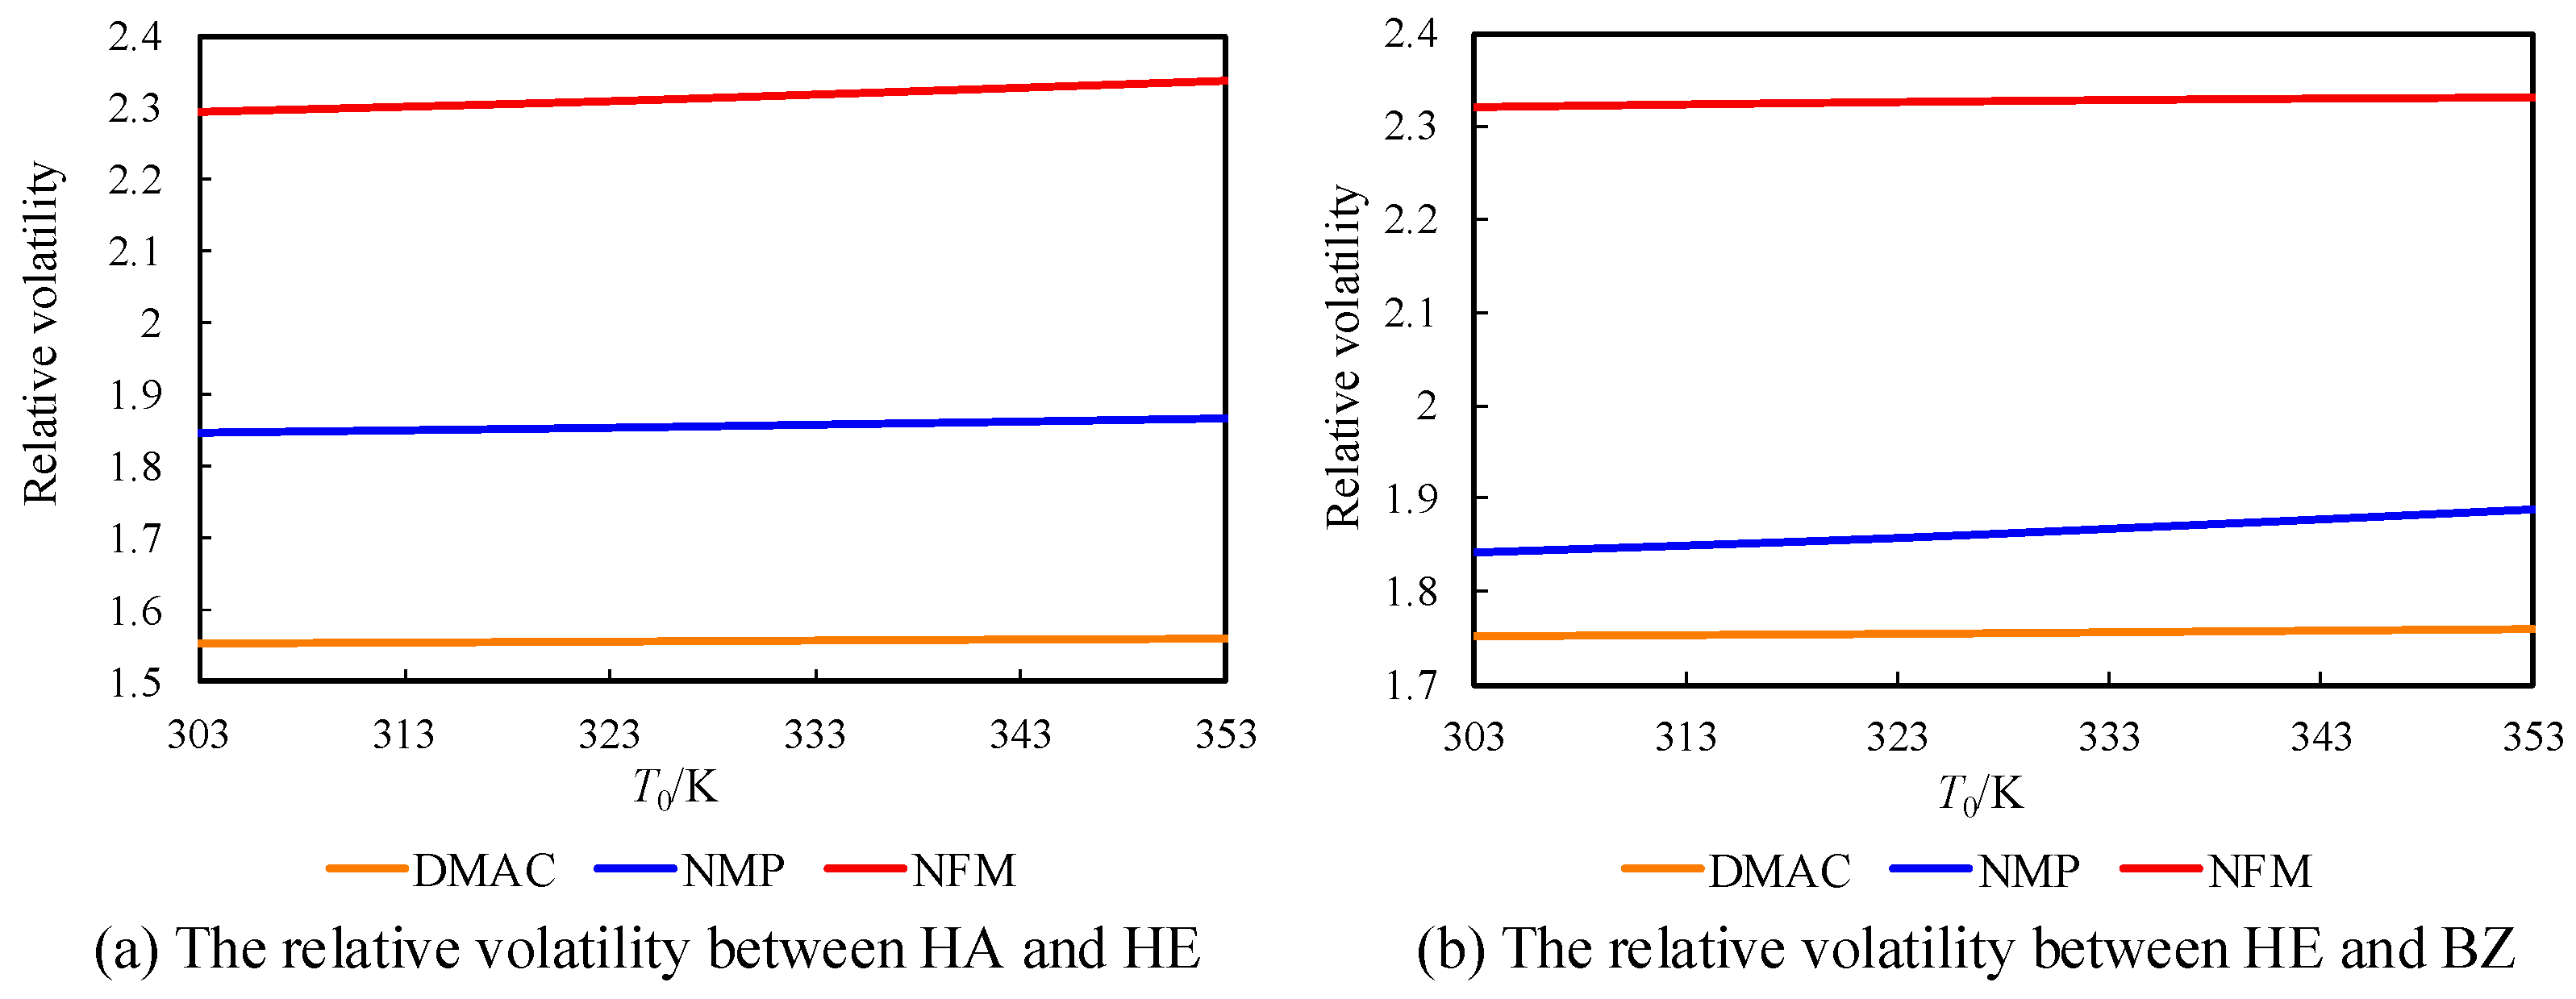
In the reactor’s effluent, HA, HE and BZ form three binary azeotropes, and extractive distillation is used to separate them. In the presence of solvent, the decreasing order of components’ volatility is HA > HE > BZ. The candidate solvents include N,N-Dimethylacetamide (DMAC), N-Methylpyrrolidone (NMP) and N-Formylmorpholine (NFM), and the prices of the three candidate solvents are shown in Table 2. Based on the method introduced in Section 2.2, when different solvents are employed and SF = 3, the relative volatility (α) versus reactor inlet temperature (T0) curve is calculated for every pair of adjacent components and plotted in Figure 7. As the inlet temperature of reactor increases, the relative volatilities between components increase accordingly. When NFM is employed, the relative volatilities are much greater than those when the other two solvents are used. When the solvent DMAC is employed, components have the minimum relative volatility.
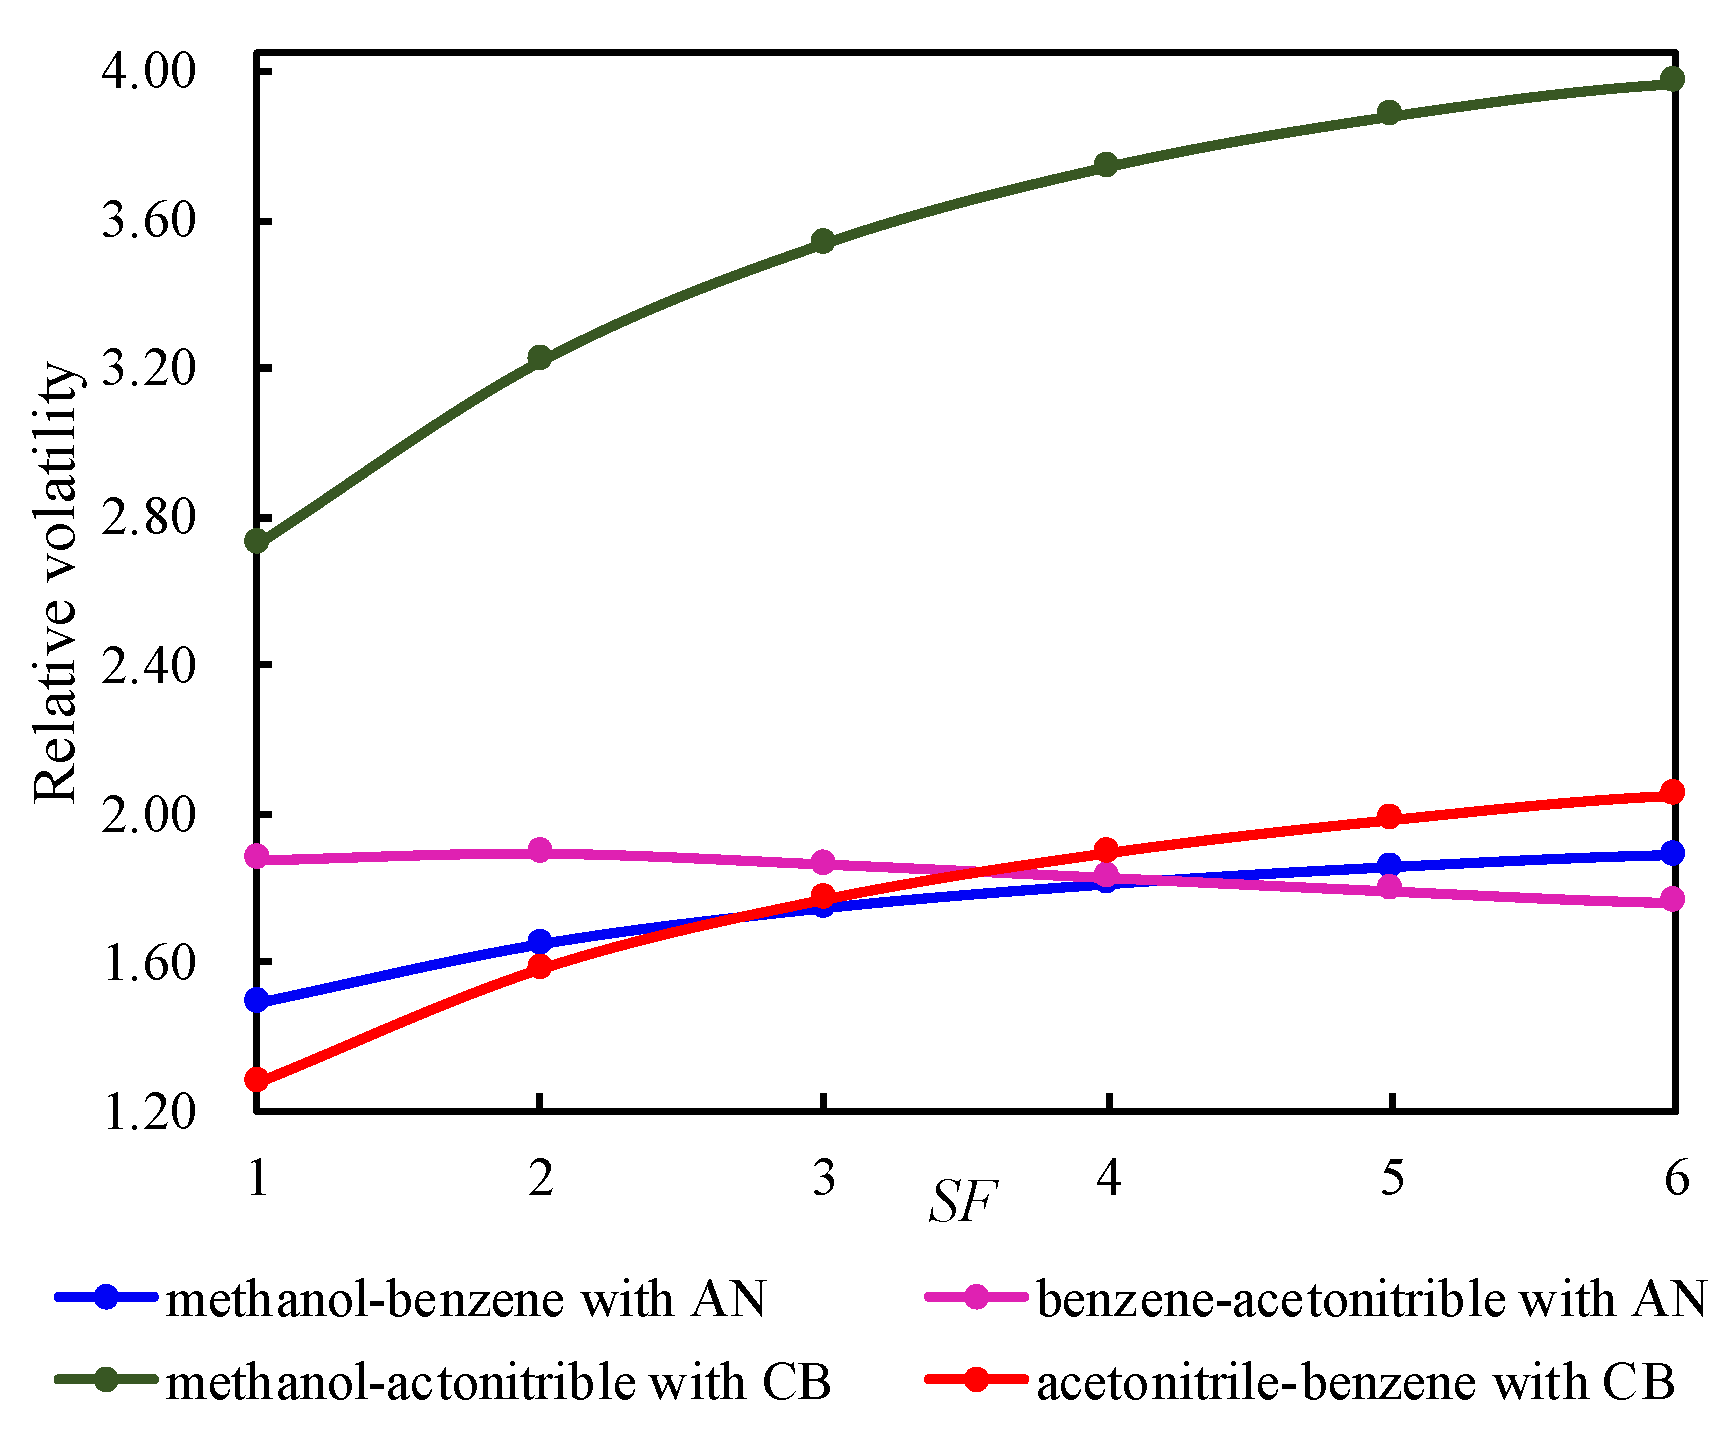
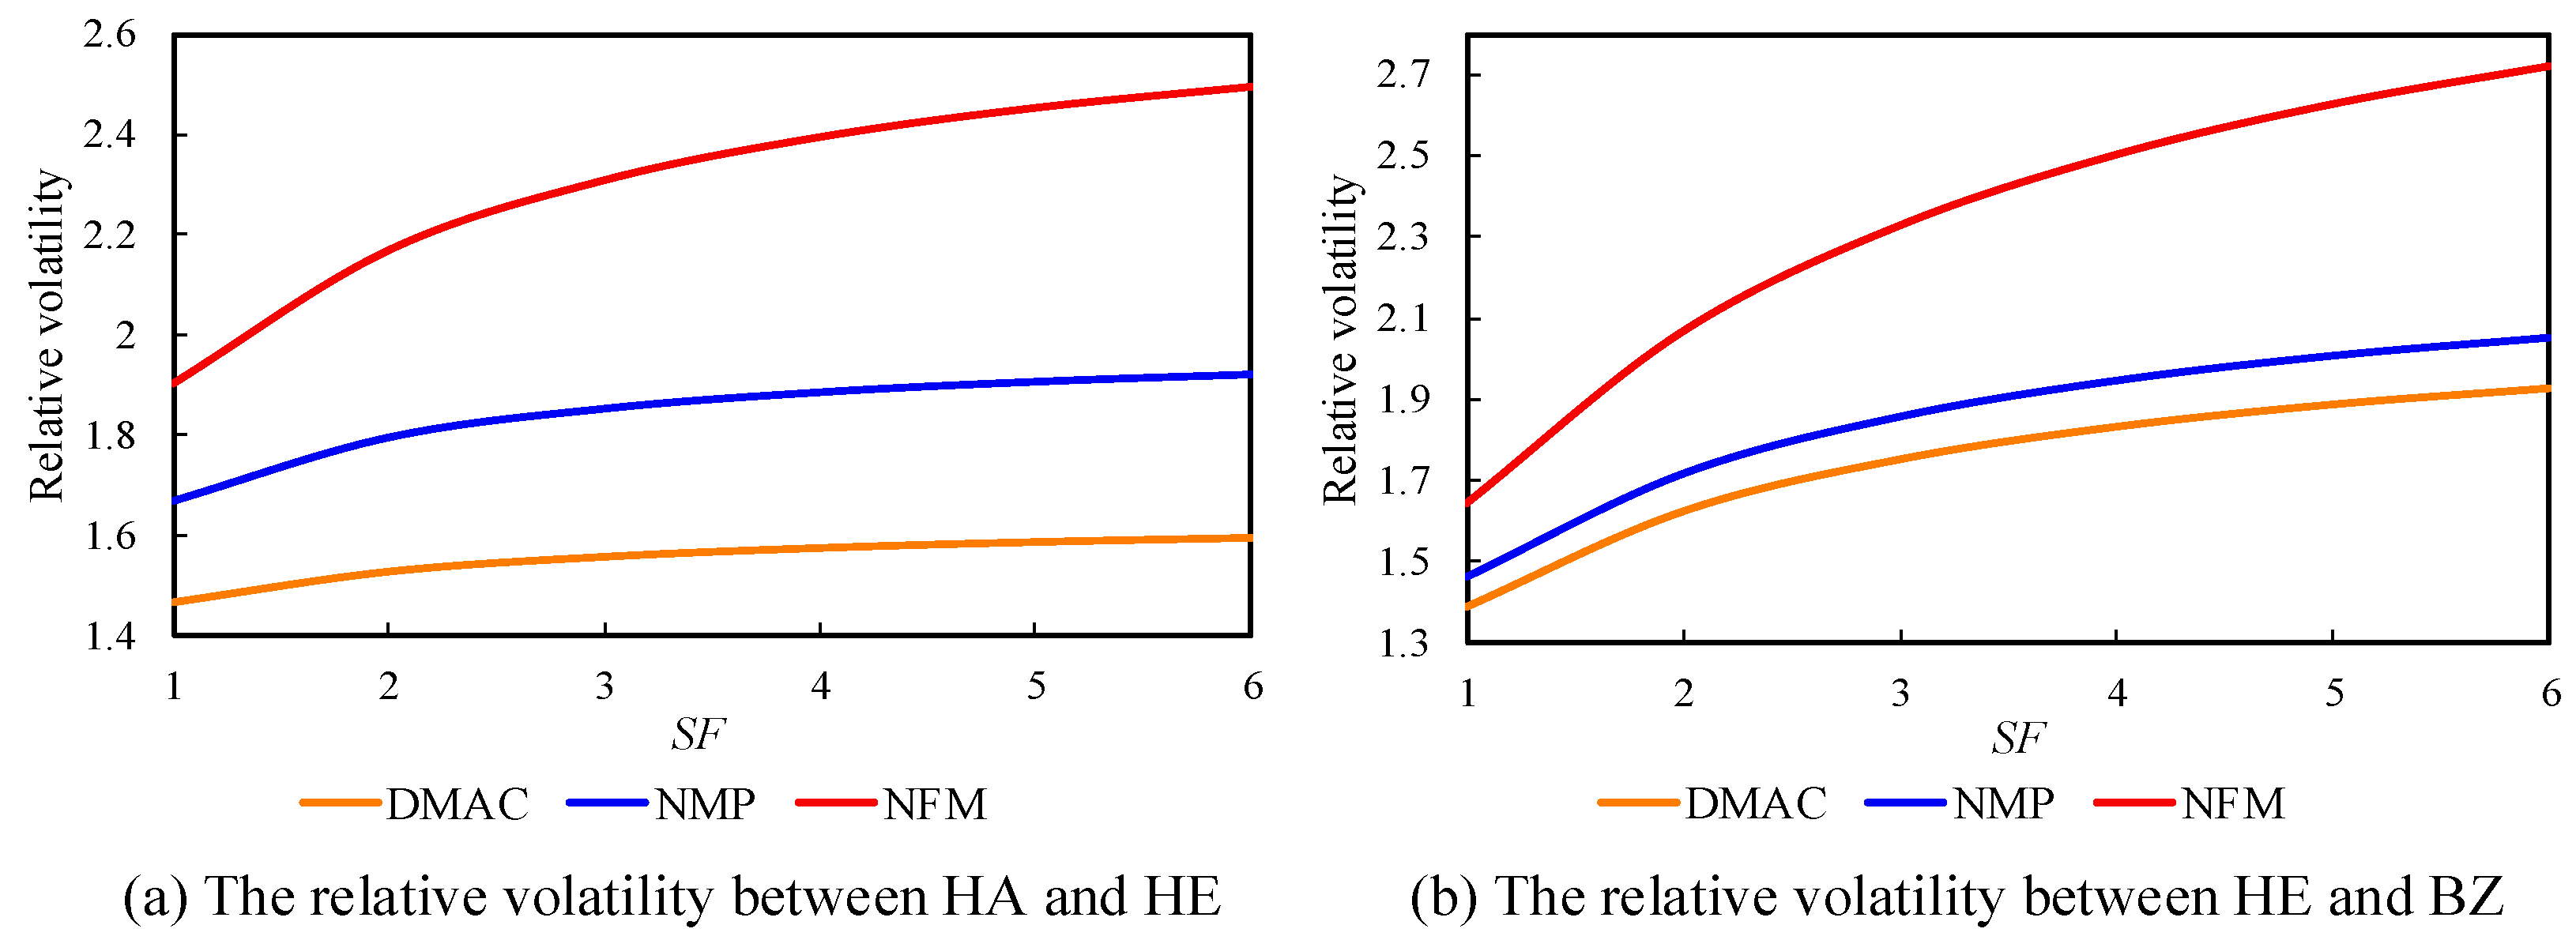
For each solvent, the relative volatility of components changes along the solvent-to-feed ratio. For example, when the feed temperature is 323 K, the molar composition of the reactor effluent is 18% HA, 30% HE and 52% BZ. For three candidate solvents, the variation of relative volatility along the solvent-to-feed ratio is plotted in Figure 8. It can be seen that the relative volatility increases along the solvent-to-feed ratio or flowrate of solvent, no matter which solvent is used. However, increasing solvent’s flowrate will increase duty of separation and cost of solvent, and hence will cause an increment of the system’s TAC.
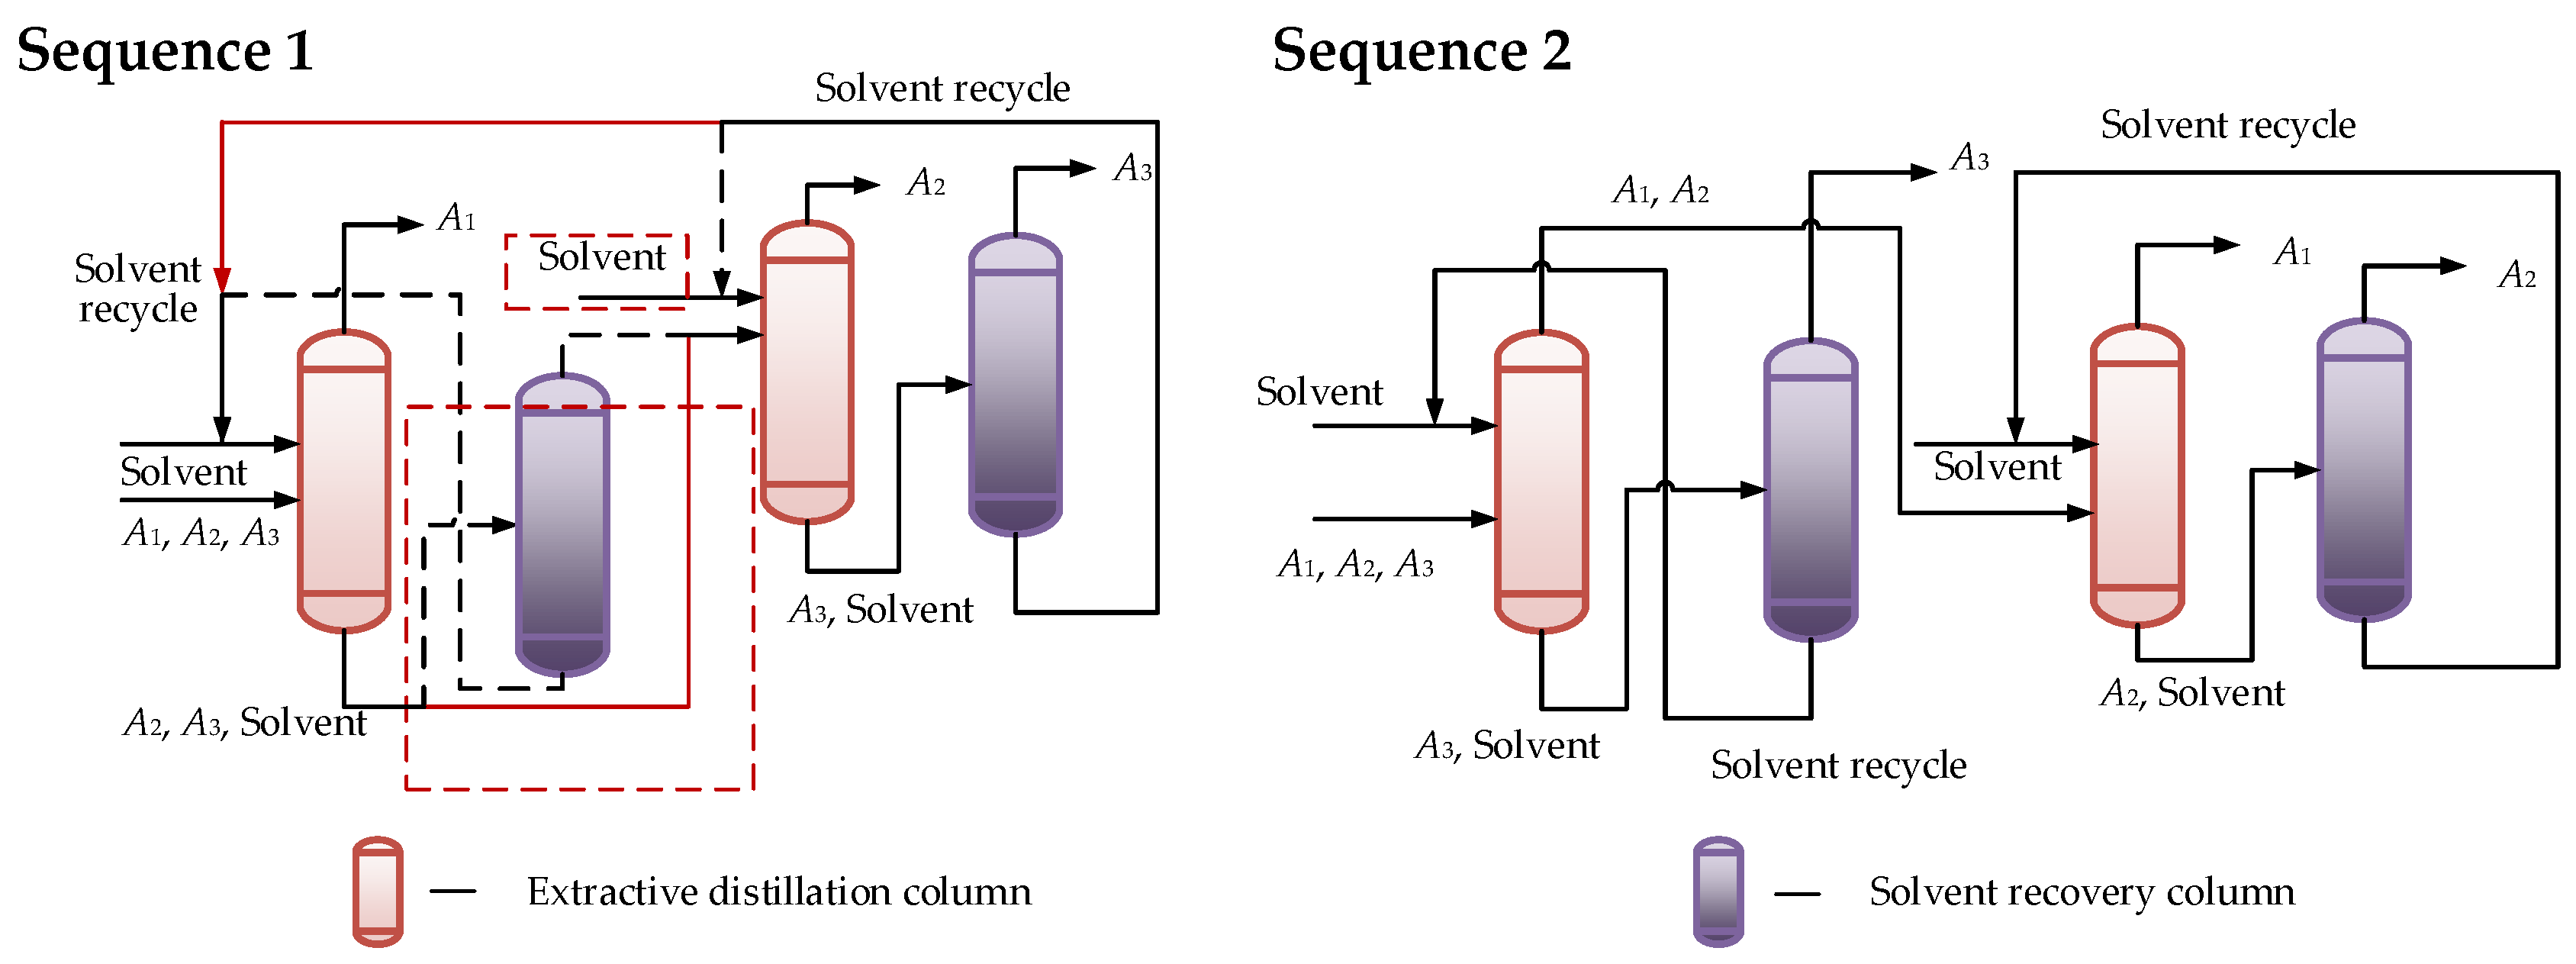
The feed of the extractive distillation system includes three components (excludes the solvent), the corresponding non-key component matrix shown by Equation (14) can represent the possible extractive distillation sequences. Herein, A1, A2, A3 represent HA, HE and BZ, respectively. Based on this and with the solvent considered, sequence 1 (S1) and sequence 2 (S2) are identified, and their flowsheets are the same as those shown in 
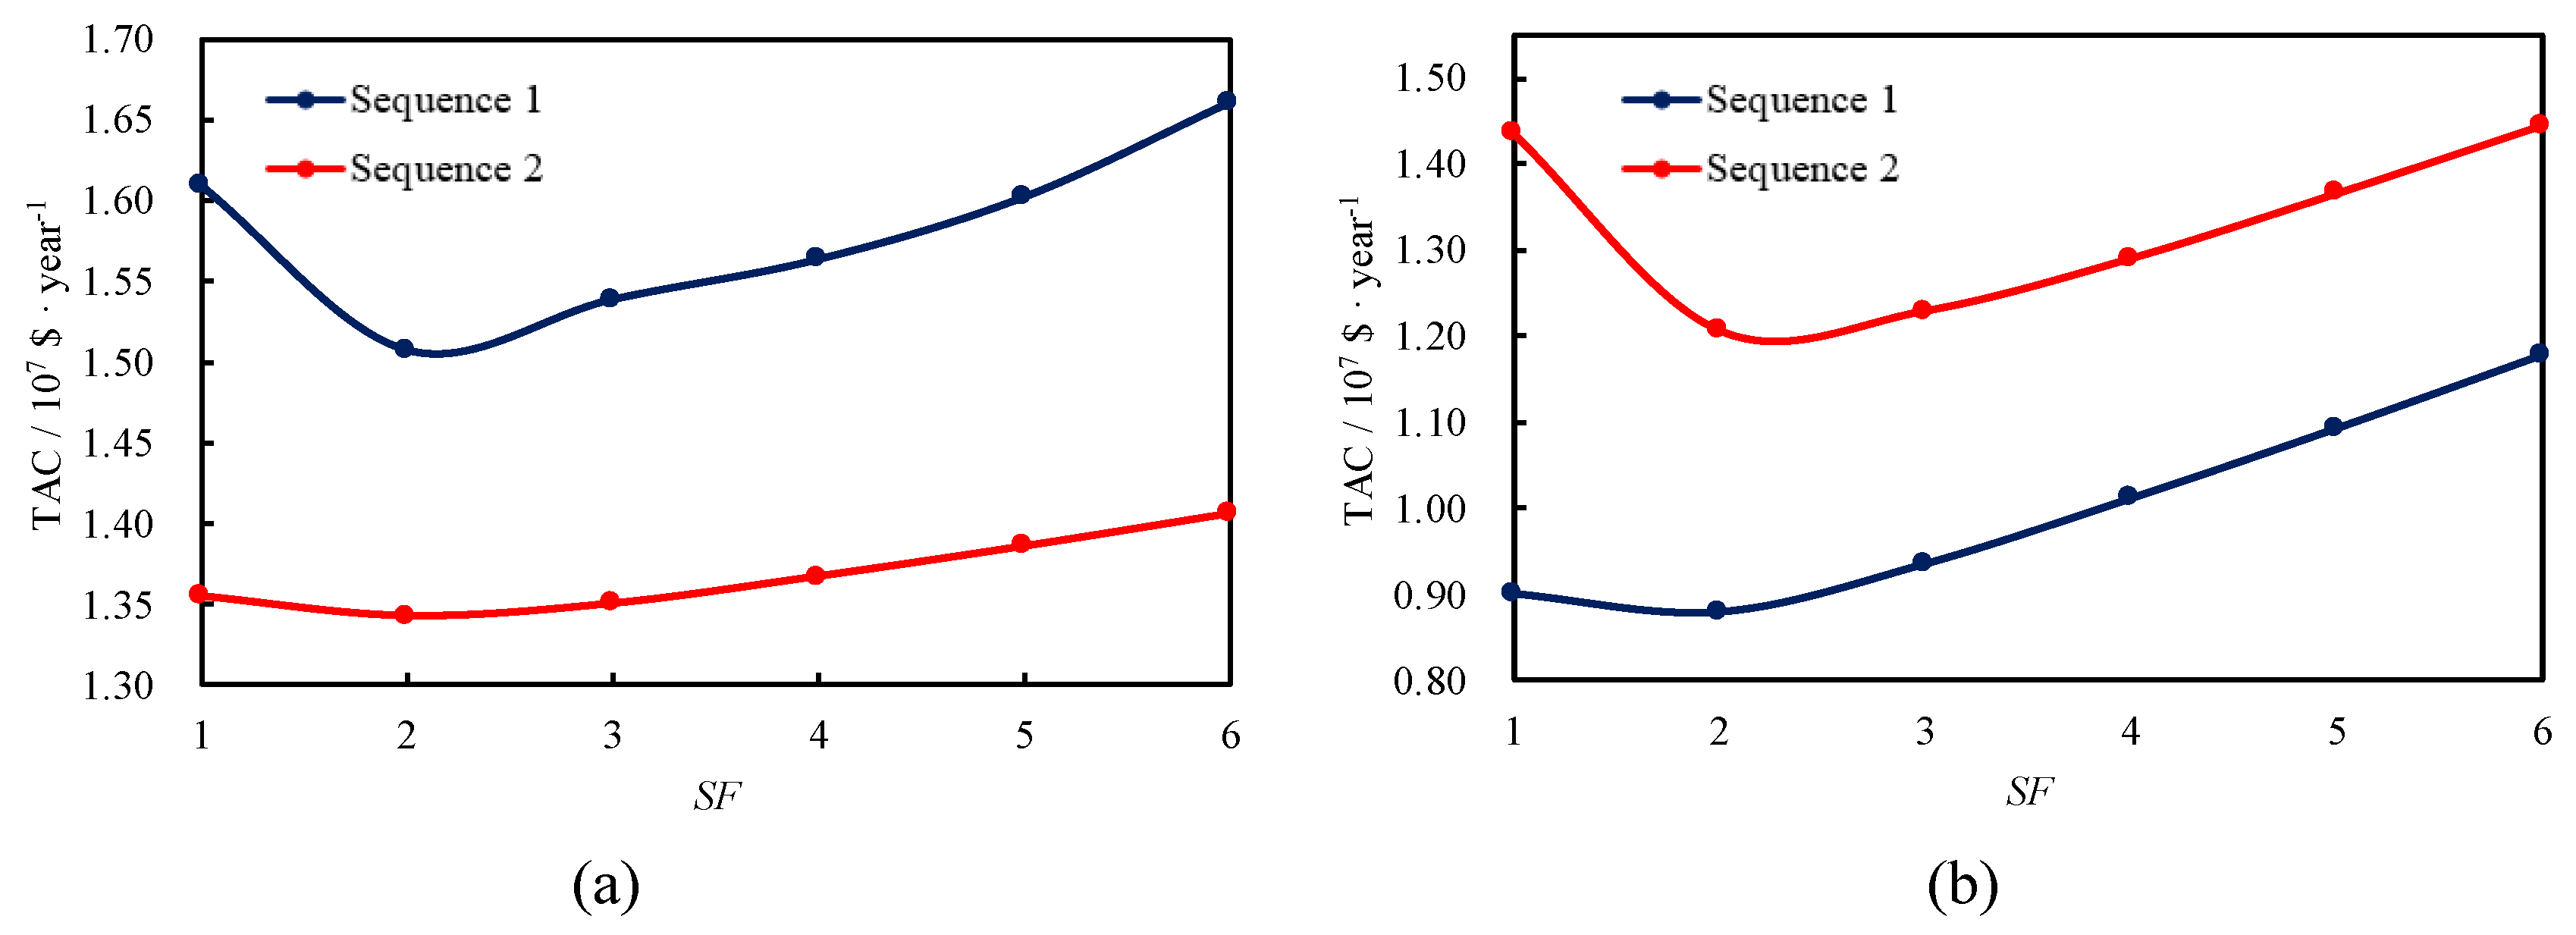
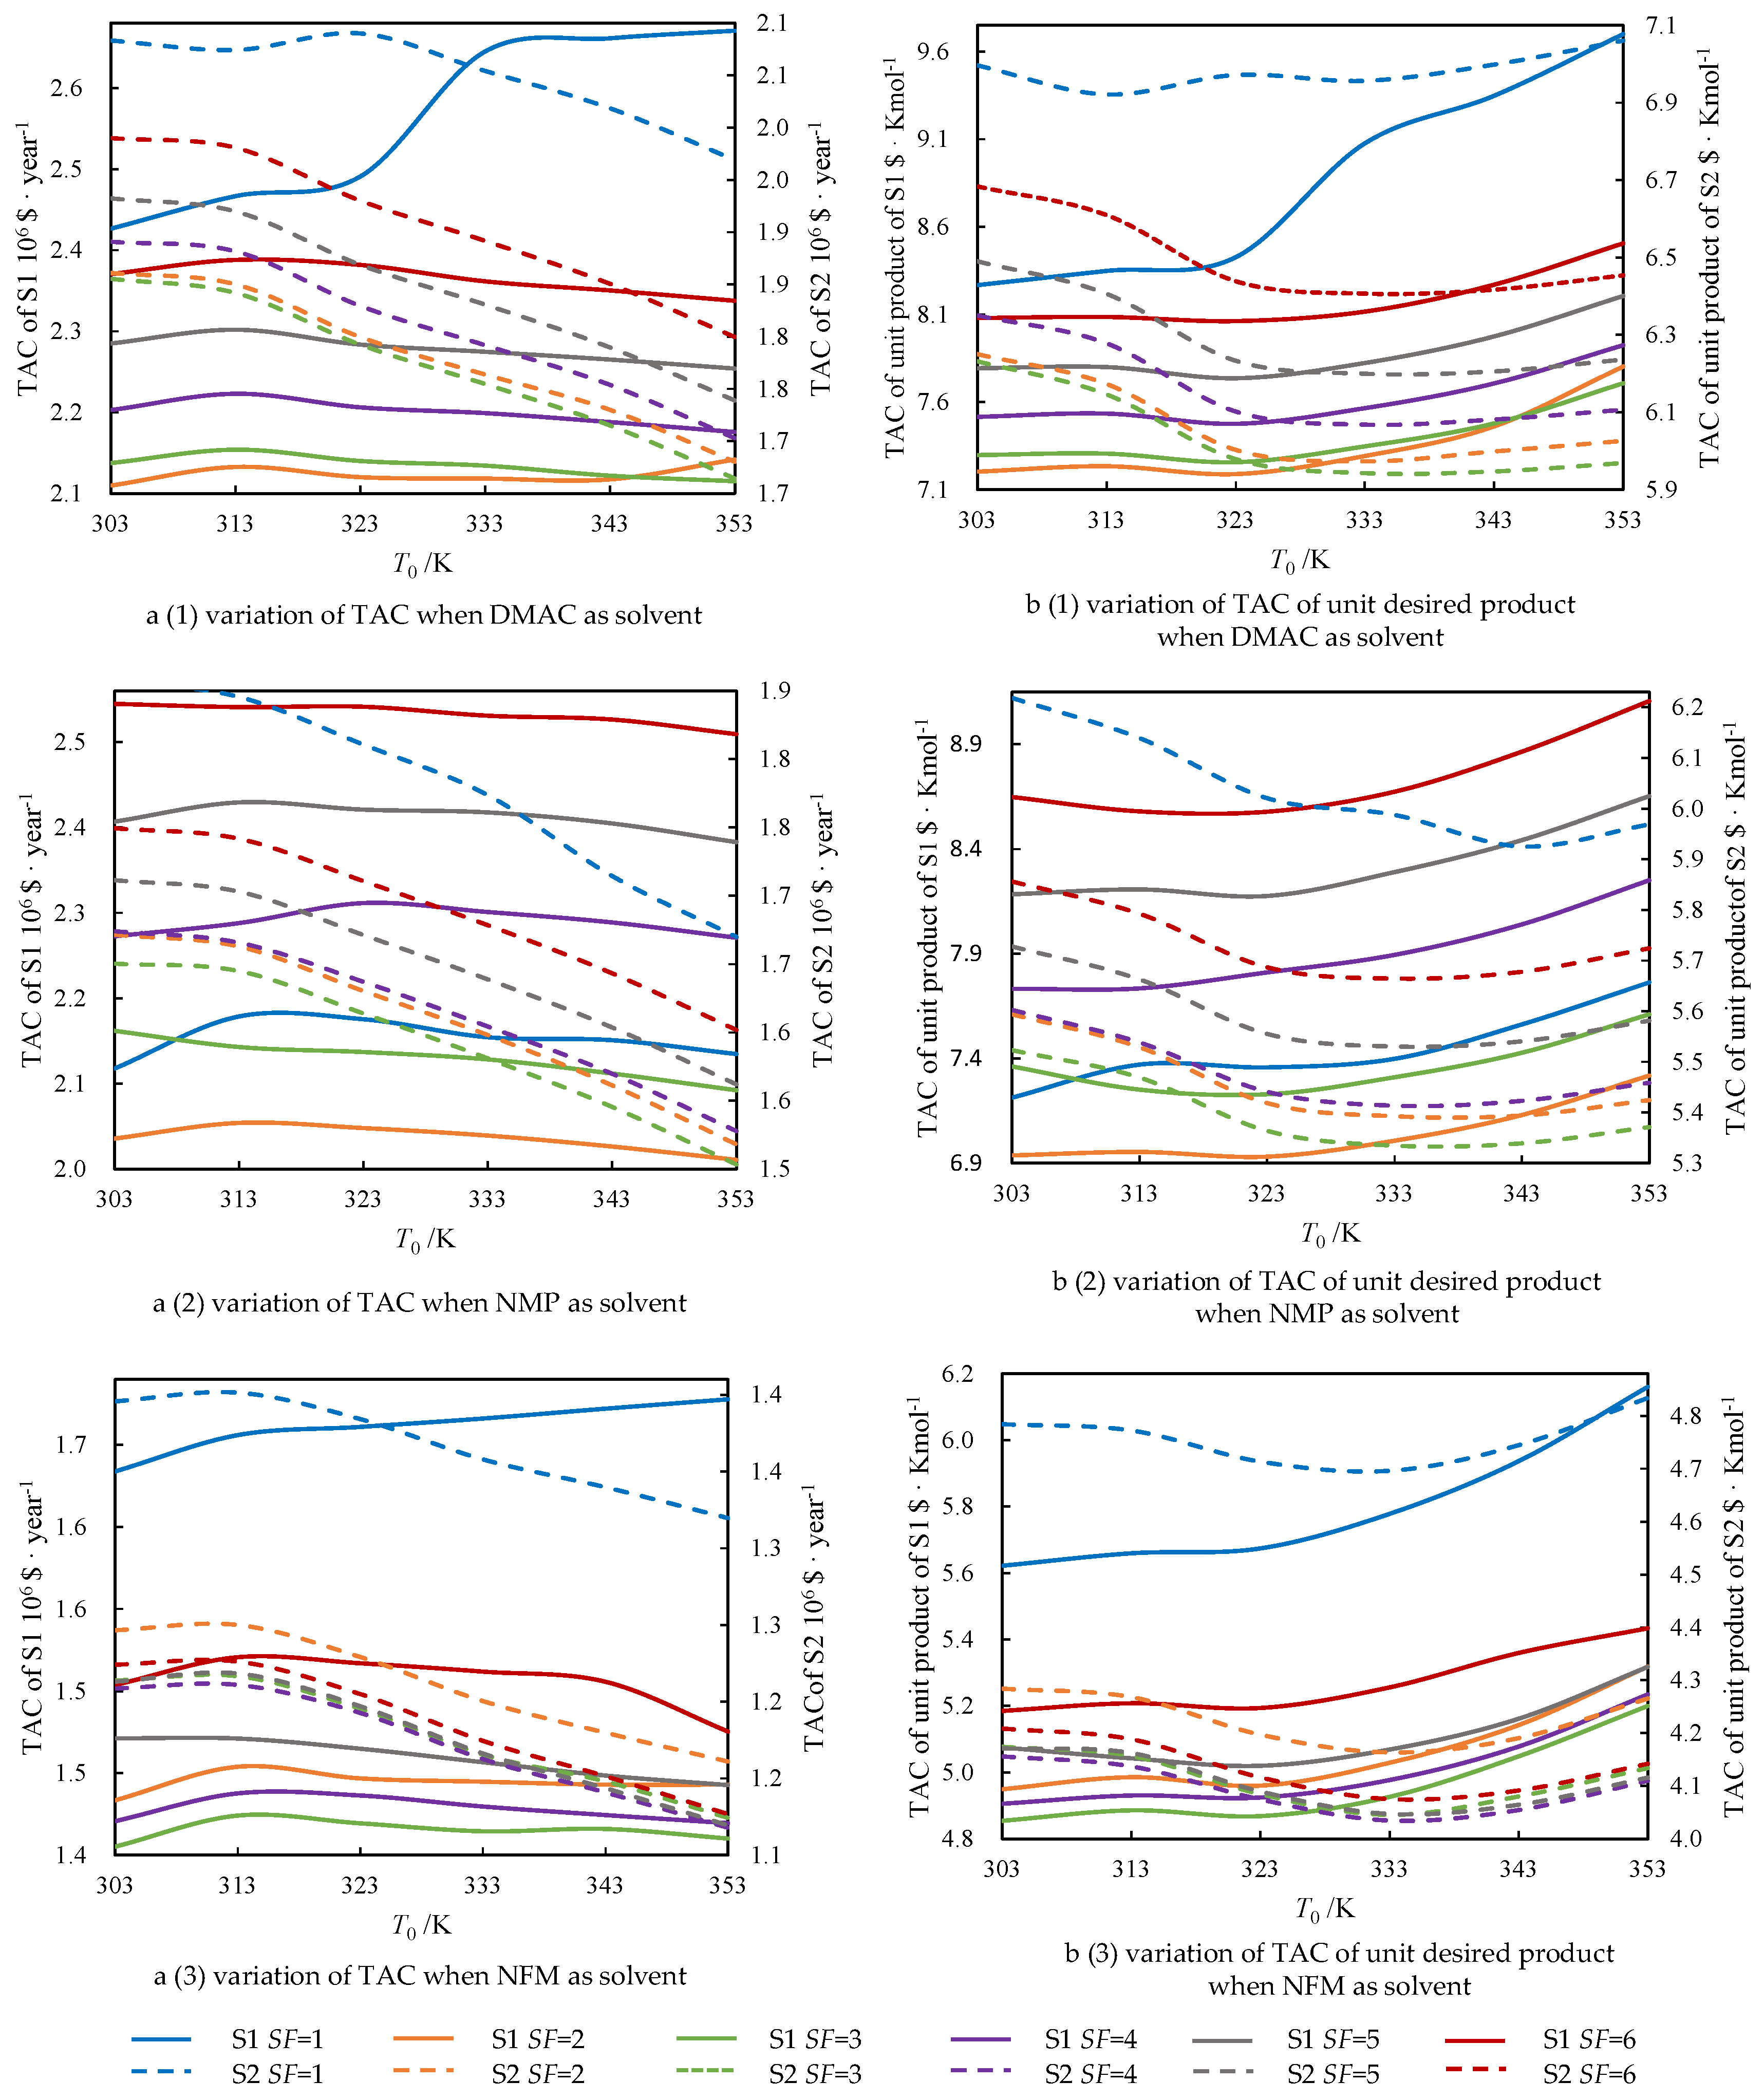
Figure 1. Since the solvents of two extractive distillation columns are the same, the first solvent recovery column of S1 is taken out. For sequences S1 and S2, the TACs and TACs of unit desired product of the system are calculated according to the procedure introduced in Section 4, and are plotted in Figure 9. When the solvent-to-feed ratio increases, the TAC and TAC of unit desired product decrease first and then increase, no matter which solvent is used. For S1, when DMAC is used and the reactor’s inlet temperature lies in 303~343 K, the minimum TAC is obtained when the solvent-to-feed ratio equals 2, while the solvent-to-feed ratio corresponding to the minimum TAC is 3 when the feed inlet into the reactor is at 353 K. When NMP is used, the solvent-to-feed ratio with minimum TAC is equal to 2, while it is 3 when NFM is the solvent. For S2, the solvent-to-feed ratio with minimum TAC is equal to 3 when DMAC and NMP are used at all of the reactor’s inlet temperatures, while it is 4 when NFM is used.
It can be seen that for each sequence, the variation trends of TACs are similar for three candidate solvents, as well as those of TACs of unit desired product. The TAC of S1 is always greater than that of S2, no matter which solvent and solvent-to-feed ratio are used.
To sum up, the minimum TAC of the system can be achieved when the solvent is NFM, the solvent-to-feed ratio is 4 and S2 is applied. As shown in Figure 9b(3), for S2, when the reactor’s inlet temperature increases, the TACs of unit desired product wavelike rise. The minimum TAC of unit desired product, 4.01 $·kmol−1, is achieved when the reaction inlet temperature is 333 K.

6. Conclusions

A method was proposed to integrate the reaction and the extractive distillation, and identify the optimal solvent and solvent-to-feed ratio. The two-step procedure can identify the extractive distillation sequences efficiently and automatically. The variation trend curves of the TAC of the reaction and the extractive distillation system indicate the variation of total cost along key parameters, and can be used to analyze the effect of reactor operating conditions, solvents and solvent-to-feed ratio, and compare different distillation sequences efficiently. The proposed method also can be used to identify the optimal extractive distillation sequence and optimize the reactor operating conditions. Case study shows that for the ethylbenzene process, the minimum TAC of unit desired product, 4.01 $·kmol−1, is achieved when the reaction inlet temperature is 333 K, solvent NFM and sequence S2 are employed, and the solvent-to-feed ratio is 4.
In this work, the reactor’s inlet temperature and solvent-to-feed ratio were analyzed and optimized. Other reactor conditions, such as reactant concentration, operation pressure, reflux ratio in extractive distillation system and the recycle of unreacted reactant also affect the reaction and extractive distillation system. Besides, columns with side stream or those performing non-sharp split can also be used in the extractive distillation. The proposed method will be extended to take these factors into consideration.

Author Contributions

Conceptualization, C.Y. and G.L.; methodology, C.Y. and G.L.; software, C.Y.; writing—original draft preparation, C.Y.; writing—review and editing, G.L. All authors have read and agreed to the published version of the manuscript.

Funding

This research was funded by the National key research and development program of China (2017YFB0602603) and the National Natural Science Foundation of China (22078259).

Data Availability Statement

Not applicable.

Conflicts of Interest

The authors declare no conflict of interest.

Nomenclature

aEffective heat transfer area per unit of reactor volume, m−1
AexcHeat transfer area of heat exchanger, m2
Ai, Bi, Ci, Di, Ei Antoine constants
BFlowrate at the bottom, mol·s−1
cComponents’ concentration, kmol·L−1
c B Z Concentration of BZ, kmol·L−1
CCAPCapital cost, $
C C A P , 1968 , C C A P , 2019 Capital costs in 1968 and 2019, $
Ccol, Creact, CexcCapital costs of the column, reactor and heat exchanger, $
C I 1968 , C I 2019 Chemical Engineering Plant Cost Indexes in 1968 and 2019
COPAnnualized operating cost of equipment, $·year−1
CpiMolar heat capacity of Ai at constant pressure, J·mol−1·K−1
CUPrice of utility, $·GJ−1
DFlowrate of the top product, mol·s−1
Dc, DrDiameters of the distillation column and reactor, m
DnDistillation sequence matrix of n-component mixture
F0Feed flowrate, mol·s−1
Fc1, Fc2, Fc3Correction factors for the reactor and distillation column, column plate and heat exchanger
FiFlowrate of Ai, mol·s−1
Fm1, Fm2Correction factors associated with material and plate material
FM, FSMolar flowrate of the mixture to be separated and solvent, mol·s−1
Fp0Flowrate of key reactant Ap before reactions, mol·s−1
Fp, Fs, FtCorrection factors associated with pressure, plate spacing and plate type
Hc, HrHeights of the distillation column and reactor, m
HTPlate spacing, m
KiGas–liquid equilibrium constant of component Ai
NNumber of components in reactor effluent
NB, NDNumbers of theoretical plates below and above the feed
NminMinimum number of theoretical plates
NNnNon-key component matrix of n-component mixture
NpNumber of manholes
NtNumber of theoretical plates of distillation column
PSystem pressure, Pa
PiSSaturated vapor pressure, Pa
qFeed thermal state
QexcDuty of heat exchanger, J·s−1
rBZ, rHA, ri, rpReaction rates of BZ, HA, Ai and Ap, mol·m−3·s−1
RReflux ratio
RkReaction rate of reaction k, mol·m−3·s−1
RminMinimum reflux ratio
SHeat transfer area, m2
SFSolvent-to-feed ratio
SnTotal number of possible distillation sequences for n-component mixture
T0, Ta, TR, TDTemperature of reactor feed, utility for heat exchange of the reactor, reaction and distillate, K
t O P Annual operating time, h·year−1
UHeat transfer coefficient, J·m−2·s−1·K−1
VEffective volume of reactor, m3
Vv Average vapor velocity in column, m·s−1
w s Shaft work per unit volume, J·m−3·s−1
xMole fraction
XpConversion of key reactant Ap
HR)k Reaction heat of reaction k, J·mol−1
ΔT Temperature difference, K
αRelative volatility
β Annual depreciation coefficient of equipment
γ i Activity coefficient of component Ai
η Plate efficiency
λ i , j Times of Aj as a non-key component in distillation sequence i
ν i , k Stoichiometric coefficient of Ai in reaction k
θ Root of Underwood equation
ξ Recovery of the key components in distillation column
ζ i , j jth split in distillation sequence i
Subscripts
BBottom of distillation column
DDistillate of distillation column
FFeed of distillation column
iComponent Ai
hkHeavy key component
lkLight key component

Appendix A

The Totally Annualized Cost

The totally annualized cost (TAC) includes the annualized capital costs of the equipment and the annualized operating costs.
The capital cost of the reactor Creact is calculated by Equation (A1) [30].
C r e a c t = 937.6 D r 1.066 H r 0.802 ( 2.18 + 2 F c 1 )
where Dr and Hr are the diameter and the height of the reactor, Fc1 is the correction factor for the reactor and distillation column, F c 1 = F p F m 1 . Fp and Fm1 are the correction factors associated with pressure and material, as shown in Table A1.
Table A1. Correction factors for reactor and distillation column.
Pressure/MPa0.340.691.382.072.763.454.144.835.526.216.89
Fp1.001.051.151.201.351.451.601.801.902.302.50
Shell materialCarbon steelStainless
Fm11.003.67
The capital cost of the distillation column Ccol is calculated by Equation (A2).
C c o l = 937.6 D c 1.066 H c 0.802 ( 2.18 + 2 F c 1 ) + 97 . 2 D c 1.55 H c F c 2
where Dc and Hc are the diameter and the height of the distillation column, and calculated by Equations (A3) and (A4) [31]. Fc2 is the correction factor for column plate, F c 2 = F s + F t + F m 2 , Fs, Ft and Fm2 are the correction factor associated with plate spacing, type and plate material, as shown by Table A2.
D C = [ 22.4 ( 4 π V v ) ( D 1000 ) ( R + 1 ) ( T D 273 ) ( 1 P ) ] 1 / 2
H C = ( N t η N p 1 ) H T + 0.6 N p + 4.27
where TD is the temperature of distillate; HT is the plate spacing, is the plate efficiency, Np is the number of manholes, Vv is the average vapor velocity in the column.
Table A2. Correction factors for column plates.
yPlate spacing/mmAbove 450300~4500~300
Fs1.01.42.2
Plate typeGridPlateSieveValveBubble cap
Ft0000.41.8
Plate materialCarbon steelStainless
Fm20.01.7
The capital cost of the heat exchanger, Cexc, is calculated by Equation (A5) [30]. Aexc is its heat transfer area and calculated by Equation (A6), Qexc is the heat duty of the heat exchanger and calculated by Equation (A7).
C e x c = 474.7 A e x c 0.65 ( 2.29 + 2 F c 3 )
A e x c = Q e x c U Δ T
Q e x c = F e x c Δ H v
where Fc3 is the correction factor for heat exchanger, it is associated with type, as shown in Table A3 [30]; U is the heat transfer coefficient, and is set as 1500 J·m−2·s−1·K−1; ΔT is the temperature difference; Fexc is the flowrate of the stream being cooled or heated, and the ΔHv is the latent heat of stream.
Table A3. Correction factors for heat exchangers.
Heat Exchanger TypeKettle, ReboilerFloating HeadU-TubeFixed-Tube Sheet
Fc31.351.000.850.80
The capital cost introduced above is calculated based on that in 1968, and it can be updated according to the Chemical Engineering Plant Cost Index (CI) [32] by Equation (A8).
C C A P , 2019 = C I 2019 C I 1968 C C A P , 1968
where C C A P , 2019 is the capital cost in 2019, and C C A P , 1968 is the capital cost in 1968, C I 2019 and C I 1968 are the Chemical Engineering Plant Cost Index in 2019 and 1968, and their values are 113.7 and 607.5, respectively.
The annualized operating cost is calculated by Equation (A9). In this equation, t O P denotes the annual operating time and is set as 8500 h; and CU represent the prices of utilities, and is shown in Table A4.
C O P = t O P ( C U Q e x c ) + 0.02 C e x c
Table A4. Data of Utilities.
UtilitiesTemperature/KPrice/$·GJ−1
Cooling water3050.143
Low-pressure steam4337.72
Medium-pressure steam4578.22
High-pressure steam5379.88

References

  1. De Figueiredo, M.F.; Brito, K.D.; Ramos, W.B.; Sales Vasconcelos, L.G.; Brito, R.P. Effect of Solvent Content on the Separation and the Energy Consumption of Extractive Distillation Columns. Chem. Eng. Commun. 2015, 202, 1191–1199. [Google Scholar] [CrossRef]
  2. Zhao, Y.T.; Zhao, T.R.; Jia, H.; Li, X.; Zhu, Z.Y.; Wang, Y.L. Optimization of the composition of mixed entrainer for economic extractive distillation process in view of the separation of tetrahydrofuran/ethanol/water ternary azeotrope. J. Chem. Technol. Biot. 2017, 92, 2433–2444. [Google Scholar] [CrossRef]
  3. Zhang, X.; Li, X.; Li, G.X.; Zhu, Z.Y.; Wang, Y.L.; Xu, D.M. Determination of an optimum entrainer for extractive distillation based on an isovolatility curve at different pressures. Sep. Purif. Technol. 2018, 201, 79–95. [Google Scholar] [CrossRef]
  4. Wang, C.; Wang, C.; Guang, C.; Zhang, Z.S. Comparison of extractive distillation separation sequences for acetonitrile/methanol/benzene multi-azeotropic mixtures. J. Chem. Technol. Biot. 2018, 93, 3302–3316. [Google Scholar] [CrossRef]
  5. Wang, Y.; Zhang, X.; Liu, X.B.; Bai, W.T.; Zhu, Z.Y.; Wang, Y.L.; Gao, J. Control of extractive distillation process for separating heterogenerous ternary azeotropic mixture via adjusting the solvent content. Sep. Purif. Technol. 2018, 191, 8–26. [Google Scholar] [CrossRef]
  6. Woo, H.C.; Kim, Y.H. Solvent selection for extractive distillation using molecular simulation. AIChE J. 2019, 65, e16665. [Google Scholar] [CrossRef]
  7. Zhou, T.; Song, Z.; Zhang, X.; Gani, R.; Sundmacher, K. Optimal solvent design for extractive distillation processes: A multiobjective optimization-based hierarchical framework. Ind. Eng. Chem. Res. 2019, 58, 5777–5786. [Google Scholar] [CrossRef]
  8. Sun, S.R.; Chun, W.; Yang, A.; Shen, W.F.; Cui, P.Z.; Ren, J.Z. The separation of ternary azeotropic mixture: Thermodynamic insight and improved multi-objective optimization. Energy 2020, 206, 118117. [Google Scholar] [CrossRef]
  9. Gutierrez-Guerra, R.; Segovia-Hernandez, J.G.; Hernandez, S.; Bonilla-Petriciolet, A.; Hernandez, H. Design and Optimization of Thermally Coupled Extractive Distillation Sequences. In Proceedings of the 19th European Symposium on Computer Aided Process Engineering, Cracow, Poland, 14–17 June 2009; pp. 189–194. [Google Scholar]
  10. Skvortsova, M.I.; Timoshenko, A.V.; Rudakov, D.G. Synthesis of partially thermally coupled extractive distillation flowsheets. Theor. Found. Chem. Eng. 2011, 45, 842–857. [Google Scholar] [CrossRef]
  11. Wang, X.; Du, Z.Z.; Zhang, Y.L.; Wang, J.D.; Wang, J.H.; Sun, W. Optimization of distillation sequences with nonsharp separation columns. Processes 2019, 7, 323. [Google Scholar] [CrossRef]
  12. Özçelik, Y.; Mert, S.O. Exergoeconomic Distillation Sequencing by Multi-objective Optimization through a Hybrid Genetic Algorithm. Chem. Biochem. Eng. Q. 2016, 30, 305–315. [Google Scholar] [CrossRef]
  13. Kong, L.X.; Maravelias, C.T. Expanding the scope of distillation network synthesis using superstructure-based methods. Comput. Chem. Eng. 2020, 133, 106650. [Google Scholar] [CrossRef]
  14. Davarpanah, A.; Zarei, M.; Valizadeh, K.; Mirshekari, B. CFD design and simulation of ethylene dichloride (EDC) thermal cracking reactor. Energ. Source. Part. A 2019, 41, 1573–1587. [Google Scholar] [CrossRef]
  15. Valizadeh, K.; Davarpanah, A. Design and construction of a micro-photo bioreactor in order to dairy wastewater treatment by micro-algae: Parametric study. Energ. Source. Part A 2020, 42, 611–624. [Google Scholar] [CrossRef]
  16. Recker, S.; Skiborowski, M.; Redepenning, C.; Marquardt, W. Systematic and Optimization-Based Design of Integrated Reaction-Separation Processes. In Proceedings of the 8th International Conference on Foundations of Computer-Aided Process Design, Cle Elum, WA, USA, 13–17 July 2014; pp. 417–422. [Google Scholar]
  17. Bertran, M.O.; Frauzem, R.; Sanchez-Arcilla, A.S.; Zhang, L.; Woodley, J.M.; Gani, R. A generic methodology for processing route synthesis and design based on superstructure optimization. Comput. Chem. Eng. 2017, 106, 892–910. [Google Scholar] [CrossRef]
  18. Kong, Q.Y.; Shah, N. An optimisation-based framework for the conceptual design of reaction-separation processes. Chem. Eng. Res. Des. 2016, 113, 206–222. [Google Scholar] [CrossRef]
  19. Nezhadfard, M.; Emami, L.S.; Kasiri, N.; Khanof, M.H.; Khalili-Garakani, A.; Ivakpour, J. Development of a reaction/distillation matrix for systematic generation of sequences in a single two component reaction-separation case study. Comput. Chem. Eng. 2018, 117, 268–282. [Google Scholar] [CrossRef]
  20. Nezhadfard, M.; Khalili-Garakani, A.; Kasiri, N. Development of the reaction/distillation matrix to include more complicated Reaction/Distillation systems and performance evaluation using an ethylene hydration case study. Chem. Eng. Res. Des. 2018, 139, 259–271. [Google Scholar] [CrossRef]
  21. Lv, D.H.; Liu, G.L. Optimization of distillation sequence based on integration of reaction-separation system. Ind. Eng. Chem. Res. 2019, 58, 3093–3103. [Google Scholar] [CrossRef]
  22. Yin, C.F.; Liu, G.L. Automatic identification of the optimal distillation sequence based on its integration with reactor. Chem. Eng. Sci. 2019, 207, 424–440. [Google Scholar] [CrossRef]
  23. Gmehling, J.; Li, J.D.; Schiller, M. A modified UNIFAC model. 2. Present parameter matrix and results for different thermodynamic properties. Ind. Eng. Chem. Res. 1993, 32, 178–193. [Google Scholar] [CrossRef]
  24. Fenske, M.R. Fractionation of straight-run Pennsylvania gasoline. Ind. Eng. Chem. 1932, 24, 482–485. [Google Scholar] [CrossRef]
  25. Underwood, A.J.V. Fractional distillation of multicomponent mixtures. Ind. Eng. Chem. 1949, 41, 2844–2847. [Google Scholar] [CrossRef]
  26. Gilliland, E.R. Multicomponent rectification estimation of the number of theoretical plates as a function of the reflux ratio. Ind. Eng. Chem. 1940, 32, 1220–1223. [Google Scholar] [CrossRef]
  27. Eduljee, H.E. Equations replace Gilliland plot. Hydrocarb. Process. 1975, 54, 120–122. [Google Scholar]
  28. Kirkbride, C.G. Process design procedure for multicomponent fractionators. Petroleum Refiner 1944, 23, 321. [Google Scholar]
  29. Liu, S.C.; Guo, Y.Q.; Yang, X.L.; Ji, Y.L.; Luo, G. Kinetic Equations for Liquid-Phase Selective Hydrogenation of Benzene to Cyclohexene. Chin. J. Catal. 2003, 24, 42–46. [Google Scholar]
  30. Douglas, J.M. Conceptual Design of Chemical Processes; McGraw-Hill: New York, NJ, USA, 1988; p. 309. [Google Scholar]
  31. Rathore, R.N.S.; Vanworme, K.; Powers, G.J. Synthesis strategies for multicomponent separation systems with energy integration. AIChE J. 1974, 20, 491–502. [Google Scholar] [CrossRef]
  32. Vatavuk, W.M. Updating the CE plant cost index. Chem. Eng. 2002, 109, 62–70. [Google Scholar]
Figure 1. Distillation sequences of separating three-component mixture.
Processes 09 00565 g001
Figure 2. Vapor–liquid equilibrium curves with solvent AN (a) and CB (b) added.
Processes 09 00565 g002
Figure 3. Variations of relative volatilities at different solvent-to-feed ratios.
Processes 09 00565 g003
Figure 4. Variation of the total annualized costs (TACs) along the solvent-to-feed ratio with solvents AN (a) and CB (b).
Processes 09 00565 g004
Figure 5. Procedure for identifying the optimal solvent and distillation sequence.
Processes 09 00565 g005
Figure 6. The flowrate variation of reactor effluent along the reactor temperature.
Processes 09 00565 g006
Figure 7. Variation of relative volatilities along reactor’s inlet temperature (SF = 3).
Processes 09 00565 g007
Figure 8. Variation of relative volatilities with different solvent-to-feed ratios.
Processes 09 00565 g008
Figure 9. Variation of TACs and TACs of unit desired product.
Processes 09 00565 g009
Table 1. Five distillation sequences separating four-component mixture.
Distillation SequencesNumber of Times as Non-Key ComponentsNumber of Times as Key Components
A1A2A3A4A1A2A3A4
A1/A2A3AA2/A3A4A3/A400121221
A1/A2A3A4A2A3/A4A2/A301111221
A1A2/A3A4A1/A2A3/A410011221
A1A2A3/A4A1/A2A3A2/A311101221
A1A2A3/A4A1A2/A3A1/A221001221
Table 2. Prices of the three candidate solvents.
SolventsDMACNMPNFM
Price/$·t−1180020005900
Publisher’s Note: MDPI stays neutral with regard to jurisdictional claims in published maps and institutional affiliations.

