Article

Applying Lean Six Sigma Methodology to a Pharmaceutical Manufacturing Facility: A Case Study

1
School of Engineering, University of Limerick, V94 T9PX Limerick, Ireland
2
College of Science and Engineering, National University of Ireland, H91 TK33 Galway, Ireland
3
Department of Mathematics and Statistics, University of Limerick, V94 T9PX Limerick, Ireland
*
Author to whom correspondence should be addressed.
Processes 2021, 9(3), 550; https://doi.org/10.3390/pr9030550
Submission received: 3 March 2021 / Revised: 17 March 2021 / Accepted: 18 March 2021 / Published: 20 March 2021
(This article belongs to the Special Issue Sustainable Manufacturing and LCA Tools for Industrial Sectors)

Abstract

:
This research examines a case study on the implementation of an effective approach to advanced Lean Six Sigma problem-solving within a pharmaceutical manufacturing site which manufactures acetaminophen (paracetamol containing pain relief) tablets. Though this study was completed in a single manufacturing company, the implementation of this study delivers important application and results that can be deployed in other such manufacturing companies. The manufacturing site faced backlogs in customer orders due to increased demand. Increased demand is due to brand popularity and recognition, product efficacy and a COVID 19 pandemic that intensified the demand for pain relief tablets in an already very busy site. With increased demand, to ensure timely deliveries, customer satisfaction and minimize delays, sources of site productivity losses and wastes needed to be analyzed and reduced or eliminated. Manufacturing Packaging line downtime was identified as one area of concern. The goal of the research was to introduce a problem-solving technique to reduce downtime within a manufacturing site without affecting the production required to fulfil customer demand while increasing product quality. The research utilized an integrated LSS methodology which identifies, stratifies and effectively eliminates non-value adding (waste) activities, by following a 7-step customized problem-solving methodology which resulted in complete elimination of the issue under investigation and savings of just under half a million dollars. The learnings are being deployed and leveraged worldwide across the pharmaceutical organizations parent site and sister sites. The presented results demonstrated that Lean Six Sigma methodology and tools are effective for accurate root causing of problems and enablers of implementation of continuous improvement.

1. Introduction

The world is experiencing unprecedented times since the beginning of 2020. COVID 19 has halted many manufacturing operations. The manufacturing facility where this case study was conducted continued to manufacture during the pandemic given its classification as an essential service and saw an unparalleled increase in volume demands. Paracetamol is used to treat mild cases of COVID 19 as it is effective in treating high temperatures. To benefit from the increase in demand and avoid potential lost sales, it was critical for the business to ensure a smooth, continuous supply of product to the customer. The researchers needed to deliver results in an environment where there was an unprecedented spike in demand without any risk of disruption to supply. Lean Six Sigma methods were applied in the manufacturing facility to root cause downtime issues and improve productivity and met customer demand.
Lean was derived from Taiichi Ohno’s post-war Japanese Production system, and its benefits are advocated by Womack and Jones in their 1990 and 1996 books “The Machine that Changed the World” and “Lean Thinking” [1,2].
The primary goal of Lean Thinking is to reduce or eliminate waste and waste is anything which adds no value in the eyes of customers. Lean thinking as “a way to do more with less and less human effort, less equipment, less time, and less space while coming closer to providing customers with what they want” [1]. Adding value, creating flow, and establishing pull in pursuit of continuous perfection or improvement aligns a philosophy of continuous improvement and putting the customer first [3,4]. Lean focusses on reducing or eliminating non-value-added waste including the seven wastes of Transport, Inventory, Motion, Waiting, Over-production, Over-processing, and Defects is particularly vital in helping add value and improving flow in an operation [4,5].
Lean is known for its five main principles that enhance production namely, Identify Value; Value team Mapping; Create flow; establish pull and seek perfection. Steps within a process are then focused on to identify what is value adding for the customers perspective [4]. The Value Stream Map (VSM) is the products entire life cycle from raw materials to the customers use [6]. Value Steam mapping is utilized to eliminate waste and is important in designing processes for better flow [7,8]. To eliminate waste, there must be an accurate and complete understanding of the value stream [9,10]. Standard work is also a powerful Lean tool in the identifying waste and greatly assists in its removal [11]. Creating flow is another important principle of Lean and when the production line stops everyone is forced to solve the problem of flow and understanding flow is essential to the elimination of waste [12]. The Lean manufacturing principle of flow is about creating a value stream with no interruption, delays or bottle necks [2,6]. A pull system makes it easier to deliver products as needed, as in ‘just in time’ manufacturing or a customer demand driven system [13]. Enhancing product flow, the lean principle of pull makes sure that nothing is made in advance if there is not a customer order or requirement for the product [14]. Seeking perfection in Lean aims to ensure the perfect process happens step by step as continuous improvements and implementing preventative actions on root causes of quality problems and production waste [15]. Lean methods can not only reduce waste but reduce operational losses, namely, equipment failures, setup and changeovers, idling and minor stoppages, reduced speed operation, scrap and rework and startup losses [10]. Lean is a strategic approach to waste elimination and continuous improvement [6,16].
Motorola Inc. coined the term Six Sigma in the mid-1980s as a metric for measuring defects and improving quality. Six Sigma has evolved into a robust continuous and business process improvement initiative over the past thirty years [17,18]. The basic idea behind the Six Sigma philosophy is continuously to reduce product and process variation, for example, small variations in environmental conditions, operator performance, raw materials and machinery can cause cumulative quality problems [19].
Six Sigma methodology utilizes a structured DMAIC (Define-Measure-Analyze-Improve-Control) approach to tackle problems with unknown root causes and unknown solutions [20,21]. The DMAIC structure is aligned with the classic Plan–Do–Check–Act (PDCA) cycle, but Six Sigma specifies the quality management tools and techniques to use within each step [22]. The use of specific, challenging goals in Six Sigma projects can increase the size of improvements, reduce process variability and increase employees’ involvement in improvement efforts and their commitment to quality [23]. Six Sigma integrates business-level performance, process measures, and project metrics that managers can utilize to manage the organization quantitatively and achieve strategic aims and objectives [24]. When projects are aligned with a company’s scorecard or key performance indicators valuable results are achieved [25].
Six Sigma, as a statistical and non-statistical toolkit integrated within the DMAIC method gives a framework for process improvement [26].
Six Sigma uses a tiered set of trained improvement specialists, based on a martial arts “belt” system e.g., master black belts, black belts, green belts, yellow belts and a manager of champion belt level [27,28]. Each belt level represents a level of experience or training in Six Sigma tailored for that belt level and the knowledge and skillset associated with that level [22].
Six Sigma, when used alone or coupled with another methodology such as Lean, can improve profits and increase customer satisfaction [29,30].
George (2002) successfully integrated Lean and Six Sigma for business process improvement and claimed that the integrated approach is superior to using exploiting Lean or Six Sigma on its own. His view was that Lean is not well suited to resolving complex problems that require intensive data analysis and advanced statistical tools and techniques [31]. Lean and Six-Sigma aim at improving the productivity and efficiency of the business by removing waste and reducing variation, respectively [30,32].
The integration of Lean and Six Sigma is important as lean focuses on improving the flow of information and materials between the steps in the process steps and Six Sigma works strives to improve the value-adding transformations which occur within the process steps. Waste can also include rework or scrap, which are often the result of excess variability, so there is an obvious connection between Six Sigma and Lean [33]. The most appropriate blend of Lean and Six Sigma tools useful on applicable to any one given problem must therefore depends on the nature of the specific problem being solved [34].
The tools employed by lean and in Six Sigma were not all invented in these methodologies, but they were used in a structured approach to form each methodology. Thus, both can be thought of as toolboxes, where certain tools might be more suitable than others depending on the nature of problem or opportunity faced [33].
Successful implementation of Lean Six-Sigma is carried out using several process improvement tools (fishbone, flowcharting, check sheets, pareto charts, control charts, value stream mapping, quick changeover, waste analysis and scatter diagrams) and other statistical tools [20,35,36].
There are several critical success factors for the deployment and implementation of LSS, such as leadership alignment, proper selection of people and projects, training, motivation, accountability, information technology, marketing and supply chain management [37]. Lean thinking can form the basis for careful screening of the value stream current state to find the waste and eliminate it. Six Sigma based statistical improvement methodologies and problem-solving methods and tools can be deployed to eliminate the deviation and drive the business towards the future state and provide a competitive advantage to the business [18].
This research aims to apply Lean Six Sigma problem solving methodology and principles in a pharmaceutical manufacturing environment setting. The study demonstrates that an organization can improve productivity, reduce backlog, downtime, eliminate waste and ultimately improve customer delivery timelines through structured application of Lean Six Sigma problem solving methodology combined with selectively utilized resources.

2. Materials and Methods

This project utilizes a customized LSS framework with a Six Sigma-based 7-step problem solving methodology (with DMAIC integrated) and Lean Six Sigma tools and techniques. This section (Section 2) describes the first five steps of the pharmaceutical manufacturers seven-step problem solving structure as outlined in Figure 1 and the Results, benefit realization and sharing are presented as part of Section 3.

2.1. Loss Identification

Step one in the problem-solving framework identifies the top losses within an operations production line. A value stream map was constructed to reveal barriers blocking continuous flows of materials and recognize available opportunities for preventing loss reduction. A value stream map (Figure 2) was drawn up and on analysis of waste in the process and flow it was demonstrated that the packaging department was a bottleneck.
A bottleneck has resulted in 11.6 days of ‘work in progress’ (WIP) accruing. This research will discuss identifying the root causes for waste within the packaging department. It is important to note that all wastes identified were examined and sub-projects were deployed from that analysis, that will not be discussed in this research. The demonstrated average weekly run-rate in the packaging department was 5.4 million blisters (tablets). The customer requirement was 6.5 million blisters. Therefore, the run rate in the “current” state was 1.1 million blisters below the customer demand. Data were then reviewed from the Packaging department in relation to Overall equipment effectiveness (OEE) for production line downtime and production time losses over the previous few months (Figure 3). OEE provides a quantitative metric based on the element’s availability, performance and quality for measuring the performance effectiveness of individual equipment or entire processes [38]. Short stops are simple problems, including trapping of a piece in upper transportation channel or stopping a defective product by a sensor, cause them [10]. A short stop is effectively a breakdown or tablet feed issue that can be resolved within 10 min or less. The reason it is classified as a chronic stop is due to the high frequency in re-occurrence and contribution to downtime on the production line. The stop is immediately attended to, resolved and the packaging line restarted by the operator, but the root-cause of the issue is not understood. These issues add up due to their high recurrences, slow production and contribute to a backlog in the packaging area.
The ‘short stop’ category will be the area of focus for this project. Various other Lean tools were deployed to remove other major downtime losses, for example “Quick Changeover” or “Single Minute Exchange of Dies” (SMED) and Total Preventative Maintenance (TPM) roll-out for breakdowns and deployment of “floating” staff to cover labor unavailable.

2.2. Loss Stratification

The purpose of this step (Loss Stratification) is to narrow the scope of the problem, as trying to solve a ‘tablet feed’ issue across all nine lines is far too wide in scope. The objective was to see where the problem is occurring the most and do a deep dive into that area. As per Figure 4, tablet feed equates to 20,174 min downtime across all nine packaging lines between weeks 2 to 18. This is, on average, 20 h downtime across all lines weekly.
From further analysis, it was ascertained that the tablet feed issue was not observed on three of the packaging lines. These lines had different equipment and production setups. The scope now shifted towards focusing on the six blister lines. Figure 5 demonstrates the short stops related to tablet feed over six packaging blister lines and shows the spread of downtime across these lines.
Based on the data collected in Figure 5, it could be observed that tablet feed issues recorded were very high across all six blister lines. This informed the researchers of two key pieces of information:
(1)
There is a chronic problem across all lines, making it important to move fast, as product is being held up across all lines within the Packaging department for this issue
(2)
Lessons learned from correctly root causing the issue on one line will most probably resolve the issues on all lines where the corrective action is deployed.

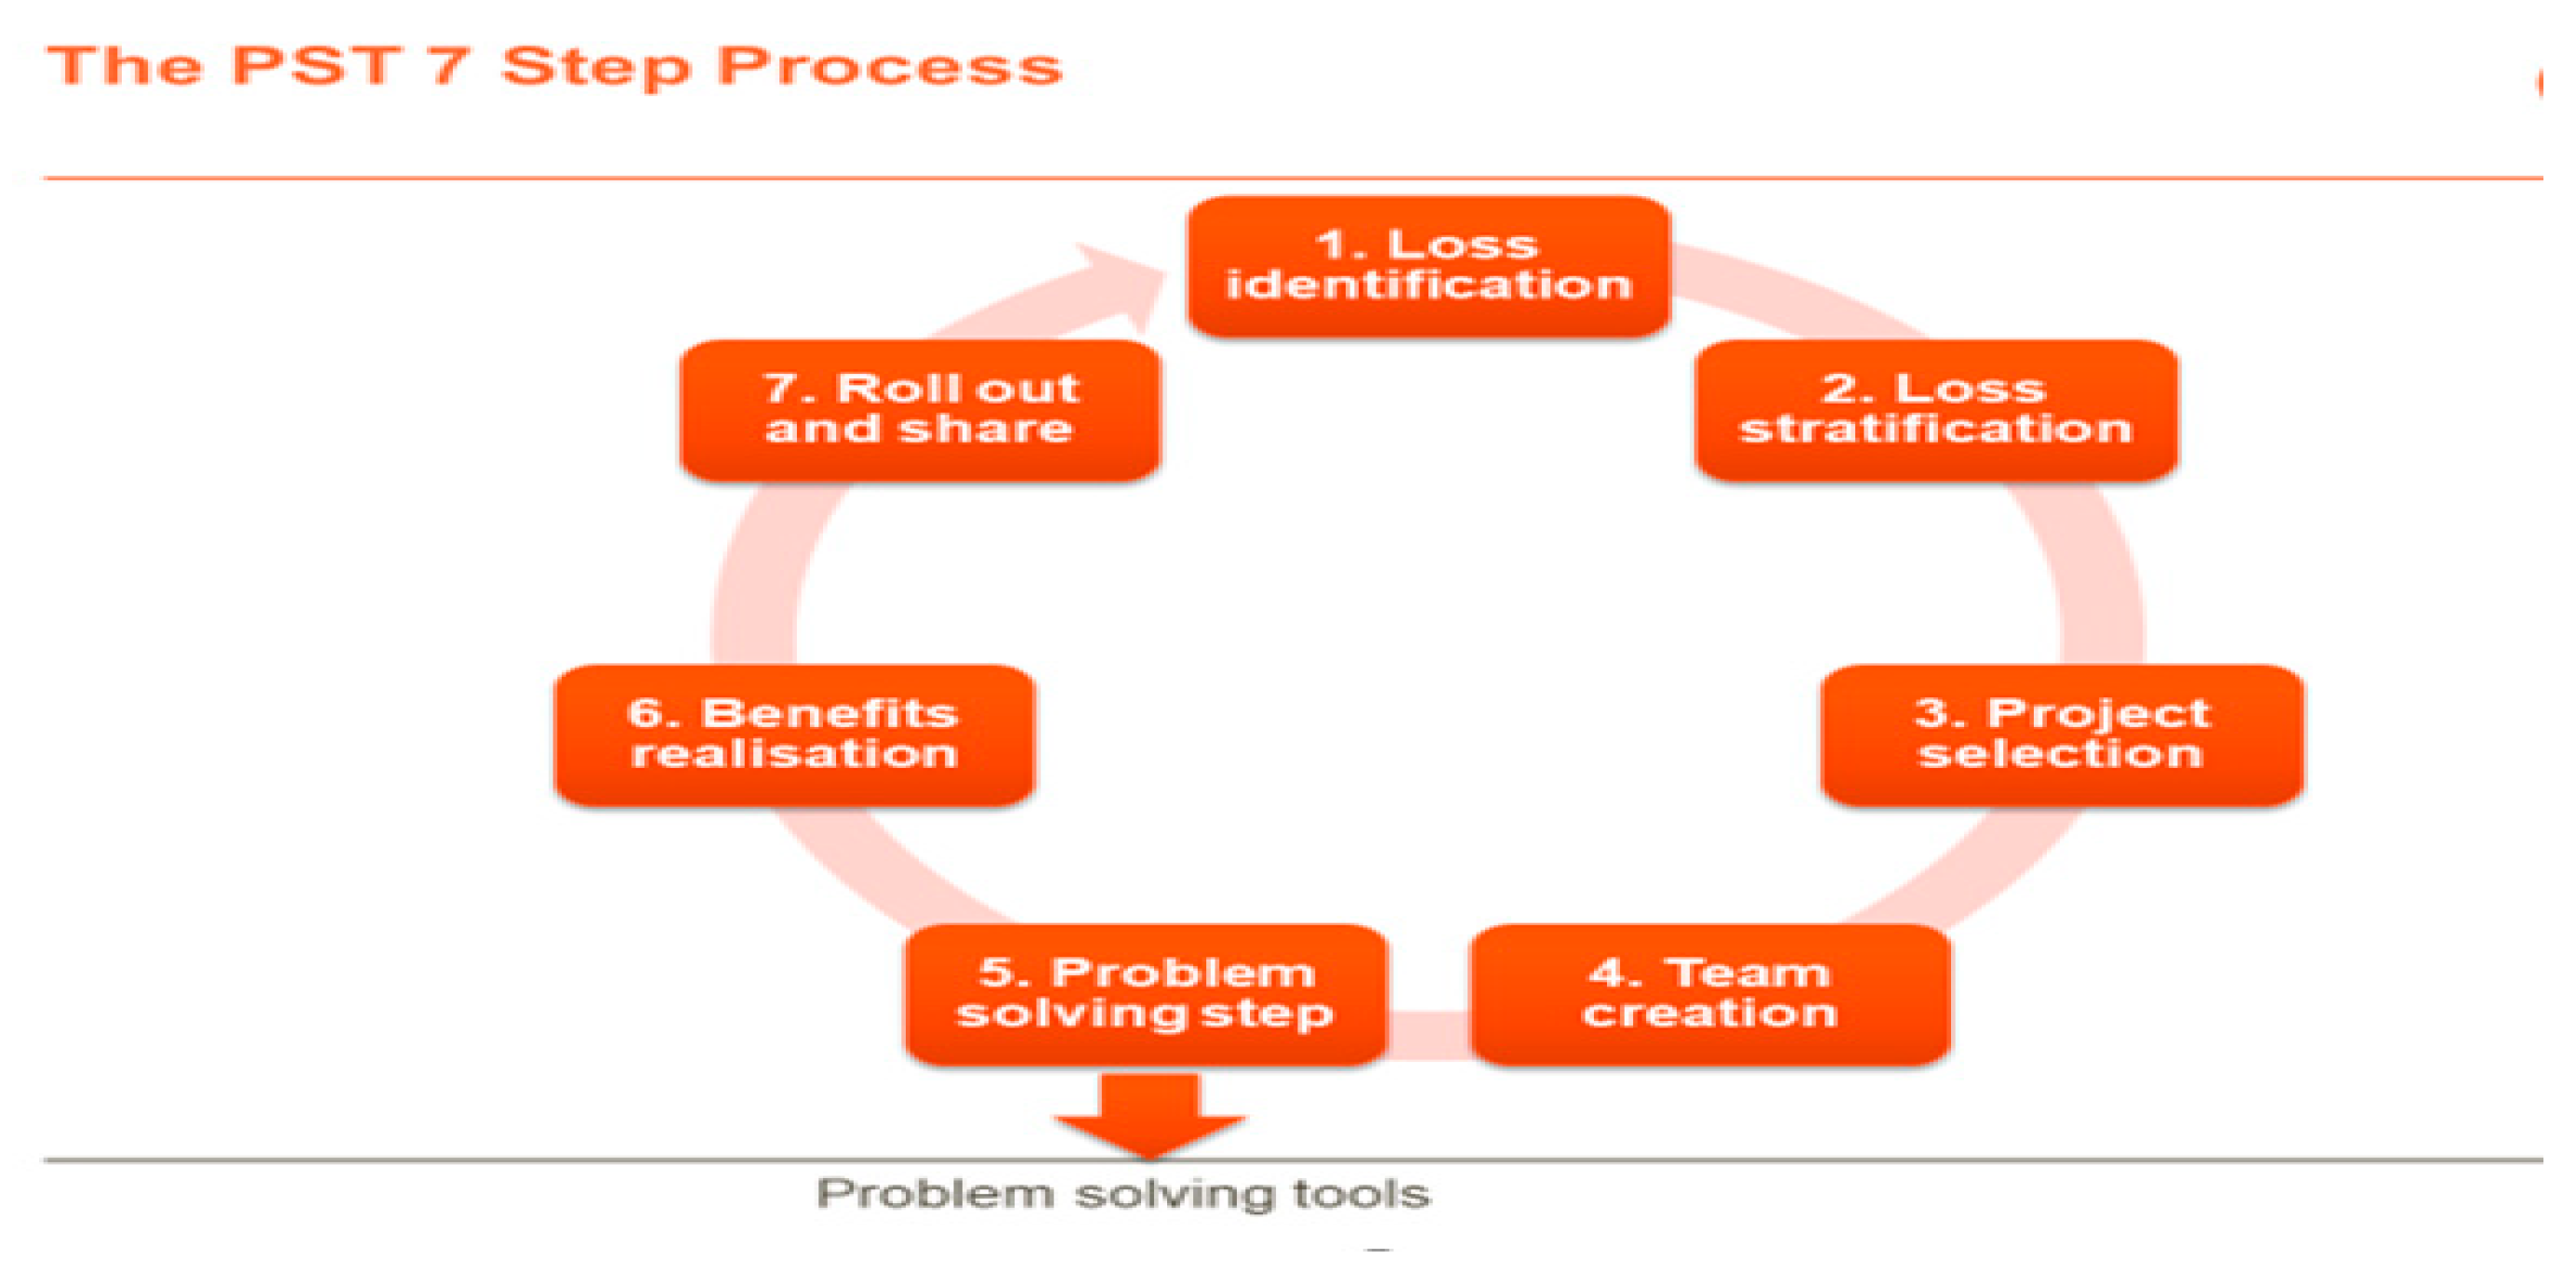
3. Project Selection

Projects are prioritized in terms of benefit (or impact) and the resources necessitated. Identifying appropriate criteria for project selection is critical to an effective Lean Six Sigma project selection process. The urgency of the project topic focusing on a small-scale project and the chance of increasing probability of success is important in Six Sigma project selection [39]. Selection utilizing a matrix such as in Figure 6 is geared towards prioritizing ease of implementation against impact. Upon review of the problem under consideration in this research, this project aligns in the upper quadrants of high impact within the categories of low effort and high effort. As a dedicated team of SMEs was required, some aspects had high effort tasks, such as understanding the full engineering and automation intricacies of a packaging line, but other aspects were low effort. Had it been a “Low effort”, it would have been fixed previously.
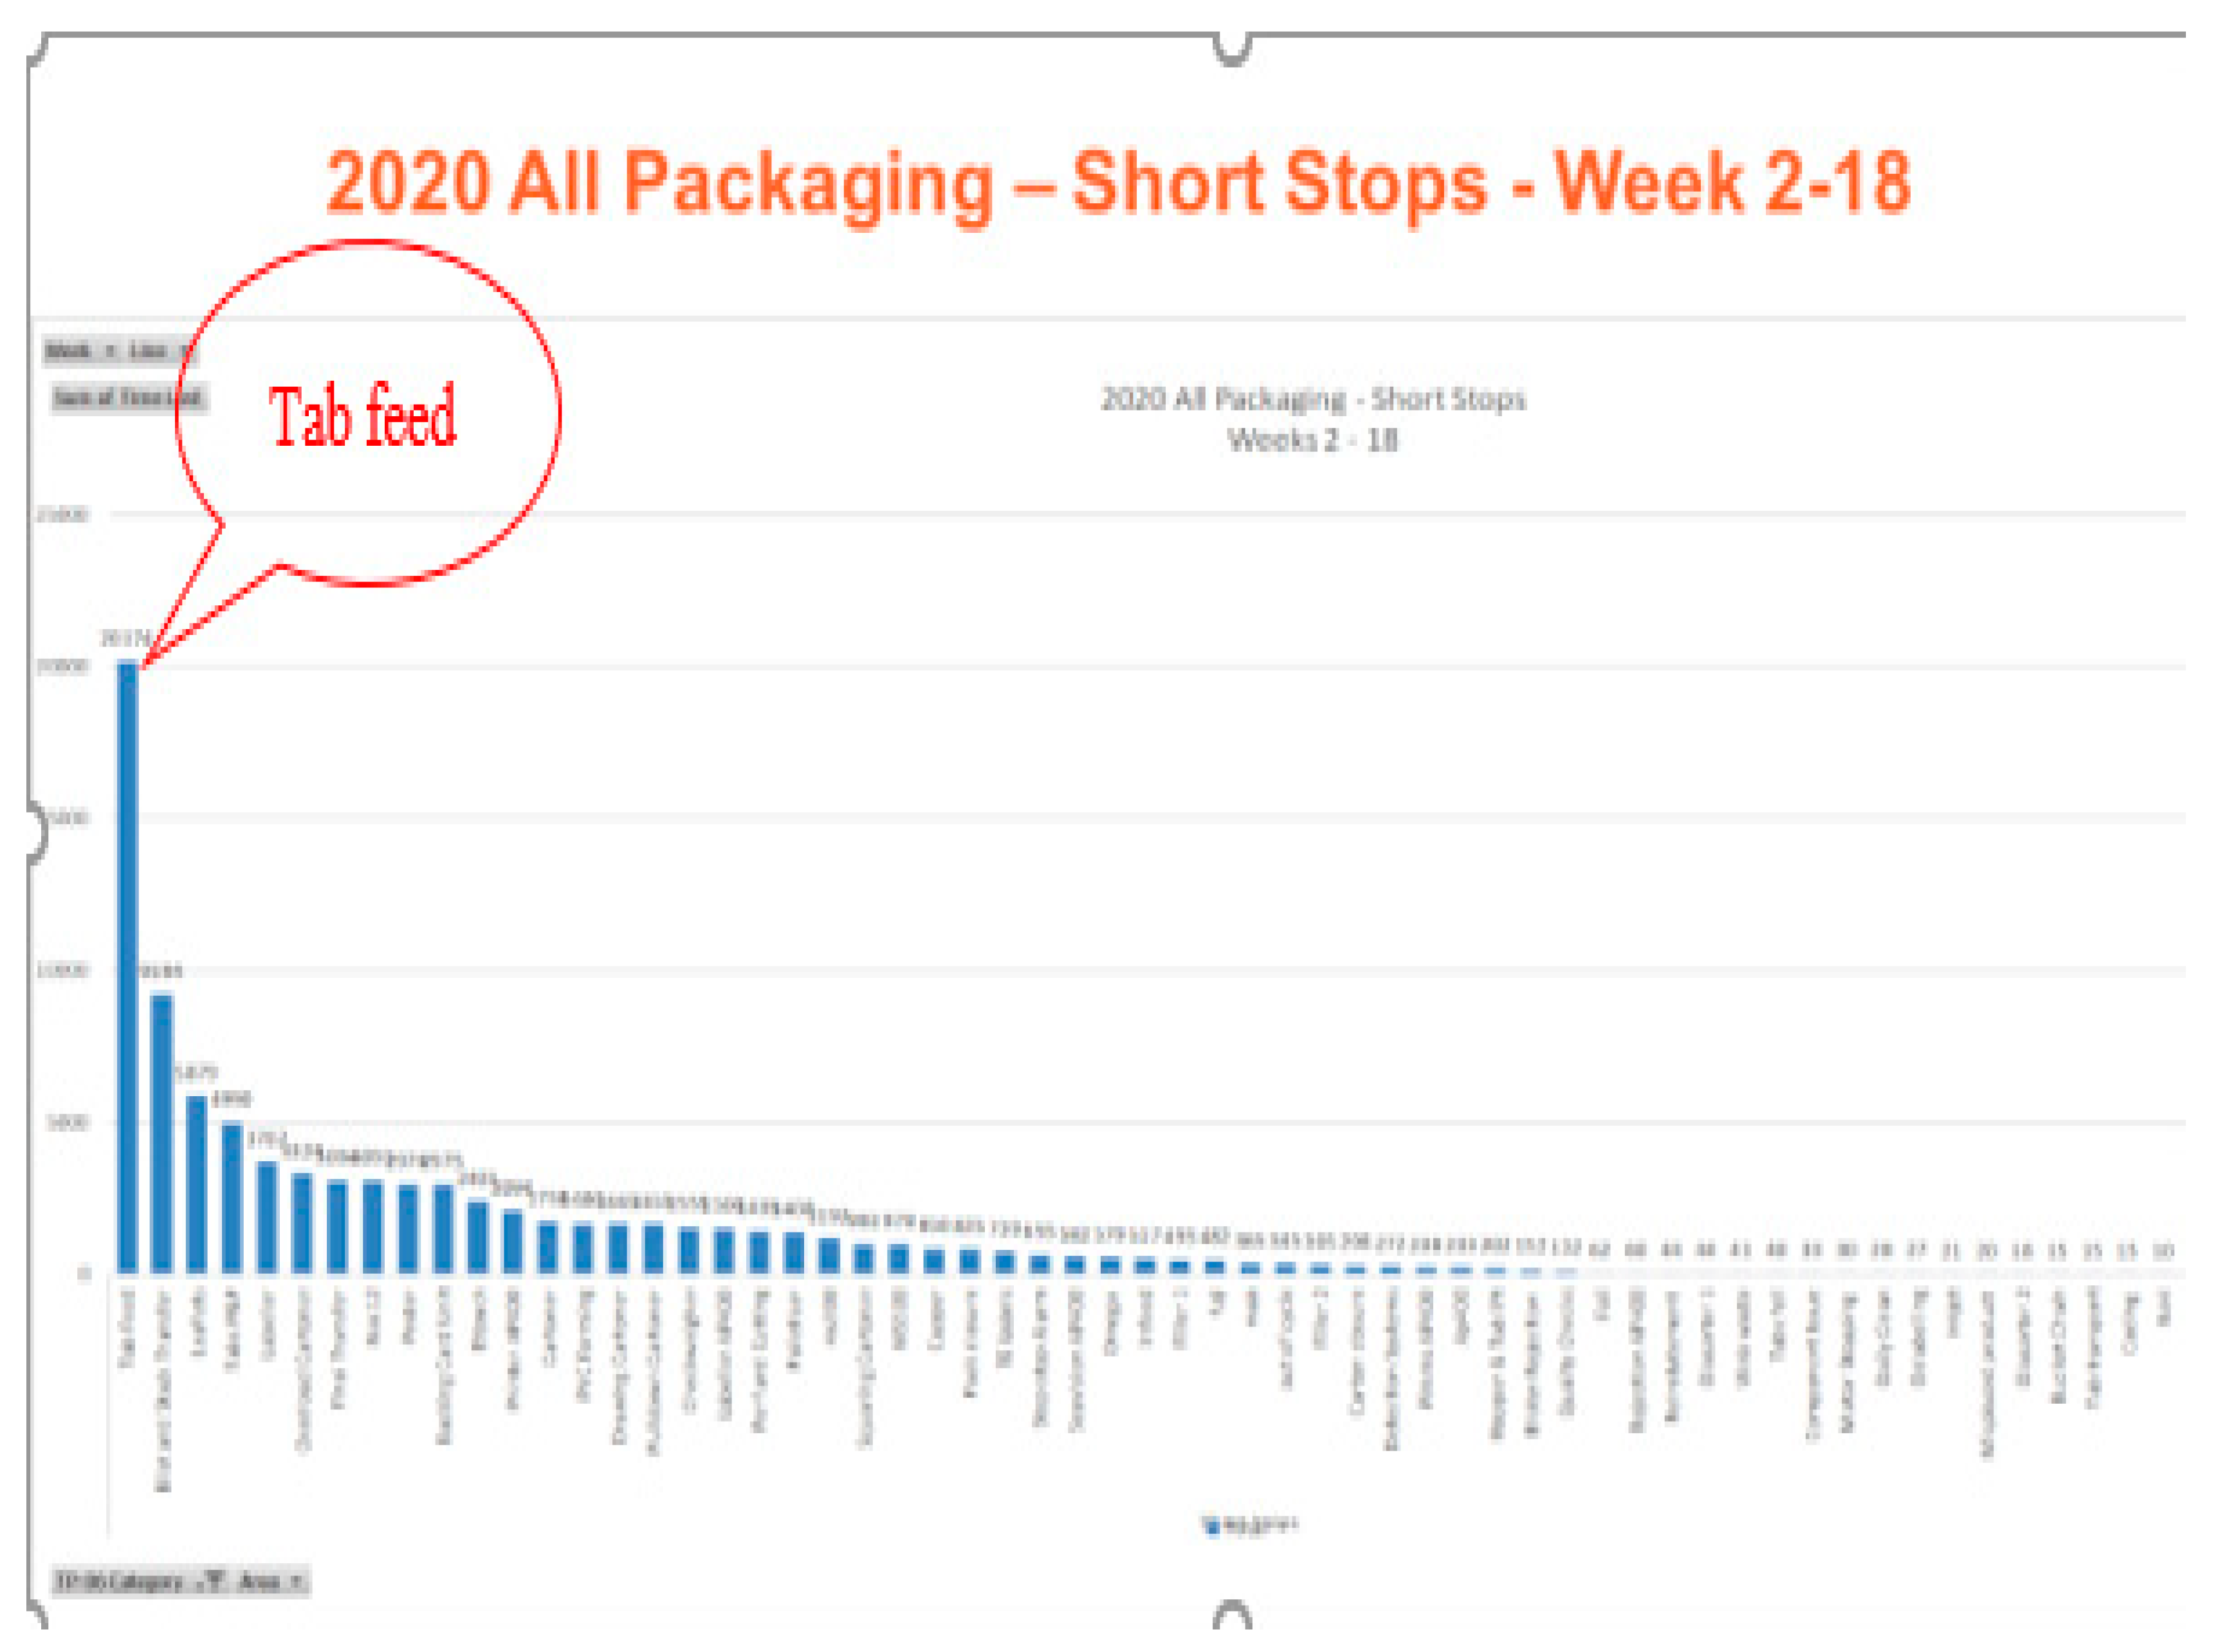
The problem statement was defined and measured in more detail.
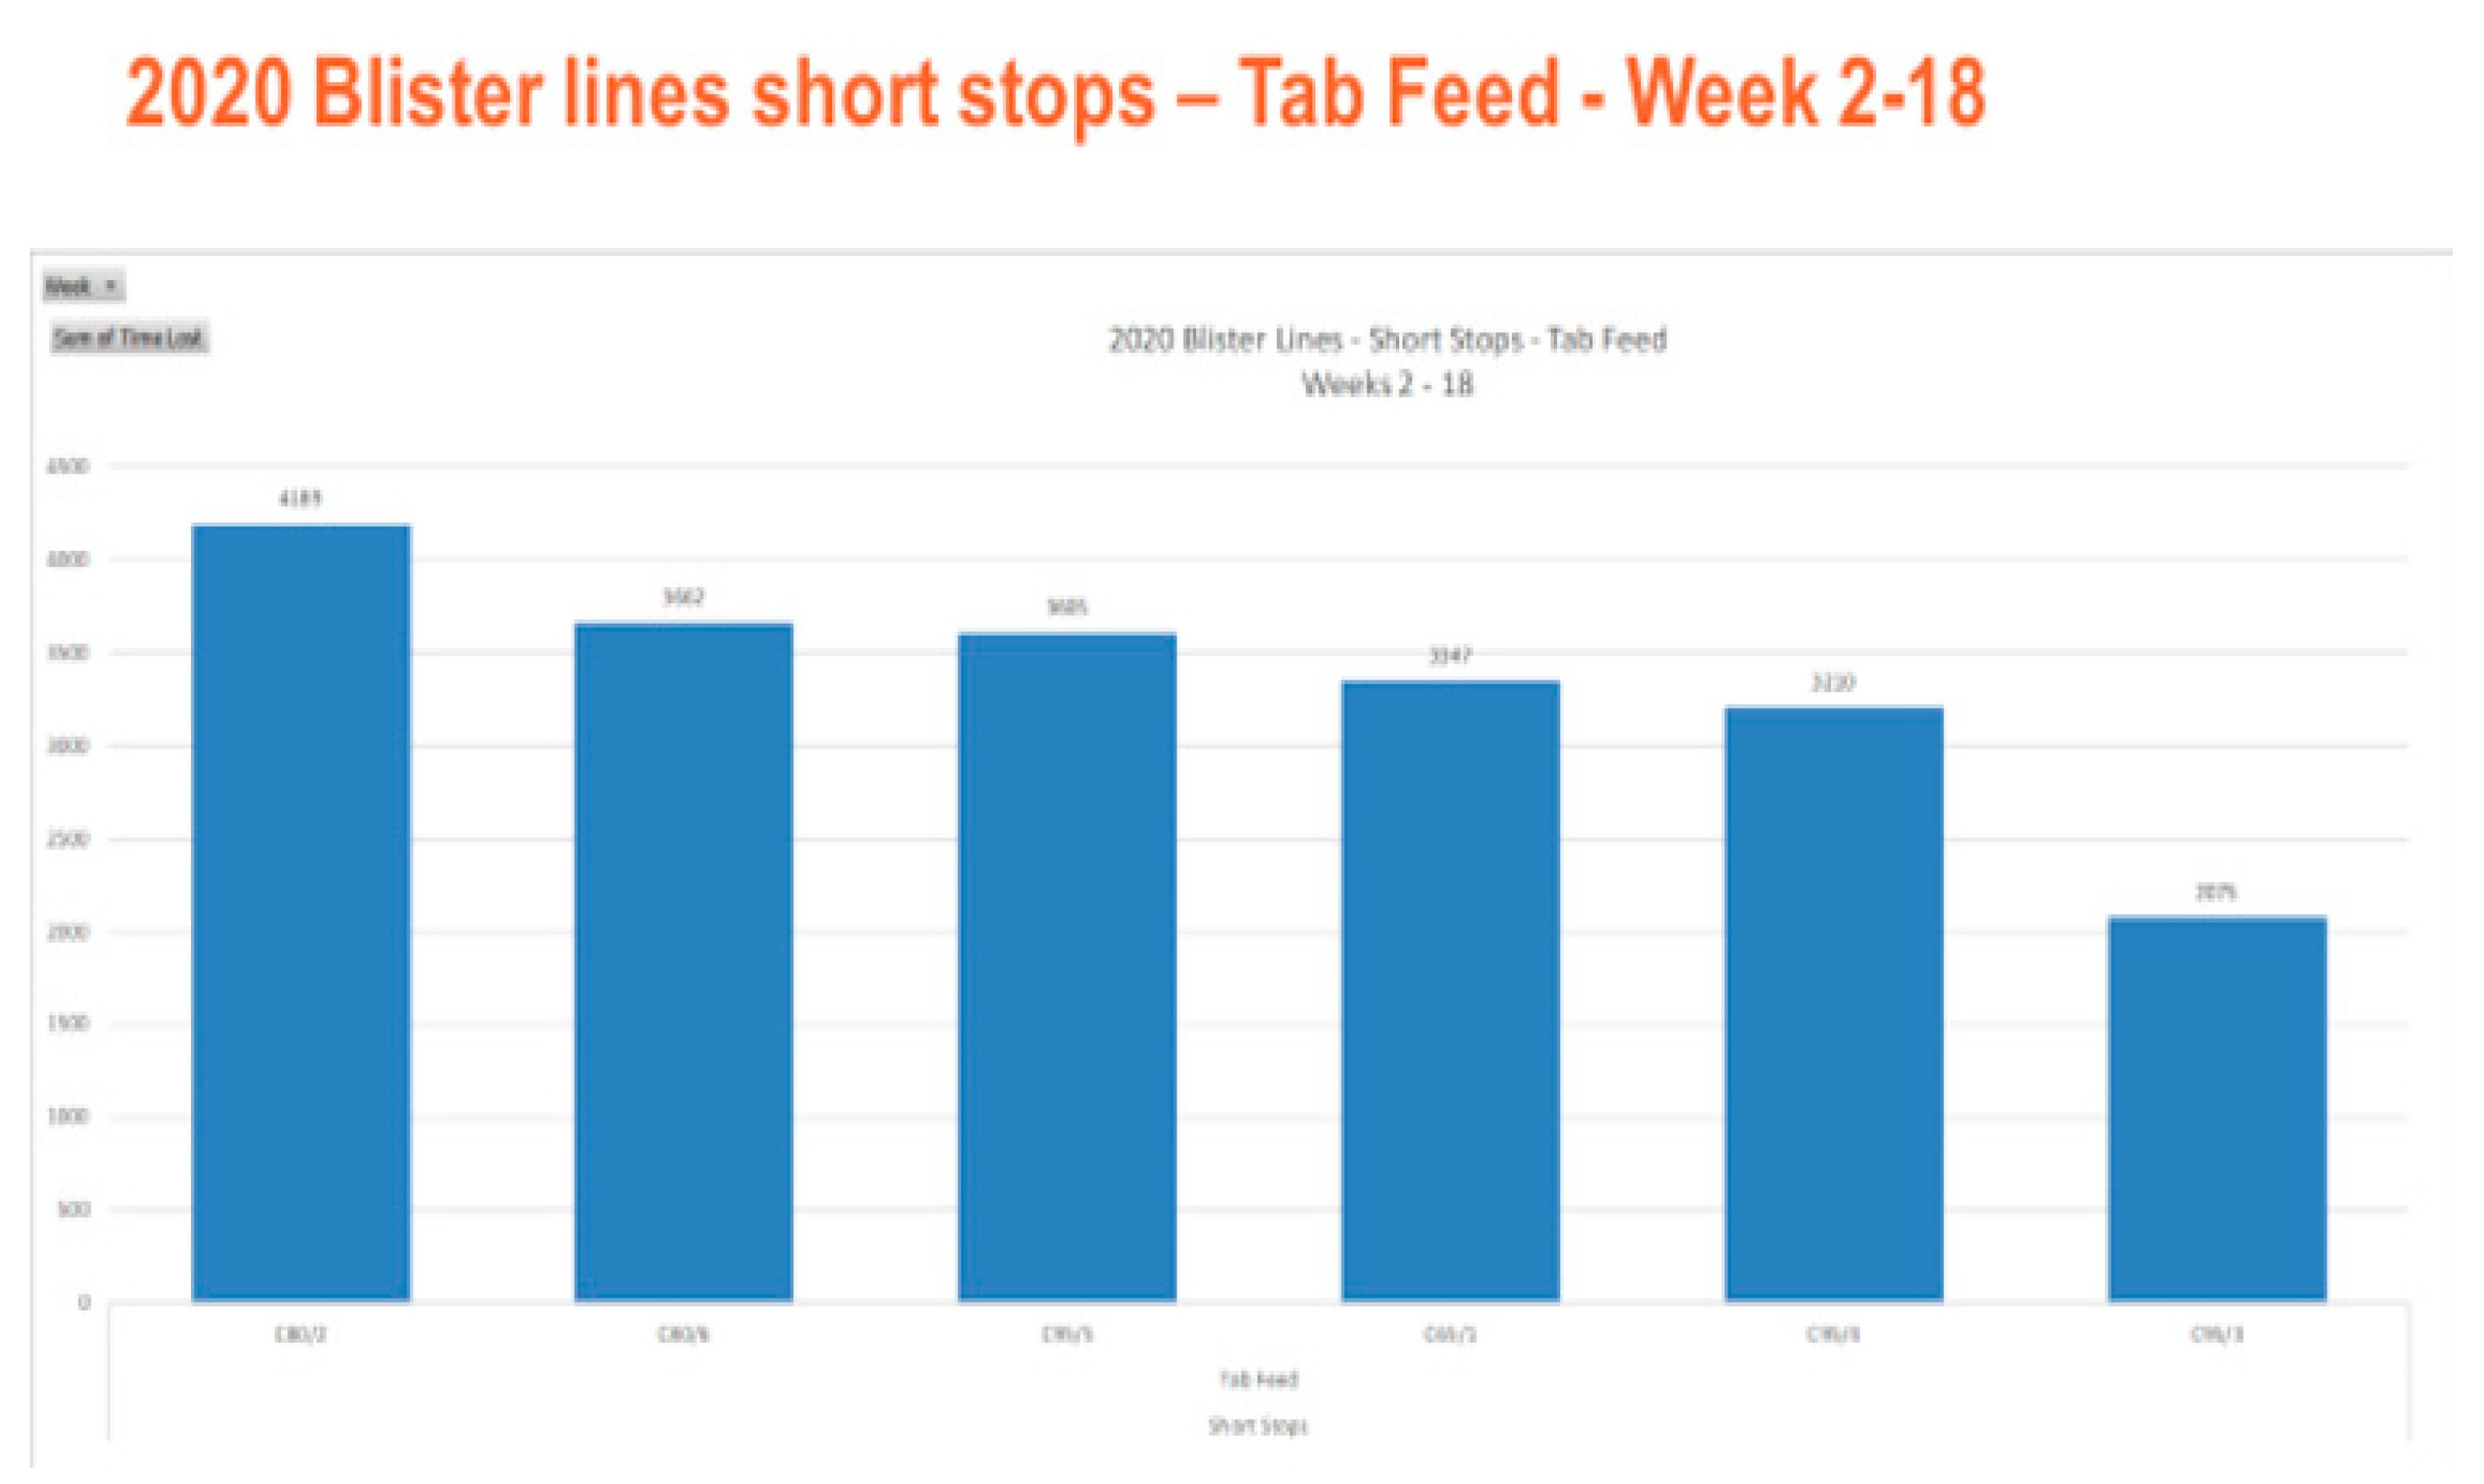
  • Within the packaging area line being reviewed, tablet feed issues are the highest cause of downtime within the short stop category.
  • The impact is 335 h of downtime over a 4-month period at an average 20 h per week with an upward trend observed in downtime for tablet feed of which one fifth (72 h) is being contributed by packaging line C80/2.

3.1. Team Creation

To define and assemble the team required to solve the problem, selection was based on individuals’ knowledge, skills and their ability to solve the problem. The typical size of a team for a ‘Focused Improvement’ is 3 to 7 people. The team for this project was agreed at the site leadership level and all team members were informed prior to commencement. A weekly governance was established to ensure regular updates on actions and communicate progress to cross-functional members next steps. Engineering, process technicians and operators were included to provide a high level of understanding on how the production line equipment should work. Technical analysis will provide the team with an expert understanding on how the tablet performs throughout the tablet transportation system, and if there are issues relating to the product rather than to the equipment.

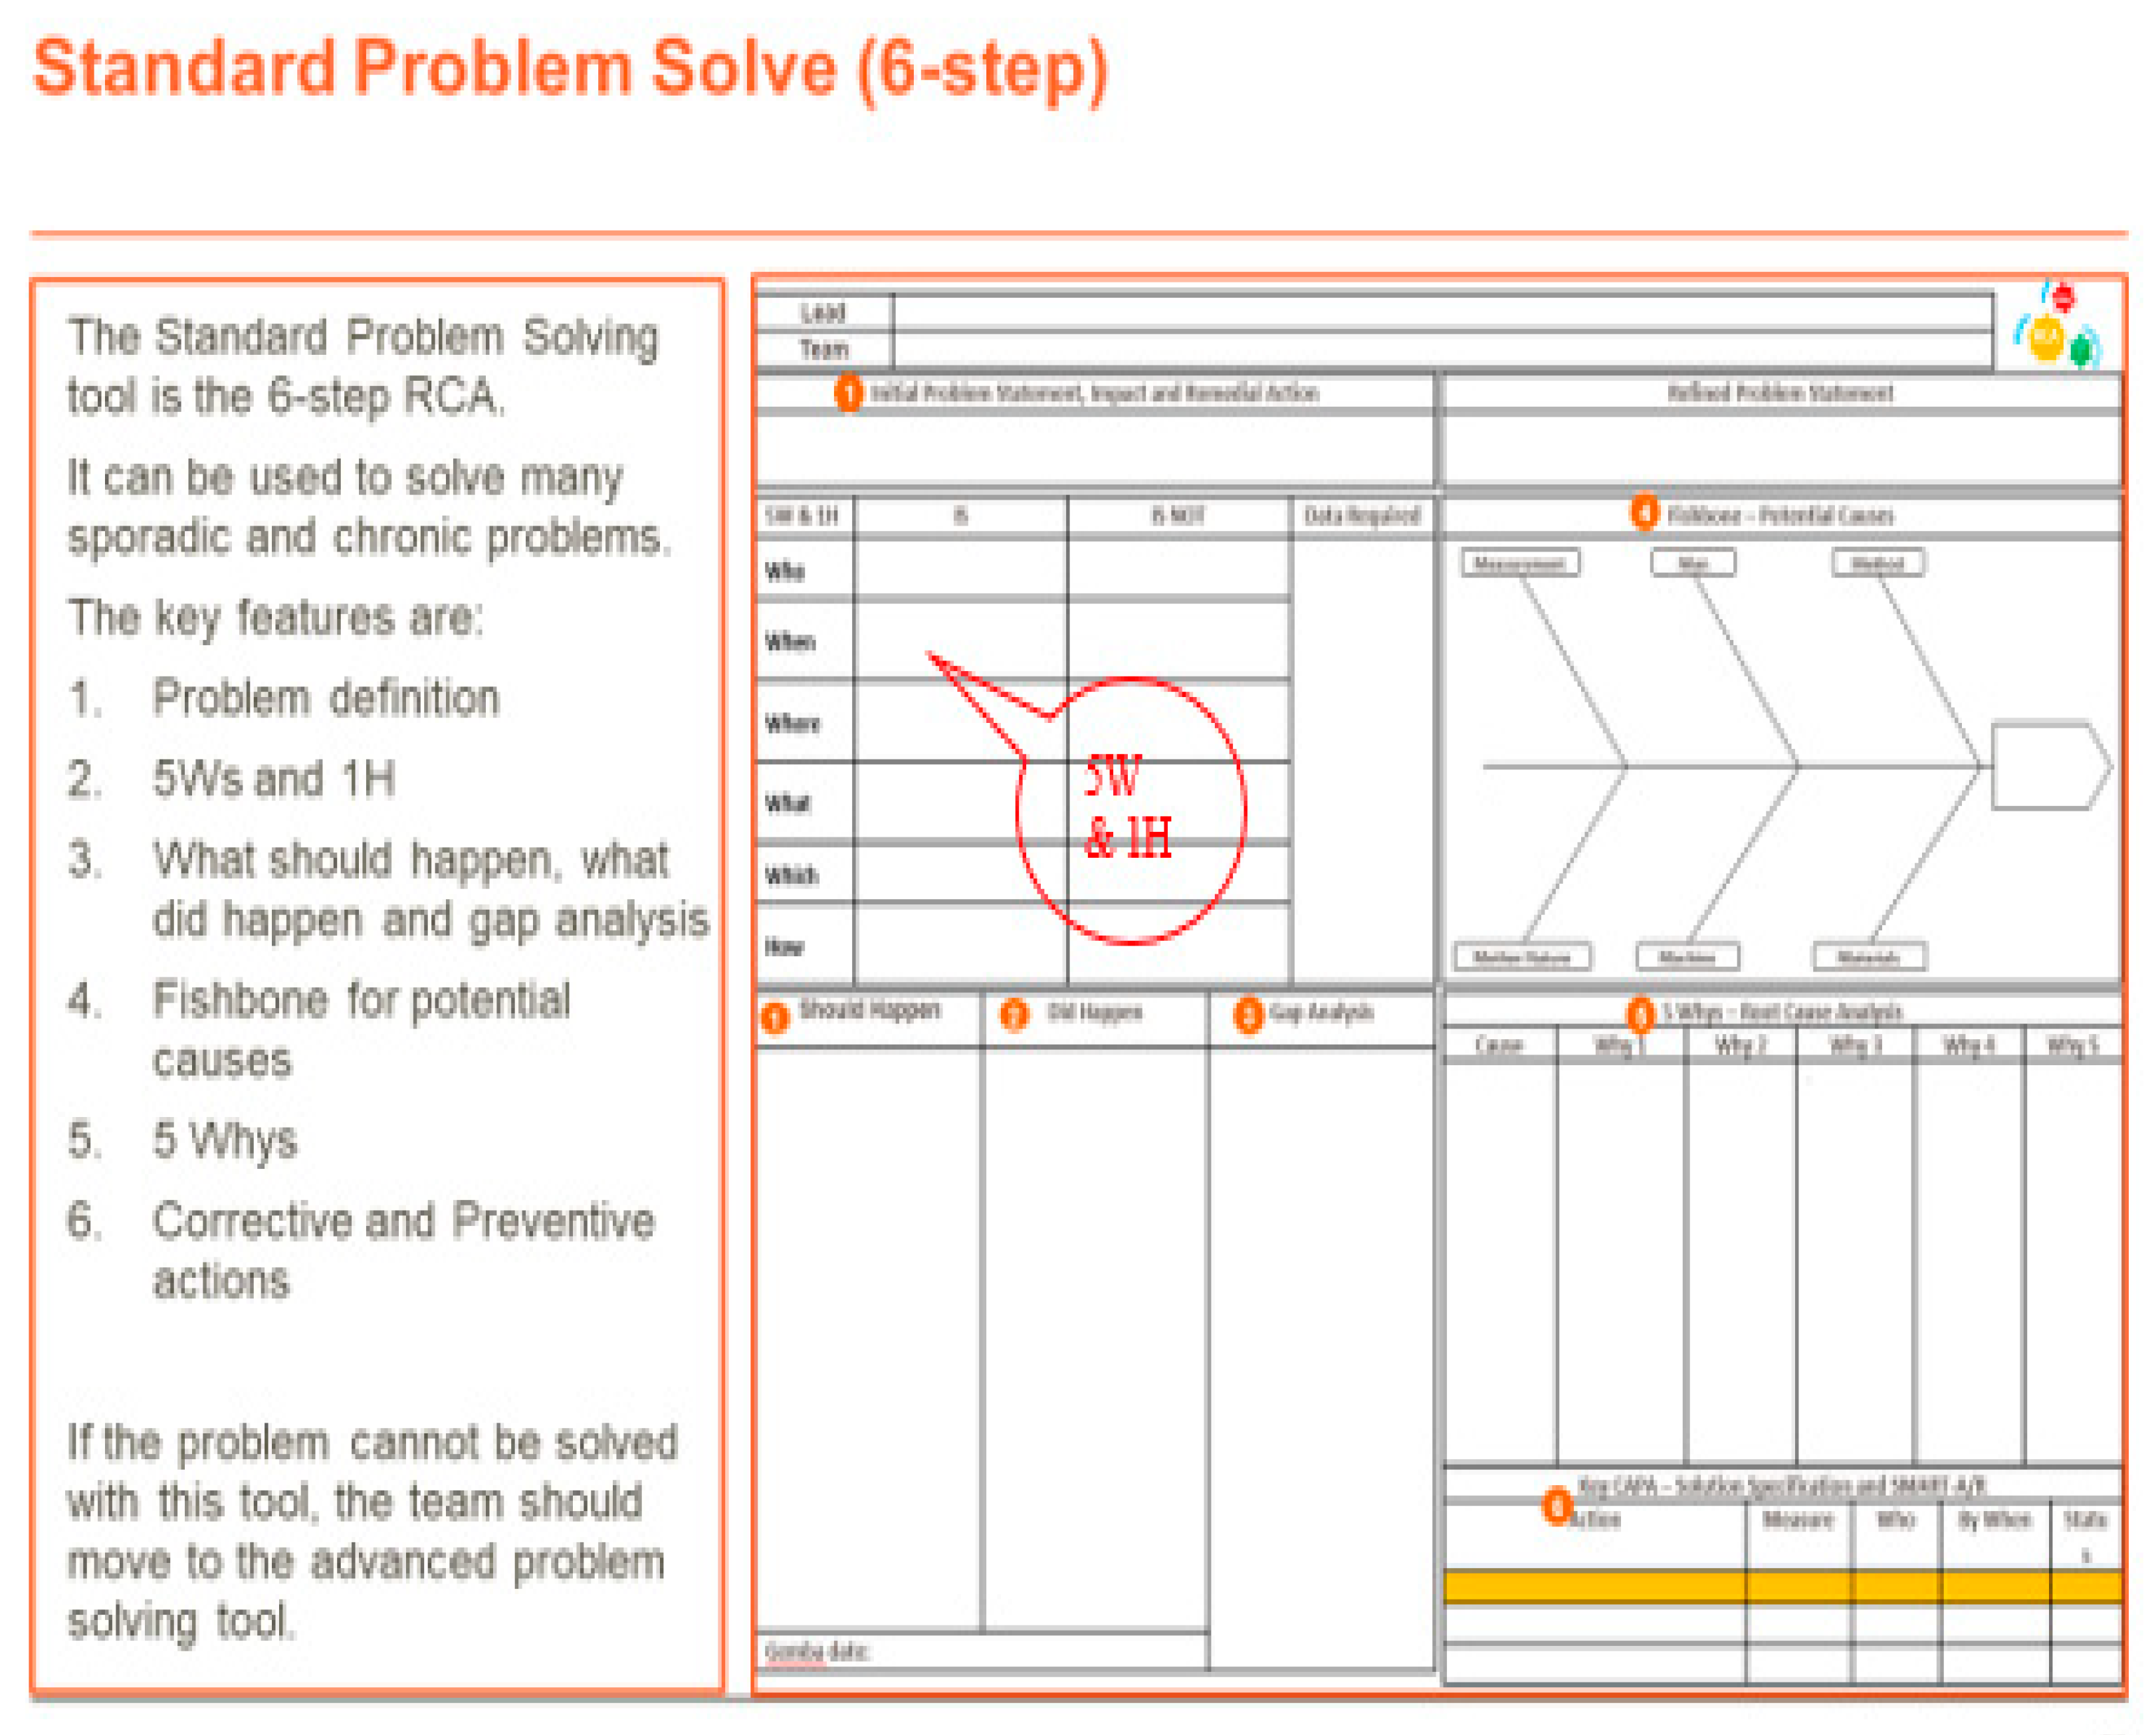
3.2. Problem Solving

This section will detail the specifics of the manufacturing site’s problem-solving template. Step five ‘Problem Solving’ of the 7-step cycle utilized a problem-solving tool called the ‘6-step problem-solve’ or problem-solving template. This template is similar in structure to the DMAIC or A3 (utilizes an A3 size sheet/template) problem solving as shown in Figure 7.

3.3. Problem-Solving Approach

The next phase of the problem solve was to develop the 5Ws and 1H: Who, What, When, Where, Which and How. The simple question ‘Who found the problem’ can often lead to revealing interesting details relating to problem-solving. 
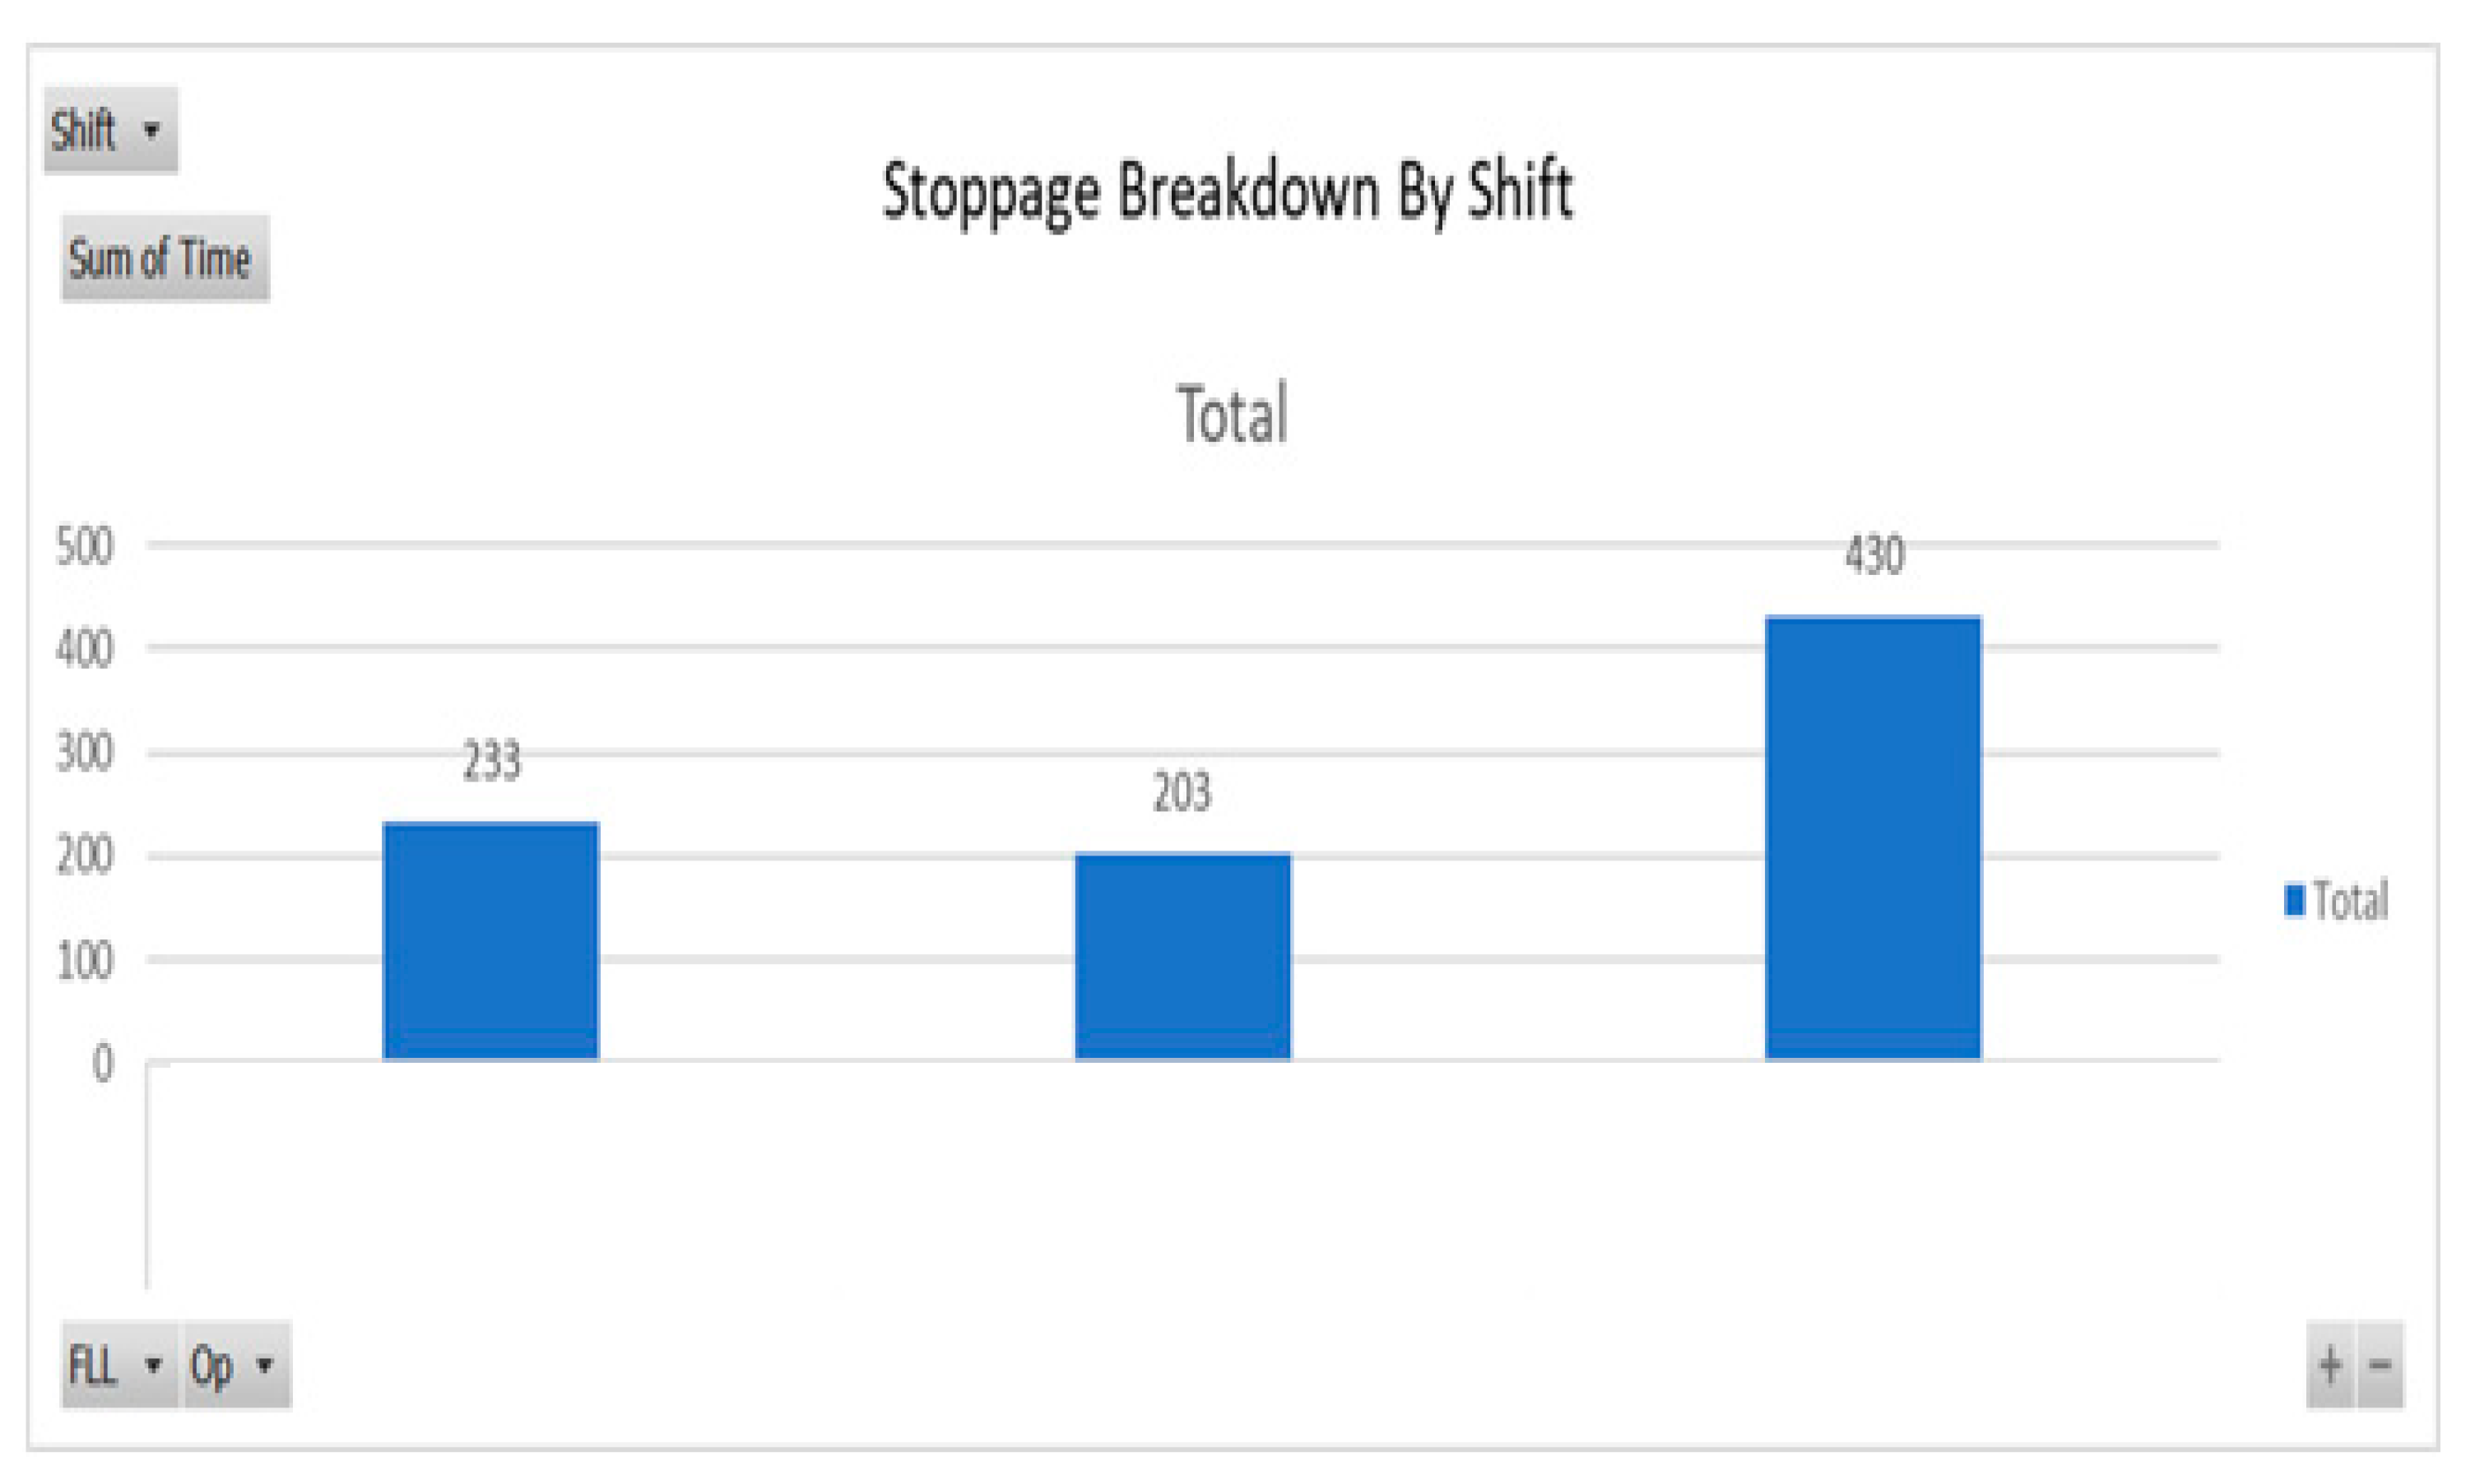
Figure 8 demonstrates the breakdown of downtime experienced for tablet feed issues in minutes by shift.
Shift C has almost double the amount of downtime than Shift A and Shift B. However, all shifts experience downtime relating to tab feed issues. On closer examination, it was established that shift C has more inexperienced operators and their reaction time to resolving the issue was not as quick as the other shifts.
Further analysis established that shift C had 71% of downtime relating to ‘tablet feed’ issues during night shifts. This was root caused to a lack of trainers available on that shift.
Standard Work lays out the work sequence to develop standard operational procedures and it organizes the movements of the production operator [40]. A standard work instruction was developed to help operators understand the sequence of steps in resolving such issues within 60 s. Previous demonstrated standards took 120 s per stop. Table 1 on Standard work below illustrates this procedure.
‘Tablet feed issues’ are the largest issues in scope. Getting an understanding of ‘What’ is happening is vital to gain clarity of the problem. A Gemba Walk was performed of the packaging area. Gemba is a technique used to observe and understand how work is being performed and is taken from the Japanese word “gembutsu” meaning “real thing” or “real place [41]. Going to the Gemba (and seeing what is happening and talking to the people working on the packaging line helped deepen the team’s understanding of the defect type. 
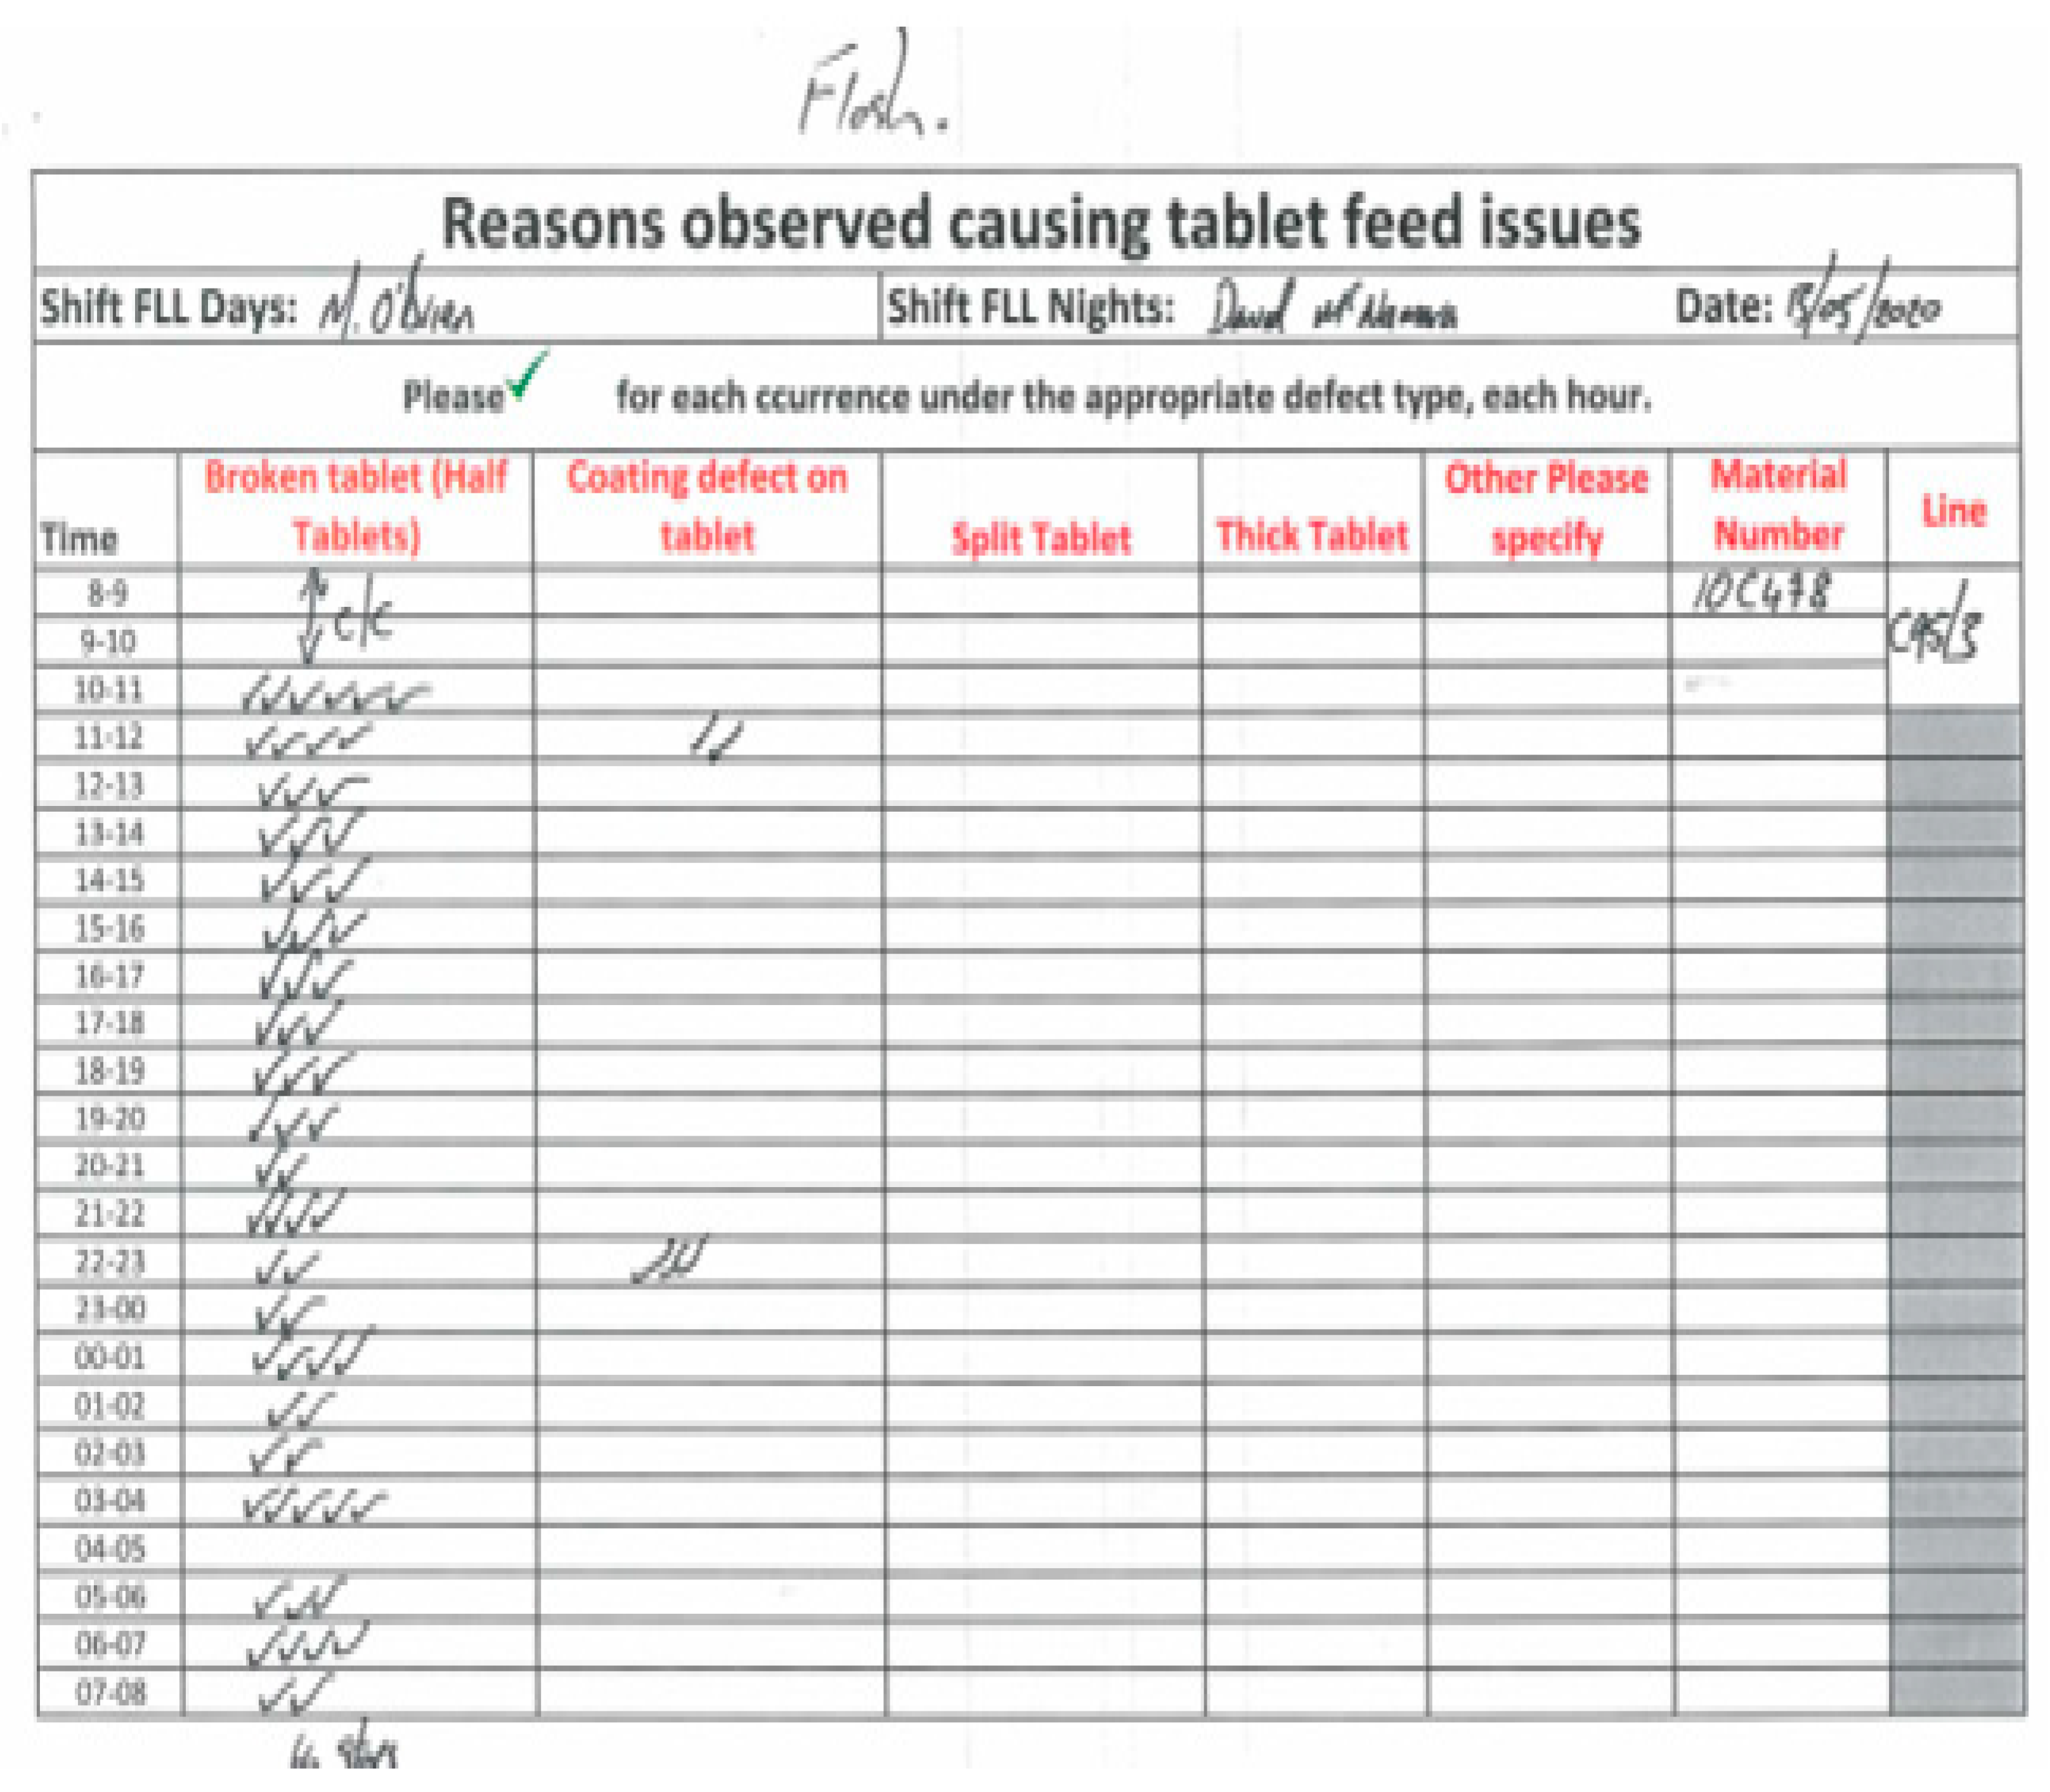
Figure 9 was developed based on operator observations, i.e., the four types of defect that cause tablet feed issues were: broken half tablets, coating defect (flaking on the tablet), split (horizontal) tablets, and thick tablets. Each time an operator observed a line stop, it was agreed to categorize each stoppage as per Figure 9.
This visual brought great clarity to the team in order that they could differentiate the different types of defect and granularity around the number of stops. This check sheet exercise was conducted on each shift whilst running product 10C821 on the C80/2 packaging line. Broken half tablets were observed and recorded as the highest cause of stoppages.
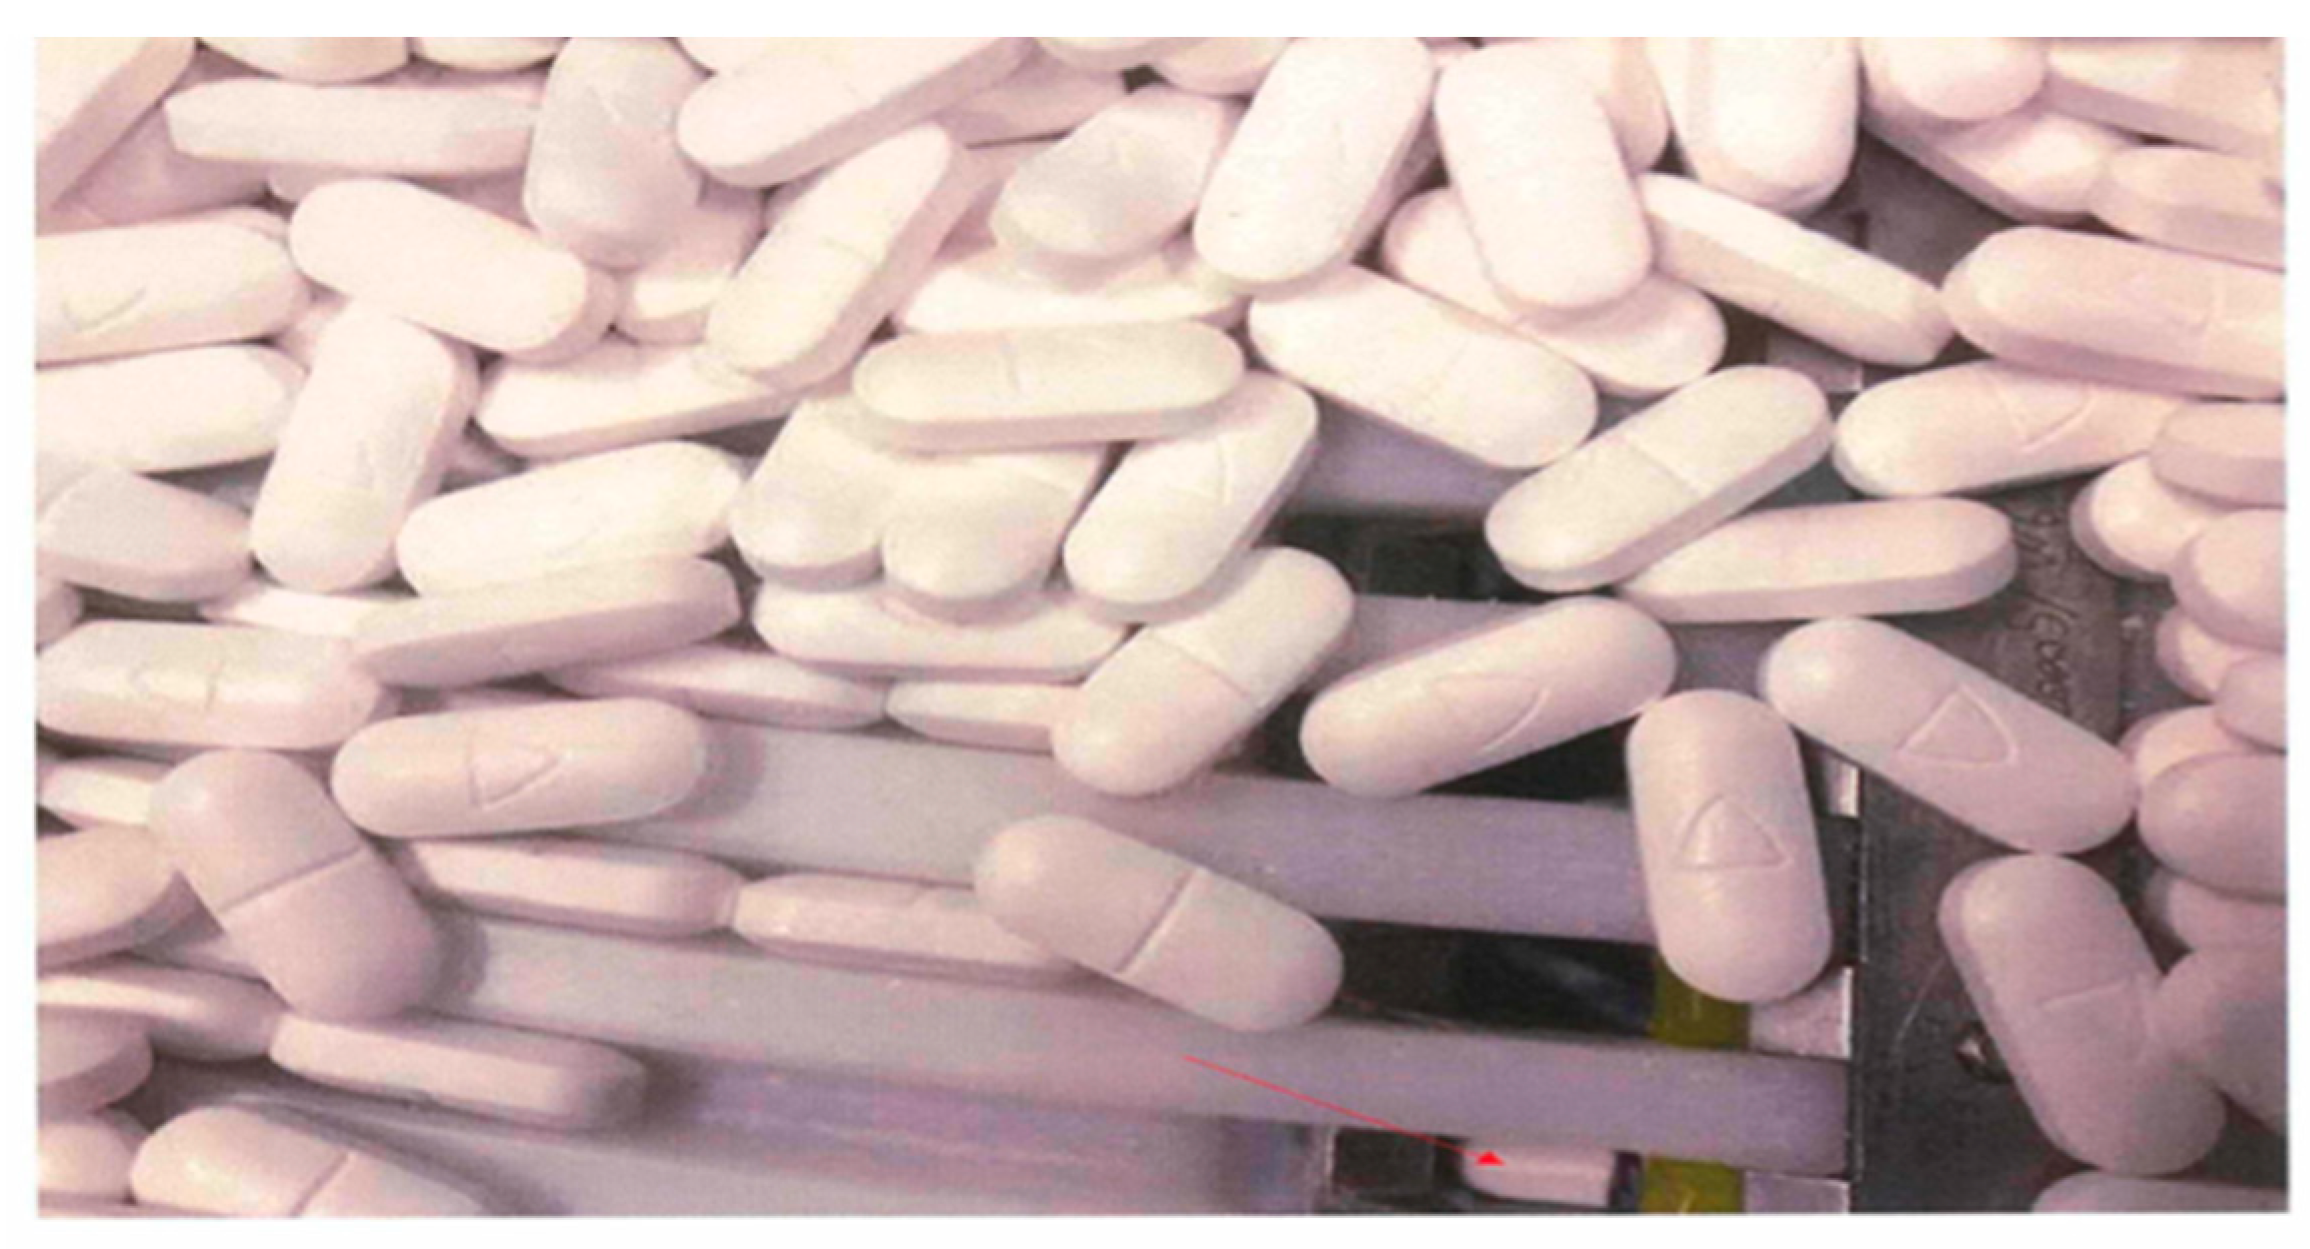
The team observed what was transpiring: tablets in the feed-bowl system fall into one of twelve feed lanes and due to gravity fall down the tablet feed chute and into a PVC pocket and are sent off to be sealed and packaged into a finished box identifying the product. However, if a half tablet gets into the feed lane, it will turn 90 degrees and face lengthways causing a blockage in the feed chute. Figure 10 and Figure 11 demonstrate a visual on what is happening in the feed system.
With the feed chute blocked, no further tablets within that lane can continue along to the PVC pocket and then get packaged. When the vision system camera detects four consecutive empty pockets it stops the packaging line. The operator then re-starts the line as per the standard work (procedure) in Table 1 on Standard Work.
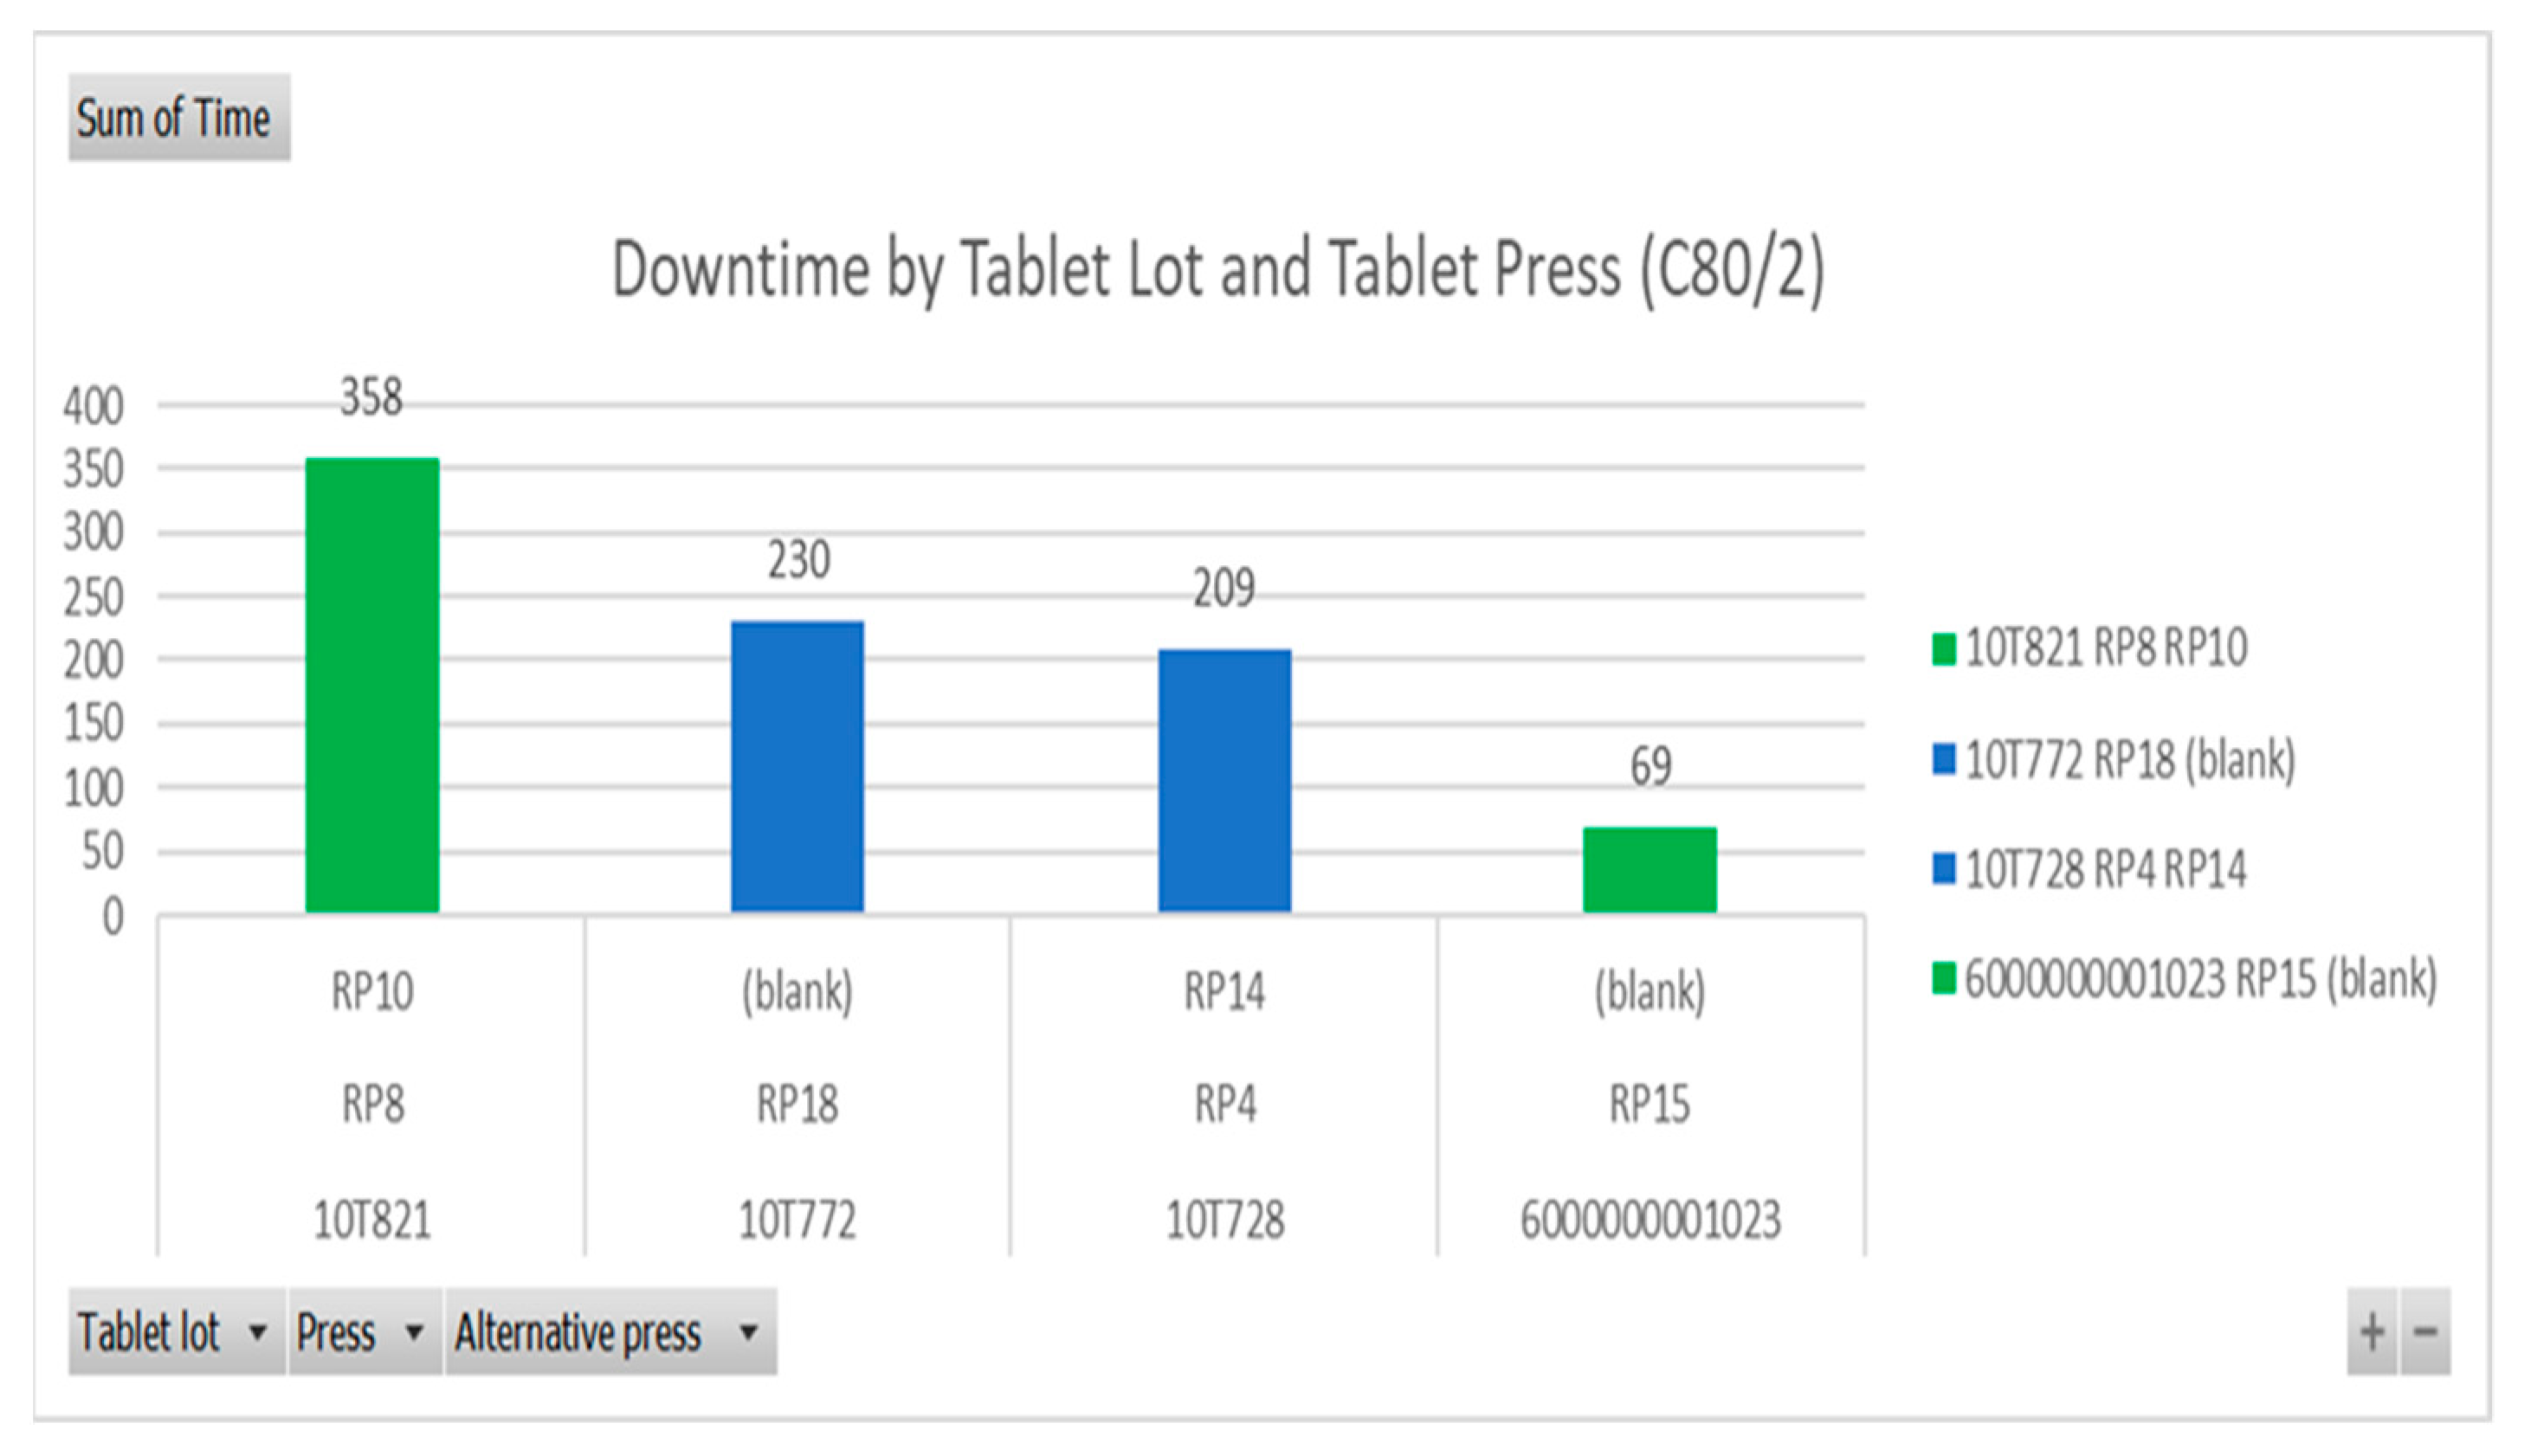
Most downtime was observed when loading or running product type 10C821 as per Figure 12.
The research team wanted to understand when tablets break. The packaging department is the last process in the manufacturing process and an inspection was carried out before packaging to ensure product was conforming to specification before going into packaging and was not broken.
The team conducted a physical 100% inspection on four of the 80 kg drums to ensure the packaging operation received defect-free product in order to properly conduct the trial. Upon inspection, 751 defects (half tablets) were inspected out of the process prior to reaching the packaging department. The team deduced that these defects were created from the coating department or during transportation to warehouse, this can be said with confidence as the inside of the tablet is uncoated therefore, ruling out the compression department.
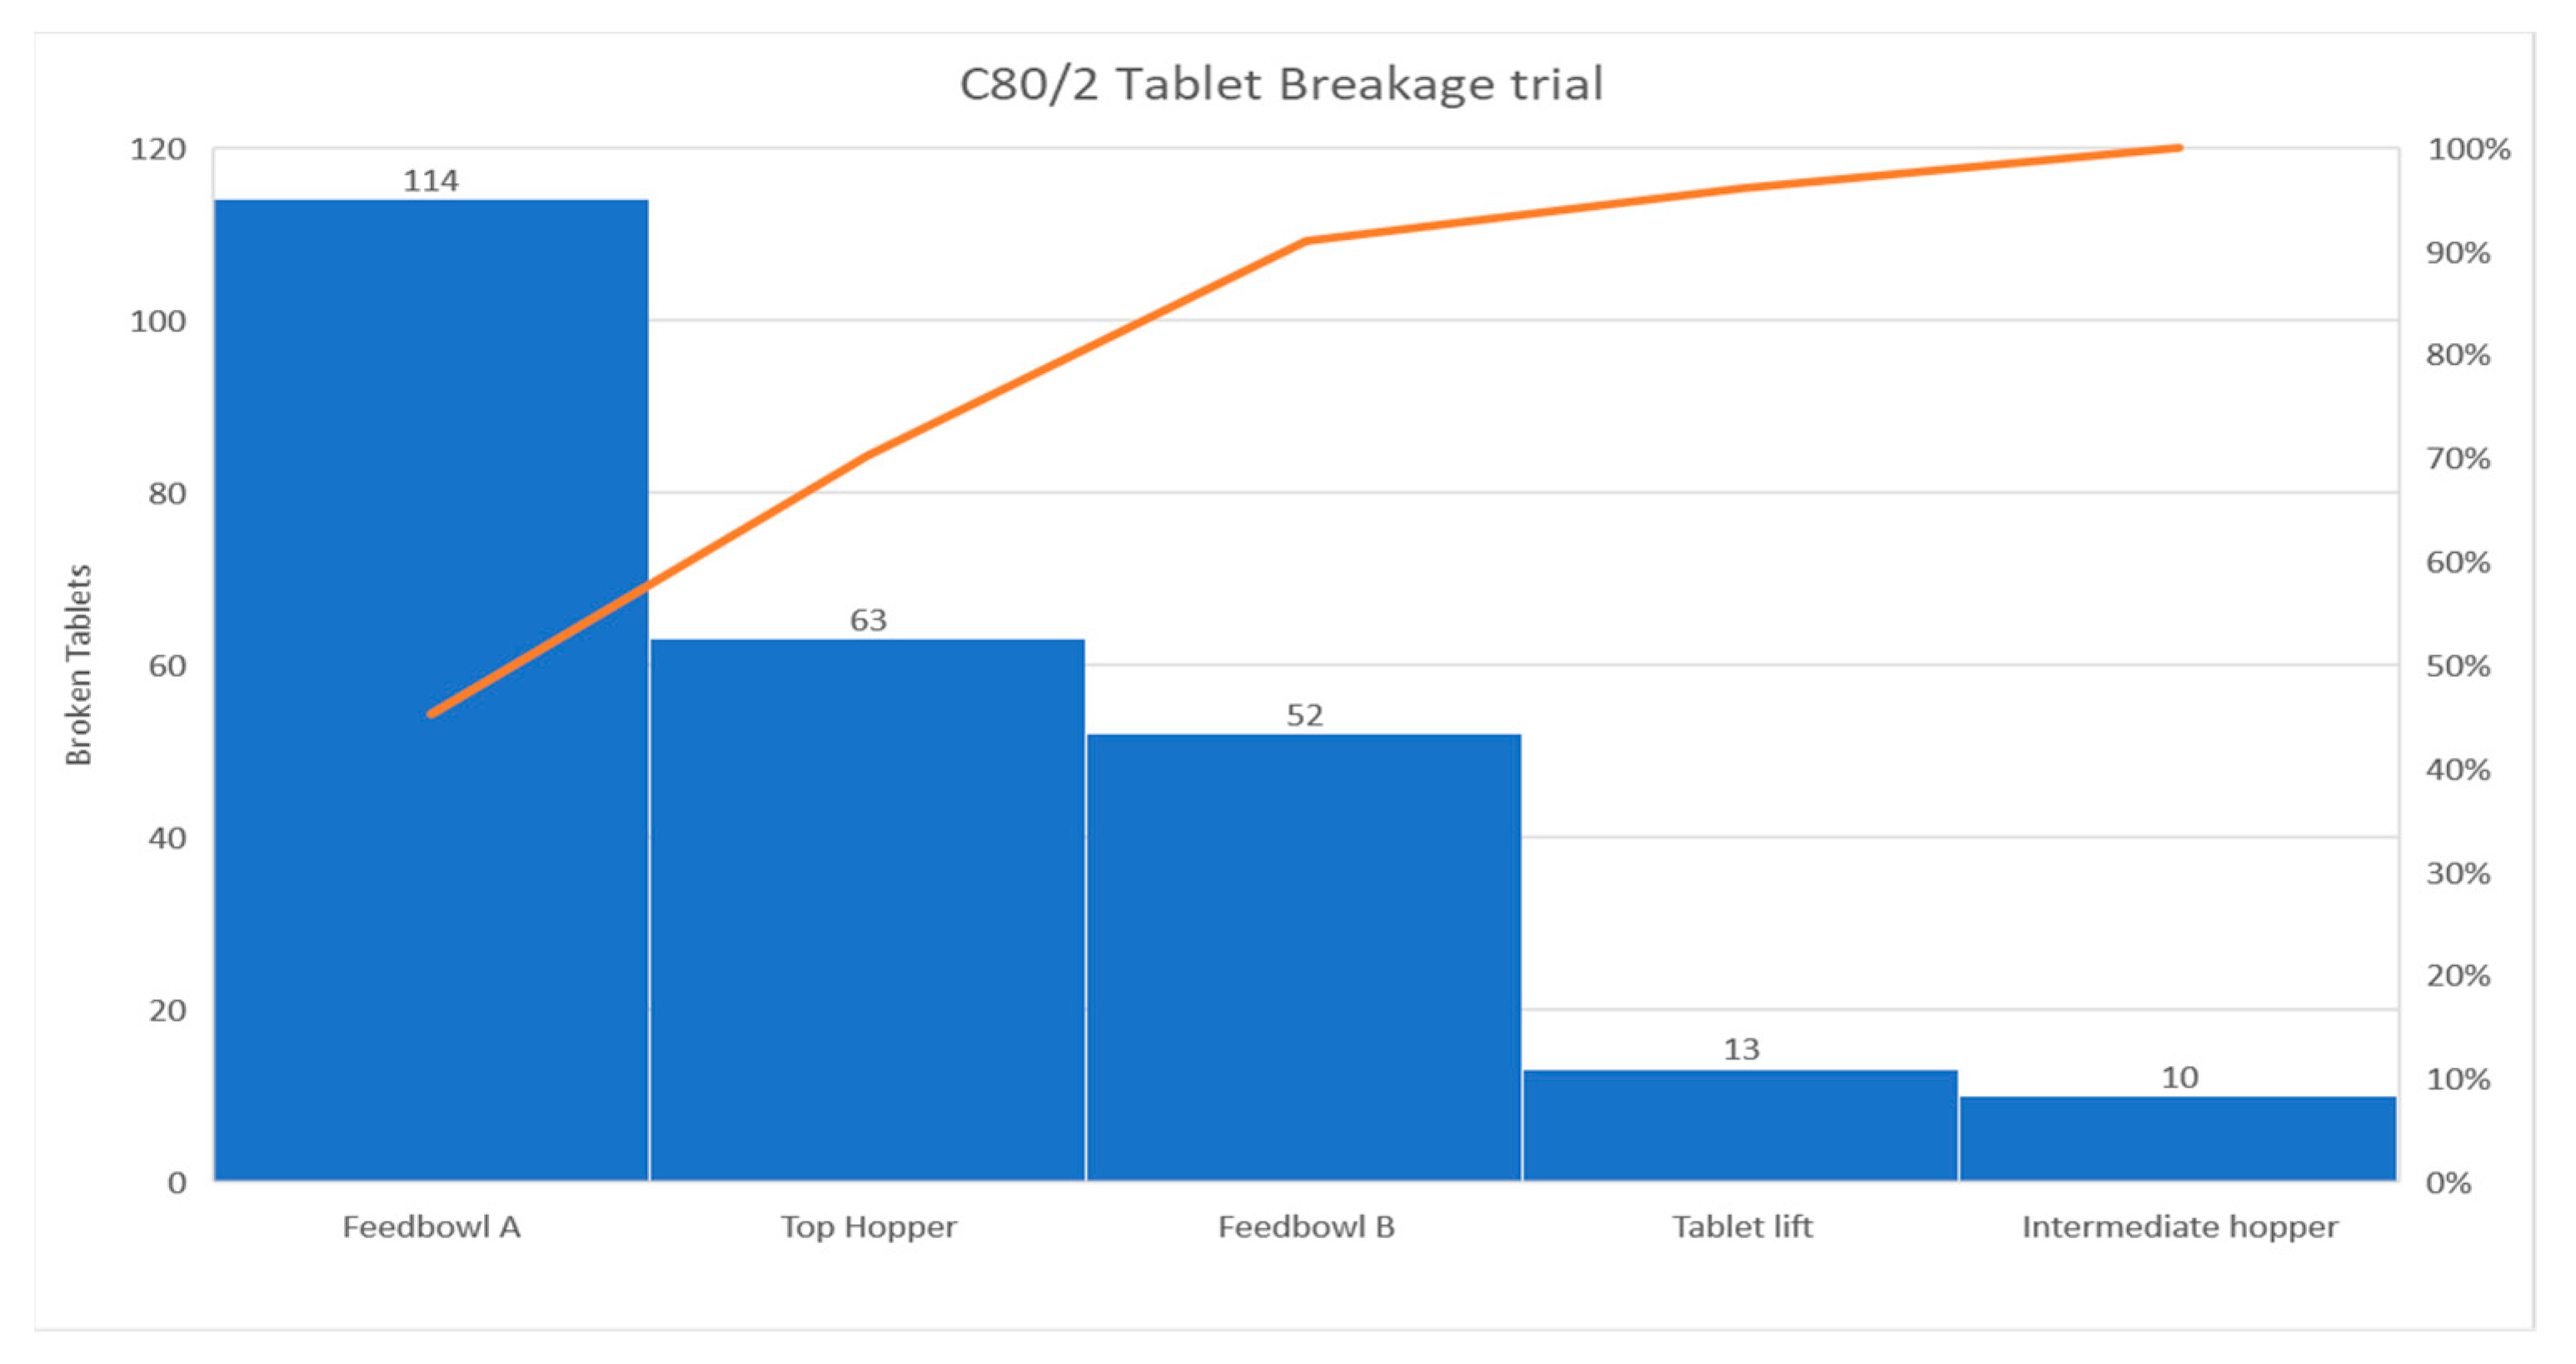
If the defect was created in the compression process, the half tablet would have coating solution on it, as the compression department is the preceding (upstream) department from coating. This was not the case from the team’s observations. As shown in Figure 13, the trial proved that the tablet breaks shown were in the packaging line and demonstrated when specifically, most tablets were breaking within the line. The team needed to ascertain why tablets are breaking in Packaging and confirm tablet robustness. From Figure 13, when tablets break within the process, it happens in a very specific area. Feed-bowl A is the entry point to the tablet feed bowl system. In total, 114 breaks were observed at this point. Also feeding into this area is the top hopper which saw 63 breaks. Of the 252 breaks observed, 70% of them were in the feed bowl A and top hopper areas. The team rapidly orientated to concentrate in this area.
The team needed to ascertain if a step change in the process was contributing to performance variability, i.e., does the issue happen straight after a downstream breakdown? Does it happen on production restart after breaks? Does it happen immediately after restart of a comprehensive clean? All these questions need to be considered and eliminated to provide a definitive root cause and corrective action (RCA).

3.4. Coating Department

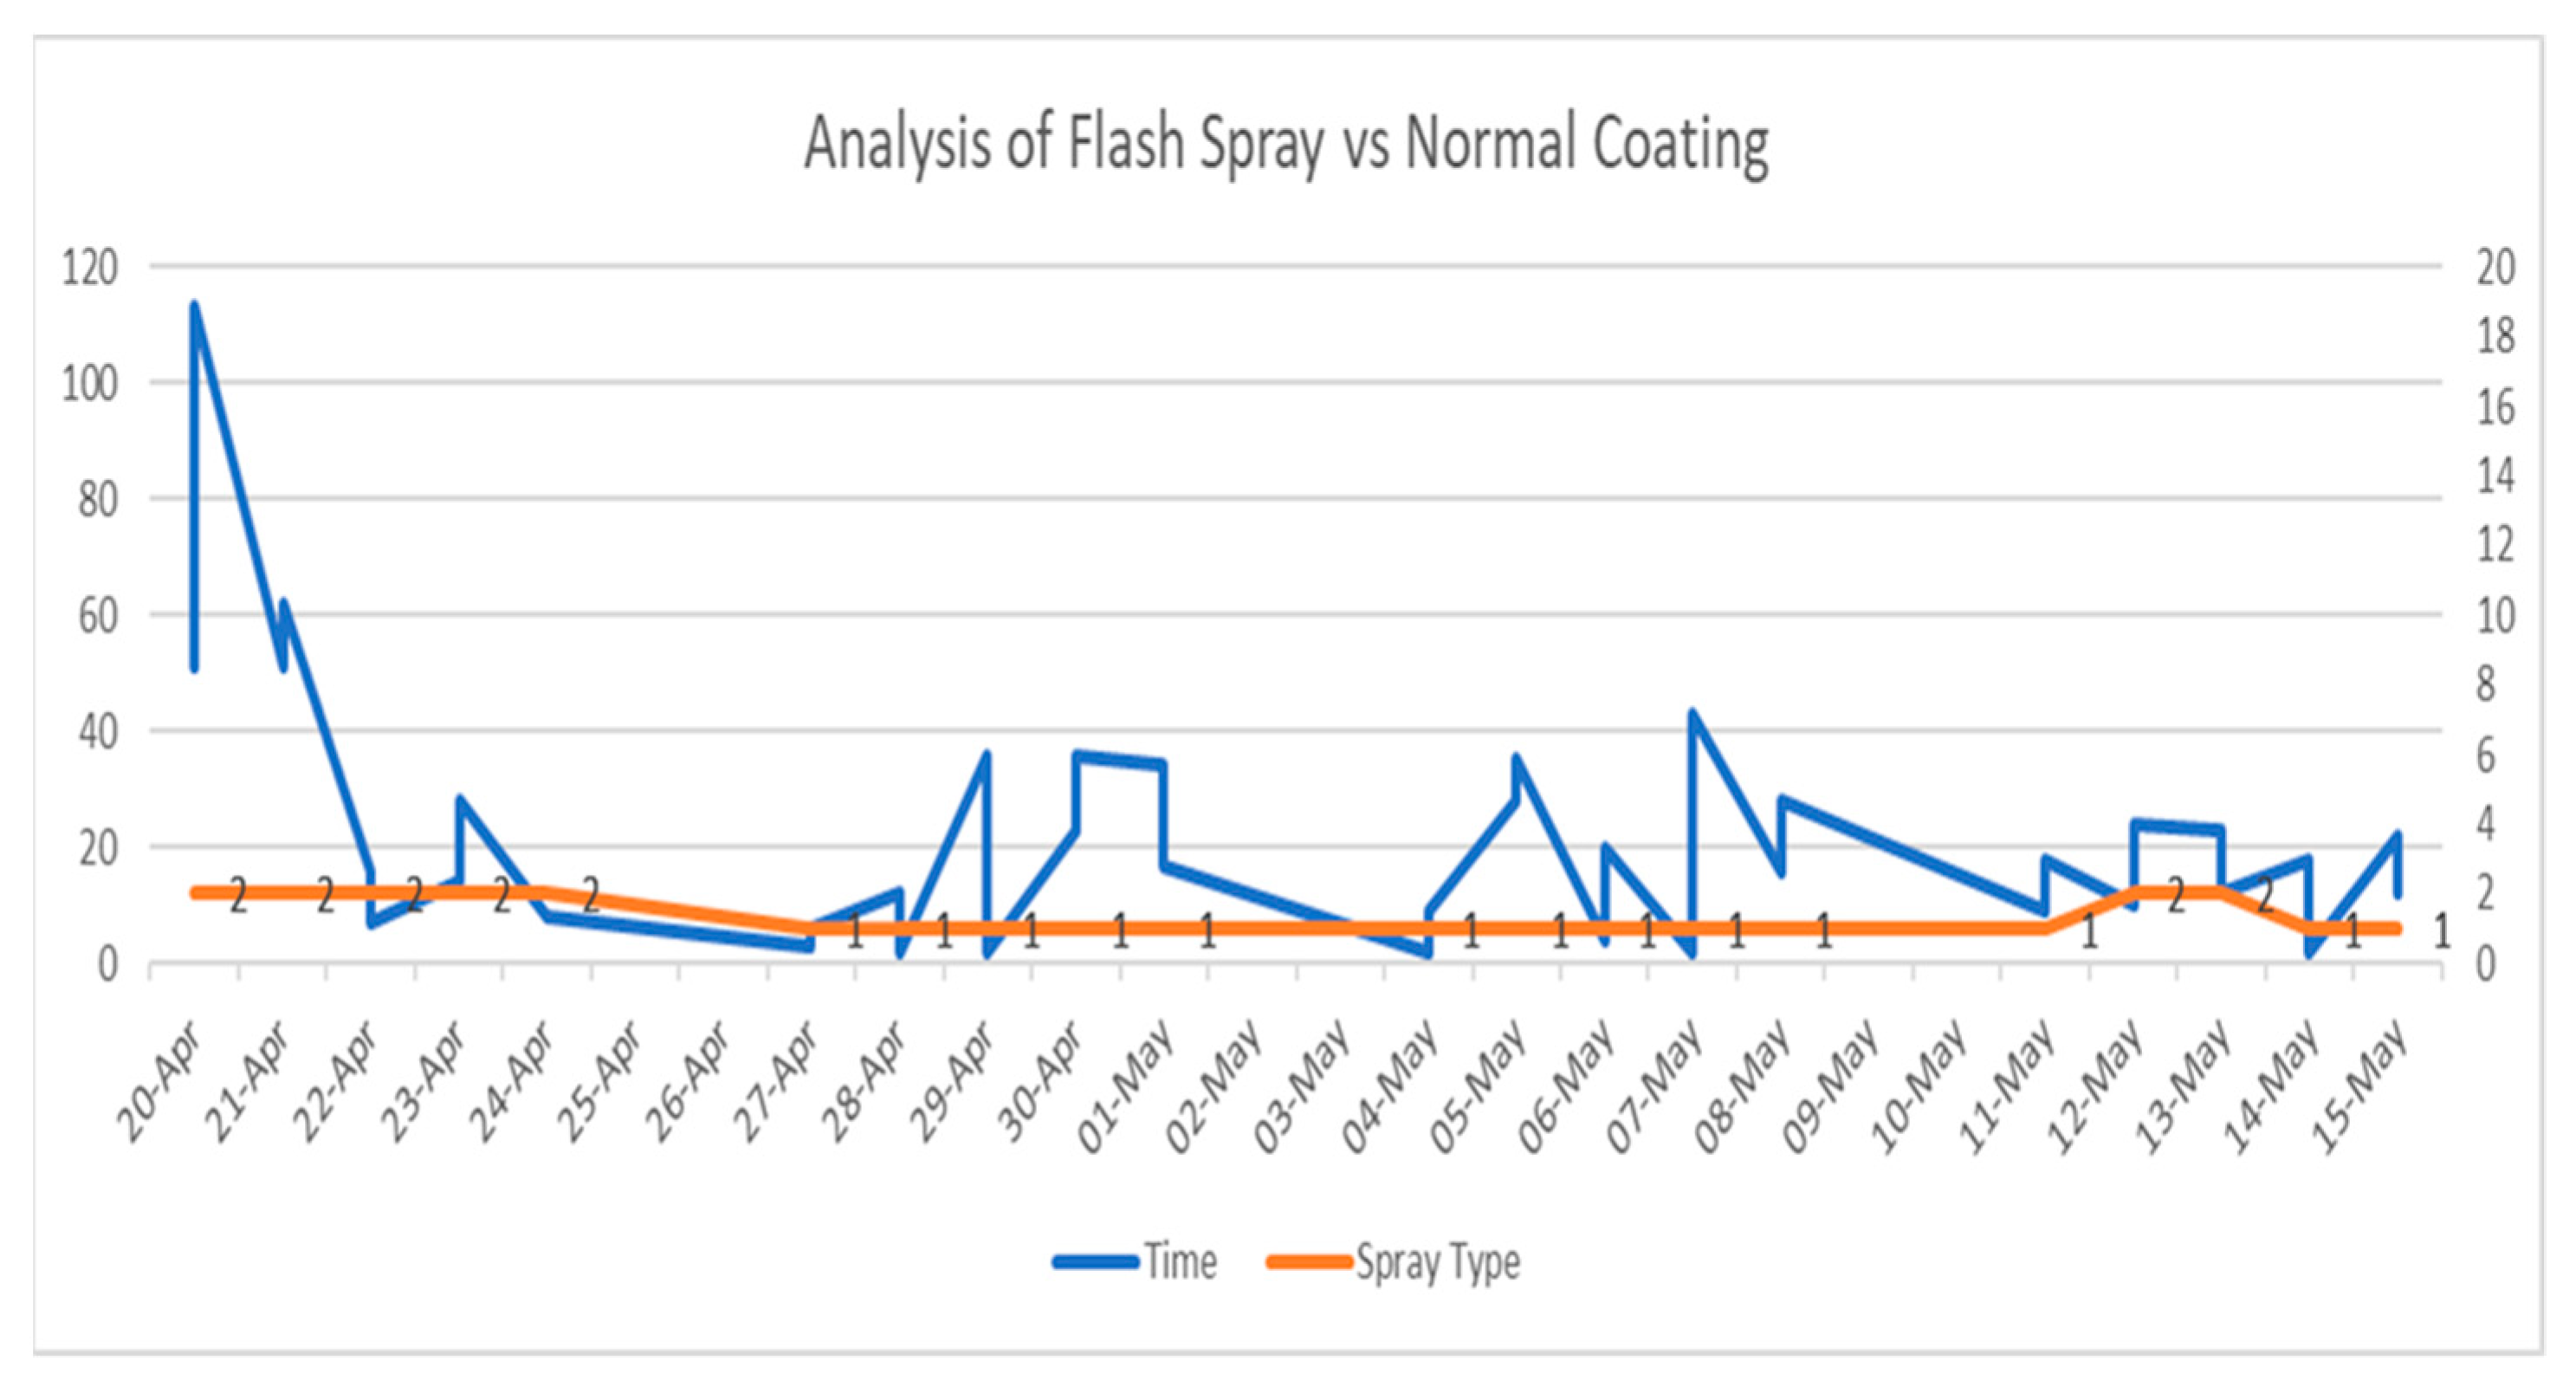
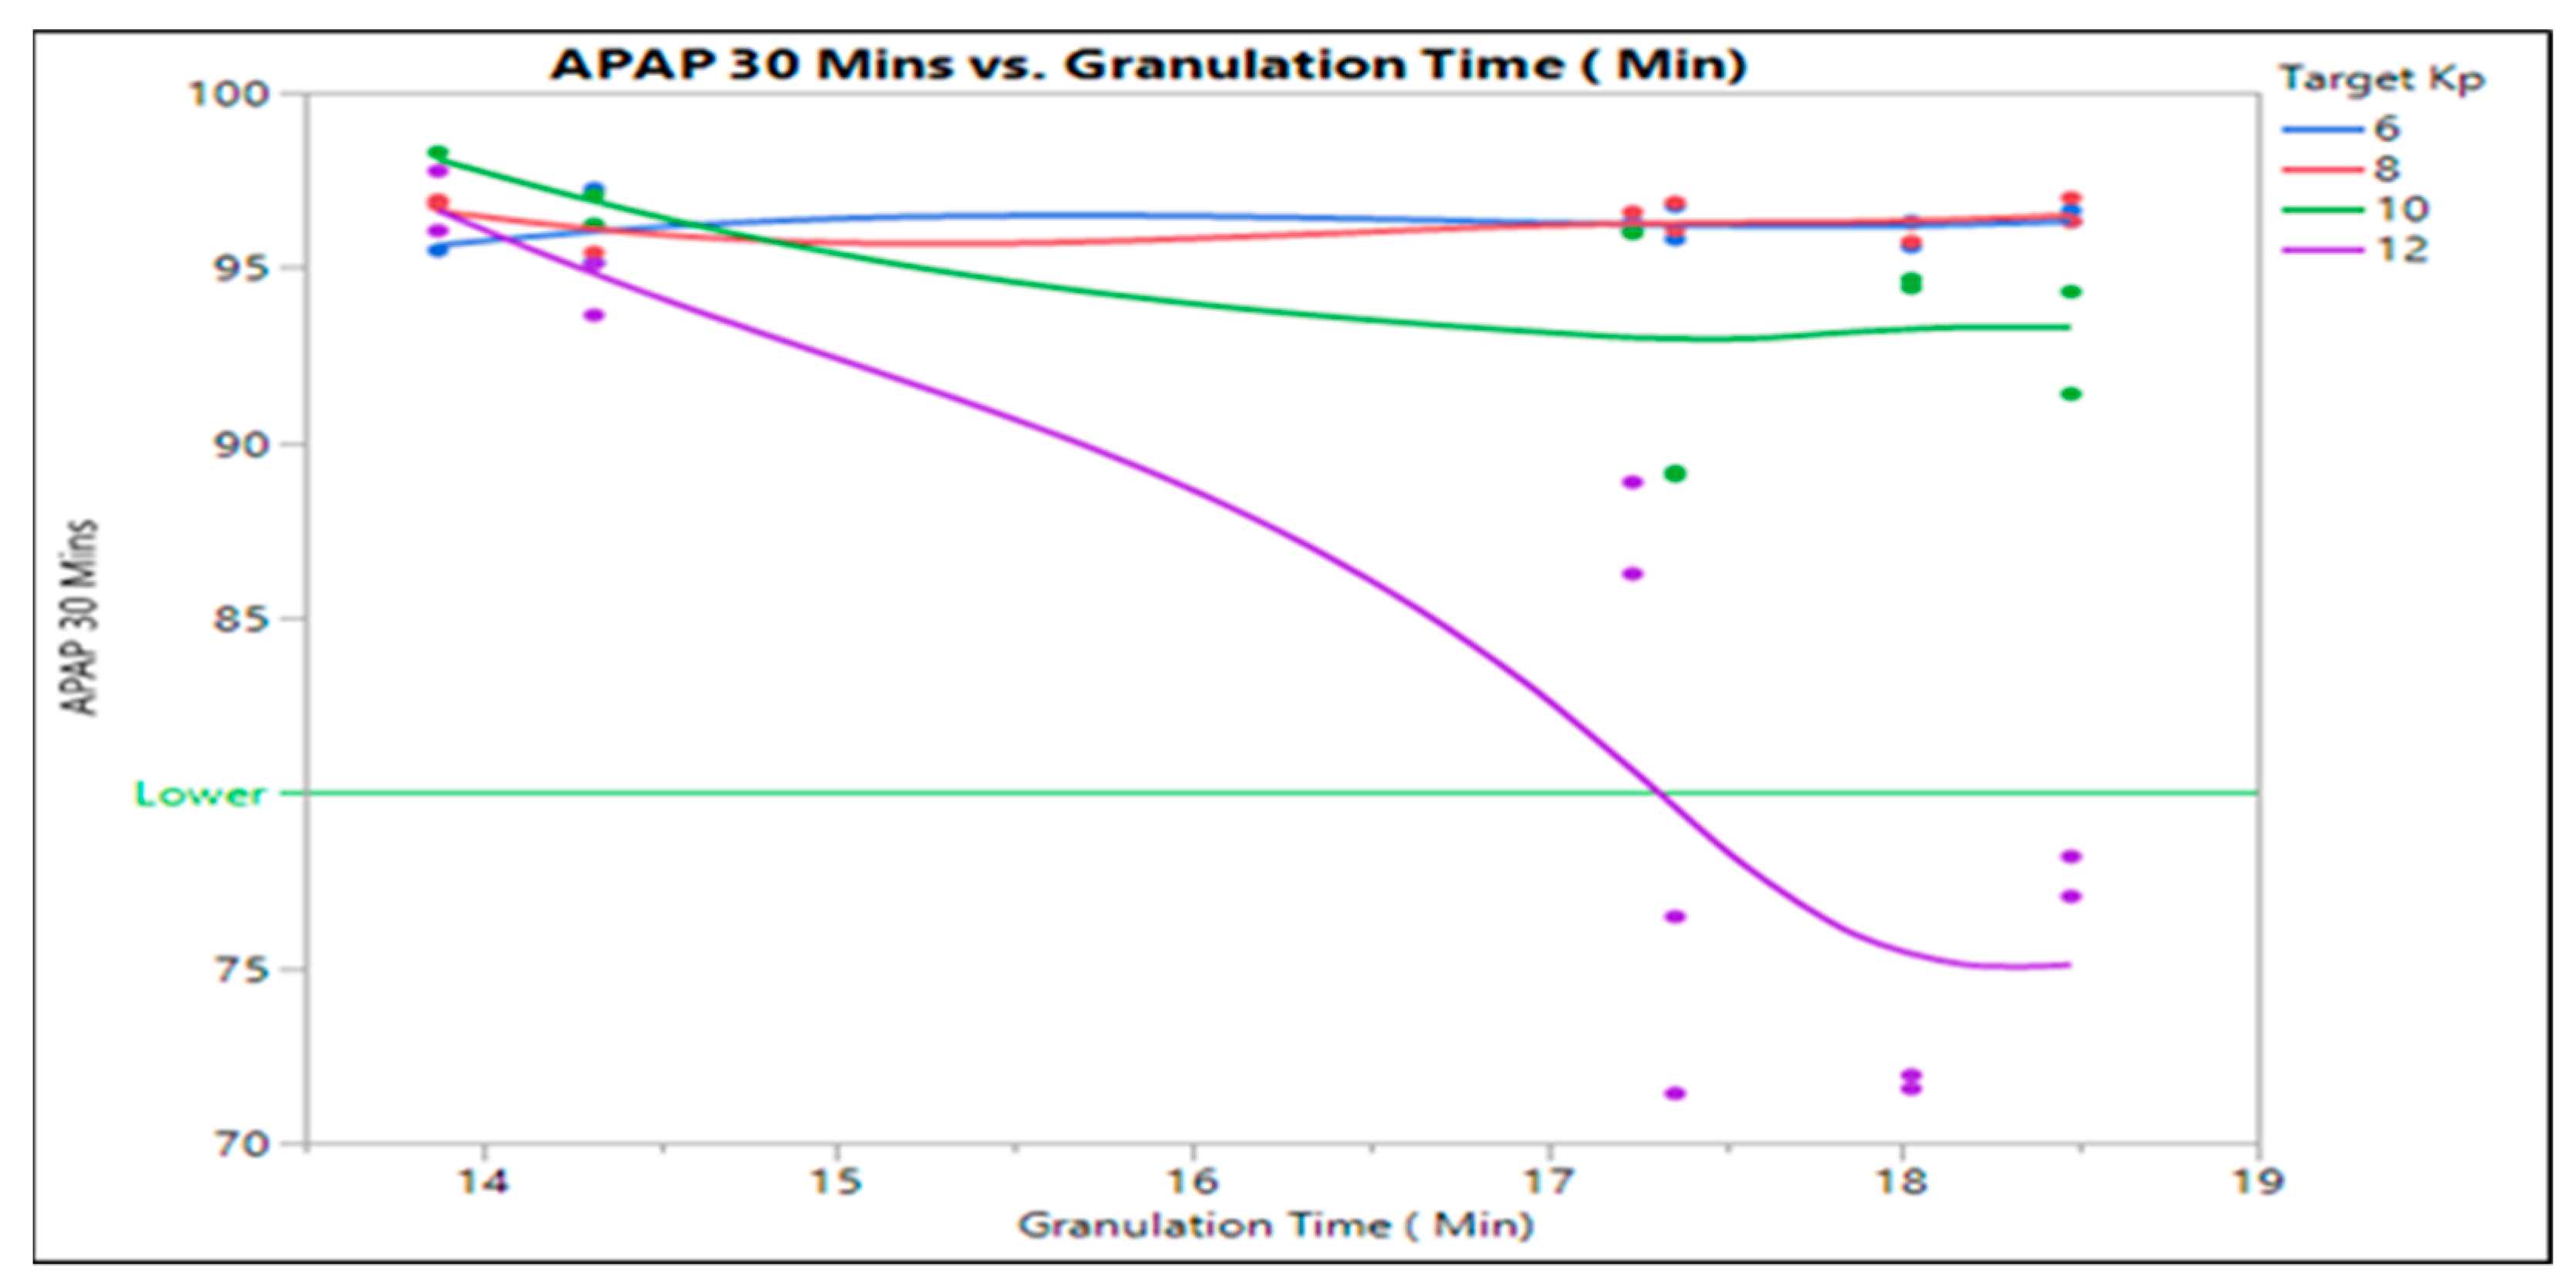
The first characteristic to consider was the hypothesis if the upstream process, the Coating department, was a contributory factor to breakage. Typically, the coating department sprays tablets for 72 min. However, a process change had moved some product portfolios to a ‘flash spray’ which means it is coated for 22 min. The temperature within the coating pan is 52 degrees, therefore the team needed to see if the shortened time for tablets in the coating pan reduced the baking time effect.
A normal spray with a 72-min spray time shows a typical tablet of 10 KP entering the coating process and raises to 13 KP minutes after the process.
Flash Spray tablets show the KP value as above 10 KP on entry to the process and 10KP minutes after the process—showing no increase in hardness. To see if this change in spray time affected the performance of the tablet on the packaging line—the downtime due to tablet issues was compared between normal and full spray process.
As per Figure 14, there was no downtime difference due to tablet feed issues when the C80/2 line ran on Flash spray vs. Normal spray and there was no difference in downtime over the period of 4 weeks between the two spray types. The team then moved to understand whether there is a spike in downtime due to the restart of the packaging line after a changeover and/or break. The potential root cause of spray type duration affecting tablet hardness and resulting in breakages was rejected as the tablet feed issues remained the same irrespective of spray type used in the coating process.

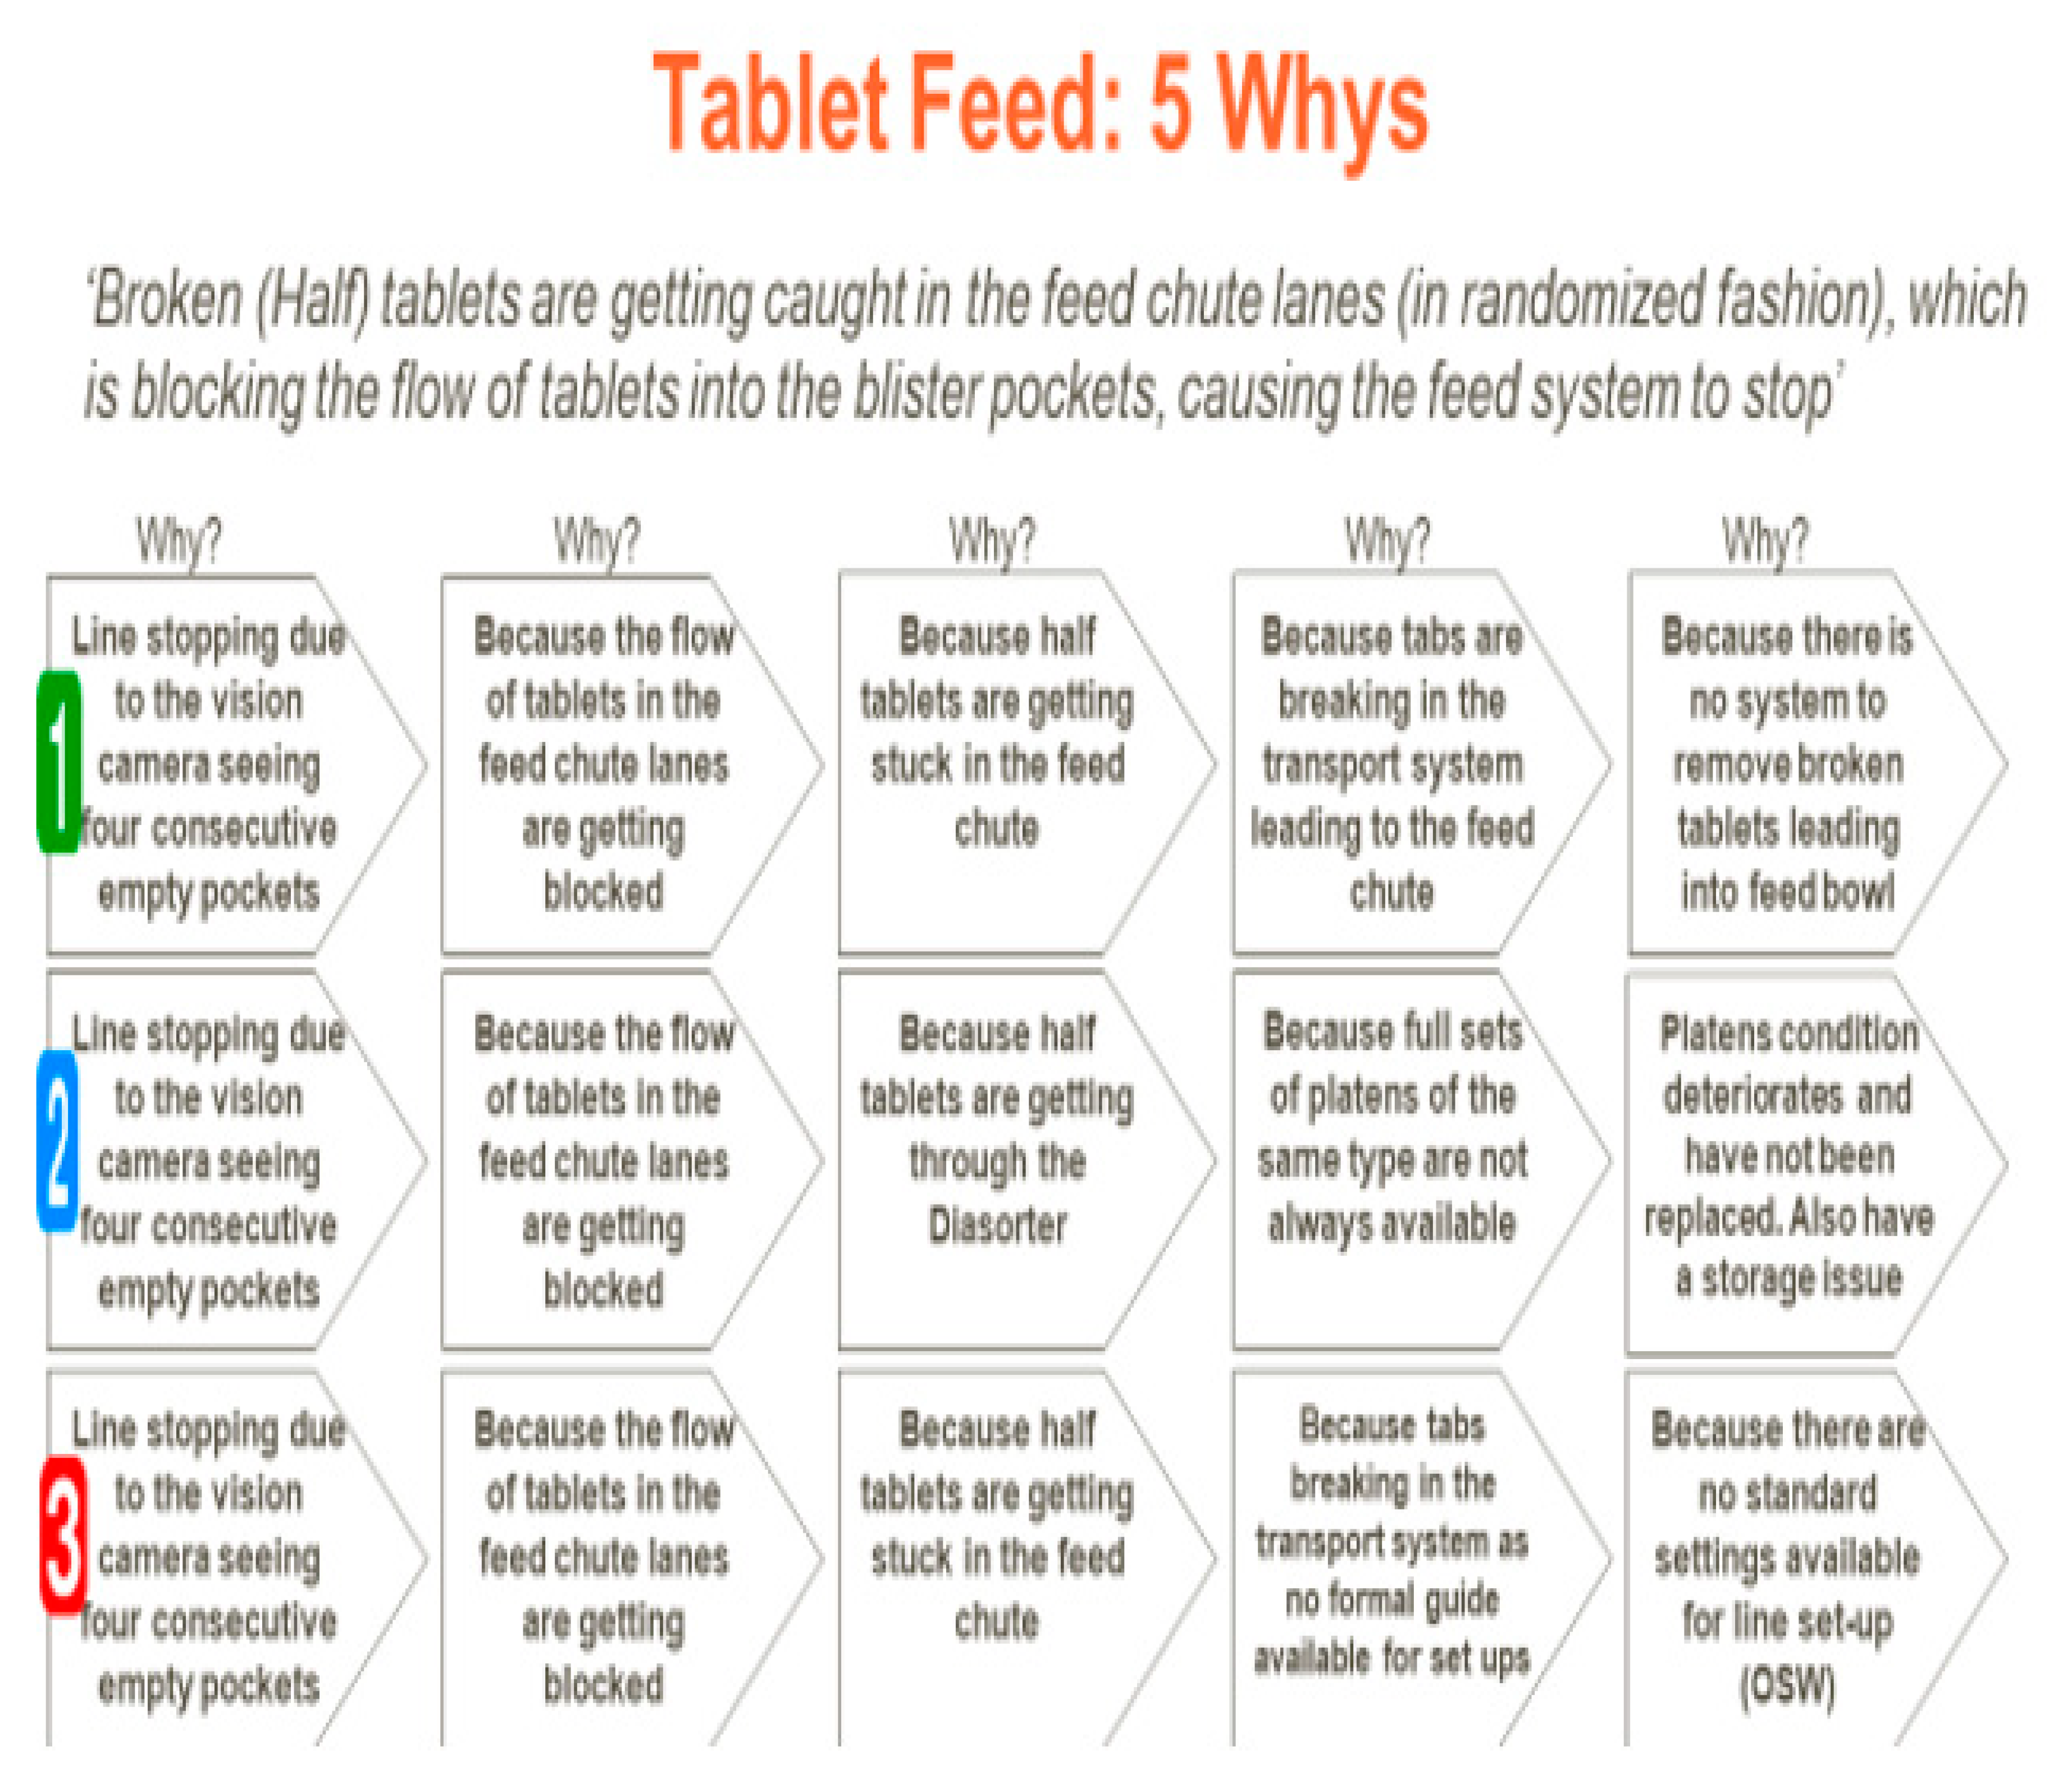
3.5. Refined Problem Statement

A refined problem statement could now be developed to reflect the current state and the information the team understands thus far:
-
Broken (Half) tablets are getting caught in the feed chute lanes (in randomized fashion), which is blocking the flow of tablets into the blister pockets, causing the feed system to stop.
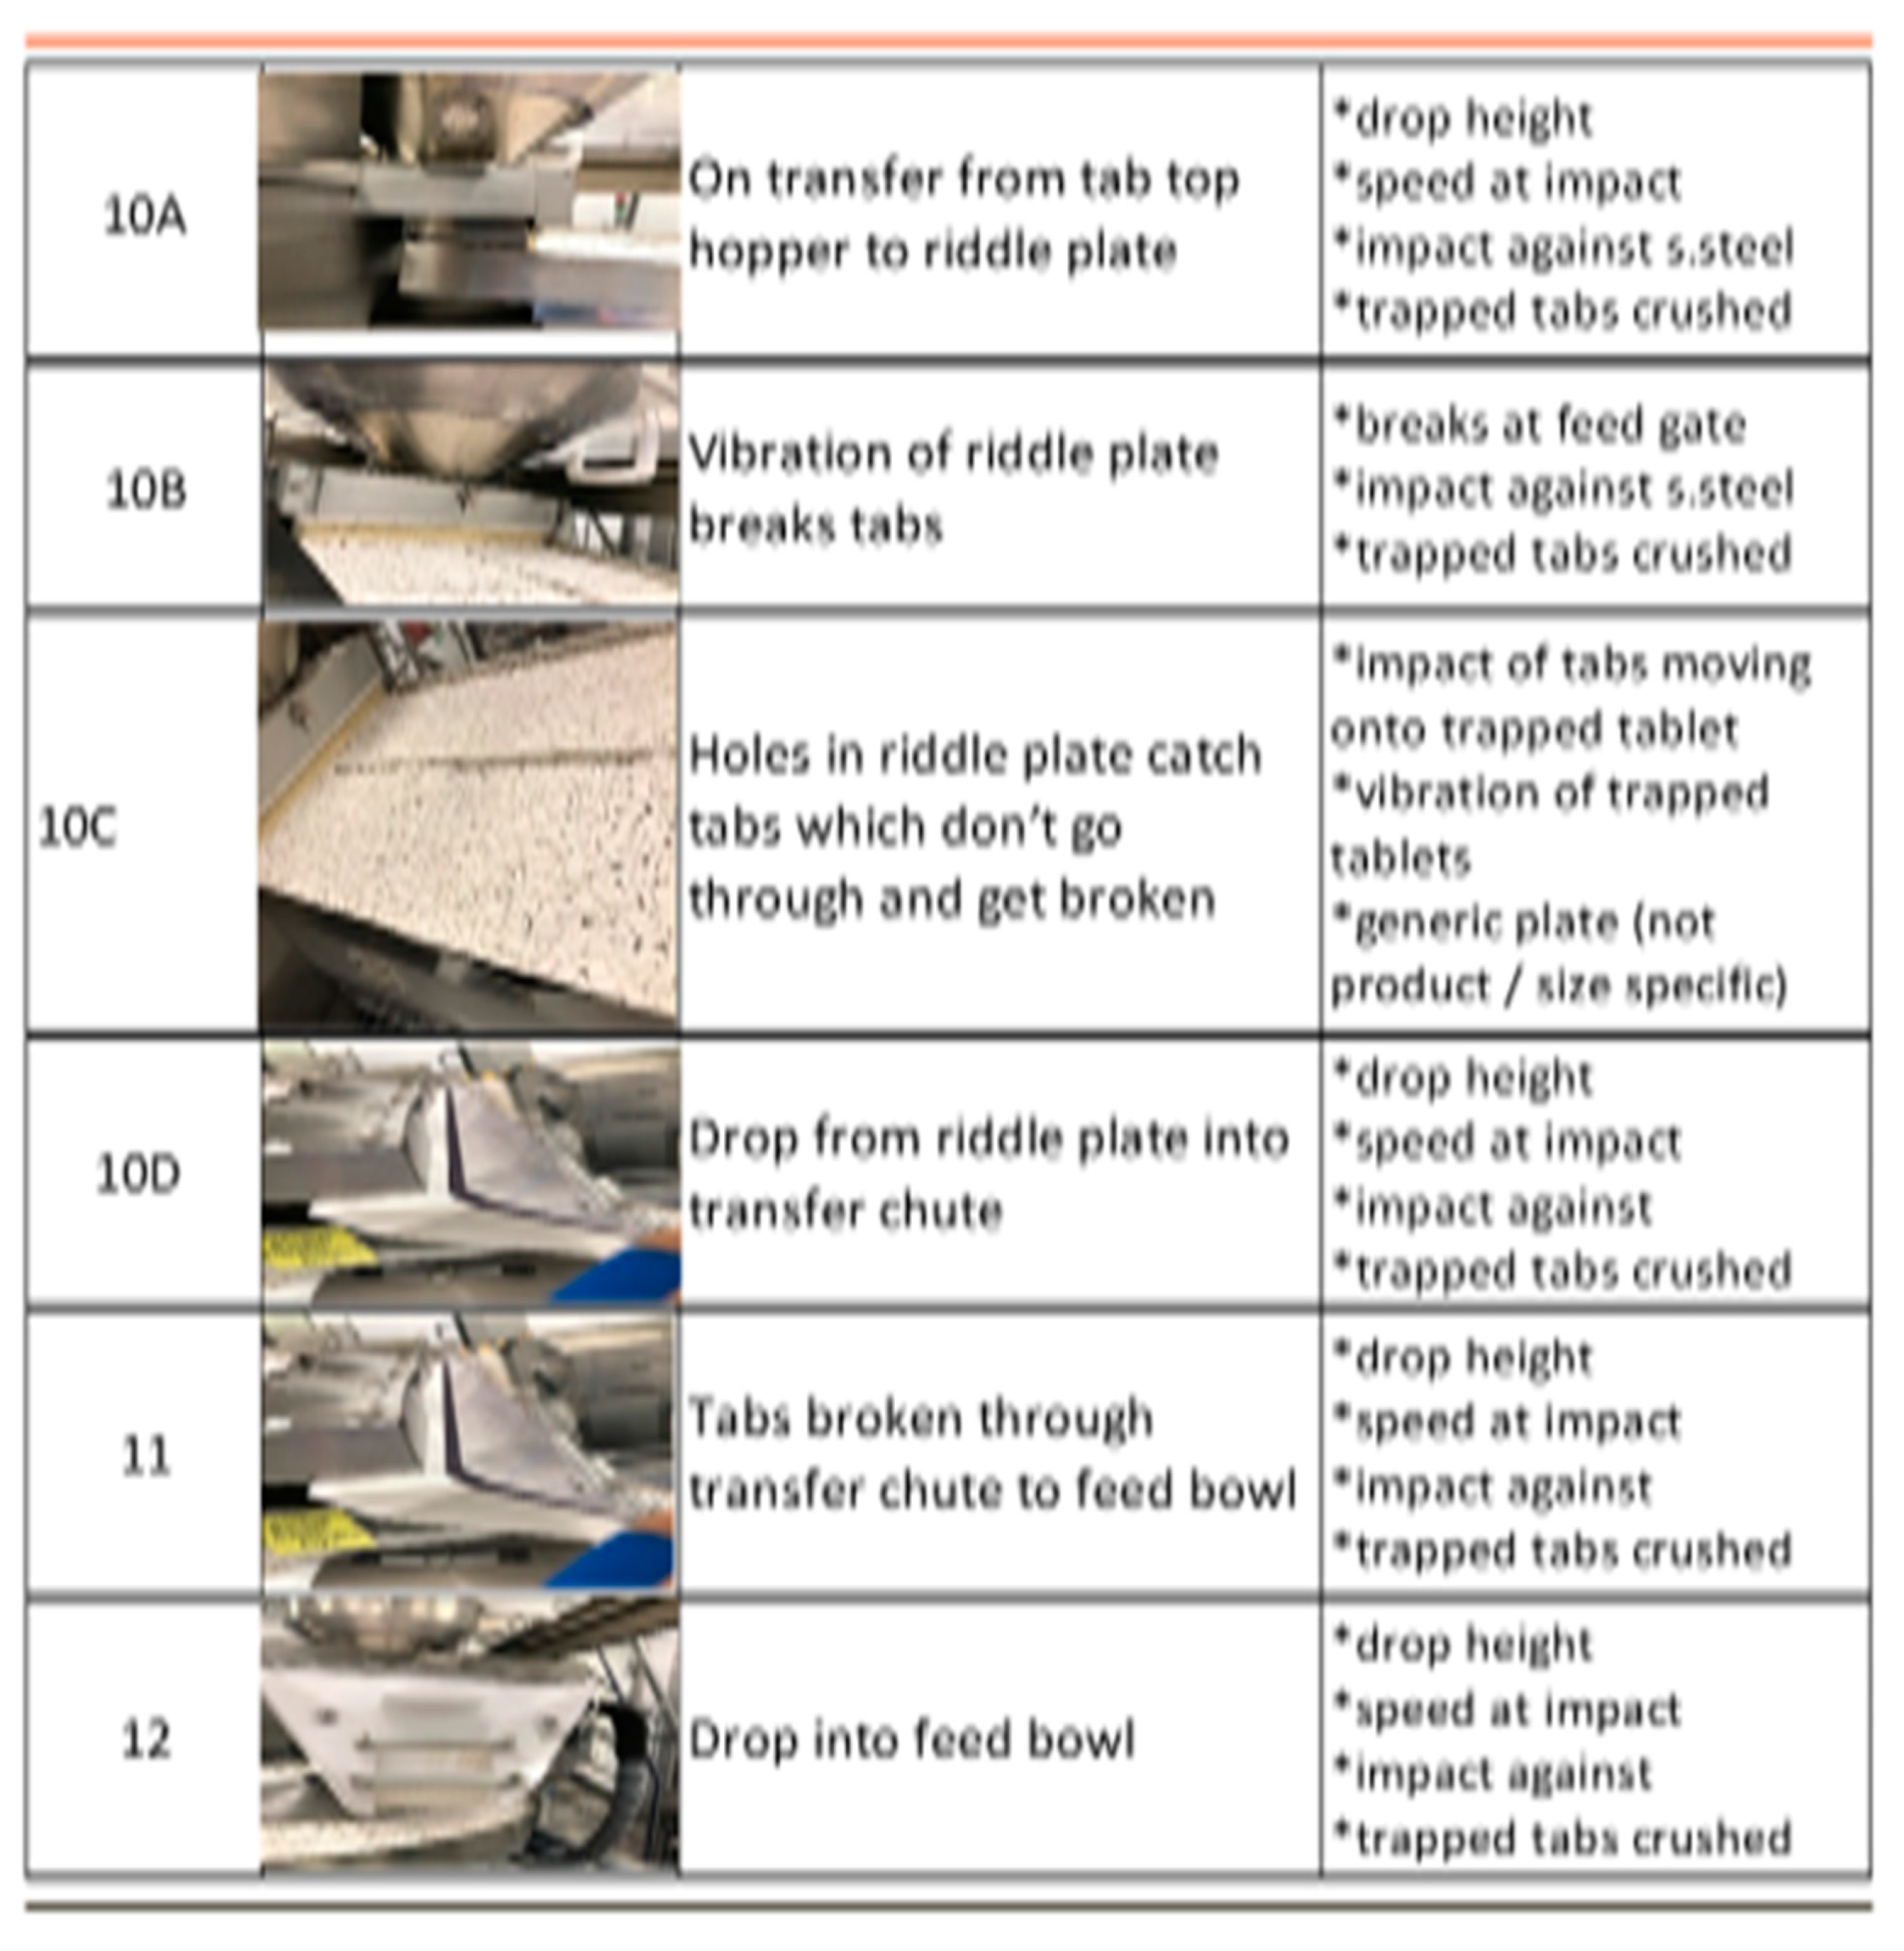
Based on the information obtained above, a deeper dive was conducted to see what is happening in the ‘Feed-bowl A’ area. This is where 70% of the breaks occurred. The team studied the entry of tablets to the feed hopper (Feed-bowl A) and broke down the sequence of the movement of tablets through this system and identified failure modes as per Figure 15.
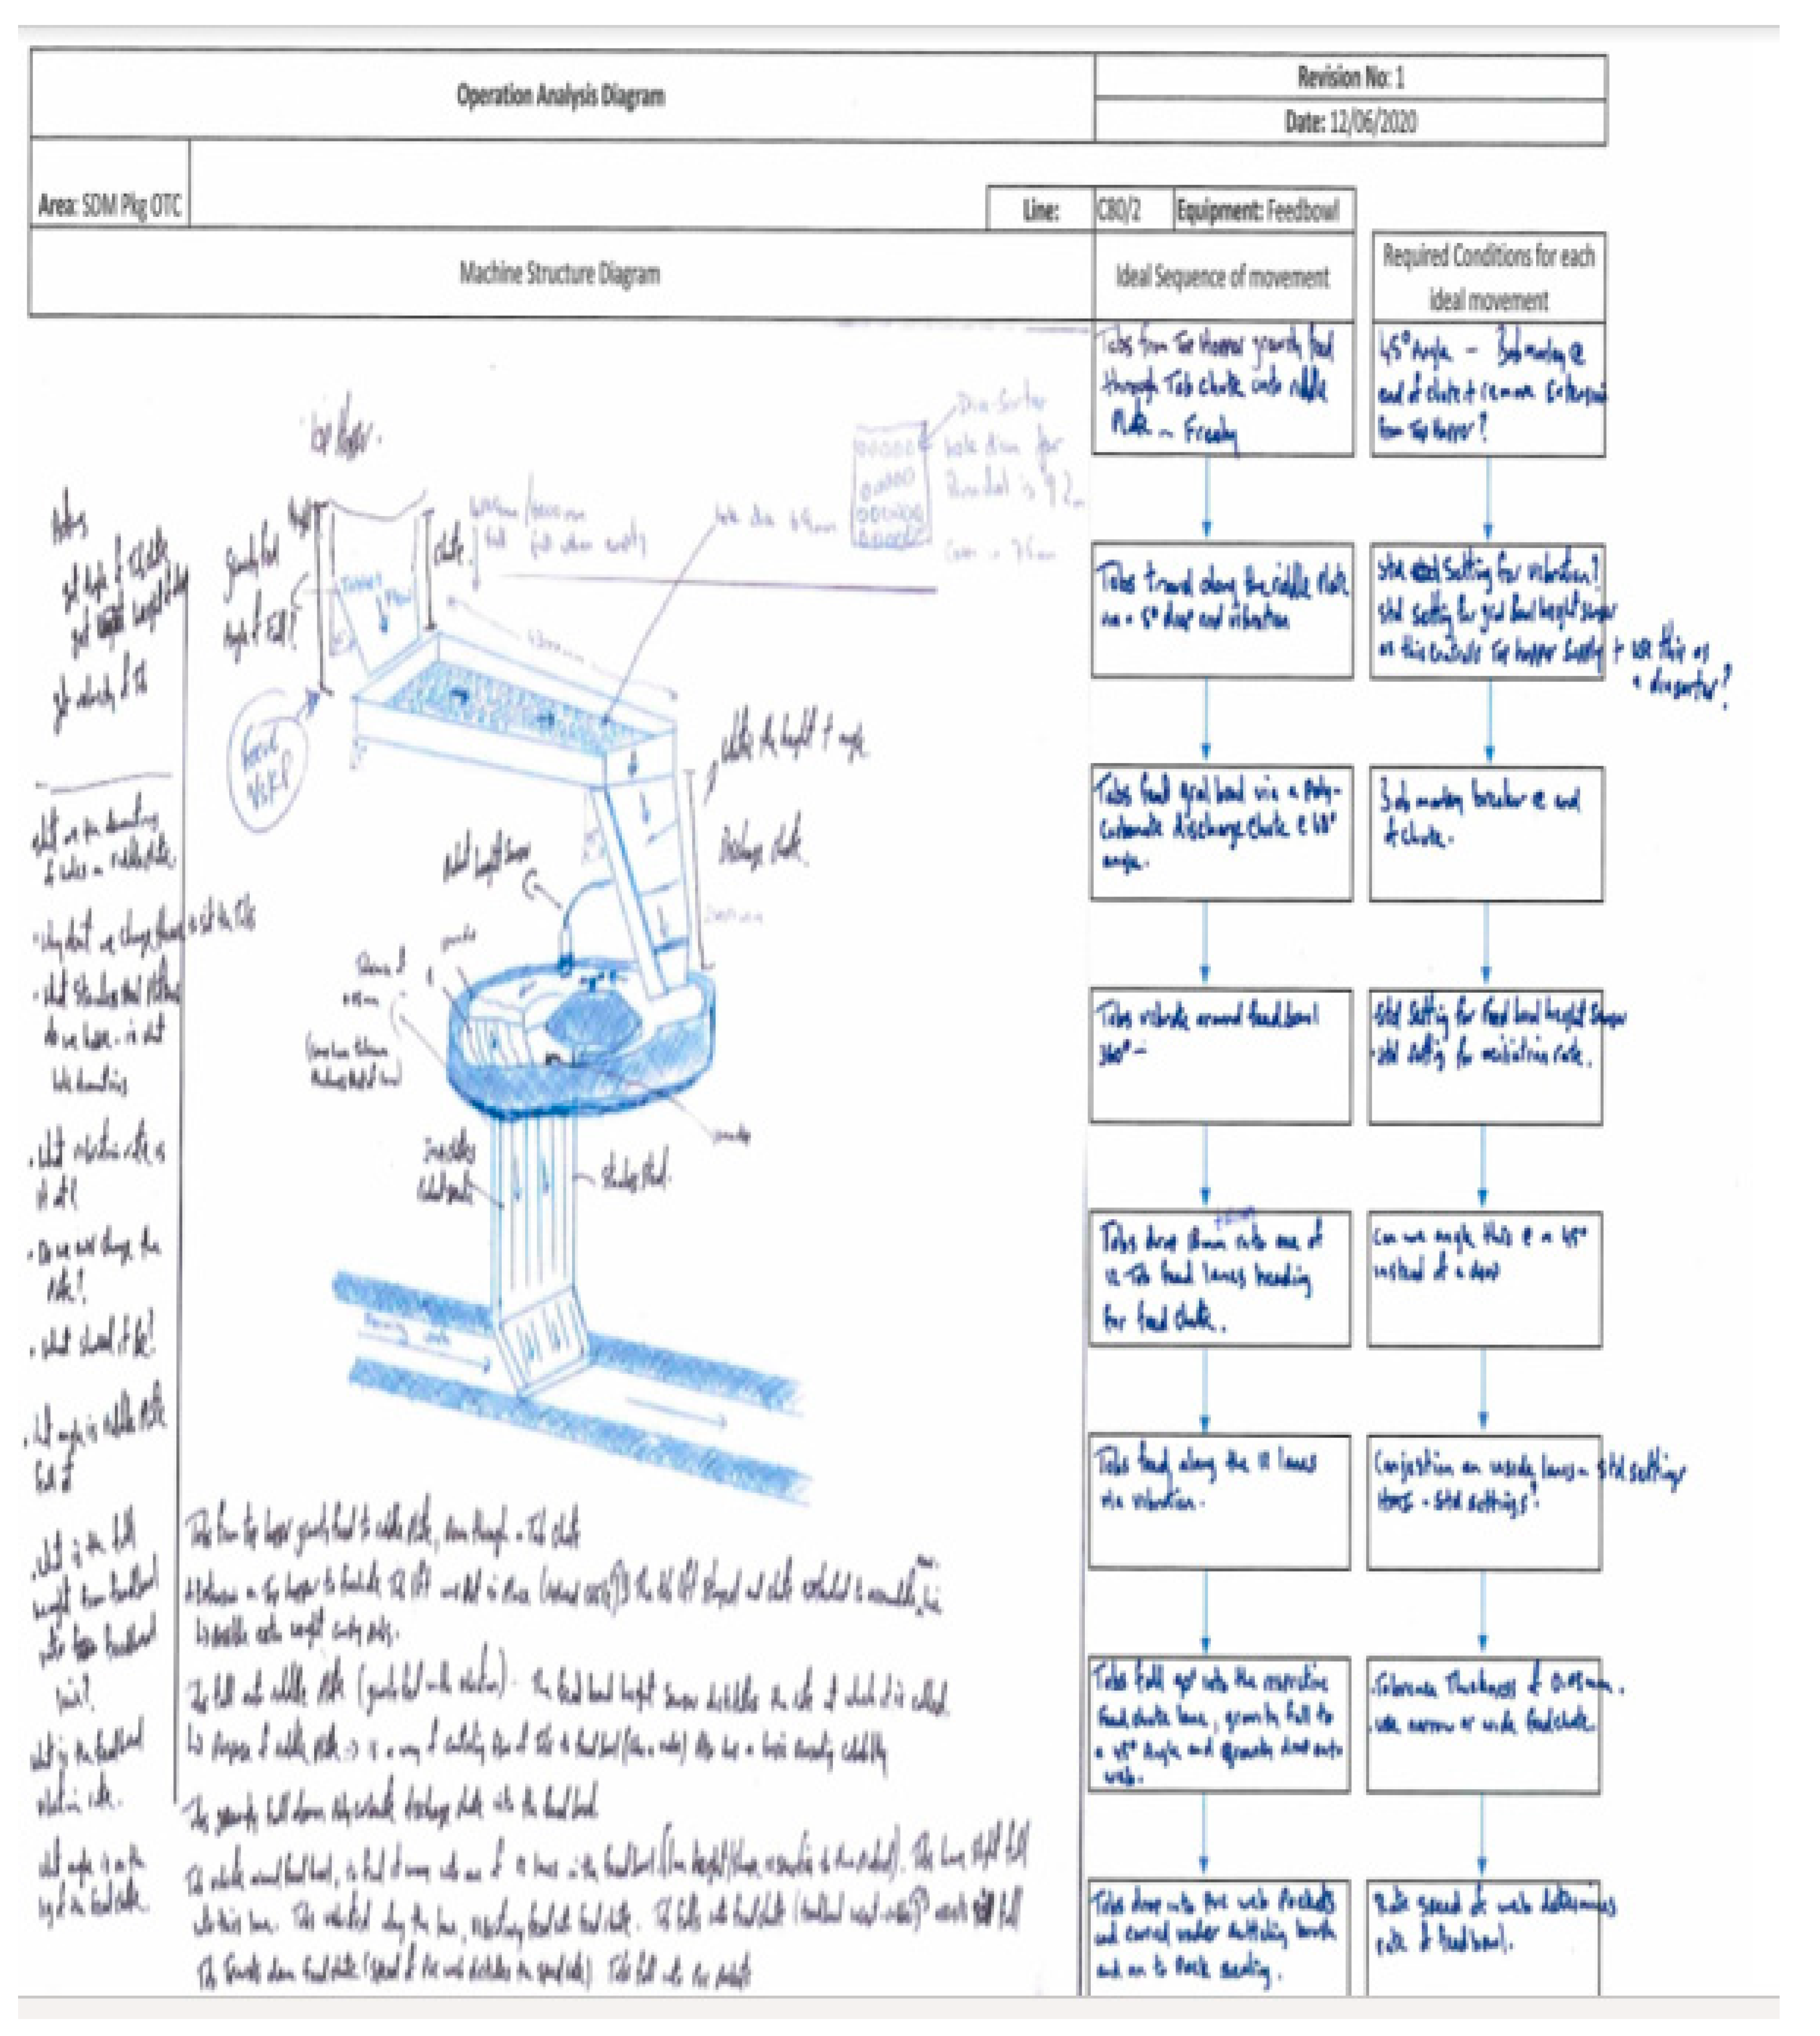
From this risk analysis in 
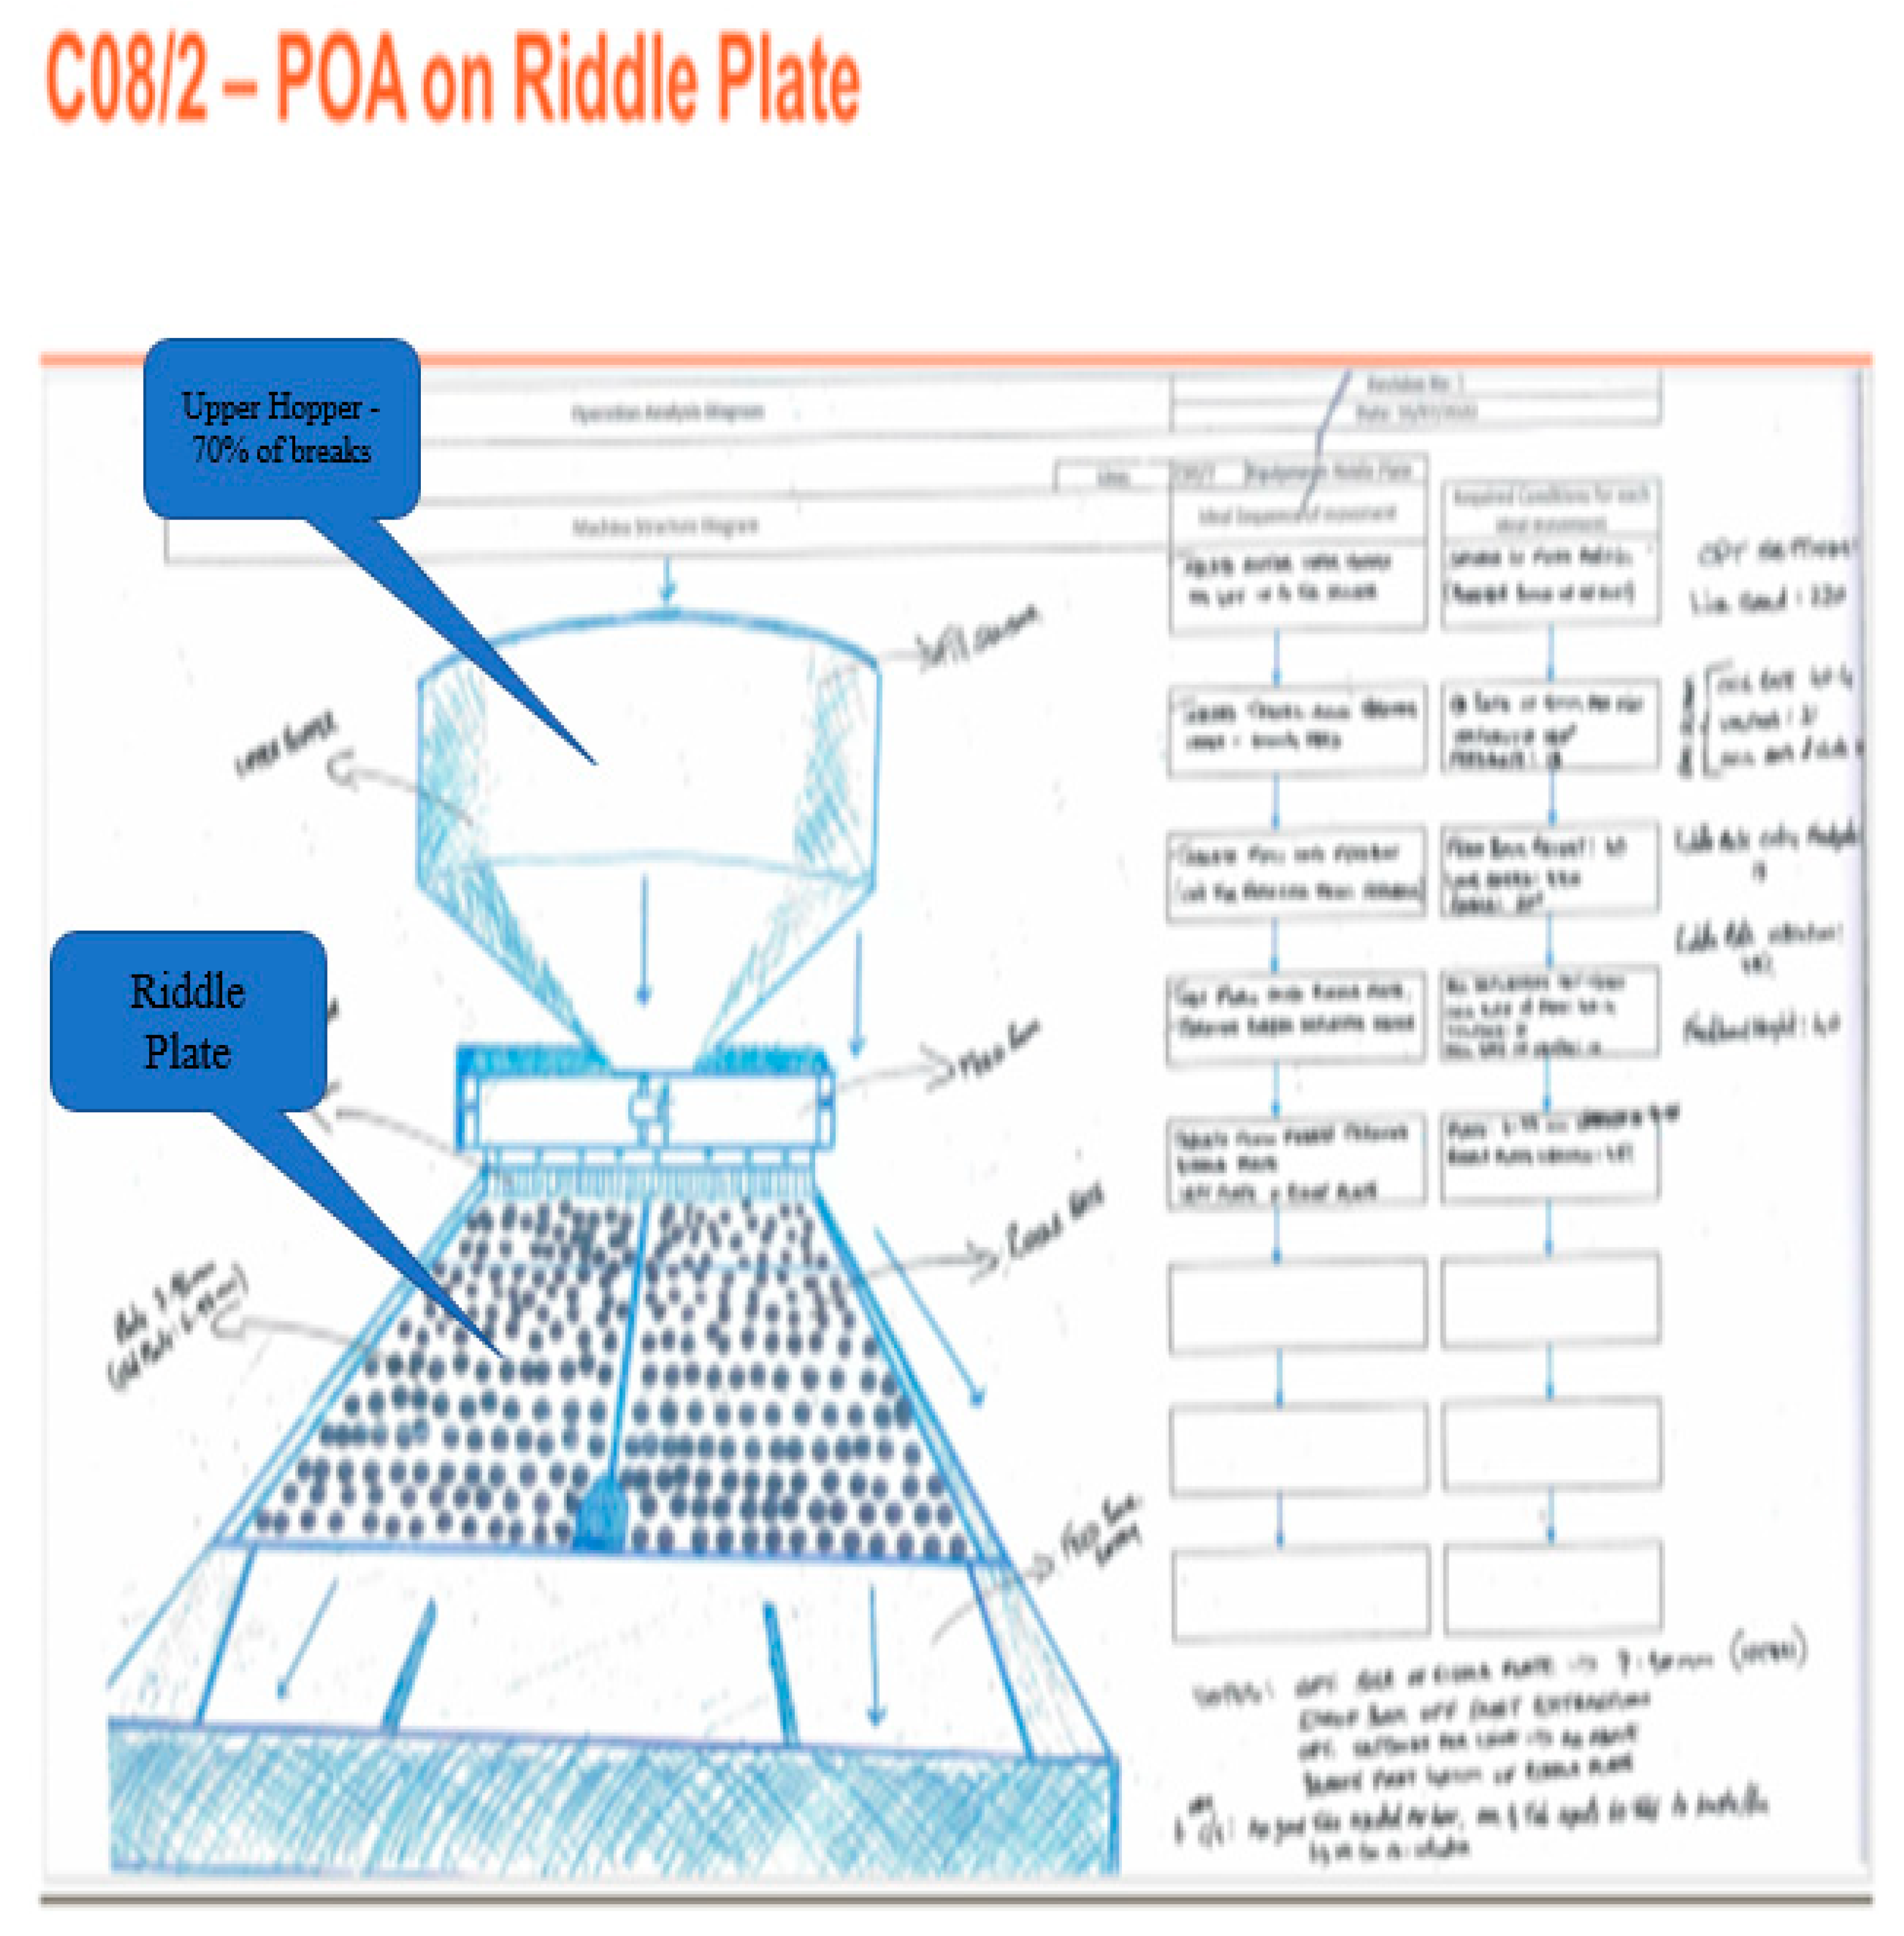
Figure 15, the team next conducted a ‘Principal of Operation Analysis’ (POA) (Figure 16) or functional analysis diagram in conjunction with brainstorming. The Principle of Operation Analysis Diagram identifies how the entire system operates correctly, analyzing that each movement works correctly by desirable sequences of movement [42]. The tool also identified the principles of movement and processing which shows how the specific components operate correctly and shows the relationship between the machine system and material system while processing. The POA is a very thorough analysis of angles, vibrations rates, oscillations and speed. Each step in the sequence is challenged as to why it happens. Each step in this condensed area of focus is broken down to a level that all aspects of ‘what is happening’ are completely understood.
In summary, the POA tool provided invaluable information for the team to proceed and develop the ‘5 Whys’ and start moving towards a solution. A 5 Whys analysis as demonstrated in Figure 17 shows the outcome of output from using the Principal of Operation tool.
The principal of operation analysis resulted in an understanding that the upper hopper gravity feeds down onto the riddle plate. The shape of the hopper creates a vortex-type action creating pressure on the tablets within this stainless-steel unit—effectively, it resembles sand flowing through an egg timer. There is a window on the side of the hopper and upon observation shows that the tablets on the outside area of the hopper move last; the tablets in the center of the hopper get pulled down first thus creating pressure on the tablets.

3.6. Analysis of Robustness of the Tablets

An obvious solution to preventing tablets breaking would be to increase their hardness and this would be fixing the “true” root cause of the tablets breaking online and align with the aim of Six Sigma methods to find the “true” root cause.
However, increasing tablet hardness to fix what is effectively a process issue on the manufacturing line may not be the best solution for both the customer and the company. The team looked at the effect of making tablets harder on the dissolution of the tablet (dissolving of the tablet in the body). Simply making tablets more robust (harder) will increase the chance of dissolution failure.
In summary, if tablet hardness was to be increased:
  • It will take 2 years to implement a change as a 2-year stability reference will need to be established for dissolution for regulatory authorities.
  • Increased hardness affects dissolution time. As can be seen below in Figure 18, an increase of 1 KP to the product SKU 10C821 (currently at 10 KP) will mean the tablet product will fail on dissolution testing. An increase to 12 KP ensured over 50% sampled failed batch testing for dissolution of the tablet.
Therefore, the team needs to mitigate against broken tablets in the system rather than eliminate the issue. Eliminating the issue from happening, i.e., tablet breakages will not only be a costly and time-consuming regulatory submission but will affect the dissolution of the tablet in the body and hence the potential speed of efficacy of the product. It is highly unlikely any regulatory body would accept a change in hardness that would have a negative effect on tablet efficacy and disintegration time in the body. After the PoO and 5 Whys exercise helped understand the root causes of the tablet feed and broken tablet issues, potential corrective actions were then brainstormed. The team then moved into the action implementation stage and tracked results.

3.7. Benefits Realization and Results

Once the problem-solving stage was complete, the 6th stage of the problem-solving seven-step process is to measure the benefits and results. Once the root causing process was completed, the following actions were taken as demonstrated in Table 2.
It was observed during the creation of the original POA that the riddle plate area (located directly after the upper hopper (feed-bowl A—where 70% of the breaks happen) has small holes to remove excess dust from the tablets. The question was posed, would it be possible to increase the hole size and use the riddle plate for two functions. That is, dust extraction and a dia-sorting function (remove broken tablets). If the riddle plate was tailor made for each product family to have specific sized holes in which broken/half tablets will fall through, it will effectively stop the broken tablets continuing through the process and into the tablet feed area, causing the production line to stop. A trial was conducted on the C80/2 line whilst running on 10C821 (the highest downtime was attributed to this product) with a product specific riddle plate as in 
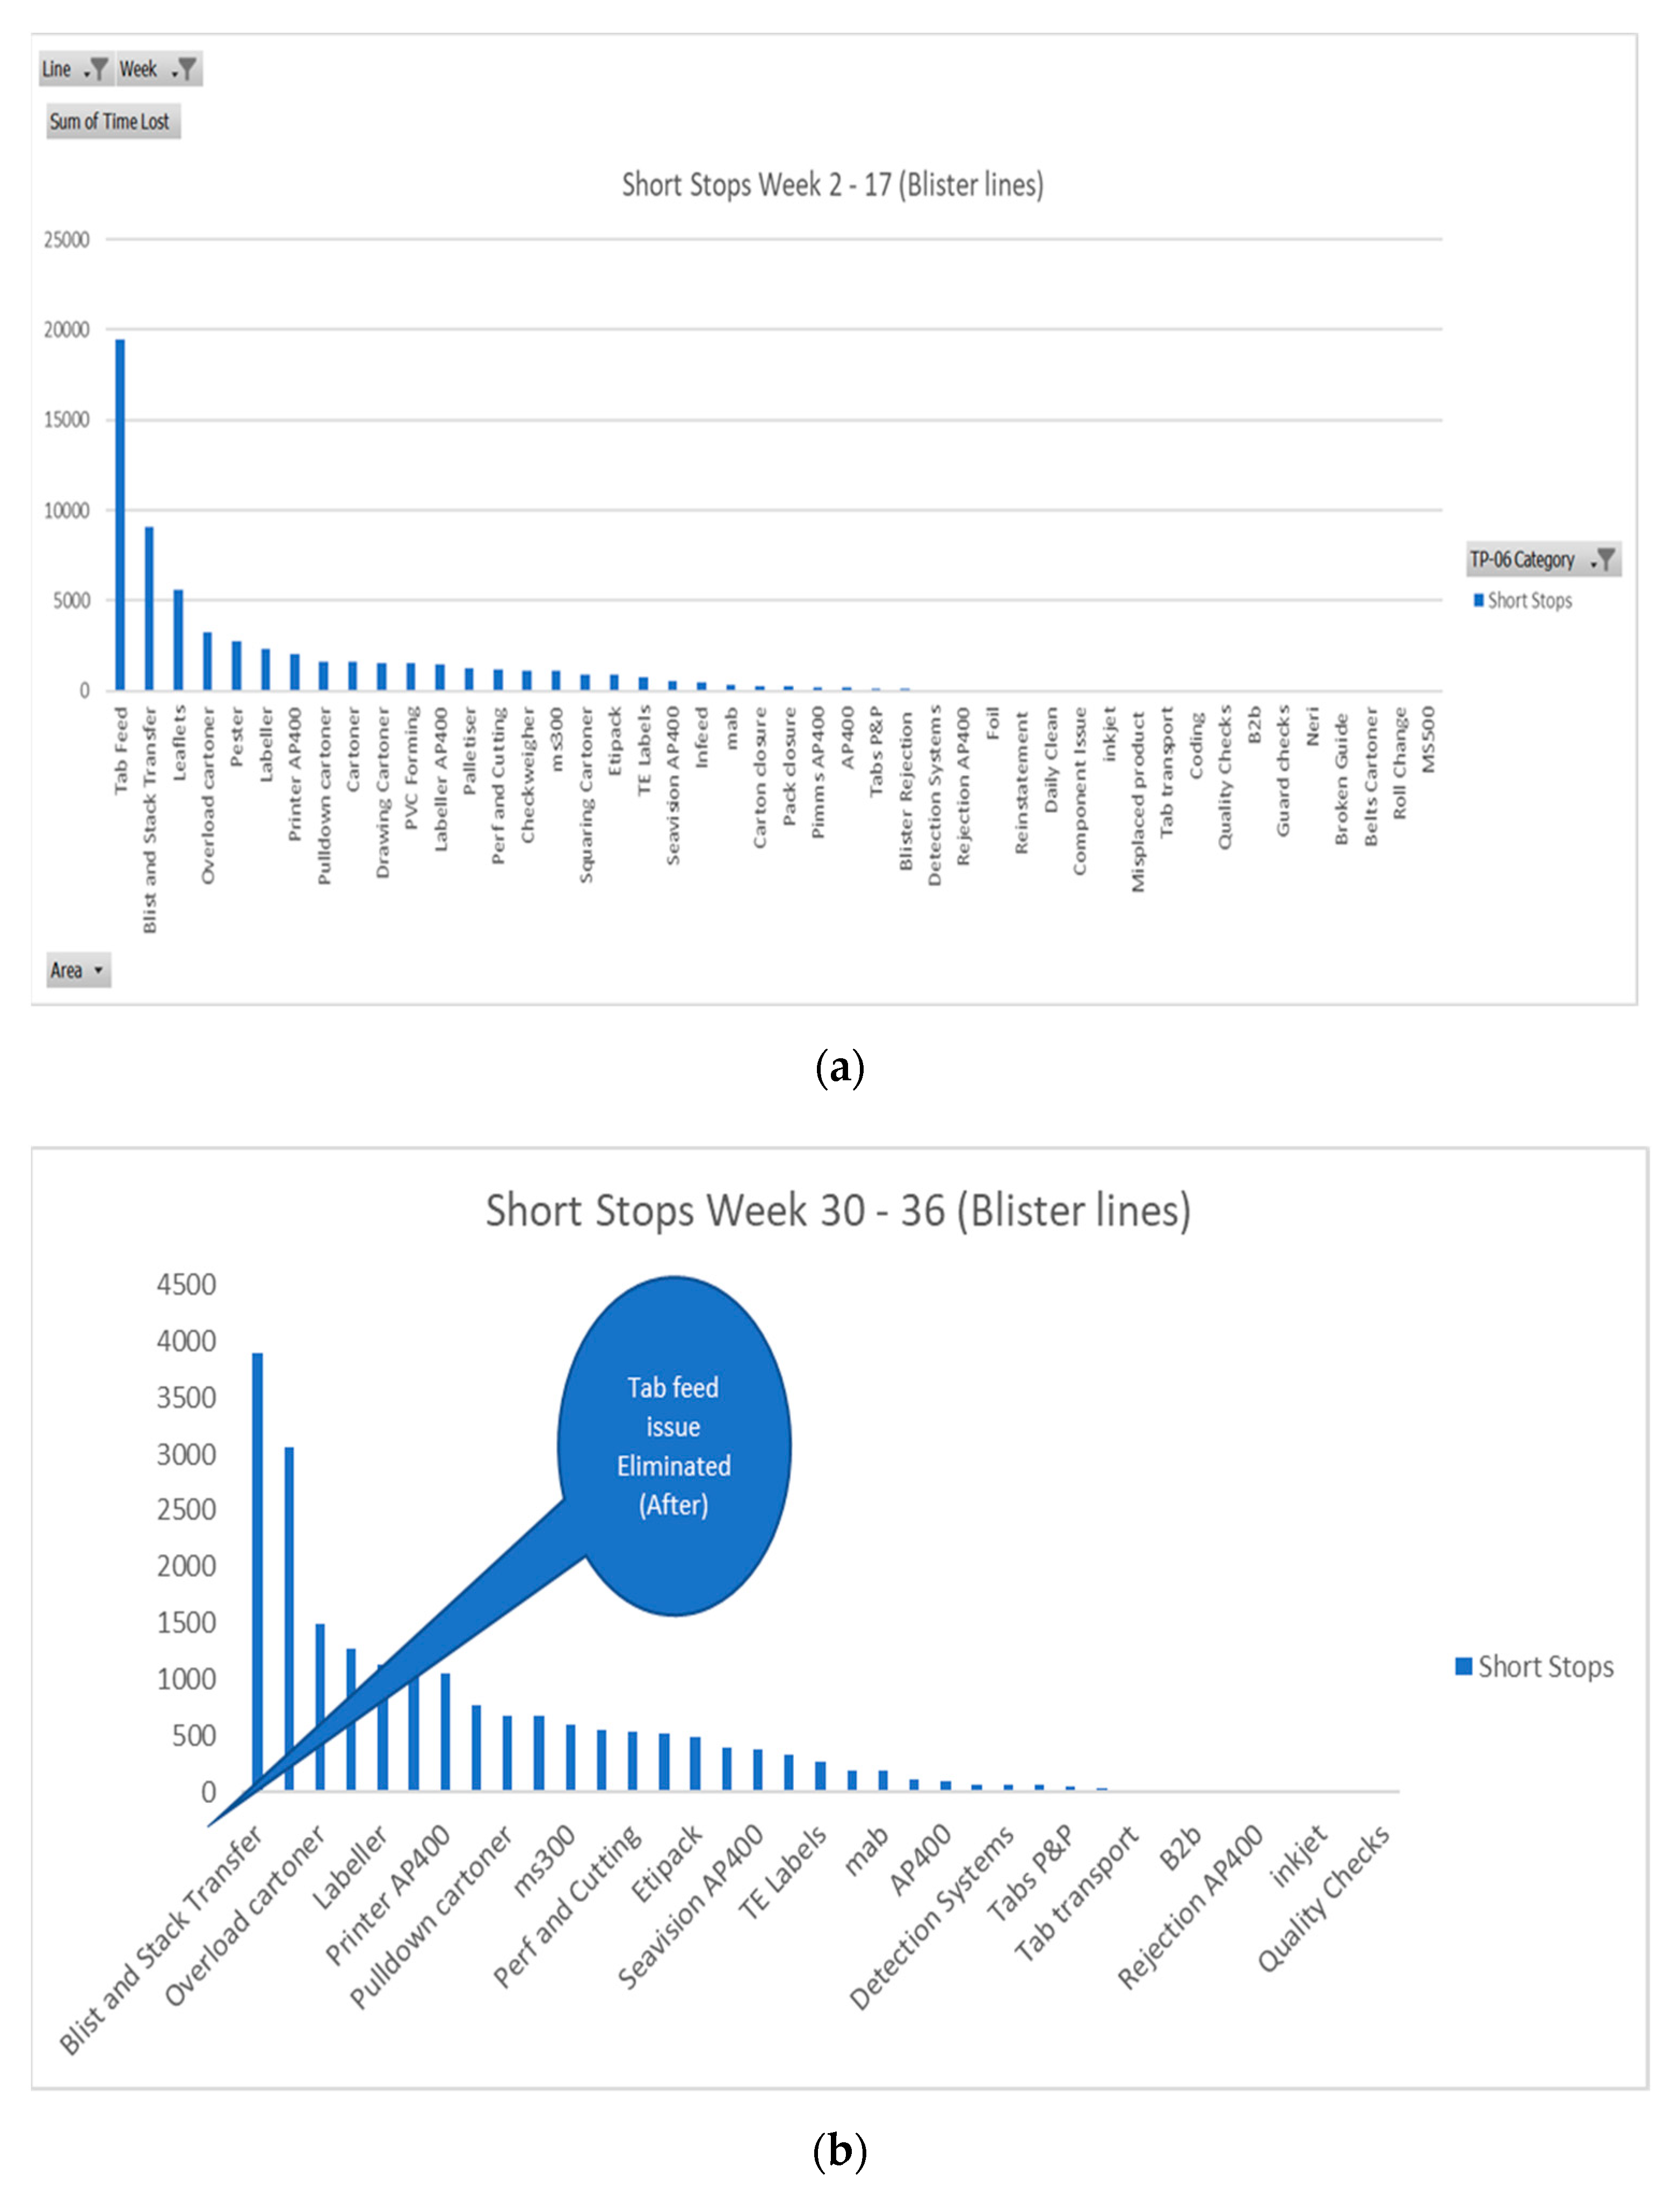
Figure 19. It effectively removed all tablet feed stops for the entire 48 h the trial lasted.
Quantitative data on installation of the new riddle plates demonstrated an elimination in short tops. There was consequently extra time afforded to the operators to complete value-adding steps (preparing for upcoming changeovers, getting carton leaflets rolls ready for replacement etc.). The flow of the line improved and non-value additional stops reduced.
Effectively, by dia-sorting tablets (removing broken tablets) at the riddle plate the line restart procedure (demonstrated as standard work in Table 1) was eliminated. This was nonvalue additional work since operators had to conduct standard work multiple times an hour, depending on the product (often up to 20 times an hour).
The cost benefits of the project are presented in Table 3. The conservative savings of this case study in this one manufacturing plant are estimated at £388,426 (€446,460 or $541,000). The outlay in expenditure in providing all six blister lines is £26,400 equipment spend, plus capital project support cost of £3600 totaling £30,000 for the entire spend. The net result will be £358,426 in recoveries to the OTC site but notwithstanding the benefits from a qualitative point of view. The trials conducted eliminated the tablet feed issues as shown in Figure 20. It is important to note that the above figures have a 20% contingency built in for possible variation in performance at the riddle plate area. Therefore, the figures presented are understated and the company can expect a greater return than the figures stated above. The learnings from this project are being deployed to multiple sister sites of the manufacturer across the world and the project savings are expected to be greater once the changes are implemented globally.
As per 
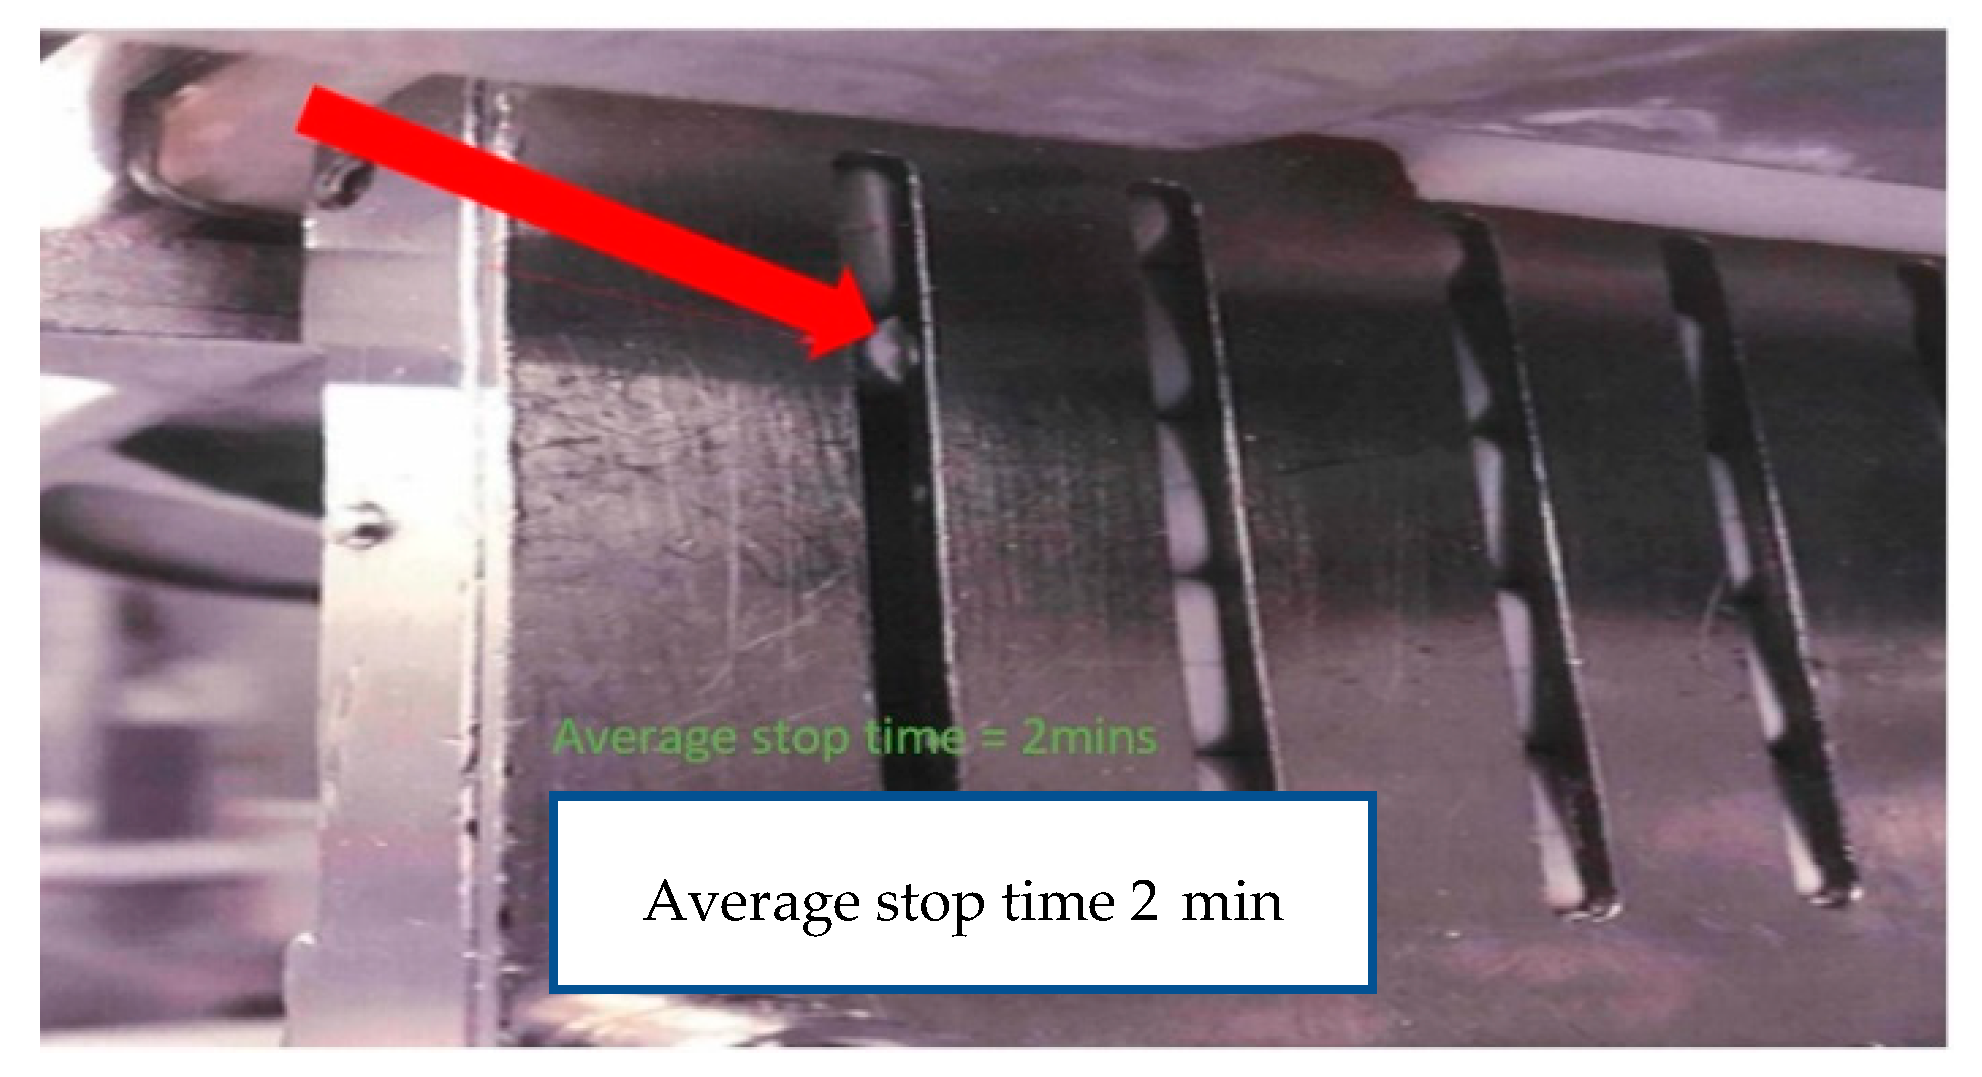
Table 3, there is a secondary benefit to this project in relation to production startup rejects. These “hidden” losses occur when production starts immediately after commissioning, or the startup production does not meet the required quality and can grow in quantity [10]. On restart of the production line, six blisters automatically get rejected as the seal of the blister may be jeopardized as it sits above the sealing bar at 70 degrees for the duration of the stop (on average 2 min). Tablets or blisters rejected due to line restarts are now eliminated. No “good” tablets were rejected since the project actions were implemented and this failure mode is being removed from the manufacturing line downtime board and list. Table 4 summarizes the elimination of the projected blister loss per year of 7.9 million which has been eliminated and demonstrates the downtime loss avoidance of 20,888 min downtime.

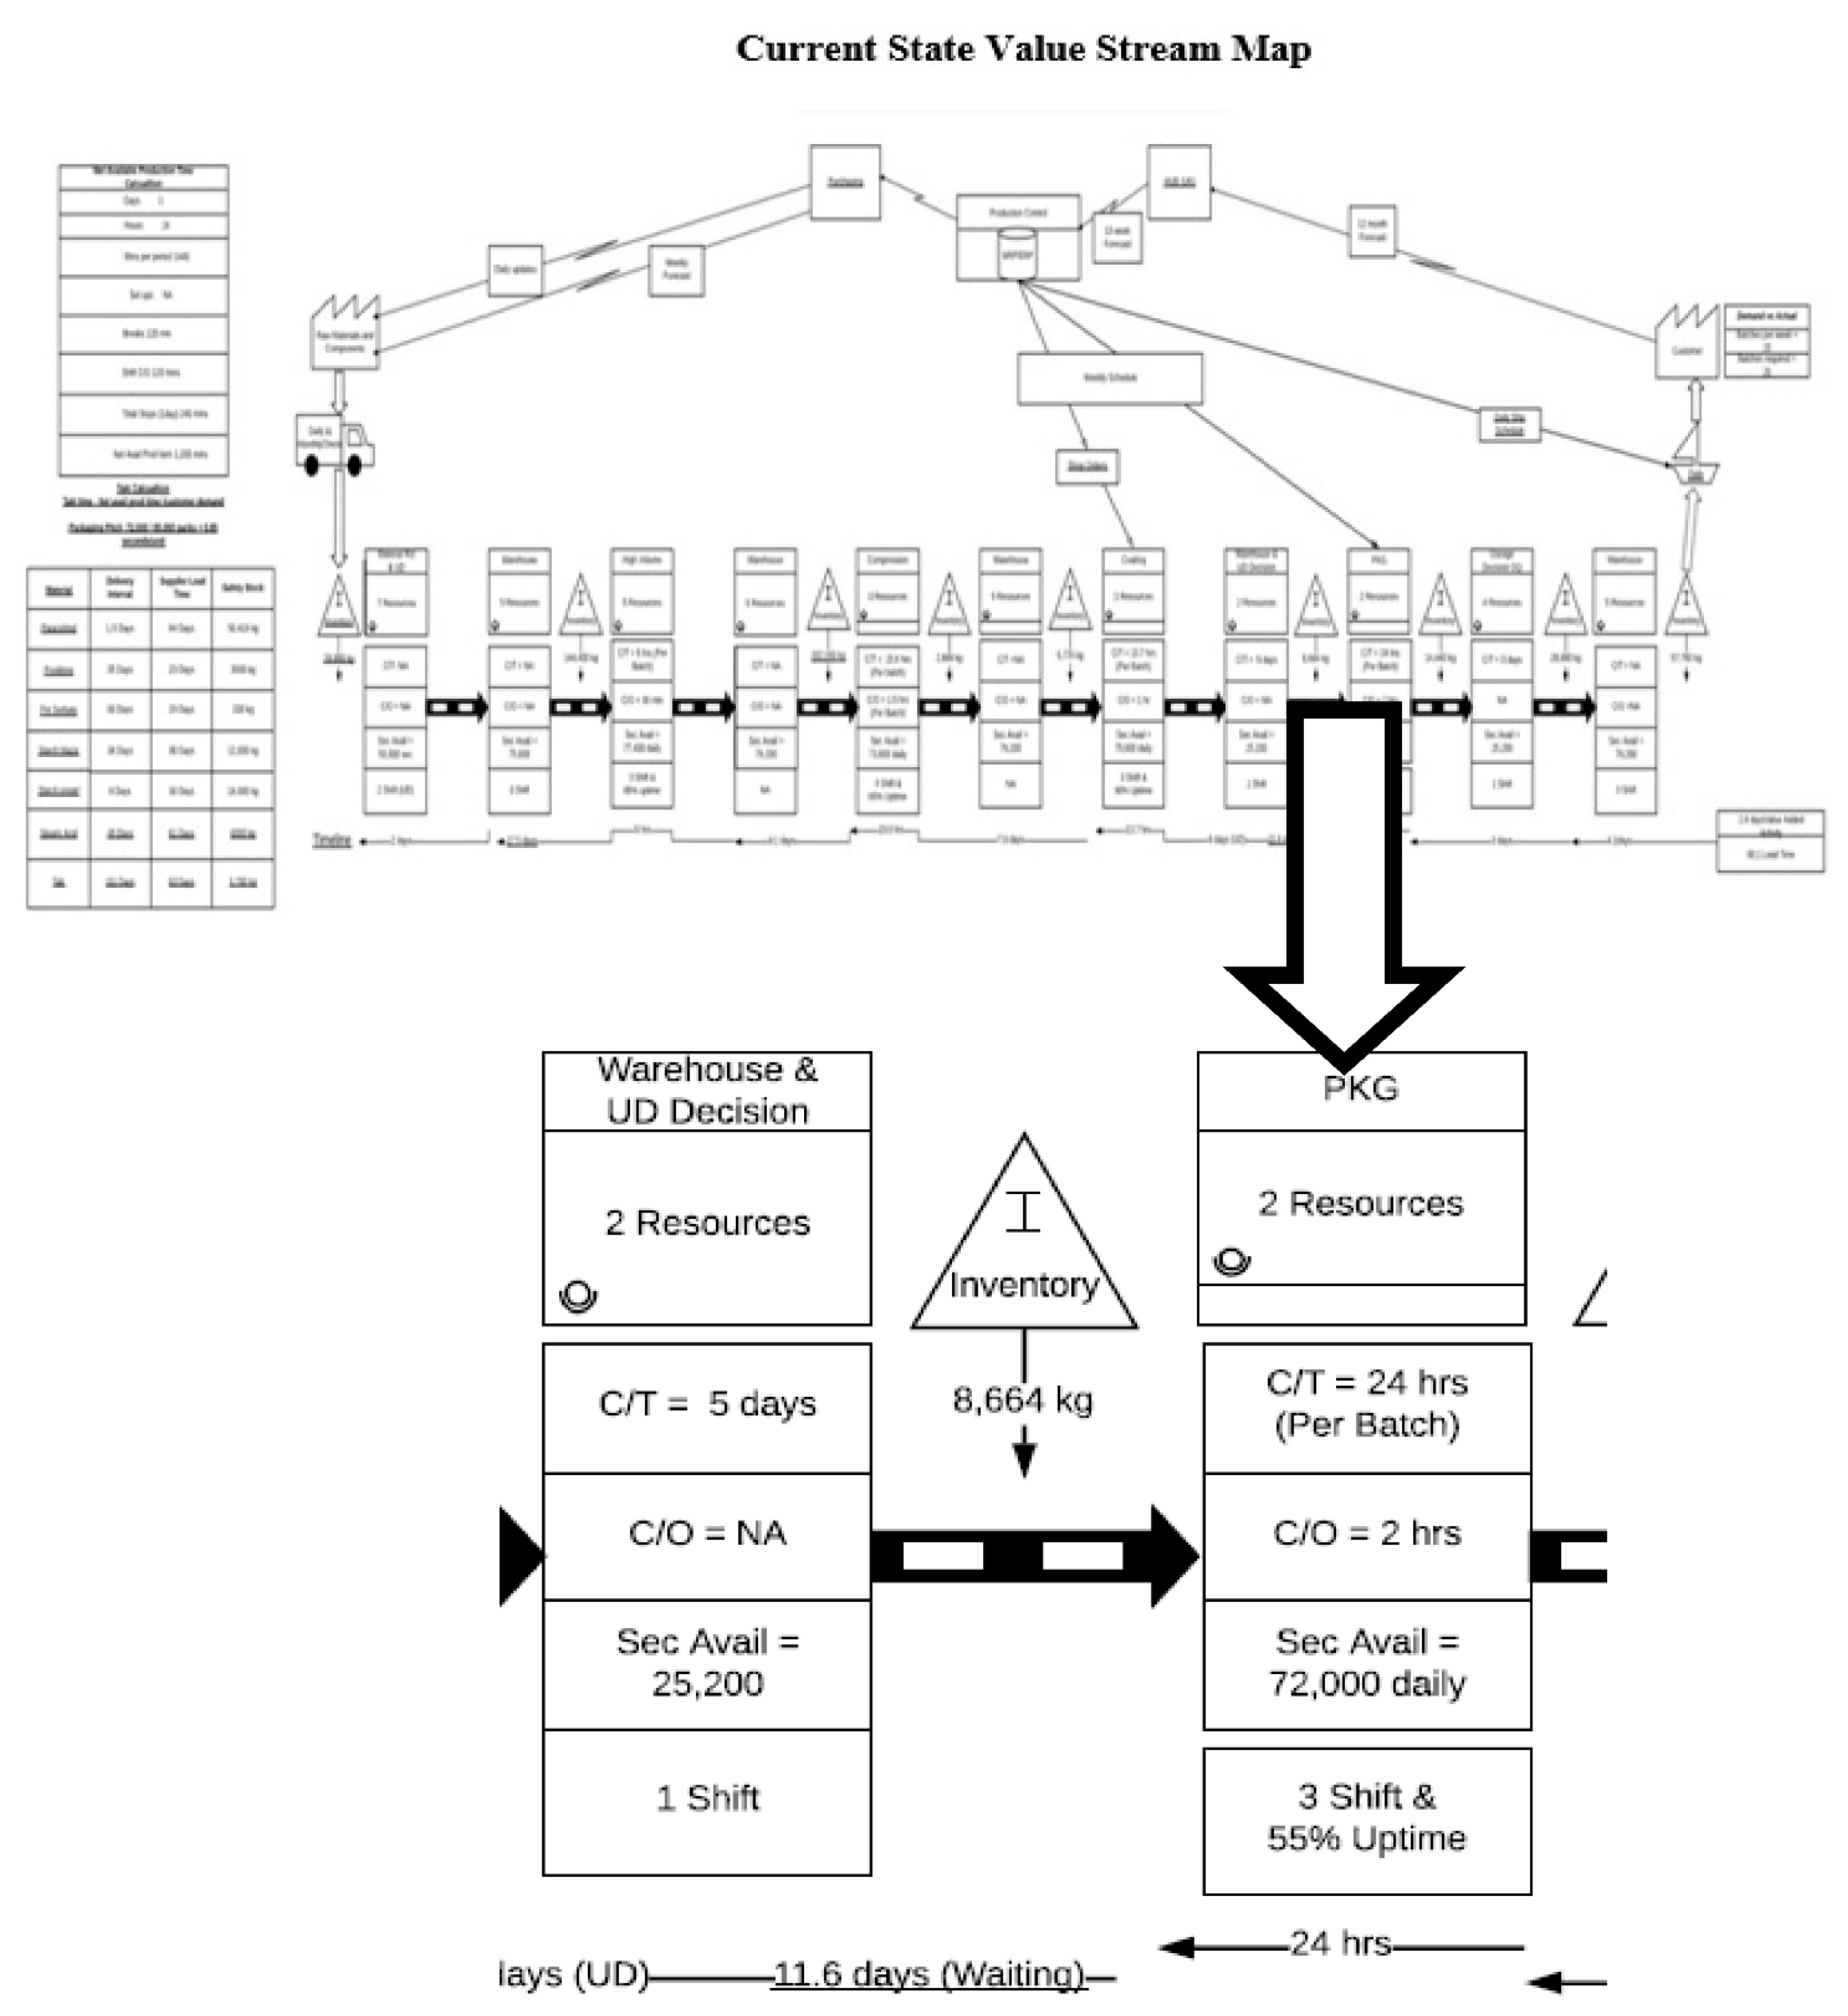
3.8. Future Value Stream Map

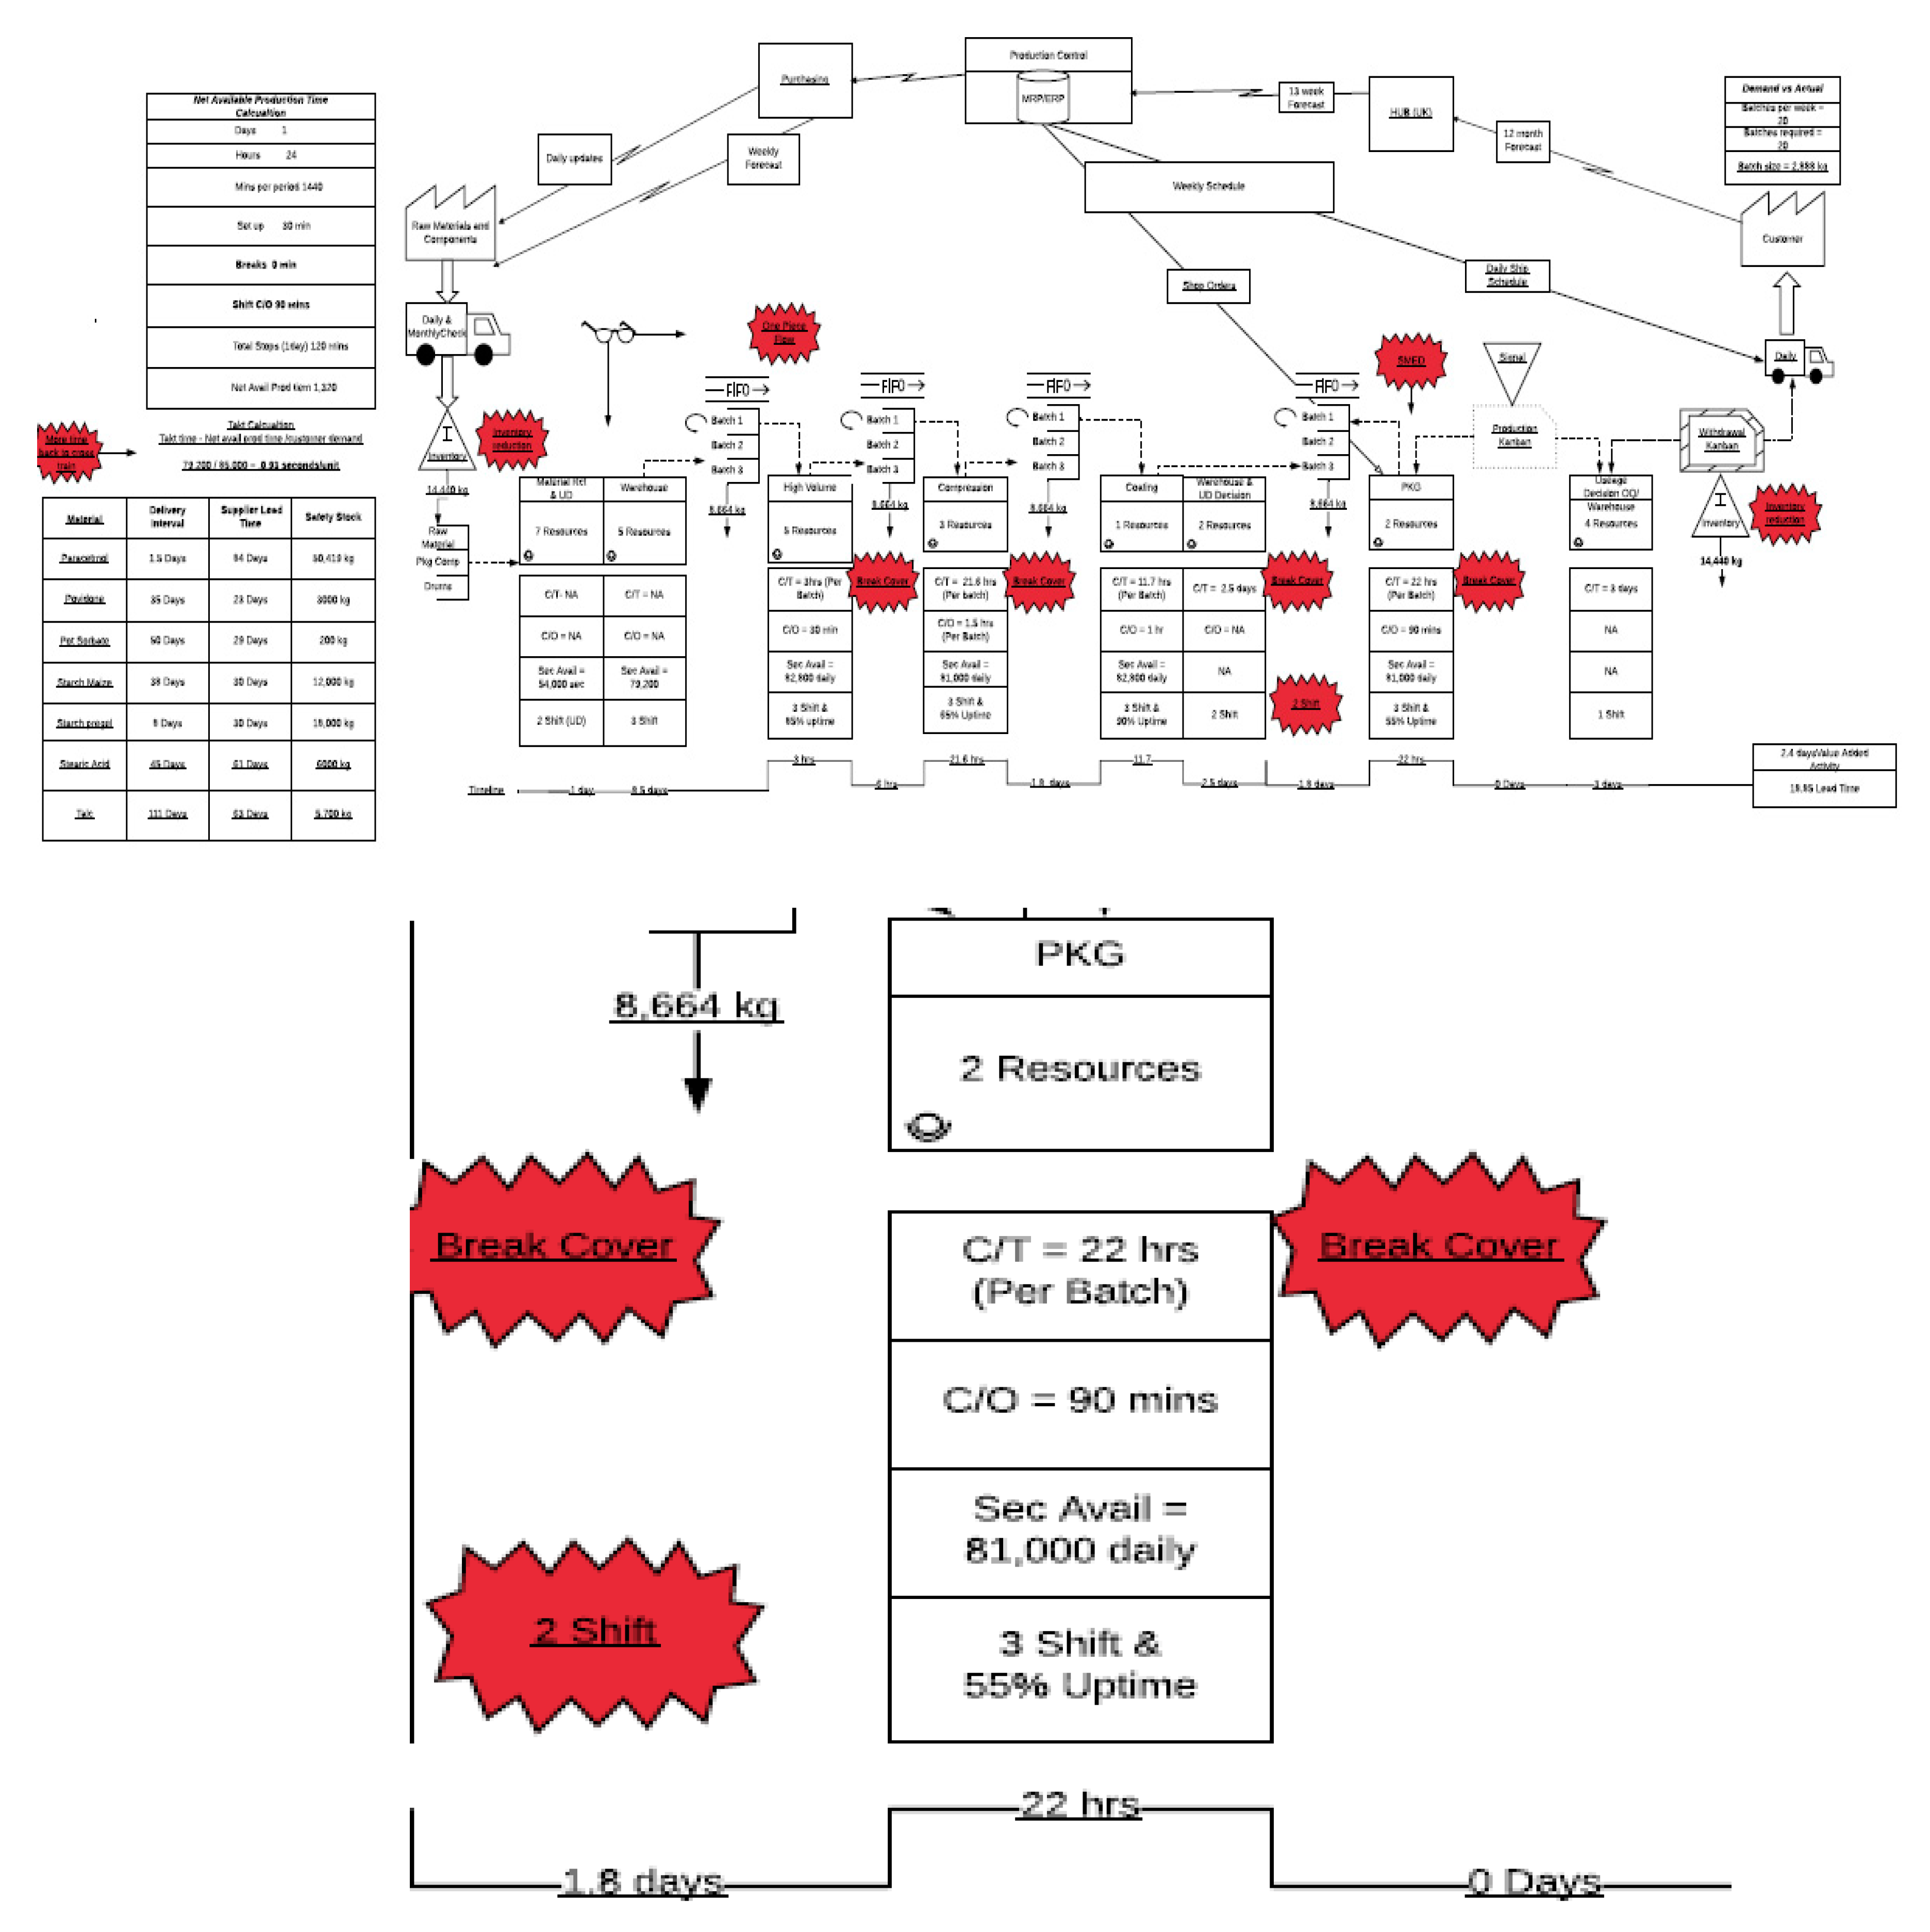
A future-state VSM represents the ideal state of the manufacturing system [43]. A “future” value stream map was drawn up by the project team and stakeholders. Since the purpose of lean manufacturing is to reduce or eliminate waste, the Lean/Sigma team needed to define a future value-stream map that serves as a guide for all future lean projects. Once the project was completed, the team were able to gather data and measure the new performance and reflect that “new” or “after” process data in the future VSM. A comparison of the “before” vs. “after” process measures was utilized to populate the VSM.
It can be observed from the visual Future Value stream map in Figure 21 and Table 5 below that the project yielded
  • Product backlog into the packaging area reduced by 84%
  • The cycle per batch improved by 8.3%.
  • The line changeover time reduced by 25%
  • The line availability improved by 11%.
The Packaging improvement (reduction of downtime) had an overall positive effect on the overall factory lead time (in days) and the overall factory value add time (in days) with improvement of 69% and 14%, respectively.

3.9. Roll out and Share

The final step of the 7-step problem solving methodology is to roll out and deploy changes and share learnings. Internally within the manufacturing site, the actions implemented in this project are being investigated for deployment in the effervescent department as they have a similar process.
On a global scale, the project was shared with all the organizations’ sister pharmaceutical sites globally and the parent site in the organization. At the time of writing, deployment of project learnings has already commenced in a European sister site. When the corrective actions described in this case study are implemented, the savings are expected to be increased five-fold.

4. Conclusions

Operational Excellence methodologies such as Lean Six Sigma have the potential to address and enhance understanding of processes and provide a methodology and toolset to aid effective root causing and corrective action implementation.
The two key findings from the study are:
  • The project demonstrated the benefits of implementing change through effective and structured problem solving by eliminating downtime, improving product flow, reducing backlog, eliminating product wastage, increasing productivity and ultimately enhancing customer experience by reducing the backlog for the product to leave the factory.
  • This project successfully utilized the Lean Six Sigma methodologies to determine root causes and implement corrective actions. This resulted in eliminating the problems under investigation without negatively impacting manufacturing cost, production time or product quality.
On a global scale, the project was shared with all the pharmaceutical sites globally and the parent site in the organization. The learnings and corrective actions are being deployed to these sites as solutions to resolving broken tablets and other queries in relation to the methodology used as a problem-solving tool. Using Lean Six Sigma techniques, the site is moving incrementally towards improving flowing product through the value stream with the goal of pulling product at the rate of the customer demand.
This study contributes to the body of knowledge in Lean Six Sigma methodology as the study demonstrates that, when successfully applied, the methods are very relevant in modern operations and in competitive environments.

Author Contributions

Conceptualization, B.B. and O.M.; methodology, J.N. and O.M.; software, B.B.; validation, O.M. and B.B.; formal analysis, B.B.; J.N.; O.M.; investigation, B.B.; resources, B.B. and O.M.; data curation, O.M.; J.N.; writing—original draft preparation, B.B.; J.N.; O.M.; writing—review and editing, O.M.; J.N.; visualization, B.B.; supervision, O.M.; J.N.; project administration, B.B. All authors have read and agreed to the published version of the manuscript.

Funding

This research received no external funding.

Institutional Review Board Statement

Not applicable.

Informed Consent Statement

Not applicable.

Data Availability Statement

All data are available upon request.

Acknowledgments

The authors acknowledge the support of the company involved in the case study research.

Conflicts of Interest

The authors declare no conflict of interest.

References

  1. Womack, J.P.; Jones, D.T.; Roos, D. The Machine That Changed the World; Simon and Schuster: New York, NY, USA, 1990; ISBN 1-4165-5452-1. [Google Scholar]
  2. Womack, J.P.; Jones, D.T. Lean Thinking—Banish Waste and Create Wealth in Your Corporation., 3rd ed.; Simon and Schuster: London, UK, 1996. [Google Scholar]
  3. Hicks, B. Lean information management: Understanding and eliminating waste. Int. J. Inf. Manag. 2007, 27, 233–249. [Google Scholar] [CrossRef]
  4. Ohno, T. Toyota Production System: Beyond Large-Scale Production; CRC: Boca Raton, FL, USA, 1988. [Google Scholar]
  5. Wilson, L. How to Implement Lean Manufacturing; McGraw Hill Professional: New York, NY, USA, 2009. [Google Scholar]
  6. Byrne, A.; Womack, J.P. Lean Turnaround; McGraw-Hill: New York, NY, USA, 2012. [Google Scholar]
  7. Rother, M.; Shook, J. Learning to See: Value Stream Mapping to Add Value and Eliminate Muda; Lean Enterprise Institute: Boston, MA, USA, 2003; ISBN 978-0-9667843-0-5. [Google Scholar]
  8. Hines, P.; Rich, N. The seven value stream mapping tools. Int. J. Oper. Prod. Manag. 1997, 17, 46–64. [Google Scholar] [CrossRef] [Green Version]
  9. Liker, J. The Toyota Way: 14 Management Principles from the World’s Greatest Manufacturer, 1st ed.; McGraw-Hill: New York, NY, USA, 2004; ISBN 0-07-139231-9. [Google Scholar]
  10. Dadashnejad, A.-A.; Valmohammadi, C. Investigating the effect of value stream mapping on operational losses: A case study. J. Eng. Des. Technol. 2018, 16, 478–500. [Google Scholar] [CrossRef]
  11. Paro, P.E.; Gerolamo, M.C. Diagnosing and Understanding the Ideal Lean Culture-Based on the 14 Principles of the Toyota. Way. Glob. J. Humanit. Soc. Sci. 2015, 1, 50–59. [Google Scholar]
  12. Chiarini, A. Lean Organization: From the Tools of the Toyota Production System to Lean Office; Perspectives in Business Culture; Springer-Verlag Mailand: Berlin/Heidelberg, Germany, 2013; ISBN 978-88-470-2509-7. [Google Scholar]
  13. Agyeman, N.E.S. The impacts of lean principles on the production of civil aircraft in Boeing. Aircr. Eng. Aerosp. Technol. 2021, 93, 212–217. [Google Scholar] [CrossRef]
  14. Agus, A.; Hajinoor, M.S. Lean production supply chain management as driver towards enhancing product quality and business performance. Int. J. Qual. Reliab. Manag. 2012, 29, 92–121. [Google Scholar] [CrossRef]
  15. Emiliani, M.L. Lean behaviors. Manag. Decis. 1998, 36, 615–631. [Google Scholar] [CrossRef]
  16. Jones, D.T.; Roos, D.; Womack, J.P. The Machine That Changed the World; Rawson Associates: New York, NY, USA, 1990. [Google Scholar]
  17. Antony, J. Some pros and cons of six sigma: An academic perspective. TQM Mag. 2004, 16, 303–306. [Google Scholar] [CrossRef] [Green Version]
  18. Black, K.; Revere, L. Six Sigma arises from the ashes of TQM with a twist. Int. J. Heal. Care Qual. Assur. 2006, 19, 259–266. [Google Scholar] [CrossRef] [PubMed]
  19. Ingle, S.; Roe, W. Six sigma black belt implementation. TQM Mag. 2001, 13, 273–280. [Google Scholar] [CrossRef]
  20. Zu, X.; Fredendall, L.D.; Douglas, T.J. The evolving theory of quality management: The role of Six Sigma. J. Oper. Manag. 2008, 26, 630–650. [Google Scholar] [CrossRef]
  21. Antony, J.; Gupta, S.; Gijo, E.V. Ten commandments of Lean Six Sigma: A practitioners’ perspective. Int. J. Prod. Perform. Manag. 2018, 67, 1033–1044. [Google Scholar] [CrossRef]
  22. Linderman, K.; Schroeder, R.G.; Zaheer, S.; Choo, A.S. Six Sigma: A goal-theoretic perspective. J. Oper. Manag. 2002, 21, 193–203. [Google Scholar] [CrossRef]
  23. Linderman, K.; Schroeder, R.G.; Choo, A.S. Six Sigma: The role of goals in improvement teams. J. Oper. Manag. 2005, 24, 779–790. [Google Scholar] [CrossRef]
  24. Pande, P.; Neuman, R.P.; Cavanagh, R. The Six Sigma Way Team Fieldbook: An Implementation Guide for Process Improvement Teams, 1st ed.; McGraw-Hill Education: New York, NY, USA, 2002; ISBN 978-0-07-137314-2. [Google Scholar]
  25. Heavey, C.; Murphy, E. Integrating the Balanced Scorecard with Six Sigma. TQM J. 2012, 24, 108–122. [Google Scholar] [CrossRef]
  26. Chowdhury, S. The Power of Design for Six Sigma; Kaplan Business: Sydney, Australia, 2003. [Google Scholar]
  27. Henderson, K.M.; Evans, J.R. Successful implementation of Six Sigma: Benchmarking General Electric Company. Benchmarking Int. J. 2000, 7, 260–282. [Google Scholar] [CrossRef]
  28. Buch, K.; Tolentino, A. Employee perceptions of the rewards associated with six sigma. J. Organ. Chang. Manag. 2006, 19, 356–364. [Google Scholar] [CrossRef]
  29. Neuman, R.P.; Cavanagh, R. The Six Sigma Way: How GE, Motorola, and Other Top Companies Are Honing Their Performance; McGraw Hill Professional: New York, NY, USA, 2003. [Google Scholar]
  30. Pepper, M.; Spedding, T. The evolution of lean Six Sigma. Int. J. Qual. Reliab. Manag. 2010, 27, 138–155. [Google Scholar] [CrossRef]
  31. George, M.L. Lean Six Sigma: Combining Six Sigma Quality with Lean Production Speed; McGraw-Hill: New York, NY, USA, 2002. [Google Scholar]
  32. Arnheiter, E.D.; Maleyeff, J. The integration of lean management and Six Sigma. TQM Mag. 2005, 17, 5–18. [Google Scholar] [CrossRef] [Green Version]
  33. Salah, S.; Rahim, A.; Carretero, J.A. The integration of Six Sigma and lean management. Int. J. Lean Six Sigma 2010, 1, 249–274. [Google Scholar] [CrossRef]
  34. Antony, J.; Snee, R.; Hoerl, R. Lean Six Sigma: Yesterday, today and tomorrow. Int. J. Qual. Reliab. Manag. 2017, 34, 1073–1093. [Google Scholar] [CrossRef]
  35. Hoerl, R.W.; Snee, R. Statistical Thinking and Methods in Quality Improvement: A Look to the Future. Qual. Eng. 2010, 22, 119–129. [Google Scholar] [CrossRef]
  36. McAdam, R.; Donegan, S. A comparative analysis of trilateral and concurrent business improvement methodologies in the high technology sector. Int. J. Manuf. Technol. Manag. 2003, 5, 210–231. [Google Scholar] [CrossRef]
  37. Sony, M.; Antony, J.; Naik, S. How do organizations implement an effective LSS initiative? A qualitative study. Benchmarking Int. J. 2020, 27, 1657–1681. [Google Scholar] [CrossRef]
  38. Garza-Reyes, J.A. From measuring overall equipment effectiveness (OEE) to overall resource effectiveness (ORE). J. Qual. Maint. Eng. 2015, 21, 506–527. [Google Scholar] [CrossRef]
  39. Pakdil, F.; Toktaş, P.; Can, G.F. Six sigma project prioritization and selection: A multi-criteria decision making approach in healthcare industry. Int. J. Lean Six Sigma 2020. Vol. ahead-of-print No. ahead-of-print. [Google Scholar] [CrossRef]
  40. Feng, P.; Ballard, G. Standard Work from a Lean Theory Perspective. In Proceedings of the 16th Annual Conference of the International Group for Lean Construction Production Planning and Control, Mancester, UK, 16–22 July 2008; pp. 703–712. [Google Scholar]
  41. Dalton, J. Gemba Walks. In Great Big Agile: An OS for Agile Leaders; Dalton, J., Ed.; Apress: Berkeley, CA, USA, 2019; pp. 173–174. ISBN 978-1-4842-4206-3. [Google Scholar]
  42. Lean Manufacturing Online. Available online: https://leanmanufacturing.online/principle-of-operation-analysis-diagram/ (accessed on 22 March 2020).
  43. Chen, B.; Wan, J.; Shu, L.; Li, P.; Mukherjee, M.; Yin, B. Smart Factory of Industry 4.0: Key Technologies, Application Case, and Challenges. IEEE Access 2018, 6, 6505–6519. [Google Scholar] [CrossRef]
Figure 1. A seven-step in-company problem solving framework: based on and integrated with the Six Sigma D,M,A,I, C methodology and utilizing Lean and Six Sigma tools.
Processes 09 00550 g001
Figure 2. A Current Value Steam Map with the packaging area section highlighted showed that there was a backlog of inventory or product waiting to go into packaging of 11.6 days of work in progress (WIP).
Processes 09 00550 g002
Figure 3. Packaging bar graphs of downtime issues/losses within the Packaging department with % OEE on the x-axis compared against Time (in weeks) on the y-axis. Breakdowns, Short Stops, Changeovers, Labor unavailable, Material Unavailable, Utilities/Overruns, Speed loss, Intrusive stops were all identified as sources of losses in downtime as demonstrated in the bar graph.
Processes 09 00550 g003
Figure 4. Breakdown of total downtime related to packaging Short Stops across nine packaging lines over a 16-week period.
Processes 09 00550 g004
Figure 5. Number of incidences of blister lines short stops as a result of tablet feed issues measured across six production lines (with quantity of short stop issues on the y-axis and the line number (line type) on the x-axis) measured over a 16-week period.
Processes 09 00550 g005
Figure 6. Project Selection Matrix with Impact on the y-axis and Effort on the x-axis. Tablet feed issues were deemed to be a high impact project with a mix of low and high effort resources required.
Processes 09 00550 g006
Figure 7. Six-Step Problem Solving Template based on a mix of the Six Sigma DMAIC methodology and the A3 structured.
Processes 09 00550 g007
Figure 8. Stoppage Time Breakdown by Shift-comparison of the time lost (in seconds) due to stoppages per shift demonstrated that Shift A (233 s) and shift B (203 s) are practically equal but shift C (430 s) is double the time taken for the other two shifts combined.
Processes 09 00550 g008
Figure 9. An example of a check sheet exercise run on one shift to breakdown occurrences of defect types. Every time an operator ha a broken tablet, coating defect, split table or thick tablet, they recorded the issue with a “tick”. Visually, it can be seen that most (or all) of the “checks” or “ticks” are under the broken tablet (half tablet) category.
Processes 09 00550 g009
Figure 10. Tablet feed chute blockage (lateral view).
Processes 09 00550 g010
Figure 11. Tablet feed chute blockage (Cross-sectional view).
Processes 09 00550 g011
Figure 12. Downtime by Tablet Type demonstrated that product type 10C821 had the highest downtime.
Processes 09 00550 g012
Figure 13. Pareto graph demonstrating the results of a trial to establish when tablets break within the Packaging process. It was demonstrated that 70% of breakages of tablet type C80/2 were in the Feed Bowl and Top hopper areas.
Processes 09 00550 g013
Figure 14. Analysis downtime due to tablet feed issues of Flash Spray (a 22-min spray) vs. Full Spray (a 72 min spray) showed no difference in downtime because of the two spray types over the 4 weeks of the analysis. Flash Spray type 2 used from 21 April to 27 April and 13 May to 16 May and Normal Spray Type 1 utilized from 28 April to 12 May.
Processes 09 00550 g014
Figure 15. Entry to the Feed Hopper process operation steps and the associated failure modes that can occur at each step.
Processes 09 00550 g015
Figure 16. Principal of Operation (POA) of the Feed Hopper analysis led to understanding of a series of steps which contributed to the line stops.
Processes 09 00550 g016
Figure 17. Five Whys analysis being conducted on the tablet feed issue led to root cause and corrective actions which addressed the reason for feed issues and tables getting broken or stuck.
Processes 09 00550 g017
Figure 18. % Acetaminophen (APAP) tablet disintegration target of 30 min (on the y-axis) vs. Granulation time (in minutes) on the x-axis. Granulation transforms the shape, size, surface, and density of powders to improve their physicochemical properties and hardness. The higher the granulation time (and KP), the more negative the effect on tablet disintegration. For example, if increased to 12 KP, 50% of the sample failed in dissolution batch testing.
Processes 09 00550 g018
Figure 19. POA and pilot on a tailor-made product-specific riddle plate to understand how the plate would work. A new riddle plate was trialed on the C08/2 line whilst running 10C821 tablet type.
Processes 09 00550 g019
Figure 20. (a) Before the project started and actions were implemented, tab feed stops or downtime associated with tab feeds was the top downtime issue; (b) After the project implemented corrective actions, the tab fed issue was eliminated as a contributor to short stops or downtime.
Processes 09 00550 g020
Figure 21. “Future” Value Stream Map.
Processes 09 00550 g021
Table 1. Standard work practice for line stops describing the exact work steps required to resolve a tablet feed line stop within 60 s. Until a root cause and corrective action for line feed stops are identified, standard work for clearing stops to minimize production disruption is required.
Process StepWork PerformedAverage Time Taken (s)
1Operator removes broken half tablet from feed chute line using a spatula tool20
2Operator gets tablets from feed bowl to use to fill empty tablet pockets10
3Operator refills empty tablet pockets manually20
4Operator resets and restarts production line10
Table 2. Key corrective and preventative actions.
ActionWhy?
Conduct diasorting
Trial on riddle plate
Potential to remove 79% of broken tablets found on the packaging line
Complete maintenance
check to get specific
plattens in place and
allocate storage areas
Incorrect sized plattens will not remove defects (half tablets) effectively. There is no area to store plattens to ease changeover
Agree storage for plattens
to enable changeover
when running different
size tablets
Current system not working. Plattens being cross shared between lines. Sets being mixed up
Create standard settings
to the packaging line
transportation system
No standard settings in place. Standard optimized settings will reduce variation output from setups to improve quality of production outputs
Table 3. Benefits.
Table 3. Benefits.
Minutes
Downtime
20,888
Projected Blisters
Lost per year
7,912,200
Projected Blisters rejected on restart180,000
Contingency of 20%6,473,760
Recovery cost per Blister(£0.06)
Total Savings of £388,426
Table 4. The downtime in terms of minutes lost and blisters lost before the project was eliminated once the corrective actions were taken. This table demonstrates the amount of waste in the process prior to the project.
LineMinutes LostTotal Blisters
Lost
C80/24189418,900
C80/63662439,440
C95/53605612,850
C65/13347267,760
C95/43210545,700
C95/32075352,750
Table 5. Current VSM metrics vs. Future VSM metrics.
Measure (Waste)Current VSM
(Before)
Future VSM
(After)
%
Improvement
Backlog into Packaging
(in days)
11.61.884
Cycle Time per batch in Packaging
(in hours)
24228.3
Line changeover time in Packaging
(in minutes)
1209025
Packaging Line availability
(in seconds)
81,00072,00011
Overall Factory Lead Time
(in days)
60.118.8569
Overall Factory Value Added
Activity (in days)
2.82.414
Publisher’s Note: MDPI stays neutral with regard to jurisdictional claims in published maps and institutional affiliations.

