Article

Modelling and Optimization of Processing Factors of Pumpkin Seeds Oil Extraction under Uniaxial Loading

1
Department of Mechanical Engineering, Faculty of Engineering, Czech University of Life Sciences Prague, 16521 Prague, Czech Republic
2
Department of Materials and Manufacturing Technology, Faculty of Engineering, Czech University of Life Sciences Prague, 16521 Prague, Czech Republic
*
Author to whom correspondence should be addressed.
Processes 2021, 9(3), 540; https://doi.org/10.3390/pr9030540
Submission received: 2 March 2021 / Revised: 14 March 2021 / Accepted: 15 March 2021 / Published: 18 March 2021

Abstract

:
In the present study, a Box–Behnken design of response surface methodology (RSM) was employed to optimize the processing factors (force: 100, 150, and 200 kN; speed: 3, 5, and 7 mm/min; and temperature: 40, 60, and 80 °C) for extracting pumpkin seeds oil under uniaxial compression. The design generated 15 experiments including twelve combinations of factors and three replicates at the center point. The responses: oil yield (%), oil expression efficiency (%), and energy (J) were calculated, and the regression models determined were statistically analyzed and validated. The optimum factors combination: 200 kN, 4 mm/min and 80 °C predicted the oil yield of 20.48%, oil expression efficiency of 60.90%, and energy of 848.04 J. The relaxation time of 12 min at the optimum factors increased the oil efficiency to 64.53%. The lower oil point force was determined to be 57.32 kN for estimating the maximum oil output. The tangent curve and generalized Maxwell models adequately (R2 = 0.996) described the compression and relaxation processes of pumpkin seeds oil extraction. Peroxide value increased with temperatures. The study provides detailed information useful for processing different bulk oilseeds under uniaxial loading for optimizing the mechanical oil pressing in large-scale oil production.

Graphical Abstract

1. Introduction

Pumpkin (Cucurbita pepo L.) is one of the most cultivated cucurbit crops in the world [1]. The amount of oil found in many types of pumpkin seeds varies from 40 to 60 wt.% [2,3,4]. The seeds are used for commercial oil extraction for food and health benefits [5]. The unrefined pumpkin oil is of high quality for its taste, aroma, and color, which are the characteristics defining the use of pumpkin oil for salads and cold dishes [6]. Recently, pumpkin seed oil has gained great attention not only as an edible oil but also as a potential nutraceutical [7]. Pumpkin extracts have exhibited remarkable anti-cancer activity against leukemia K-562 cells. It contains moschatin, a novel ribosome-inactivating protein that effectively inhibits the growth of targeted melanoma cells M21 [8,9]). The pumpkin seed oil has shown various other beneficial properties like anti-microbial, anti-hypertensive, anti-arthritic, anti-inflammatory, and anti-depression activities [7,10]. Other studies have also highlighted the health properties of pumpkin seed oil against diabetes, neonatal meningitis, diarrhea, and severe abdominal cramps [7,11,12,13]. Furthermore, the pumpkin seed oil is recognized for the treatment of urinary tract infection and other infectious diseases caused by some virulent Escherichia coli bacteria strain [7,14].
In the literature, various methods of oil extraction of pumpkin varieties have been reported. These methods include the extraction by supercritical fluid [3,15,16], aqueous enzymatic extraction assisted by micro-wave [17], extraction by mechanical screw pressing [18,19,20], extraction by hydraulic pressing [3], and extraction by organic solvent [21]. The extraction with an organic solvent and mechanical/hydraulic pressing is commonly employed for the commercial production of vegetable oils [3,5,18,22,23]. Industrially, seed oil recovery is achieved by a sequential process of mechanical expression and n-hexane/solvent extraction [3,18]. However, solvent extraction has been under greater scrutiny due to its increasing governmental restrictions and consumer concerns regarding the safety of the use of organic solvents in food processing [3]. On the other hand, the screw/hydraulic pressing operation is still difficult to control, and an important variability can be observed on their yield, capacity, and energy consumption [24,25,26]. The processed seeds properties such as maturity, variety, moisture content, pretreatments among others, thus, contribute to the inefficiency of the mechanical pressing [27,28,29,30]. It is worth mentioning that the design of efficient oil expression systems has always presented a great challenge; researchers, engineers, and manufacturers are continuously seeking to fully perceive the phenomenon occurring inside the press to optimize the whole process [18].
In this context, the uniaxial compression process can be used to predict the mechanical oil expression process. The uniaxial compression loading is the process where the bulk oilseeds are placed in a pressing vessel of a known diameter that contains holes at the bottom that allow the oil to escape while retaining the seedcake [31,32,33,34]. This process requires that for processing a particular bulk oilseed, the factors, namely, force, speed, heating temperature, the volume of bulk material, moisture content, and diameter of pressing vessel needs to be described in terms of the mechanical behavior (force-deformation curve characteristics–smooth curve and serration/undulation pattern), oil yield, oil expression efficiency, and energy demand. Here, the stress relaxation process relates to the maximum recovery of the residual oil in the seedcake. The stress relaxation behavior of porous solid material is usually studied to quantify the viscoelasticity of the material where the test involves the measurement of stress required to maintain the deformation as a function of time at a constant strain [35]. Understanding first the uniaxial compression and relaxation processes would help in optimizing the mechanical screw press, especially for rural-based operations. Most importantly, to reduce the time-consuming nature of the classical experimental approach as well as to minimize cost, it is important to use appropriate experimental design. The response surface methodology (RSM) has been identified as an efficient statistical tool for analyzing the effects of several independent variables or processing factors on the responses [36]. RSM has an important application in the process design and optimization as well as the improvement of the existing design. The primary purpose of RSM is to determine the optimum operating conditions of the system and/or to determine the threshold, which satisfies the operating specifications [37,38]. Based on the available information, the RSM has not been used for the modelling and optimization of the processing factors of bulk oilseeds oil extraction under uniaxial compression loading. The RSM need to be applied to the oil extraction process of bulk oilseeds under uniaxial loading.
Therefore, the objectives of the present study are to optimize the processing factors of pumpkin seeds oil extraction in terms of (oil yield, oil expression efficiency, and energy), to describe theoretically the compression and relaxation processes of bulk pumpkin seeds oil expression, to describe the UV–visible spectral curves of pumpkin seeds oil under different pretreatment temperatures and to determine some of the chemical properties (peroxide value, acid value, and free fatty acid) of the pumpkin seed oil under pretreatment temperatures for quality usage.

2. Materials and Methods

2.1. Materials

Twelve kilograms of whole pumpkin seeds procured from Střední, Prague 6, Czech Republic, were used in this study. Before the experimental procedures as described below, the pumpkin seeds were kept under laboratory conditions of a temperature of 22 °C and humidity of 30%. Unwanted materials such as hulls without seeds and dust among others were removed before the determination of the physical, chemical, and mechanical properties of pumpkin seeds and oil under different pretreatment temperatures.

2.2. Determination of Moisture and Oil Content

The standard hot air oven method (MEMMERT GmbH + Co. KG, Buechenbach, Germany) with a temperature setting of 105 °C and a drying time of 17 h [39,40] was used to determine the moisture content of the pumpkin seeds. The electronic balance Kern 440–35 (Kern & Sohn GmbH, Balingen, Germany) with an accuracy of 0.001 g was used for weighing the samples before and after oven drying. Using the relation given by [41], the moisture content was calculated to be 6.37 ± 0.24 (% w.b.). By the Soxhlet extraction procedure [42,43], the percentage of oil content in pumpkin seeds was determined to be 33.53 ± 1.16 [41]. The procedure follows that a sample of mass of 10 g was ground in a mini grinder. The ground sample was packed into a thimble and cotton wool was placed atop and then inserted into the Soxhlet extractor. The extractor was then connected to a 150 mL round bottom flask containing 100 mL of petroleum ether. The arrangement was placed under a heating source at 160 °C where the solvent was heated to reflux for 24 h. After the oil has been extracted, it was dried in an oven at 80 °C for 5 h to remove the residual solvent followed by its percentage calculation according to the relation given by [41].

2.3. Preliminary Experiments

Preliminary experiments were conducted to determine the maximum force for extracting the oil from the pumpkin seeds with the speed, heating temperature, volume of bulk seeds and vessel diameter. The vessel diameter of 60 mm with a plunger and an initial pressing height of the samples measured at 60 mm (77.44 g) were considered. For a maximum force of 250 kN considering the above-mentioned factors, the serration effect was observed after 200 kN on the force-deformation curve. The serration effect is characterized by the ejection of the seedcake through the holes of the pressing vessel, which thus affects the compression process. Based on the results of the preliminary experiments, the Box–Behnken design (BBD) was used to plan the combination of the factors for the full experiments.

2.4. Experimental Design

Three processing factors namely force, speed and temperature were studied with their effect on the deformation, oil yield, oil expression efficiency and energy of pumpkin seeds oil extraction. A Box–Behnken Design of Response Surface Methodology [40,44] was employed where each factor was set at three levels. The complete design consisted of 15 experiments including twelve combinations of factors and three replicates at the center point. The mathematical equation defining the Box–Behnken design is expressed in (Equation (1)) as follows:
Y = β 0 + i = 1 k β i X i + i = 1 k β ii X i 2 + i 1 < j k j k β ij X i X j
where Y is the response variable; i and j are linear and quadratic coefficients; β 0 , β i , β ii , and β ij are the regression coefficients in the intercept, linear, quadratic and interaction terms respectively; X i and X j are the independent variables and k is the number of factors. The factors were coded as (–1,0 and +1) based on equation (Equation (2)) [45,46] as follows:
x i = X i X 0 Δ X
where x i is the coded value of the ith variable, X i is the uncoded value of the ith test variable and X 0 is the uncoded value of the ith test variable at the center point.

2.5. Heating Pretreatment of Bulk Pumpkin Seeds

The laboratory temperature of 20 °C of the bulk samples of pumpkin seeds served as the control of the experiment. Using the conventional oven method (MEMMERT GmbH + Co. KG, Buechenbach, Germany), the bulk samples were preheated at temperatures of 40, 60, and 80 °C at a time duration of 30 min before the compression tests with other factors combination which was set directly in the universal-compression testing machine (TEMPOS spol. s.r.o., Opava, Czech Republic (Machine Service); ZDM 50, VEB Werkstoffprüfmaschinen Leipzig, Germany).

2.6. Compression Tests and Calculated Responses

The universal compression-testing machine together with the pressing vessel of diameter 60 mm with a plunger were used for the compression tests (Figure 1). Each factors combination (force, speed, and temperature) produced the force-deformation curve data where the responses (oil yield, oil expression efficiency, and energy) were calculated according to the relations given by [33,42,43,47,48]. The energy is characterized by the area under the force-deformation curve according to the trapezoidal rule [33].

2.7. Spectrophotometric Analysis of Oil Samples

A UV–VIS spectrophotometer (VIS V-10 Plus, Giorgio Bormac S.r.l., Carpi, Italy) was used to describe the absorbance and transmittance of the oil samples (control and heated) at different wavelengths. This was to measure the incident light absorbed and light transmitted through the oil samples, which can be used for UV radiation problems on human health [49,50].

2.8. Determination of Chemical Properties of Oils Samples

The peroxide value (PV), acid value (AV), and free fatty acid (FFA) of pumpkin seed oil extracted at laboratory temperature of 22 °C and pretreatment temperatures from 40 °C to 80 °C were determined using the procedures described by [50,51,52]. For PV, 5 g of the oil sample was weighed into a volumetric flask. This was dissolved in 30 mL of chloroform and a glacial acetic acid mixture of ratio (2:3). The mixture was shaken vigorously for exactly 1 min. Thereafter, 30 mL of distilled water was added. The mixture was titrated with 0.1 M sodium thiosulphate solution until the yellow color disappeared using 1 mL of 1% starch as an indicator. Peroxide value was expressed as (meq O2/kg). For AV and FFA determination, 5 g of the oil samples were weighed into a volumetric flask, then 100 ml of neutralized ethanol (warmed up to 60–65 °C) was added together with a 2 mL of 1% phenolphthalein and immediately titrated with an ethanolic KOH (0.1 Normality) up to light pink color. AV and FFA were expressed as (mg KOH/g oil). Three measurements were made, and the mean and standard deviations were calculated.

2.9. Statistical Evaluation of Experimental Data

All experiments were repeated thrice, and the mean and standard deviations were calculated and presented. The experimental data were evaluated statistically using the STATISTICA software (version 13) [53]. The response surface regression technique (General Linear Models) was employed for the data analysis. The obtained regression models were evaluated based on the values of the lack-of-fit and the coefficient of determination (R2). The significance of each coefficient was determined by using the F-test obtained from the analysis of variance (ANOVA) that was generated [44]. The profiles for predicted and desirability for the responses were plotted using the same software. Additional experiments were done to confirm the results of the optimum factors derived from the regression analysis.

3. Results

3.1. Preliminary Test of Pumpkin Seeds under LaboratoryTemperature

The mean and standard deviation values of the preliminary experiments of pumpkin seeds oil extraction at a laboratory temperature of 20 °C are given in Table 1. The responses: deformation, oil yield, oil expression efficiency, and energy were calculated with the varying processing factors—speeds and forces. The deformation values decreased from speed 3 to 5 mm/min and then increased at 7 mm/min. Oil yield, oil extraction efficiency and energy decreased linearly with the increasing speeds. The force increments also increased all the above-mentioned responses. The oil extraction efficiency of 39.59% with corresponding energy of 800.70 J was achieved at a minimum speed of 3 mm/min and a maximum force of 200 kN. The processing factors were further subjected to a response surface regression analysis based on a Box–Behnken Design of the experiment to determine their optimum values as described in the succeeding sections.
The effect of the processing factors on the calculated responses was statistically analyzed using the ANOVA multivariate tests of significance. Based on the results given in Table 2, the varying speeds and forces had a significant effect (p < 0.05) on the responses. However, the interaction effect appeared non-significant (p < 0.05). The observed and predicted values of energy demand for the output oil is plotted in Figure 2 indicating the significance of the determined regression models as elaborated further in the Supplementary Materials (Section 3.12).

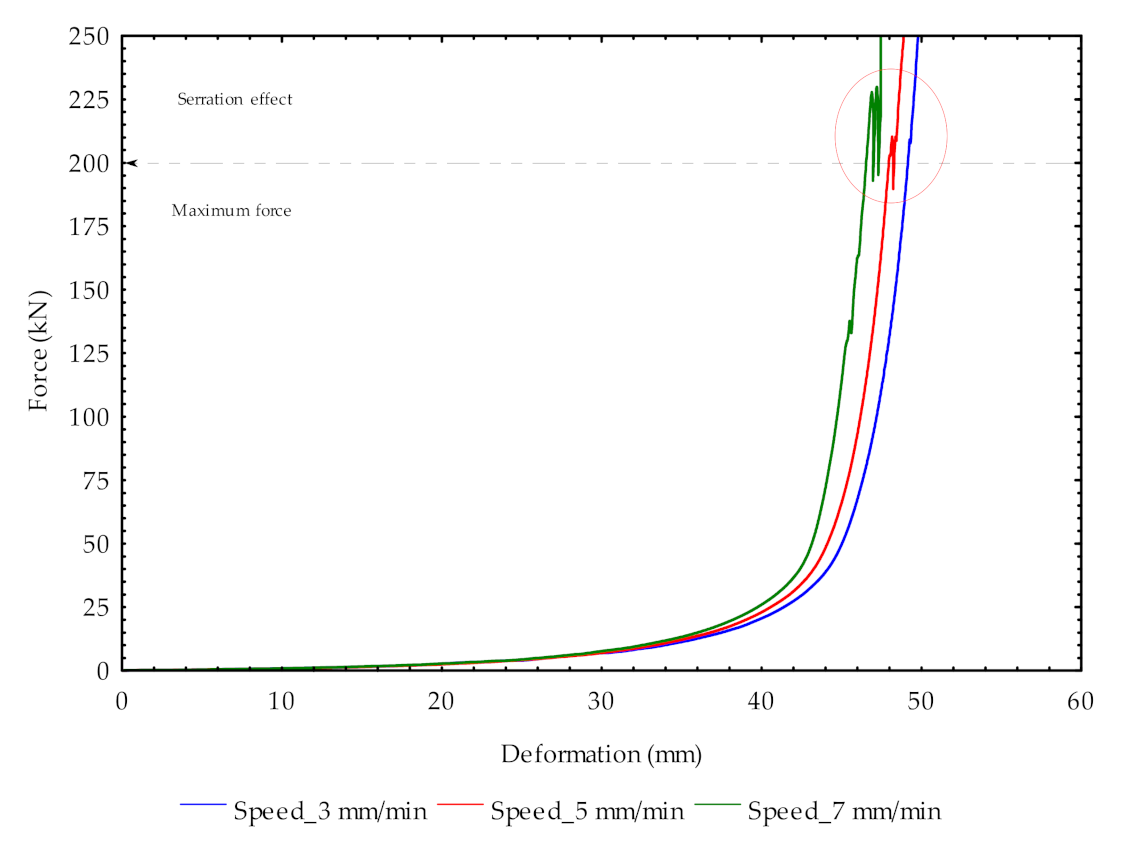
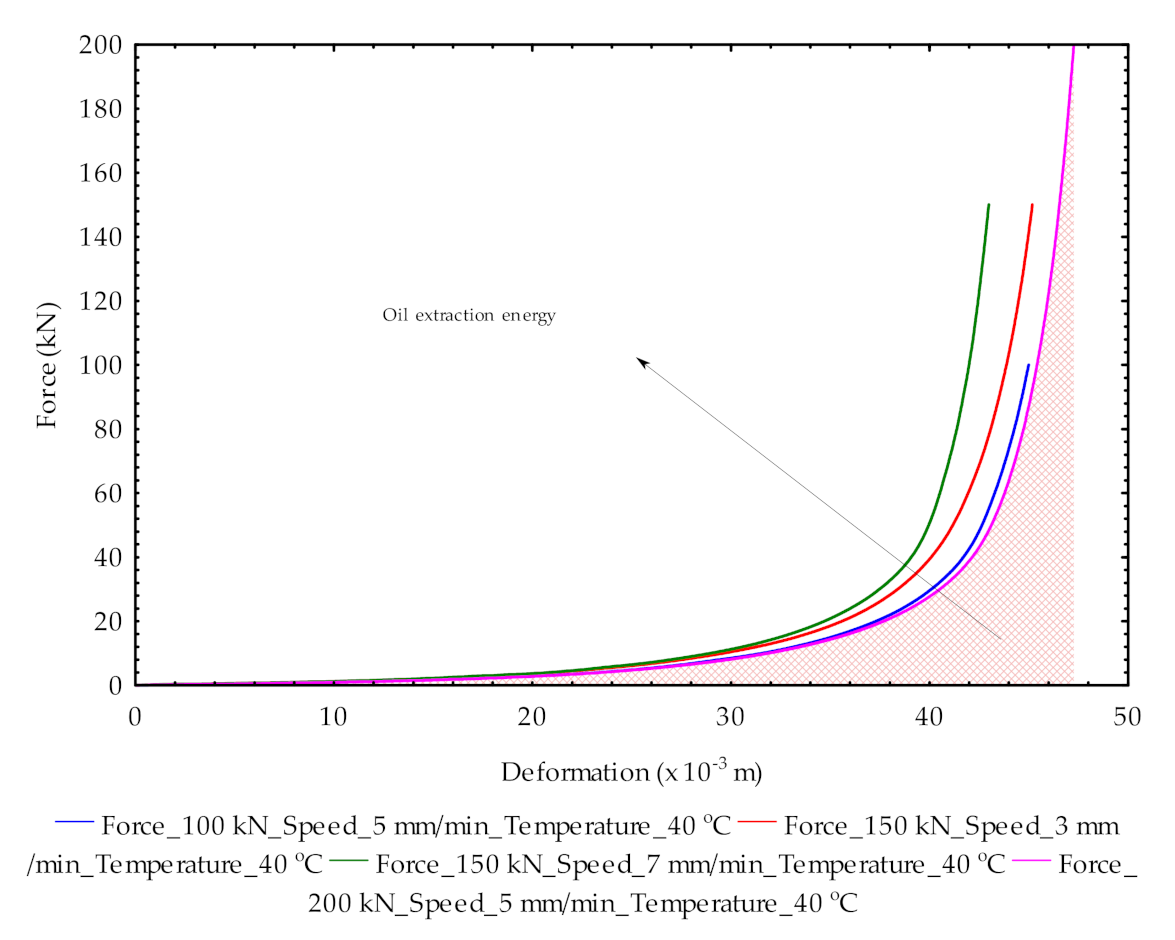
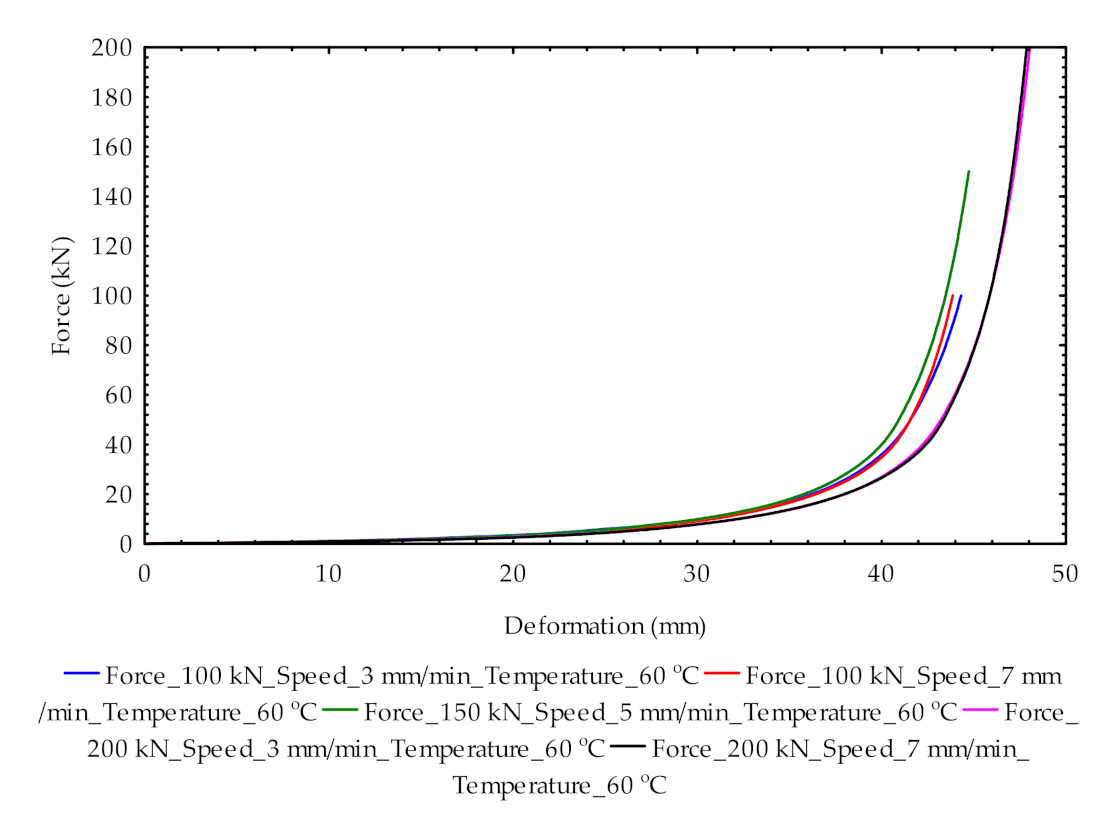
3.2. Effect of Pretreatment on Force-Deformation Curves of Pumpkin Seeds

The maximum force of 200 kN was determined at speeds (3, 5, and 7 mm/min) for extracting the pumpkin seeds oil at a laboratory temperature of 20 °C (Figure 3). Exceeding this limit initiated the serration effect. The maximum force region with the speed, volume of seeds and diameter of pressing vessel without the serration characteristics relate to high oil recovery. However, it is important to mention that not only is the oil recovery efficiency dependent on the above-mentioned processing factors but also the moisture content of the bulk oilseeds and pretreatment methods such as heating [54].
The force–deformation curves of the combination of the factors for all the experiments are illustrated in Figure 4, Figure 5 and Figure 6. The curves showed a smooth behavior denoting maximum oil recovery. The factors levels at 200 kN, 5 mm/min, and 80 °C recorded 14.60 g of oil followed by the factors levels 150 kN, 3 mm/min, and 80 °C of 14.26 g then 200 kN, 3 mm/min, and 60 °C of 14.16 g.

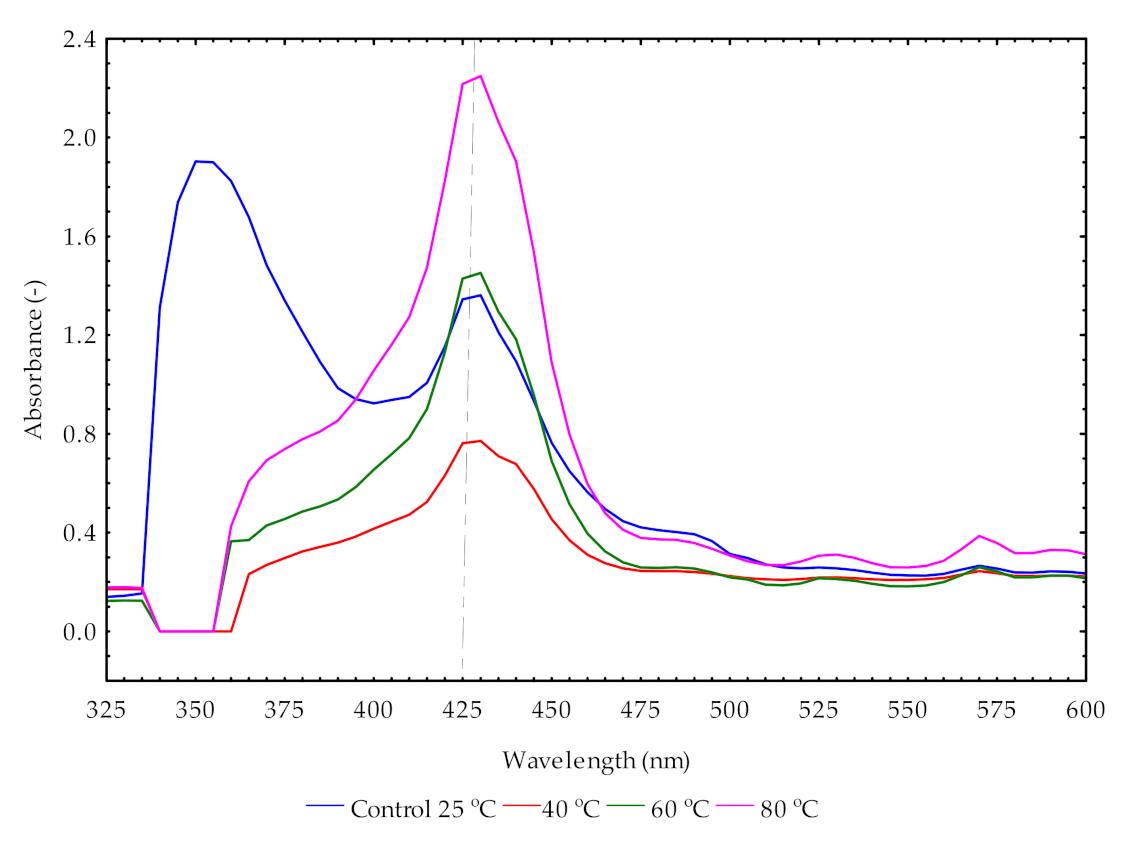
3.3. Spectral Curves of Pumpkin Seeds Oil at Pretreatment Temperatures

The absorbance of pumpkin seeds oil at temperatures between 20 °C and 80 °C was measured at a wavelength range from 325 nm to 600 nm (Figure 7). At wavelength between 355 nm and 350 nm, the control oil sample at 20 °C showed a peak of absorbance value of approximately 2.0. The absorption maximum of the oil samples was observed at the wavelength value of 425 nm. The increase in heating temperatures from 40 °C to 80 °C increased the absorbance value from 0.75 to 2.3. At wavelength values between 475 nm and 575 nm were observed the absorption minimum. The refraction of the absorbance and wavelength curves of the oil samples gives the transmittance–wavelength curves. This is explained in the Supplementary Materials (Section 3.12). The importance of these indicators is also substantiated in the Discussion (Section 4).

3.4. Chemical Properties of Oil Samples

The extracted pumpkin seed oil at room temperature and pretreatment temperatures between 40 °C and 80 °C were analyzed for the peroxide value (PV), acid value (AV) and free fatty acid (FFA) compositions. The means and standard deviations of the compositions are given in Table 3. It was observed that the increase in temperatures increased the PV values whereas that of AV and FFA showed both increasing and decreasing trends along with temperatures. The correlation results showed significant (p < 0.05) for PV with correlation efficiency of 85% but AV and FFA were non-significant (p > 0.05). The statistical parameters of the determined amounts and regression model for PV with temperature effect are given in Table 4 and Table 5. The ratio of the t-value and the model coefficient gives the standard error. The smaller standard error values obtained show the statistical accuracy of the regression model for predicting the PV of pumpkin seed oil under temperature changes.

3.5. Box–Behnken Design of the Factors Combination

The Box–Behnken Design (BBD) of the processing factors combination produced 15 experiments in total. From the bulk samples initial weight of 77.44 g, the calculated parameters were the mass of oil, deformation (Table 6), oil yield, oil expression efficiency and energy (Table 7). The values of the mass of oil, oil yield, and oil expression efficiency ranged from 7.46 to 14.6 g, 9.63 to 18.85%, and 28.64 to 56.06%. The corresponding deformation and energy values ranged from 45 to 47.6 mm and 492.24 to 834.26 J. It was observed that the factors combination (with their coded values) of 200 (1) kN, 5 (0) mm/min, and 80 °C (1) produced the highest oil expression efficiency of 56.06% with the energy utilization of 832.03 J (Table 8). The optimum values of these factors combination and their validation are established in the succeeding sections.

3.6. Determined Regression Models of the Responses

The principal responses in relation to the processing factors or the factors combination for extracting the pumpkin seed oil under uniaxial compression are the oil yield (%), oil expression efficiency (%) and energy (J). The results of the response surface regression analysis are presented in Table 8, Table 9 and Table 10, respectively. For all the responses, the coefficients of the linear terms of the regression models with the oil processing factors were significant (p < 0.05), whereas that of the quadratic and the linear interaction terms were not significant (p > 0.05). The determined regression models of the responses are expressed in equations (Equations (3)–(5)). The smaller standard error values thus explain the precision of the coefficients of the processing factors for predicting the responses. The non-significance (p > 0.05) of the lack-of-fit confirms the reliability of the determined models.
O Y % = 15.71 + 2.23 · X 1 1.26 · X 2 + 2.54 · X 3
O EE % = 46.70 + 6.64 · X 1 3.73 · X 2 + 7.56 · X 3
E N J = 670.09 + 148.89 · X 1 28.59 · X 2 + 14.76 · X 3 .

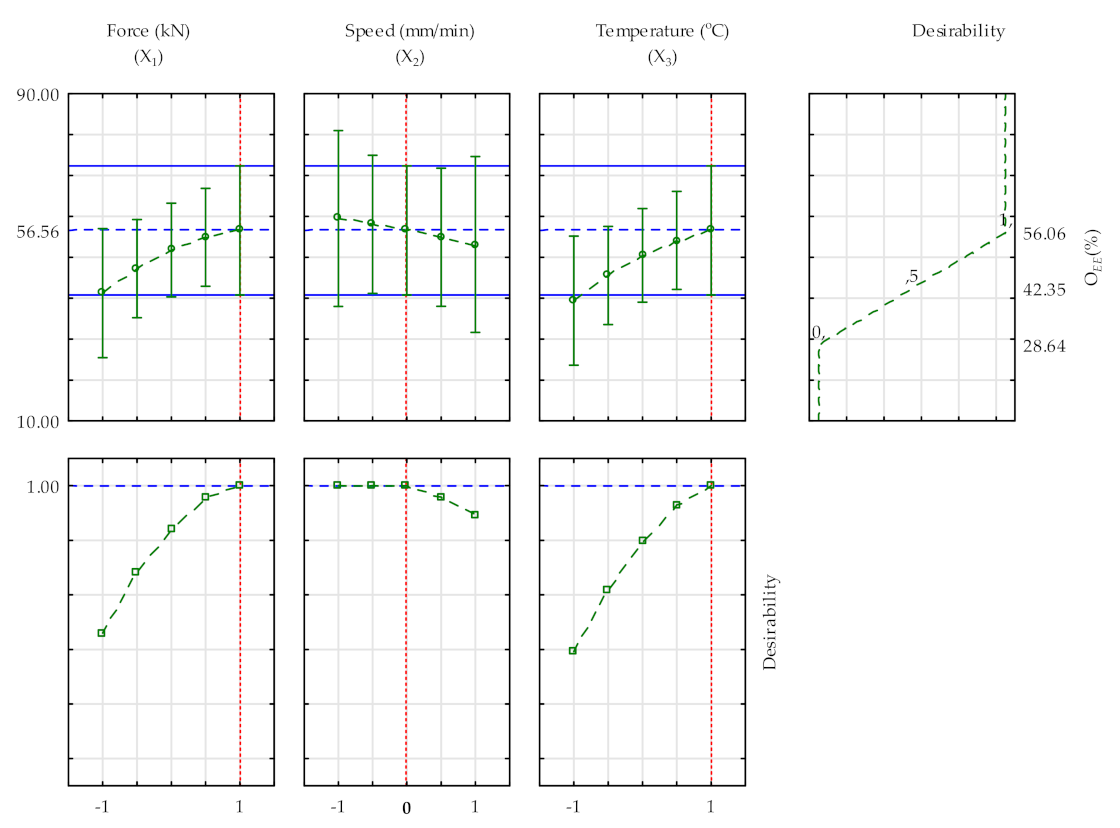
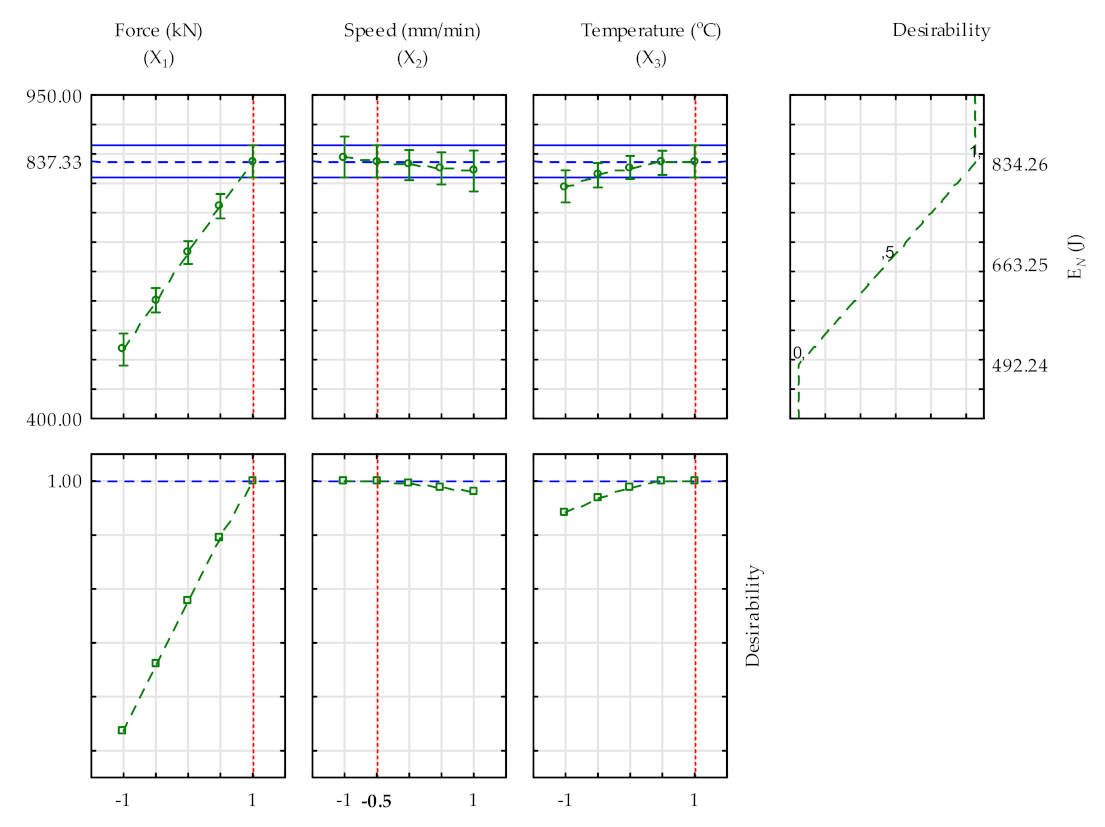
3.7. Optimum Processing Factors for Oil Extraction

The optimum factors: X 1 = 200 (+1) kN; X 2 = 5 (0) mm/min and X 3 = 80 (+1) °C representing the force, speed, and temperature were determined from the regression profiling. The corresponding values of the responses: oil yield, oil expression efficiency, and energy were 19.02%, 56.56%, and 837.33 J, respectively. These amounts using the established regression models (Equations (1)–(3)) predicted the responses to be 20.48%, 60.90%, and 848.04 J. These amounts were validated by additional experiments with the optimum factors as presented in Table 11. At optimum speeds of 4 and/or 5 mm/min, the oil yield, and oil expression efficiency increased at a relaxation time of 12 min. This explains that after the compression process, the relaxation process is necessary to recover some of the residual oil in the seedcake. The profiles for the predicted values and their desirability values for estimating the responses are displayed in Figure 8 and Figure 9. Ideally, the desirability values are between 0 and 1 or 0 and 100%. The higher the desirability value the better the response estimates with the predictors. A desirability value of 1 or 100% was obtained for all the factors for predicting the responses.

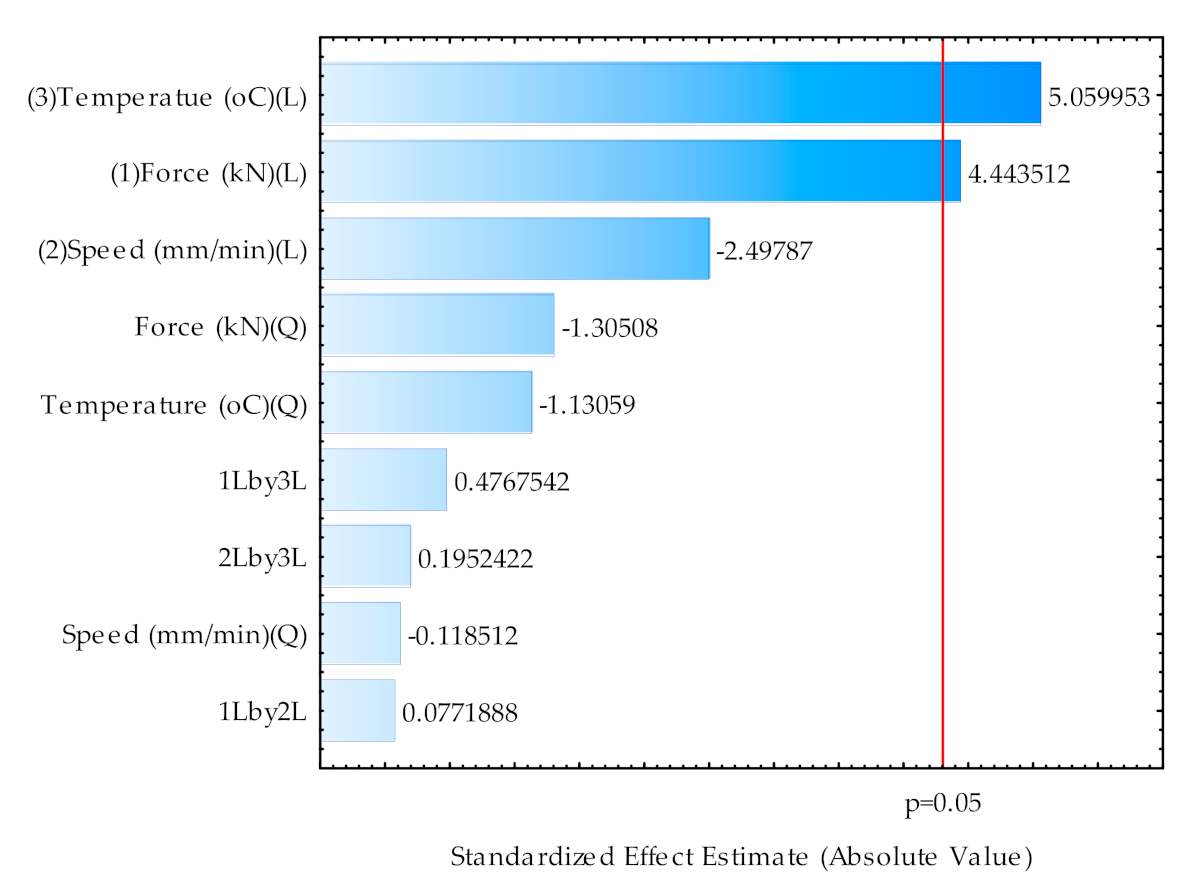
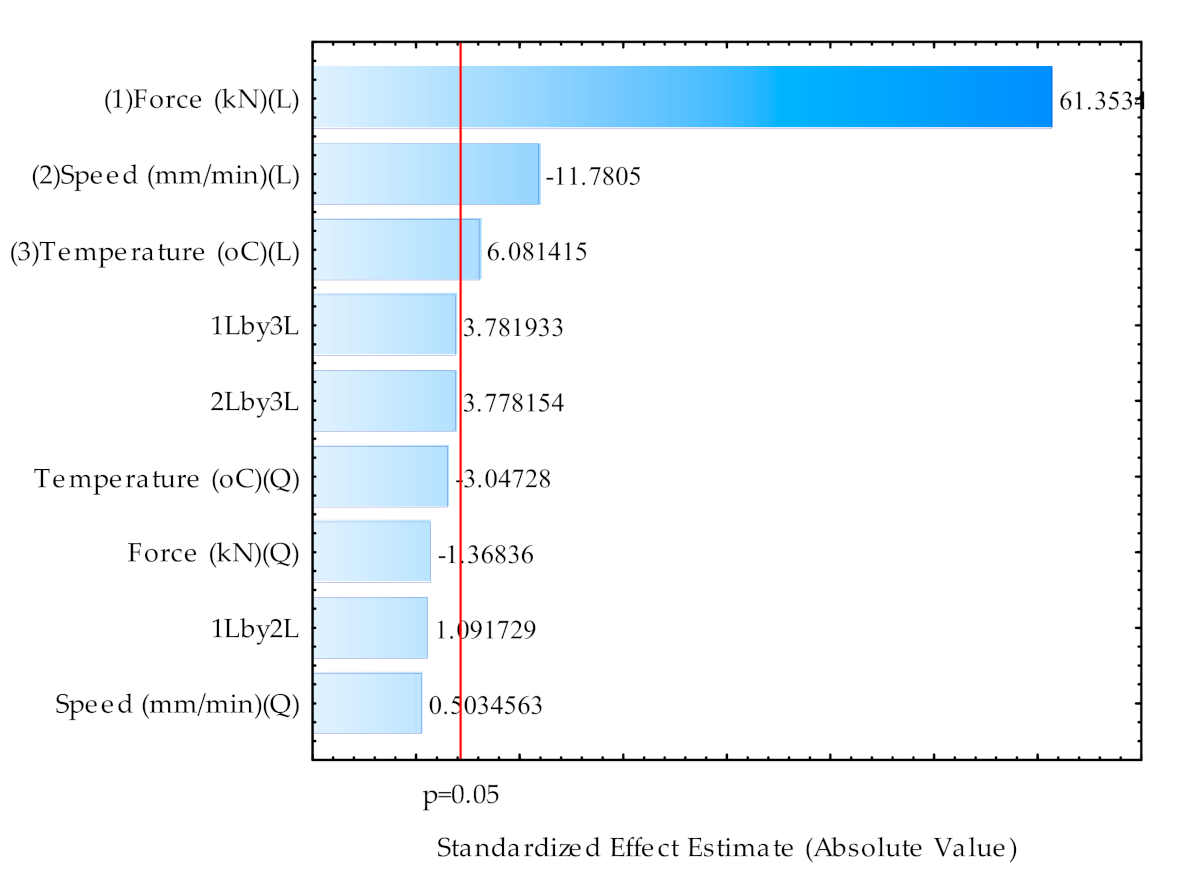
3.8. Percentage Error, Pareto Chart, and Box–Cox Effects on the Responses

The values of the responses were further validated based on the calculation of the percentage error. The percentage error or percentage change is the measure of the experimental and theoretical values. The percentage error values ranged from 0.72 to 8.30% indicating the reliability of the data (Table 12). In addition to that, the Pareto chart standardization effect of the responses: oil expression efficiency and energy, are illustrated in Figure 10 and Figure 11. Only the linear terms of temperature and force were significant (p < 0.05) for predicting the oil expression efficiency of pumpkin seeds compared to the other terms of the factors and their interactions which were not significant (p > 0.05). For energy, all the linear terms of the factors were significant (p > 0.05). However, the quadratic and interaction terms of the factors were not significant.

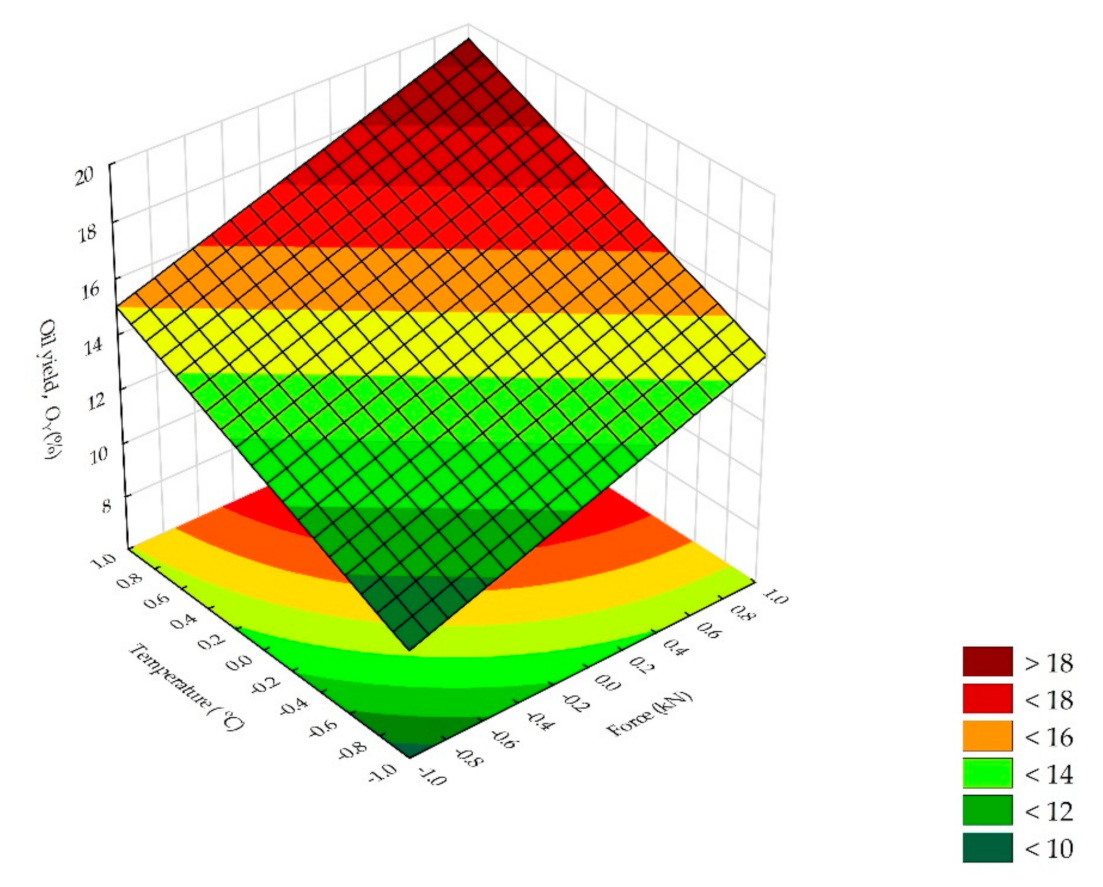
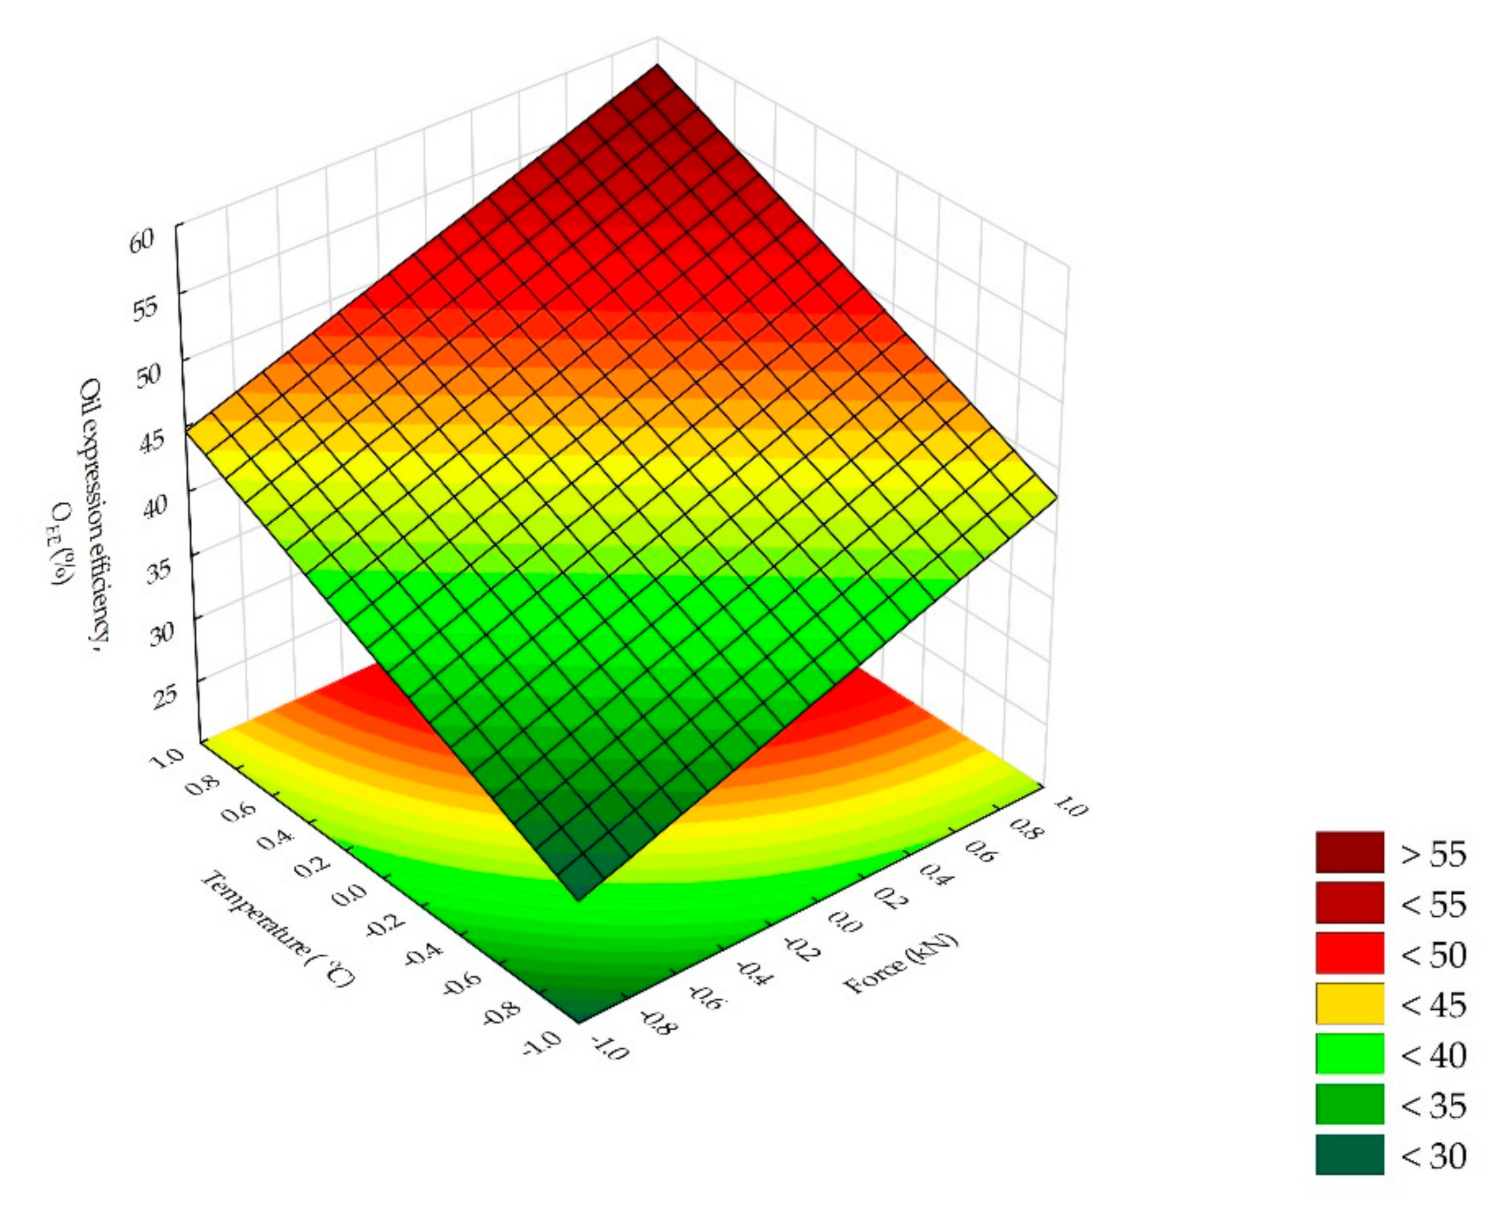
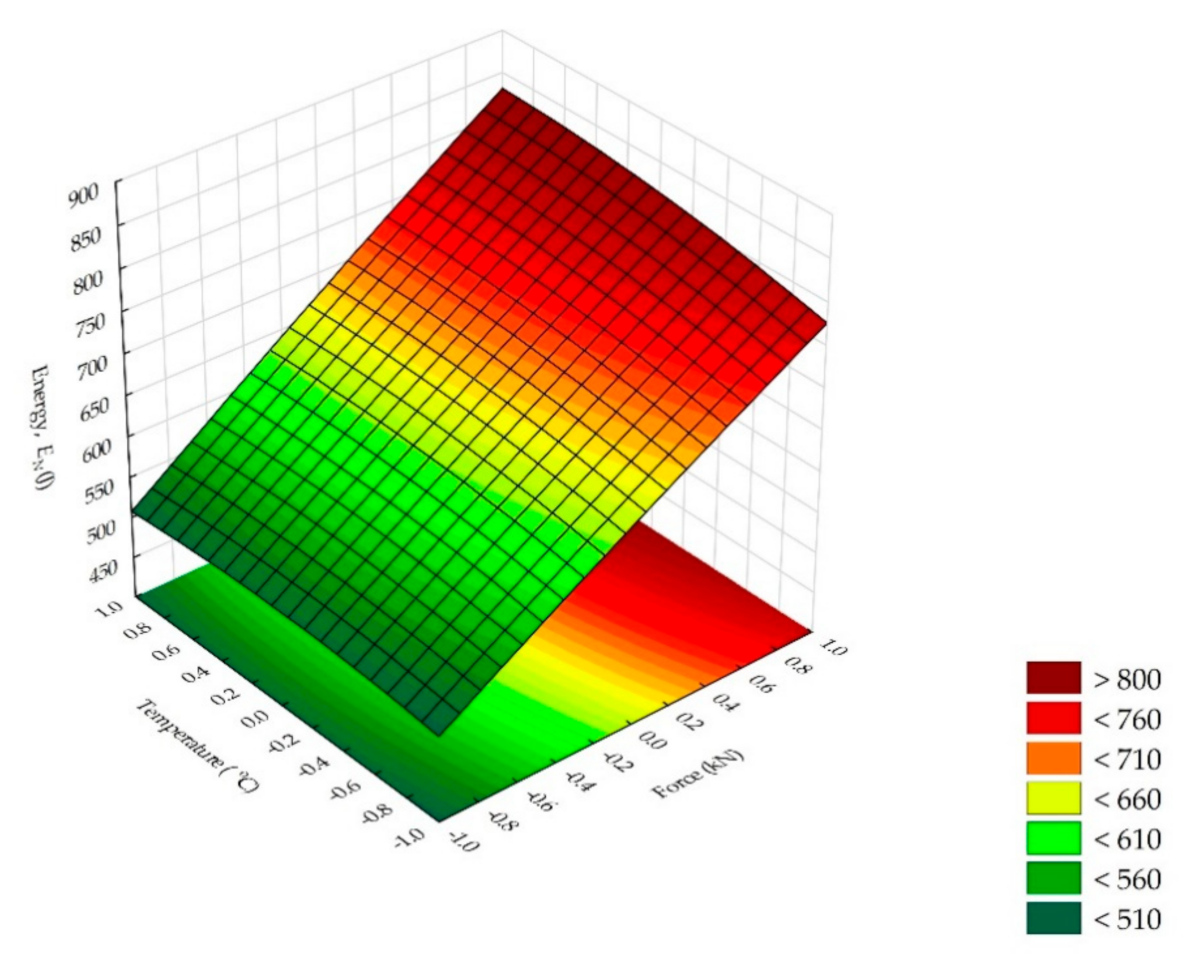
3.9. Fitted Response Surface Plots Verses Processing Factors

The response surface plots of the interaction effect of the processing factors (force and temperature) at constant speed 5 (0) mm min-1 on the responses (oil yield (OY), oil expression efficiency (OEE), and energy (EN)) of pumpkin seeds compression process, are illustrated in Figure 12, Figure 13 and Figure 14, respectively. In Figure 12, the increase in force from 100 kN (–1) to 200 kN (+1) increased the OY of 14.2% and the increase in temperature from 40 °C (–1) to 80 °C (+1) also increased the amount OY of 15%. Their combined effect caused an increase of 19.6%. The corresponding OEE is shown in Figure 13. The individual factors and their interactions produced OEE values of 42.5%, 45% and 58%. On the other hand, the force increments did increase the energy of 775 J for extracting the pumpkin seeds oil, whereas the temperature increments neither increase nor decrease the energy (Figure 14). Nevertheless, the force–temperature interaction effects increased the energy from 500 J to 840 J. In all, the linear function better fitted the responses with their factors than the quadratic function. Furthermore, the speed factor and its interaction with the force and temperature at fixed values are also discussed in the Supplementary Materials. The results of the 3D response plots thus confirm the established regression models.

3.10. Determination of Oil Point Force at Optimum Factors

At optimum factors: Force, X 1 = 200 (+1); Speed, X 2 = 4 (0) and 4 (–0.5), and Temperature, X 3 = 80 (+1), the lower oil point force with the corresponding oil point yield and oil point energy of pumpkin seeds was determined from the observed deformation value of 46.96 mm at a maximum force of 200 kN as given in Table 13. The lower oil point was detected at a deformation value of 42.25 mm for speed 5 mm/min and 42.48 mm for 4 mm/min. The deformation value of 46.96 mm was the upper oil point threshold for higher oil output regarding the diameter of the pressing vessel, initial pressing height of bulk seeds, force, speed, and pre-treatment method.

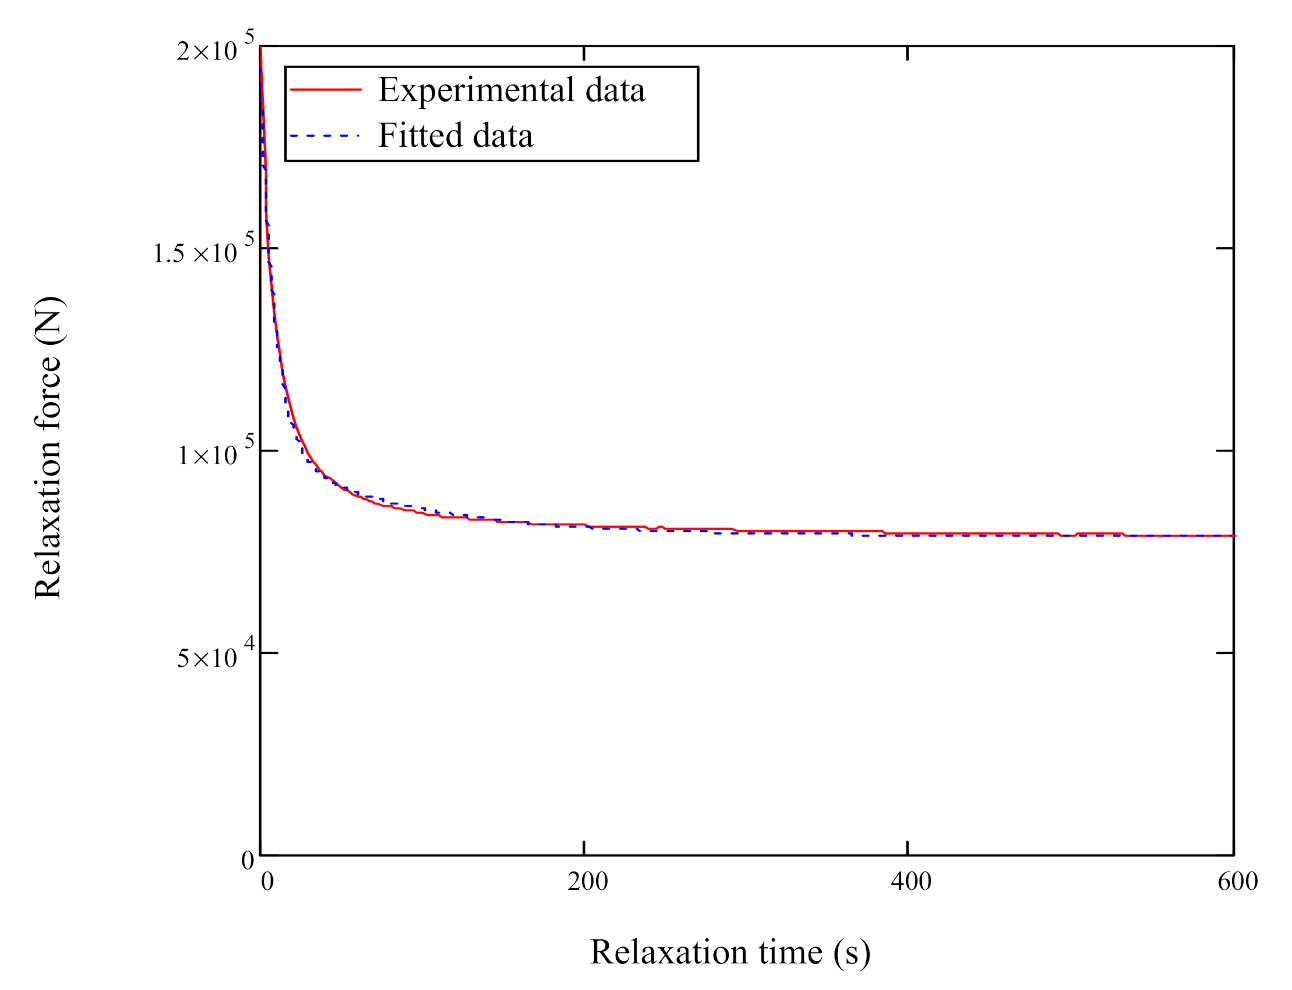
3.11. Compression and Relaxation Curves at Optimum Factors

The compression and relaxation curves at optimum factors: Force, X 1 = 200 (+1); Speed, X 2 = 4 (–0.5); and Temperature, X 3 = 80 (+1) were theoretically described based on the tangent curve model [31,32] and the generalized Maxwell model [55,56,57,58,59,60] with five elements as given in equations (Equations (6) and (7)), respectively.
F x = A · tan B · x n
σ t = E 1 · ε · e E 1 η 1 · t + E 2 · ε · e E 2 η 2 · t + E 3
The determined coefficients of the models and their statistical evaluation are given in Table 14, Table 15 and Table 16. Based on the high values of the coefficient of determination (R2 > 0.999), and the low values of the coefficient of variation (<8%), the applied models accurately described the compression and relaxation processes of bulk pumpkin seeds under uniaxial loading. The fitted data is displayed in Figure 15 and Figure 16, respectively. The results are further explained in the Discussion (Section 4).

3.12. Description of the Supplementary Materials

The correlation results of the preliminary experiments are given in Supplementary Material Tables S1. The speed factor indicated no correlation between deformation and energy (p > 0.05). Oil yield and oil expression efficiency showed a negative correlation (p < 0.05) with increasing speed from 3 to 7 mm/min. On the other hand, the force factor correlated positively (p < 0.05) with all the responses obtaining correlation efficiency values between 54% and 95%. The regression models’ coefficients for predicting the responses are presented in Supplementary Material Table S2. For all the calculated responses, the factors/predictors were significant (p < 0.05) except the speed for deformation, which was not significant (p > 0.05). The values of the coefficient of determination (R2) of the regression models ranged from 0.24 to 0.95. The determined coefficients of the generalized Maxwell’s model and their statistical evaluation for describing the force relaxation–time curve of pumpkin seeds at the optimum factors (force: 200 kN; speed: 5 mm/min and temperature: 80 °C) are given in Supplementary Material Tables S3 and S4. The coefficients were significant since the values of F critical were greater than the F ratio , or the values of P value greater than the probability level of 5% (MathCad 14 software). The transformed data of the force relaxation–time curve to stress relaxation–time curve is illustrated in Supplementary Material Figure S1. It shows that the maximum oil obtained from the pumpkin seeds at the above-mentioned processing conditions was achieved at a maximum stress value of 71 MPa. However, this value is dependent on the applied force and the diameter of the pressing vessel.
The refraction of the absorbance at the various wavelength is the transmittance as shown in Supplementary Material Figure S2. It was observed that the transmittance values of the oil samples at the wavelength range from 360 nm to 425 nm decreased (from 59.27% to 0.6%) with increased heating temperatures. Here, the control showed both increasing and decreasing trends. At the wavelength range from 425 nm to 480 nm, all the oil samples showed increasing transmittance values (from 0.6% to 57.03%). For the wavelength between 480 nm and 600 nm, the transmittance values both increased and decreased. For the control oil sample, the highest transmittance value of 59.43% was recorded at a wavelength value of 555 nm, and for the oil samples at heating temperatures of 40 °C, 60 °C, and 80 °C the transmittance values of 61.9%, 64.97%, and 53.97% were obtained at a wavelength value of 515 nm.
For force and speed interaction effect on oil yield at a constant temperature of 60 (0) °C (Supplementary Material Figure S3a), the quadratic and linear fitting functions did not significantly change the oil yield values. The force increment increased the oil yield value up to 18% whereas the speed increments decreased the oil yield to 11%. Their combined effects recorded the oil yield value of approximately 16%. For speed and temperature at a constant force of 150 (0) kN (Supplementary Material Figure S3b), the temperature increments increased the oil yield of about 18.5% and the speed produced a similar result as indicated above. However, their combined effect recorded a 16% reduction. The linear function highly fitted the interaction of the factors than the quadratic function. Based on these factors’ combination, the corresponding oil expression efficiency and energy are also described below. The interaction effect of the force and speed on oil expression efficiency (OEE) is shown in (Supplementary Material Figure S3c). The force increments recorded OEE of 54%, whereas the speed increments produced approximately 34%. Their combined effect produced 46% OEE. For speed and temperature interactions (Supplementary Material Figure S3d), the speed generated OEE of 32.5%, whereas the temperature recorded 55%. Their combined effects produced 52.5%. Here, the linear function highly fitted the interactions of the factors compared to the quadratic function. Finally, at a constant temperature of 60 °C, the speed increments did not highly increase the energy in comparison with the force increments, which significantly increased the energy amount of approximately 850 J (Supplementary Material Figure S3e). However, their combined effects produced about 850 J. At a constant force of 150 (0) kN for the speed and temperature interactions (Supplementary Material Figure S3f), the speed increments slightly decreased the energy. The temperature increments also slightly increased the energy until 700 J. Their combined effects caused a reduction in the energy of around 650 J.

4. Discussion

To determine the optimum conditions for extracting the pumpkin seeds oil under linear compression loading, the response surface methodology (RSM) was applied using the STATISTICA software (version 13). Three independent variables were examined namely the force, speed, and temperature. These processing factors were coded based on the conditions of the RSM application. The calculated responses were oil yield (%), oil expression efficiency (%) and energy (J). Regression models were determined for the responses with the processing factors. It was found that the processing factors had a significant effect on the responses. While the linear terms had a significant influence on the responses, the quadratic terms and the interactions had no significant influence. The standard error values of the coefficients of the linear terms and the intercepts ranged from 1.07 to 8.57 indicating the certainty of the established models at 95% confidence interval. The determined optimum processing factors were force: X 1 = 200   kN   + 1 ; speed: X 2 = 4   and   5   mm / min   0.5 ,   0 ; and temperature: X 3 = 80   oC   + 1 . These optimum factors produced oil yield of 19.02%, which was predicted to be 20.48 using the determined regression models. The optimized conditions were validated through additional experiments, and the oil yield was calculated to be 20.76%. Similarly, the oil expression efficiency values of 56.56%, 60.90%, and 61.74% were obtained. The corresponding energies were 837.33 J, 848.04 J, and 826.10. The energy at speed 4 mm/min increased by 15.87 J compared to the energy obtained at speed 5 mm/min. The relaxation time of 12 min under the speed of 4 mm/min increased the oil yield and oil expression efficiency of 21.70% and 64.53%. This indicates that the relaxation process with a minimum time of 12 min is essential for recovering the residual oil in the seedcake, which needs to be done immediately after the compression process. The combinations of the optimal factors showed a desirability value of one or 100%, which explains the validity of the results. The percentage error of the experimental and theoretical values of the responses ranged from 0.72% to 8.30% confirming the reliability of the regression models. The Pareto chart of standardization effect revealed that only the temperature and force factors had a significant effect (p < 0.05) on the oil yield and oil expression efficiency. This means that the speed did not significantly influence the above-mentioned responses. It was found that the force, speed, and temperature had a significant effect on the energy response. The interaction terms of the force and temperature, speed, and temperature as well as the quadratic term of temperature were nearer to the significant line, which suggests the tendency of their effect on the energy response. The quadratic terms of the force and speed as well as the interaction terms of force and speed had no significant influence on the energy.
In the literature, temperature affects the density of the fluid, the volatility of the extract components and the desorption of the extracts from the matrix [60]. [61] observed a significant increase in the oil extraction yield from Moringa oleifera leaves with the increase in temperature from 40 °C to 60 °C while the further increase from 60 °C to 80 °C resulted in only a small increase in the yield. [62] reported the highest oil yield of jatropha kernels heated at 80 °C while at a temperature of 40 °C, a lower oil yield was observed. However, the higher the heating temperature, the higher the acid value and free fatty acid levels which thus affects the quality of the oil. Based on the area of the pressing vessel, the pressure or stress was calculated to be 71 MPa. The general hypothesis is that higher pressure will lead to higher temperature generation and higher oil recovery efficiency. Higher speed also relates to higher throughput of the material resulting in higher residual oil in seedcake since less time is available for the oil to drain from the solids. Again, at higher speed, the viscosity thus remains lower resulting in less pressure build-up and more oil content in seedcake [19,63,64,65]. The results obtained thus confirmed the theoretical phenomenon of the processing factors (force, speed, and temperature) examined in this study.
At the maximum deformation of 46.96 mm was found the highest oil output from pumpkin seeds. This is described as the upper oil point dependent on the pressing conditions (maximum force, speed, samples pressing height, and diameter of the pressing vessel). The lower oil point was identified at the deformation value of 42.25 mm with the corresponding force of 49.87 kN. Here, the oil point yield and energy were calculated to be 6.99% and 331.88 J at a speed of 5 mm/min. It is important to mention that at an optimal speed of 4 mm/min, the oil point force, oil point yield and oil point energy increased to 57.32 kN, 8.68%, and 360.77 J, respectively. The tangent curve and the generalized Maxwell models were used to describe the compression and relaxation processes of pumpkin seeds oil extraction. For the tangent model, the coefficients of the force and deformation of mechanical behavior were determined to be 5.427 ± 0.410 kN and 0.03 ± 0.0.001 mm–1. Based on these values, the fitting curve exponent of the tangent model was found to be 2 (–). The coefficients of determination (R2) of the tangent model coefficients ranged from 0.999 to 1. The use of the tangent curve model follows the boundary conditions of the compression process that zero force means zero deformation, increasing force relates to maximum limit deformation and integral of the force, and deformation function denotes energy [31]. Based on these boundary conditions, the theoretical energy can be determined using the MathCad software (Statsoft, version 14) which is based on the Levenberg–Marquardt algorithm [66]. The coefficients of the generalized Maxwell model with three branches and five elements (moduli of elasticity and viscosities) were also statistically significant with high R2 values between 0.999 and 1.
The mechanical behavior of the relaxation process involves the compliance of the condition of constant deformation and strain [59]. The strain is the ratio of the deformation and initial pressing height of the bulk material [33]. The relaxation force can be changed to stress relaxation where the stress is the ratio of the force to that of the cross-sectional area of the pressing vessel [67]. The generalized Maxwell model with three branches and five elements is based on the components of spring and dashpot. The Hookean law explains the spring arrangement whereas the Newtonian fluid concept is applied to the dashpot where the moduli of elasticity and the viscosities of the material need to be determined either numerically or analytically. The combinations of these components/concepts constitute the rheological mechanical models, which can be used to describe the viscoelastic behavior of compressed materials such as bulk oilseeds [59,68,69].
The UV visible absorption and transmittance of pumpkin seeds oil samples of different heating temperatures of 40 °C, 60 °C, and 80 °C were evaluated at a wavelength between 325 nm and 600 nm. The absorption peaks of the oil samples were observed at wavelength values of 350 nm and 425 nm. At the wavelength range from 425 nm to 600 nm, all the oil samples showed no noticeable peaks except the oil sample of 80 °C, which slightly peaked at a wavelength of 575 nm with the corresponding absorption value of 0.4. The two absorption peaks of the control oil sample recorded the absorption values of 1.35 and 1.9. For the oil samples at heating temperatures of 40 °C, 60 °C, and 80 °C, the absorption peaks values at 425 nm were 0.8, 1.4, and 2.2. It was seen that at the absorption peak of 425 nm, the increase in the heating temperatures of the oil samples increased the absorption values. From the Beer–Lambert law, if the absorption is stronger the value of absorptivity will be also stronger [50,70]. [71] reported the absorption peak of water samples in the range of 200 to 250 nm wavelengths. [72] also reported absorbance peaks for milk and dye mixture at wavelengths between 400 and 800 nm. Commonly, the light absorption law is exponential, and the light intensity of the transmitted light decreases nonlinearly, and the degree of attenuation is caused by both the density of the molecules and optical pathlength, while the beam path in the sample also has significance [73,74,75,76]. The refraction of the absorbance and wavelength curves of the oil samples gives the transmittance–wavelength curves. The transmission rates were > 70% which suggest that the pumpkin seed oil can be used as a skin softener protection against ultraviolet rays [50,77].
In this study, some of the chemical properties of pumpkin seed oil extracted under different temperatures were determined. These include peroxide value (PV), acid value (AV), and free fatty acid (FFA). The PV values ranged from 5.5 ± 0.707 to 9 ± 1.414 (meq O2/kg). The AV values ranged from 1.112 ± 0.016 to 1.167 ± 0.016 (mg KOH/g oil). The FFA values were between 0.559 ± 0.008 and 0.587 ± 0.008 (mg KOH/g oil). Peroxide value measures the degree of peroxidation or adulteration which could be used to evaluate the quality and stability of oils during storage [50,51,78]. Acidity is a parameter related to oil processing, preservation, and quality of the raw material. It relates to the formation of hydrolytic rancidity [79]. The lower PV, AV, and FFA values agreed with the results published by [80] which indicates that the extracted oil is of high quality under the pretreatment temperatures between 22 °C and 80 °C. [81] reported lower FFA content of 0.30% for cold-pressed oil from uncooked pennycress seeds compared to cooked seeds which increased FFA from 0.37 to 0.51%. High FFAs in crude oil results in high losses during the refining process [51]. The values obtained were within the allowable limit for edible oils [79,82]. However, the chemical properties of edible oils could vary based on the varieties, genetic diversity, and chemical composition of the cultivar [78,79,83,84].
Several authors but not limited to the following [36,40,44,85,86,87,88,89,90], have employed the response surface methodology to optimize the processing factors/conditions and their corresponding effect on the responses. Some of their findings are highlighted below. [36] found optimum combination factors of the temperature of 200 °C, time of 3 min, and pressure of 30 bar for compression molding for flax reinforced biocomposites. [40], reported that the increase in applied pressure, extraction time, and pressing temperature increased energy consumption of the mechanical oil extraction process from Camellia oleifera seeds. Based on the 3D surface plots, the authors further mentioned that oil yield increased first and then decreased with the increase of temperature. [44] investigated the effect of temperature, solid/liquid ratio, and particle size on oil yield from olive pomace. The authors identified the optimal conditions for the oil yield at a temperature of 60 °C, solid/liquid ratio of 1/12 g/ml, and particle size of 0.5 mm. The authors further stated that an increase of temperature from 40 to 60 °C for the olive pomace particle size of 0.5 mm increased the oil yield from approximately 8% to 11%, whereas a decrease in the particle size from 2 to 0.5 mm at 60 °C promoted a yield increase from approximately 6 to 11%. [85] obtained cracking efficiency of 84.34% at an optimal cracking speed of 134 rpm, the feed rate of 0.26 kg/s, and heat conditioning time of 6 min for Tympanotonus fuscatus in comparison with Pachymelania aurita periwinkles variety where the optimum cracking efficiency of 86.03% at an optimal cracking speed of 133 rpm, the feed rate of 0.23 kg/s, and heat conditioning time of 8 min were obtained. Ref. [86] mentioned optimal value for fatty acids and methyl esters yield of 87.175% using ultrasound irradiation at processing conditions of molar ratio (methanol to oil) of 4.63:1, a reaction time of 5.22 min, pulse of 0.4 s, and amplitude of 56.50%. Ref. [87] conducted a study on the influence of extraction temperature, ultrasound treatment time, and solvent-to-canola ratio on the percentage of the extracted oil and oxidative stability. The optimized processing conditions that the authors found for canola seed oil extraction by hexane were 55 °C, 87 min, and 6.39 (%v/w). Ref. [88] explored the enzymolysis process variables on the degree of hydrolysis on lotus seed protein. The optimized conditions they found were a protein substrate concentration of 15 g/L, pH of 5.5, enzymolysis temperature of 57 °C, papain amount of 0.5 g/L, and enzymolysis time of 45 min, for which the predicted value of the degree of hydrolysis was 35.64%. Ref. [89] observed the optimum conditions namely the initial concentration of 49.06 mg/L, initial solution pH of 5.36, adsorbent dose of 0.15 g, and temperature of 31.96 °C for the removal of fluoride on Brushite. Lastly, [90] studied the combined effect of heating temperature and moisture content on sesame oil extraction by a screw press. The authors stated that the heating temperature of 75 °C and moisture content of 6.3% yielded high sesame oil with minimum residual oil in the seedcake.
In this present study, the response surface approach provided a better understanding of the optimum processing conditions for oil extraction from oilseeds under uniaxial compression. The results agree with the findings of other authors from diverse research disciplines. However, it is appropriate to indicate that not only the processing factors enumerated in this study influence the uniaxial oil extraction process but also the granulometric size distribution of the seeds from different varieties as well as the friction between the seeds and the inside walls of the pressing vessel and the contact with the plunger. These measurements are beyond the scope of the present study, but it would be considered in our future studies by adopting the shape classification and friction concepts in the literature [91,92,93,94,95,96]. Information also on the sensory attributes [97,98,99,100] of the oil such as mellow, sweet smell among others from different varieties of oilseeds would be provided. The studies in the future would provide new insights into the uniaxial oil extraction process of bulk oilseeds.

5. Conclusions

In this present study, the principles of RSM, the tangent curve model, and the generalized Maxwell model were employed to describe the compression and relaxation processes of pumpkin seeds oil extraction. Three independent factors (forces, speeds, and temperatures) were examined for their effect on the responses (oil yield, oil expression efficiency and energy). From the experimental data, the oil yield of 18.85% and oil expression efficiency of 56.06% with the corresponding energy of 832.03 J were achieved at the factors’ combination of force, 200 kN, speed 5 mm/min, and temperature 80 °C. The response profiling analysis revealed the combination of the optimum factors of (force, 200 kN, speed 4 mm/min, and temperature 80 °C) which produced oil yield of 19.02%, oil expression efficiency of 56.56% with energy value of 837.33 J. The determined regression models predicted the responses: oil yield of 20.48%, oil expression efficiency of 60.90%, and energy value of 848.04 J. The validated results based on the additional experiments produced oil yield of 19.06%, oil expression efficiency of 56.66%, and energy of 826.10 J. The relaxation time of 12 min at the optimum factors (force, 200 kN, speed 5 mm/min, and temperature 80 °C) generated oil yield of 19.78% and oil expression efficiency of 58.83%. The optimized processing factors (force, 200 kN, speed 4 mm/min, and temperature 80 °C) together with the relaxation time of 12 min produced the highest oil yield of 21.70% and oil expression efficiency 64.53%. The compression and relaxation processes need to be considered in the uniaxial oil extraction of bulk oilseeds. Oil extraction efficiency increased with the increase in temperature and relaxation process. There was no energy utilization during the relaxation process because relaxation is done at a constant strain of the material to recover the residual oil. It was found that at a maximum force of 200 kN and samples heating temperature of 80 °C, the optimum speed of 4 mm/min was ideal for extracting the pumpkin seeds oil under linear/uniaxial pressing valid for the pressing vessel of diameter 60 mm and samples pressing height of 60 mm = 77.44 g). The percentage error of the experimental and theoretical values of the responses ranged from 0.72 to 8.30% proving the reliability of the determined regression models as a function of the processing factors. The desirability function value of one or 100% found in this study indicates a high accuracy of the optimized conditions for oil extraction from bulk pumpkin seeds by uniaxial process. The lower oil point forces between 49.87 and 57.32 were determined at a deformation value of 42.25 mm, which can be used to predict the maximum force for processing bulk pumpkin seeds using different vessel diameters. The tangent model with a fitting curve value of two and the generalized Maxwell model with three branches and five elements (moduli of elasticity and viscosities) showed statistically significant (p > 0.05) in the case of (Mathcad 14 software) for describing the compression and relaxation processes of pumpkin seeds oil extraction. The increase in heating temperatures significantly increased the peroxide value whereas acid value and free fatty acid did not correlate with the heating temperatures. The determined chemical properties of the pumpkin seeds oil were within the acceptable limit of quality usage. The study provides relevant information for describing bulk oilseeds under compression loading which can be applied to the industrial processing of oilseeds involving mechanical screw presses to optimize the process and to improve the quality of the oil for both domestic and industrial applications. Nevertheless, further studies (friction and shape classification of the seeds inside the pressing vessel and sensory profiling of the oil) are needed to gain full knowledge of the uniaxial oil extraction process.

Supplementary Materials

The following are available online at https://www.mdpi.com/2227-9717/9/3/540/s1, Table S1: Correlation results of processing factors and responses of pumpkin seeds oil extracted at 25 °C, Table S2: Determined regression models for the responses of pumpkin seeds oil extraction at 25 °C, Table S3: Determined coefficients of Maxwell model with five elements at optimum processing factors, and Table S4: Statistical analysis of Maxwell model with five elements at optimum processing factors, Figure S1: Relaxation stress versus time of pumpkin seeds at optimum processing factors and Figure S2: Transmittance versus wavelength of pumpkin seeds oil at room and heating temperatures. Figure S3: Surface and contour plots of factors interactions (force, speed, and temperature) on the responses: oil yield (a) and (b); oil expression efficiency (c) and (d) and energy (e) and (f) of pumpkin seeds.

Author Contributions

Conceptualization, A.K., C.D. and D.H.; methodology, A.K., Č.M. and C.D.; validation, A.K., O.D. and D.H.; formal analysis, A.K., Č.M., O.D. and C.D.; investigation, A.K., P.H. and C.D.; data curation, A.K., P.H. and C.D.; writing—original draft, A.K.; writing—review and editing, A.K., Č.M., O.D., P.H., D.H. and C.D. All authors have read and agreed to the published version of the manuscript.

Funding

This research received no external funding.

Institutional Review Board Statement

Not applicable.

Informed Consent Statement

Not applicable.

Data Availability Statement

The data presented in this study are available on request from the corresponding author.

Conflicts of Interest

The authors declare no conflict of interest.

References

  1. Ozberk, Z.A.; Ergonul, P.G. Chapter 18–Cold pressed pumpkin seed oil. In Green Technology, Bioactive Compounds, Functionality and Applications; Academic Press: Cambridge, MA, USA, 2020; pp. 219–229. [Google Scholar]
  2. Amin, M.Z.; Islam, T.; Mostofa, F.; Uddin, M.J.; Rahman, M.M.; Satter, M.A. Comparative assessment of the physicochemical and biochemical properties of native and hybrid varieties of pumpkin seed and seed oil (Cucurbita maxima Linn.). Heliyon 2019, 5, 1–6. [Google Scholar] [CrossRef] [PubMed] [Green Version]
  3. Salgin, U.; Korkmaz, H. A green separation process for recovery of healthy oil from pumpkin seed. J. Supercrit. Fluids 2011, 58, 239–248. [Google Scholar] [CrossRef]
  4. El-Adaway, T.A.; Taha, K.M. Characteristics and composition of watermelon, pumpkin and paprika seed oils and flours. J. Agric. Food Chem. 2001, 49, 1253–1259. [Google Scholar] [CrossRef]
  5. Can-Cauich, C.; Sauri-Duch, E.; Moo-Huchin, V.M.; Betancur-Ancona, D. Effect of extraction and specie on the content of bioactive compounds and antioxidant activity of pumpkin oil from Yucatan, Mexico. Food Chem. 2019, 285, 186–193. [Google Scholar] [CrossRef] [PubMed]
  6. Ojeda-Amador, R.M.; Fregapane, G.; Salvador, M.D. Composition and properties of virgin pistachio oils and their by-products from different cultivars. Food Chem. 2018, 240, 123–130. [Google Scholar] [CrossRef]
  7. Amin, M.Z.; Rity, T.I.; Uddin, M.R.; Rahman, M.M.; Uddin, M.J. A comparative assessment of anti-inflammatory, anti-oxidant and anti-bacterial activities of hybrid and indigenous varieties of pumpkin seed oil. Biocatal. Agric. Biotechnol. 2020, 28, 1–7. [Google Scholar] [CrossRef]
  8. Xie, J.M. Induced polarization effect of pumpkin protein on B16 cell. FJMU 2004, 38, 394–395. [Google Scholar]
  9. Xia, H.C.; Li, F.; Zhang, Z.C. Purification and characterization of Moschatin, a novel type I ribosome-inactivating protein from the mature seeds of pumpkin (Cucurbita moschata), and preparation of its immunotoxin against human melanoma cells. Cell Res. 2003, 13, 369–374. [Google Scholar] [CrossRef] [Green Version]
  10. Yadav, M.; Jain, S.; Tomar, R.; Prasad, G.B.K.S.; Yadav, H. Medicinal and biological potential of pumpkin: An updated review. Nutr. Res. Rev. 2010, 23, 184–190. [Google Scholar] [CrossRef] [Green Version]
  11. Allocati, N.; Masulli, M.; Alexeyev, M.F.; Ilio, C.D. Escherichia coli in Europe an overview. Int. J. Environ. Res. Public Health. 2013, 10, 6235–6254. [Google Scholar] [CrossRef] [PubMed]
  12. Lim, J.Y.; Yoon, J.; Hovde, C.J. A brief overview of Escherichia coli 0157:H7 and its plasmid 0157. J. Microbiol. Biotechnol. 2010, 20, 5–14. [Google Scholar] [CrossRef] [PubMed] [Green Version]
  13. Todar, K. Pathogenic E. coli. Online Textbook of Bacteriology; Department of Bacteriology, University of Wisconsin-Madison: Madison, WI, USA, 2007; pp. 1–30. [Google Scholar]
  14. Nishimura, M.; Ohkawara, T.; Sato, H.; Takeda, H.; Nishihira, J. Pumpkin seed oil extracted from Cucurbita maxima improves urinary disorder in human overactive Bladder. J. Tradit. Complement. Med. 2014, 4, 72–74. [Google Scholar] [CrossRef] [PubMed] [Green Version]
  15. Durante, M.; Montefusco, A.; Marrese, P.P.; Soccio, M.; Pastore, D.; Piro, G.; Giovanni, M.; Lenucci, M.S. Seeds of pomegranate, tomato and grapes: An underestimated source of natural bioactive molecules and antioxidants from agri-food by-products. J. Food Compos. Anal. 2017, 63, 65–72. [Google Scholar] [CrossRef]
  16. Durante, M.; Lenucci, M.S.; D’Amico, L.; Piro, G.; Mita, G. Effect of drying and co-matrix addition on the yield and quality of supercritical CO2 extracted pumpkin (Cucurbita moschata Duch.) oil. Food Chem. 2014, 148, 314–320. [Google Scholar] [CrossRef]
  17. Jiao, J.; Li, Z.G.; Gai, Q.Y.; Li, X.J.; Wei, F.Y.; Fu, Y.J.; Ma, W. Microwaveassisted aqueous enzymatic extraction of oil from pumpkin seeds and evaluation of its physicochemical properties, fatty acid compositions and antioxidant activities. Food Chem. 2014, 147, 17–24. [Google Scholar] [CrossRef] [PubMed]
  18. Bogaert, L.; Mathieu, H.; Mhemdi, H.; Vorobiev, E. Characterization of oilseeds mechanical expression in an instrumented pilot screw press. Ind. Crops Prod. 2018, 121, 106–113. [Google Scholar] [CrossRef]
  19. Karaj, S.; Muller, J. Optimizing mechanical oil extraction of Jatropha curcas L. seeds with respect to press capacity, oil recovery and energy efficiency. Ind. Crops Prod. 2011, 34, 1010–1016. [Google Scholar]
  20. Mpagalile, J.J.; Hanna, M.A.; Weber, R. Seed oil extraction using a solar powered screw press. Ind. Crops Prod. 2007, 25, 101–107. [Google Scholar] [CrossRef]
  21. Rezig, L.; Chouaibi, M.; Ojeda-Amador, R.M.; Gomez-Alonso, S.; Salvador, M.D.; Fregapane, G.; Hamdi, S. Cucurbita maxima pumpkin seed oil: From the chemical properties to the different extracting techniques. Not. Bot. Horti Agrobot. Cluj-Napoca 2018, 46, 663–669. [Google Scholar] [CrossRef] [Green Version]
  22. Koubaa, M.; Mhemdi, H.; Barba, F.J.; Roohinejad, S.; Greiner, R.; Vorobiev, E. Oilseed treatment by ultrasounds and microwaves to improve oil yield and quality: An overview. Food Res. Int. 2016, 85, 59–66. [Google Scholar] [CrossRef]
  23. Ofori-Boateng, C.; Teong, L.K.; JitKang, L. Comparative exergy analyses of Jatropha curcas oil extraction methods: Solvent and mechanical extraction processes. Energy Convers. Manag. 2012, 55, 164–171. [Google Scholar] [CrossRef]
  24. Zheng, Y.L.; Wiesenborn, D.P.; Tostenson, K.; Kangas, N. Energy analysis I the screw pressing of whole and dehulled flaxseed. J. Food Eng. 2005, 66, 193–202. [Google Scholar] [CrossRef]
  25. Wiesenborn, D.; Doddapaneni, R.; Tostenson, K.; Kangas, N. Cooking indices to predict screw-press performance for crambe seed. J. Am. Oil Chem. Soc. 2001, 78, 467–471. [Google Scholar] [CrossRef]
  26. Sivakumaran, K.; Goodrum, J. Laboratory oilseed processing by a small screw press. J. Am. Oil Chem. Soc. 1988, 65, 932–935. [Google Scholar] [CrossRef]
  27. Olayanju, T.; Akinoso, R.; Oresanya, M. Effect of wormshaft speed, moisture content and variety on oil recovery from expelled beniseed. Agric. Eng. Int. CIGR J. 2006, 43, 181–183. [Google Scholar]
  28. Olayanju, T. Effect of wormshaft speed and moisture content on oil and cake qualities of expelled sesame seed. Trop. Sci. 2003, 43, 181–183. [Google Scholar] [CrossRef] [Green Version]
  29. Zheng, Y.L.; Wiesenborn, D.P.; Tostenson, K.; Kangas, N. Screw pressing of whole and dehulled flaxseed for organic oil. J. Am. Oil Chem. Soc. 2003, 80, 1039–1045. [Google Scholar] [CrossRef]
  30. Ward, J. Pre-pressing of oil from rapeseed and sunflower. J. Am. Oil Chem. Soc. 1994, 61, 1358–1361. [Google Scholar] [CrossRef]
  31. Sigalingging, R.; Herak, D.; Kabutey, A.; Cestmir, M.; Divisova, M. Tangent curve function description of mechanical behaviour of bulk oilseeds: A review. Sci. Agric. Bohem. 2014, 45, 259–264. [Google Scholar] [CrossRef] [Green Version]
  32. Sigalingging, R.; Herak, D.; Kabutey, A.; Dajbych, O.; Hrabe, P.; Cestmir, M. Application of a tangent curve mathematical model for analysis of the mechanical behaviour of sunflower bulk seeds. Int. Agrophys. 2015, 29, 517–524. [Google Scholar] [CrossRef] [Green Version]
  33. Divisova, M.; Herak, D.; Kabutey, A.; Sigalingging, R.; Svatonova, T. Deformation curve characteristics of rapeseeds and sunflower seeds under compression loading. Sci. Agric. Bohem. 2014, 45, 180–186. [Google Scholar]
  34. Munson-Mcgee, S.H. D-optimal experimental designs for uniaxial expression. J. Food Process Eng. 2014, 37, 248–256. [Google Scholar] [CrossRef]
  35. Jaya, S.; Durance, T.D. Stress relaxation behaviour of microwave-vacuum-dried alginate gels. J. Texture Stud. 2008, 39, 183–197. [Google Scholar] [CrossRef]
  36. Kandar, M.I.M.; Akil, H.M. Application of design of experiment (DoE) for parameters optimization in compression moulding for flax reinforced biocomposites. Procedia Chem. 2016, 19, 433–440. [Google Scholar] [CrossRef] [Green Version]
  37. Salamatinia, B.; Mootabadi, H.; Hashemizadeh, I.; Abdullah, A.Z. Intensification of biodiesel production from vegetable oils using ultrasonic-assisted process: Optimization and kinetic. Chem. Eng. Process. 2013, 73, 135–143. [Google Scholar] [CrossRef]
  38. Box, G.E.P.; Draper, N.R. Empirical Model-Building and Response Surfaces; John Willey and Sons: New York, NY, USA, 1987. [Google Scholar]
  39. ISI. Indian Standard Methods for Analysis of Oilseeds; IS:3579; ISI: New Delhi, India, 1966. [Google Scholar]
  40. Huang, S.; Hu, Y.; Li, F.; Jin, W.; Godara, V.; Wu, B. Optimization of mechanical oil extraction process from Camellia oleifera seeds regarding oil yield and energy consumption. J. Food Process Eng. 2019, 42, 1–11. [Google Scholar] [CrossRef]
  41. Blahovec, J. Agromatereials Study Guide; Czech University of Life Sciences Prague: Prague, Czech Republic, 2008. [Google Scholar]
  42. Niu, L.; Li, J.; Chen, M.S.; Xu, Z.F. Determination of oil contents in Sacha inchi (Plukenetia volubilis) seeds at different developmental stages by two methods: Soxhlet extraction and time-domain nuclear magnetic resonance. Ind. Crops Prod. 2014, 56, 187–190. [Google Scholar] [CrossRef]
  43. Danlami, J.M.; Arsad, A.; Zaini, M.A.A. Characterization and process optimization of castor oil (Ricinus communis L.) extracted by the soxhlet method using polar and non-polar solvents. J. Taiwan Inst. Chem. Eng. 2015, 47, 99–104. [Google Scholar] [CrossRef]
  44. Chanioti, S.; Constantina, T. Optimization of ultrasound-assisted extraction of oil from olive pomace using response surface technology: Oil recovery, unsaponifiable matter, total phenol content and antioxidant activity. LWT Food Sci. Technol. 2017, 79, 178–189. [Google Scholar] [CrossRef]
  45. Ocholi, O.; Menkiti, M.; Auta, M.; Ezemagu, I. Optimization of the operating parameters for the extractive synthesis of biolubricant from sesame seed oil via response surface methodology. Egypt. J. Pet. 2018, 27, 265–275. [Google Scholar] [CrossRef]
  46. Witek-Krowiak, A.; Chojnacka, K.; Podstawczyk, D.; Dawiec, A.; Pokomeda, K. Application of response surface methodology and artificial neural network methods in modeling and optimization of biosorption process. Bioresour. Technol. 2014, 60, 150–160. [Google Scholar] [CrossRef]
  47. Hernandez-Santos, B.; Rodriguez-Miranda, J.; Herman-Lara, E.; Torruco-Uco, J.G.; Carmona-Garcia, R.; Juarez-Barrientos, J.M.; Chavez-Zamudio, R.; Martinez-Sanchez, C.E. Effect of oil extraction assisted by ultrasound on the physicochemical properties and fatty acid profile of pumpkin seed oil (Cucurbita pepo). Ultrason Sonochem. 2016, 31, 429–436. [Google Scholar] [CrossRef] [PubMed]
  48. Deli, S.; Farah Masturah, M.; Tajul Aris, Y.; Wan Nadiah, W.A. The effects of physical parameters of the screw press oil expeller on oil yield from Nigella sativa L. seeds. Int. Food Res. J. 2011, 18, 1367–1373. [Google Scholar]
  49. Orozco, F.D.A.; Sousa, A.C.; Araujo, M.C.U.; Domini, C.E. A new flow UV-Vis kinetics spectrophotometric method based on photodegradative reaction for determining the oxidative stability of biodiesel. Fuel 2020, 26, 116–197. [Google Scholar]
  50. Gurkan, A.K.G.; Kabutey, A.; Selvi, K.C.; Hrabe, P.; Herak, D.; Frankova, A. Investigation of heating and freezing pretreatments of mechanical, chemical and spectral properties of bulk sunflower seeds and oil. Processes 2020, 8, 411. [Google Scholar]
  51. Chatepa, L.E.C.; Uluko, H.; Masamba, K. Comparison of oil quality extracted from selected conventional and non conventional sources of vegetable oil from Malawi. Afr. J. Biotechnol. 2019, 18, 171–180. [Google Scholar]
  52. Konuskan, D.B.; Arslan, M.; Oksuz, A. Physiochemical properties of cold pressed sunflower, peanut, rapeseed, mustard and olive oils grown in the Eastern Mediterranean region. Saudi J. Biol. Sci. 2019, 26, 340–344. [Google Scholar] [CrossRef]
  53. Statsoft Inc. STATISTICA for Windows; Statsoft Inc.: Tulsa, OK, USA, 2013. [Google Scholar]
  54. Rodrigues, J.; Miranda, I.; Gominho, J.; Vasconcelos, M.; Barradas, G.; Pereira, H.; Bianchi-de-Aguiar, F.; Ferreira-Dias, S. Modeling and optimization of laboratory-scale conditioning of Jatropha curcas L. Seeds for oil expression. Ind. Crops Prod. 2016, 83, 614–619. [Google Scholar] [CrossRef]
  55. Lv, H.; Liu, H.; Tan, Y.; Meng, A.; Assogba, O.C.; Xiao, S. An extended search method for identifying optimal parameters of the generalized Maxwell model. Contr. Build. Mater. 2021, 266, 1–13. [Google Scholar] [CrossRef]
  56. Salimi, A.; Abbassi-Sourki, F.; Karrabi, M.; Ghoreishy, M.H.R. Investigation on viscoelastic behaviour of virgin EPDM/reclaimed rubber blends using generalized Maxwell model (GMM). Polym. Test. 2021, 93, 106989. [Google Scholar] [CrossRef]
  57. Zhang, Z.; Bader, Y.M.K.; Lucian, A.L.; Yang, J. Improved stress relaxation resistance of composites films by soy protein polymer. Compos. Commun. 2021, 24, 100644. [Google Scholar] [CrossRef]
  58. Malomuzh, N.P.; Shakun, K.S. Maxwell relaxation time for argon and water. J. Mol. Liq. 2019, 293, 111413. [Google Scholar] [CrossRef]
  59. Herak, D.; Kabutey, A.; Choteborsky, R.; Petru, M.; Sigalingging, R. Mathematical models describing the relaxation behaviour of Jatropha curcas L. bulk seeds under axial compression. Biosyst. Eng. 2015, 131, 77–83. [Google Scholar] [CrossRef]
  60. Nobile, M.A.D.; Chillo, S.; Mentana, A.; Baiano, A. Use of the generalized Maxwell model for describing the stress relaxation behaviour of solid-like foods. J. Food Eng. 2007, 78, 978–983. [Google Scholar] [CrossRef]
  61. Zhao, S.; Zhang, D. Supercritical fluid extraction and characterization of Moringa oleifera leaves oil. Sep. Purif. Technol. 2013, 118, 497–502. [Google Scholar] [CrossRef]
  62. Sirisomboon, P.; Kitchaiya, P. Physical properties of Jatropha curcas L. kernels after heat treatments. Biosyst. Eng. 2009, 102, 244–250. [Google Scholar] [CrossRef]
  63. Willems, P.; Kuipers, N.J.M.; De Haan, A.B. A consolidation based extruder model to explore GAME process configurations. J. Food Eng. 2009, 90, 238–245. [Google Scholar] [CrossRef]
  64. Willems, P.; Kuipers, N.J.M.; De Haan, A.B. Hydraulic pressing of oilseeds; experimental determination and modelling of yield and pressing rates. J. Food Eng. 2008, 89, 8–16. [Google Scholar] [CrossRef]
  65. Beerens, P. Screw Pressing of Jatropha Seeds for Fueling Purposes in Less Developed Countries. Master’s Thesis, Department of Sustainable Energy Technology, Eindhoven University of Technology, Eindhoven, The Netherlands, 2007; p. 87. [Google Scholar]
  66. Pritchard, P.J. Mathcad: A Tool for Engineering Problem Solving; McGraw-Hill: New York, NY, USA, 1998. [Google Scholar]
  67. Petru, M.; Novak, O.; Herak, D.; Simanjuntak, S. Finite element method model of the mechanical behaviour of Jatropha curcas L. seeds under compression loading. Biosyst. Eng. 2012, 114, 412–421. [Google Scholar] [CrossRef]
  68. Jolivet, P.; Deruyffelaere, C.; Boulard, C.; Quinsac, A.; Savoire, R.; Nesi, N.; Chardot, T. Deciphering the structural organization of the oil bodies in the Brassica napus seed as a mean to improve the oil extraction yield. Ind. Crops Prod. 2013, 44, 549–557. [Google Scholar] [CrossRef]
  69. Salgado-Cruz, M.; Calderon-Dominguez, G.; Chanona-Perez, J.; Farrera-Rebollo, R.R.; Mendez-Mendez, J.V.; Diaz-Ramirez, M. Chia (Salvia hispanica L.) seed mucilage release characterisation. A microstructural and image analysis study. Ind. Crops Prod. 2013, 51, 453–462. [Google Scholar] [CrossRef]
  70. Mayerhofer, T.G.; Popp, J. Beer’s law derived from electromagnetic theory. Spectrochim. Acta Part A Mol. Biomol. Spectrosc. 2019, 215, 345–347. [Google Scholar] [CrossRef] [PubMed]
  71. Li, J.; Tong, Y.; Guan, L.; Wu, S.; Li, D. A turbidity compensation method for COD measurements by UV-vis spectroscopy. Optik 2019, 186, 129–136. [Google Scholar] [CrossRef]
  72. Gobrecht, A.; Bendoula, R.; Roger, J.M.; Bellon-Maurel, V. Combining linear polarization spectroscopy and the representative layer theory to measure the Beer-Lambert law absorbance of highly scattering materials. Anal. Chim. Acta 2015, 853, 486–494. [Google Scholar] [CrossRef]
  73. Tolbin, A.Y.; Pushkarev, V.E.; Tomilova, L.G. A mathematical analysis of deviations from linearity of Beer’s law. Chem. Phys. Lett. 2018, 706, 520–524. [Google Scholar] [CrossRef]
  74. Wang, L.; Ayaz, H.; Izzetoglu, M.; Onaral, B. Evaluation of light detector surface area for functional Near Infrared Spectroscopy. Comput. Biol. Med. 2017, 89, 68–75. [Google Scholar] [CrossRef] [PubMed]
  75. Mantele, W.; Deniz, E. UV-VIS absorption spectroscopy: Lambert-Beer reloaded. Spectrochim. Acta Part A Mol. Biomol. Spectrosc. 2017, 173, 965–968. [Google Scholar] [CrossRef]
  76. Maikala, R. Modified Beer’s law—Historical perspectives and relevance in near-infrared monitoring of optical properties of human tissue. Int. J. Ind. Ergon. 2010, 40, 125–134. [Google Scholar] [CrossRef]
  77. Kumar, K.A.; Viswanathan, K. Study of UV Transmission through a Few Edible Oils and Chicken Oil. J. Spectrosc. 2013, 2013, 540417. [Google Scholar]
  78. Okene, E.O.; Evbuomwan, B.O. Solvent extraction and characteristics of oil from coconut seeds using alternative solvents. Int. J. Eng. Sci. Technol. 2014, 2, 135–138. [Google Scholar]
  79. Lozada, M.I.O.; Maldonade, I.R.; Rodrigues, D.B.; Santos, D.S.; Sanchez, B.A.O.; De Souza, P.E.N.; Longo, J.P.; Amaro, G.B.; De Oliveira, L.D.L. Physicochemical characterization and nano-emulsification of three species of pumpkin seed oils with focus on their physical stability. Food Chem. 2021, 343, 1–13. [Google Scholar]
  80. Rezig, L.; Chouaibi, M.; Msaada, K.; Hamdi, S. Chemical composition and profile characterization of pumpkin seed oil. Ind. Crops Prod. 2012, 37, 82–87. [Google Scholar] [CrossRef]
  81. Evangelista, R.L.; Isbell, T.A.; Cermak, S.C. Extraction of pennycress (Thlaspi arvense L.). Ind. Crops Prod. 2012, 37, 76–81. [Google Scholar] [CrossRef]
  82. Chen, F.; Zhang, Q.; Gu, H.; Yang, L. An approach for extraction of kernel oil from Pinus pumila using homogenate-circulating ultrasound in combination with an aqueous enzymatic process and evaluation of its antioxidant activity. J. Chromatogr. 2016, 147, 68–79. [Google Scholar] [CrossRef] [PubMed]
  83. Seymen, M.; Uslu, N.; Turkmen, O.; Juhaimi, F.A.; Ozcan, M.M. Chemical compositions and mineral contents of some hull-less pumpkin seed and oils. J. Am. Oil Chem. Soc. 2016, 93, 1095–1099. [Google Scholar] [CrossRef]
  84. Younis, Y.M.H.; Ghirmay, S.; Al-Shihry, S.S. African Cucurbita pepo L.: Properties of seed and variability in fatty acid composition of seed oil. Phytochemistry 2000, 54, 71–75. [Google Scholar] [CrossRef]
  85. Ekop, I.E.; Simonyan, K.J.; Onwuka, U.N. Effects of processing factors and conditions on the cracking efficiency of Tympanotonus fuscatus and Pachymelania aurita periwinkles: Response surface approach. J. Agric. Food Res. 2021, 3, 100094. [Google Scholar] [CrossRef]
  86. Almasi, S.; Ghobadian, B.; Najafi, G.H.; Yusaf, T.; Soufi, M.D.; Hoseini, S.S. Optimization of an ultrasound-assisted biodiesel production process from one genotype of rapeseed (TERI (OE) R-983) as a novel feedstock using response surface methodology. Energies 2019, 12, 2656. [Google Scholar] [CrossRef] [Green Version]
  87. Jalili, F.; Jafari, S.M.; Emam-Djomeh, Z.; Malekjani, N. Optimization of ultrasound-assisted extraction of oil from canola seeds with the use of response surface methodology. Food. Anal. Methods 2018, 11, 598–612. [Google Scholar] [CrossRef]
  88. Gohi, B.F.C.A.; Du, J.; Zeng, H.-Y.; Cao, X.-J.; Zou, K.M. Microwave pretreatment and enzymolysis optimization of the lotus seed protein. Bioengineering 2019, 6, 28. [Google Scholar] [CrossRef] [Green Version]
  89. Mourabet, M.; El Rhilassi, A.; El Boujaady, H.; Bennani-Ziatni, M.; Taitai, A. Use of response surface methodology for optimization of fluoride adsorption in an aqueous solution by Brushite. Arab. J. Chem. 2017, 10, S3292–S3302. [Google Scholar] [CrossRef] [Green Version]
  90. Rostami, M.; Farzaneh, V.; Boujmehrani, A.; Mohammadi, M.; Bakhshabadi, H. Optimizing the extraction process of sesame seed’s oil using response surface method on the industrial scale. Ind. Crops Prod. 2014, 58, 160–165. [Google Scholar] [CrossRef]
  91. Akangbe, O.L.; Blahovec, J.; Adamovsky, R.; Linda, M.; Hromasova, M. A device to measure wall friction during uniaxial compression of biomaterials. In Proceedings of the 7th TAE, Prague, Czech Republic, 17–20 September 2019; pp. 14–19. [Google Scholar]
  92. Domokos, G.; Sipos, A.; Szabo, T. Pebbles, Shapes, and Equilibria. Math. Geosci. 2010, 42, 29–47. [Google Scholar] [CrossRef]
  93. Tien, Y.M.; Wu, P.L.; Huang, W.H.; Kuo, M.F.; Chu, C.A. Wall friction measurement and compaction characteristics of bentonite powders. Powder Technol. 2007, 173, 140–151. [Google Scholar] [CrossRef]
  94. Illenberger, W. Pebble shape (and size!). J. Sediment Res. 1991, 61, 756. [Google Scholar]
  95. Sneed, E.; Folk, R.L. Pebbles in the lower Colorado River, Texas, a study in particle morphogenesis. J. Geol. 1958, 66, 114–150. [Google Scholar] [CrossRef]
  96. Zingg, T. Beitrag zur Schotteranalyse. Schweiz Mineral Petroger Mitt. 1935, 15, 39–40. [Google Scholar]
  97. Yin, W.; Washington, M.; Ma, X.; Yang, X.; Lu, A.; Shi, R.; Zhao, R.; Wang, X. Consumer acceptability and sensory profiling of sesame oils obtained from different processes. Oil Gas Sci. Technol. 2020, 3, 39–48. [Google Scholar] [CrossRef]
  98. Fernandes, G.D.; Ellis, A.C.; Gambaro, A.; Barrera-Arellano, D. Sensory evaluation of high-quality virgin olive oil: Panel analysis versus consumer perception. Curr. Opin. Food Sci. 2018, 21, 66–71. [Google Scholar] [CrossRef]
  99. Amelio, M. The official method for olive oil sensory evaluation: An expository revision of certain sections of the method and a viable means for confirming the attribute intensities. Trends Food Sci. Technol. 2015, 47, 64–68. [Google Scholar] [CrossRef]
  100. Lauri, I.; Pagano, B.; Malmendal, A.; Sacchi, R.; Novellino, E.; Randazzo, A. Application of ‘’magnetic tongue’’ to the sensory evaluation of extra virgin olive oil. Food Chem. 2013, 140, 692–699. [Google Scholar] [CrossRef] [PubMed]
Figure 1. Uniaxial compression process of pumpkin seeds: (A) Oil point identification and oil extraction; (B–1) Bulk pumpkin seeds, (B–2) Measured sample before oil extraction, (B–3) Sample seedcake after oil extraction, (B–4) Sample oil through Soxhlet extraction, (B–5) Compressed oil at 20 °C (Control), (B–6) at 40 °C; (B–7) at 60 °C, (B–8) at 80 °C, and Soxhlet extraction setup (C).
Processes 09 00540 g001
Figure 2. Observed and predicted values of energy, E N (J) at 20 °C.
Processes 09 00540 g002
Figure 3. Determination of the maximum force for pumpkin seeds oil extraction at 20 °C.
Processes 09 00540 g003
Figure 4. Force–deformation curves of pumpkin seeds at 40 °C for different factors combination showing the energy demand of the oil extraction process, as a representation of the other factors.
Processes 09 00540 g004
Figure 5. Force–deformation curves of pumpkin seeds at 60 °C for different factors combination.
Processes 09 00540 g005
Figure 6. Force–deformation curves of pumpkin seeds at 80 °C for different factors combination.
Processes 09 00540 g006
Figure 7. Absorbance versus wavelength of pumpkin seeds oil at room and heating temperature.
Processes 09 00540 g007
Figure 8. Profiles for predicted values and desirability for oil expression efficiency, O EE (%).
Processes 09 00540 g008
Figure 9. Profiles for predicted values and desirability for energy, E N (J).
Processes 09 00540 g009
Figure 10. Pareto chart of standardization effect for oil expression efficiency, O EE (%).
Processes 09 00540 g010
Figure 11. Pareto chart of standardization effect for energy, E N (J).
Processes 09 00540 g011
Figure 12. Response surface plots of the combined effect of force (kN) and temperature (°C) on oil yield of pumpkin seeds.
Processes 09 00540 g012
Figure 13. Response surface plots of the combined effect of force (kN) and temperature (°C) on oil expression efficiency of pumpkin seeds.
Processes 09 00540 g013
Figure 14. Response surface plots of the combined effect of force (kN) and temperature (°C) on energy of pumpkin seeds.
Processes 09 00540 g014
Figure 15. Fitted compression force and deformation curve of pumpkin seeds at optimum processing factors ( X 1 = 200 (+1); X 2 = 4 (–0.5) and X 3 = 80 (+1)).
Processes 09 00540 g015
Figure 16. Fitted relaxation force and time curve of pumpkin seeds at optimum processing factors ( X 1 = 200 (+1); X 2 = 4 (–0.5) and X 3 = 80 (+1)).
Processes 09 00540 g016
Table 1. Mean and standard deviation values of the responses of pumpkin seeds oil at 20 °C under the effect of the processing factors (speed and force).
Speed (mm/min)Force (kN)N D X
(mm)
O Y   ( % ) O E E   ( % ) E N   ( J )
3100344.58 ± 2.2710.41 ± 1.0530.96 ± 3.12487.77 ± 4.94
3150348.91 ± 0.3310.91 ± 0.3432.45 ± 1.00647.94 ± 15.11
3200348.76 ± 0.6413.31 ± 0.2339.59 ± 0.69800.70 ± 32.48
5100345.96 ± 0.907.52 ± 1.2222.36 ± 3.64469.99 ± 25.32
5150347.33 ± 2.329.76 ± 0.5129.03 ± 1.52589.17 ± 17.92
5200347.61 ± 1.4211.47 ± 0.3734.11 ± 1.10721.57 ± 24.15
7100347.48 ± 0.435.17 ± 0.3215.36 ± 0.94458.45 ± 9.50
7150347.01 ± 1.618.23 ± 0.1724.49 ± 0.50559.53 ± 42.69
7200348.57 ± 0.789.88 ± 0.5229.39 ± 1.56707.46 ± 19.95
N: Number of samples repetitions; D X : Deformation (mm); O Y : Oil yield (%); O EE : Oil expression efficiency (%); E N : Energy (J).
Table 2. ANOVA multivariate tests of significance of the effect of the processing factors on the calculated responses.
EffectTestValueF-ValueEffect
df
Error
df
p-Value
InterceptWilks0.0014,925.313.0016.00<0.05 *
Speed (mm/min)Wilks0.0813.876.0032.00<0.05 *
Force (kN)Wilks0.0229.536.0032.00<0.05 *
Speed × ForceWilks0.361.6512.0042.62>0.05 ns
* Significant (p < 0.05); ns Non-significant (p > 0.05).
Table 3. Mean and standard deviation of pumpkin seed oil compositions under temperature effect.
Temperature
°C
Peroxide Value (PV), (meq O2/kg)Acid Value (AV),
(mg KOH/g oil)
Free Fatty Acid
(FFA), mg KOH/g
225.5 ± 0.7071.136 ± 0.0190.571 ± 0.009
405.5 ± 0.707 1.112 ± 0.0160.559 ± 0.008
608 ± 1.4141.167 ± 0.0160.587 ± 0.008
809 ± 1.4141.166 ± 0.0160.586 ± 0.008
Table 4. Test of sum of squares whole model of dependent variables under temperature effect.
Dependent VariablesRR2FP
PV0.8450.71414.964<0.05
AV0.6410.4094.157>0.05
FFA0.6410.4114.188>0.05
PV: Peroxide value; AV: Acid Value; FFA: Free Fatty Acid; R: Correlation; R2: Coefficient of determination.
Table 5. Regression model of PV of pumpkin seed oil under temperature effect.
Dependent VariableModelStandard
Error
T-ValueP
Intercept3.5940.9583.750<0.05
Temperature0.0670.0173.868<0.05
Table 6. Box–Behnken Design of the combinations of factors for pumpkin seeds oil extraction.
Run X 1 ( kN ) X 2 ( mm / min ) X 3 ( ° C ) M b ( g ) M a ( g ) M o i l ( g ) D X ( mm )
1100 (–1)3 (–1)60 (0)77.4466.5410.9044.32
2200 (1)3 (–1)60 (0)77.4463.2814.1648.05
3100 (–1)7 (1)60 (0)77.4468.998.4543.87
4200 (1)7 (1)60 (0)77.4465.5611.8847.88
5100 (–1)5 (0)40 (–1)77.4469.987.4645.00
6200 (1)5 (0)40 (–1)77.4466.9310.5147.27
7100 (–1)5 (0)80 (1)77.4466.9410.5046.66
8200 (1)5 (0) 80 (1)77.4462.8414.6047.60
9150 (0)3 (–1)40 (−1)77.4467.2810.1645.18
10150 (0)7 (1)40 (–1)77.4469.028.4242.99
11150 (0)3 (–1)80 (1)77.4463.1814.2645.15
12150 (0)7 (1) 80 (1)77.4464.4912.9545.52
13150 (0)5 (0)60 (0)77.4466.7710.6744.73
14150 (0)5 (0)60 (0)77.4466.5210.9246.60
15150 (0)5 (0)60 (0)77.4466.5410.9045.66
X 1 : Force (kN); X 2 : Speed (mm/min); X 3 : Temperature (°C); M b : Initial mass of samples before oil extraction; M b : Mass of seedcake after oil extraction; M b : Mass of oil calculated; D X : Deformation (mm) obtained from the output data.
Table 7. Coded values of the combinations of factors for pumpkin seeds oil extraction.
Run X 1   ( kN ) X 2   ( mm / min ) X 3 (°C) O Y   ( % ) O E E   ( % ) E N   ( J )
1100 (–1)3 (–1)60 (0)14,0841,85537.36
2200 (1)3 (–1)60 (0)18,2954,37834.26
3100 (–1)7 (1)60 (0)10,9132,45492.24
4200 (1)7 (1)60 (0)15,3445,62804.13
5100 (–1)5 (0)40 (–1)9,6328,64502.56
6200 (1)5 (0)40 (–1)13,5740,36767.76
7100 (–1)5 (0)80 (1)13,5640,32514.91
8200 (1)5 (0) 80 (1)18,8556,06832.03
9150 (0)3 (–1)40 (–1)13,1239,01701.97
10150 (0)7 (1)40 (–1)10,8732,33599.31
11150 (0)3 (–1)80 (1)18,4154,76696.76
12150 (0)7 (1) 80 (1)16,7249,73645.96
13150 (0)5 (0)60 (0)16,3648,65662.55
14150 (0)5 (0)60 (0)16,6849,61675.98
15150 (0)5 (0)60 (0)14,0841,85671.73
X 1 : Force (kN); X 2 : Speed (mm/min); X 3 : Temperature (°C); O Y : Oil yield (%); O EE : Oil expression efficiency (%); E N : Energy (J).
Table 8. Response surface regression analysis for oil yield, O Y (%).
Effect Model   a   O Y   ( % ) Standard ErrorSum of Squares, SSDFMean Square, MSF-Value
Intercept 15.710.59110.5912.2711.93 *
X 1 2.230.3639.93139.9338.80 *
X 1 2 –0.970.533.4413.443.35 ns
X 2 –1.260.3612.62112.6212.26 *
X 2 2 –0.090.530.0310.030.03 ns
X 3 2.540.3651.77151.7750.31 *
X 3 2 –0.840.532.5812.582.51 ns
X 1 · X 2 0.050.510.0110.010.01 ns
X 1 · X 3 0.340.510.4610.460.45 ns
X 2 · X 3 0.140.510.0810.080.07 ns
Residual 5.1551.03
Lack of Fit 1.1030.370.18 ns
Total SS 115.6214
O Y : Oil Yield; X 1 : Force (kN); X 2 : Speed (mm/min); X 3 : Temperature (°C); DF: Degree of freedom; * Significant (p < 0.05); ns Non-significant (p > 0.05); a Coefficient of determination (R2): 0.955.
Table 9. Response surface regression analysis for oil expression efficiency, O EE (%).
EffectModel b
O E E   ( % )
Standard ErrorSum of Squares, SSDFMean Square, MSF-Value
Intercept46.701.74976.89108.5311.93 *
X 1 6.641.07353.021353.0238.80 *
X 1 2 –2.871.5730.45130.453.35 ns
X 2 –3.731.07111.551111.5512.26 *
X 2 2 –0.261.570.2510.250.03 ns
X 3 7.561.07457.761457.7650.31 *
X 3 2 –2.491.5722.85122.852.51 ns
X 1 · X 2 0.161.510.1110.110.01 ns
X 1 · X 3 1.011.514.0614.060.45 ns
X 2 · X 3 0.411.510.6810.680.07 ns
Residual 45.4559.09
Lack of Fit 3.2533.250.18 ns
Total SS 1022.2814
O EE : Oil Expression Efficiency (%); X 1 : Force (kN); X 2 : Speed (mm/min); X 3 : Temperature (°C); DF: Degree of freedom; * Significant (p < 0.05); ns Non-significant (p > 0.05); b Coefficient of determination (R2): 0.955.
Table 10. Response surface regression analysis for energy, E N (J).
Effect. Model   c   E N   ( J ) Standard ErrorSum of Squares, SSDFMean Square, MSF-Value
Intercept670.098.57187,554.5920,839.3994.64 *
X 1 148.895.25177,341.091177,341.093764.24 *
X 1 2 –4.897.7288.21188.211.87 ns
X 2 –28.595.256538.1716538.17138.78
X 2 2 1.807.7211.94111.940.25 ns
X 3 14.765.251742.3711742.3736.98*
X 3 2 –10.897.72437.481437.489.29 ns
X 1 · X 2 3.757.4256.15156.151.19 ns
X 1 · X 3 12.987.42673.841673.8414.30 ns
X 2 · X 3 12.977.42672.501672.5014.27 ns
Residual 1101.025220.20
Lack of Fit 1006.83335.67.12 ns
Total SS 188,655.514
E N : Energy (J); X 1 : Force (kN); X 2 : Speed (mm/min); X 3 : Temperature (°C); DF: Degree of freedom; * Significant (p < 0.05); ns Non-significant (p > 0.05); c Coefficient of determination (R2): 0.994.
Table 11. Optimum, predicted, and validated values of the factors X 1 = 200 (+1); X 2 = 5 (0) and X 3 = 80 (+1).
ResponsesOptimum Values
(Profiles for Predicted)
Predicted Values
(Regression Model)
Validated Values
(Experimental)
OY (%)19.0220.4819.06 *
19.78 a
20.76 *
21.70 b
OEE (%)56.5660.9056.66 *
58.83 a
61.74 *
64.53 b
EN (J)837.33848.04826.10 *a
841.97 *b
X 1 : Force (kN); X 2 : Speed (mm/min); X 3 : Temperature (°C); * and *a, *b: Without relaxation process for X 2 = 5 (0) and X 2 = 4 (–0.5); a Relaxation at 12 min for X 2 = 5 (0); b Relaxation at 12 min for X 2 = 4 (–0.5).
Table 12. Percentage error values of the responses from the regression and tangent models.
ResponsesValuesPE (%)
O Y _ E %
O Y _ T %
21.70
20.48
5.96
O EE _ E %
O EE _ T %
64.53
60.90
5.96
E N _ E (J)
E N _ E _ 1 J
E N _ T _ 2 J
841.97
848.04
918.15
0.72
8.30
PE: Percentage Error; O Y _ E : Experimental oil yield; O Y _ T : Theoretical oil yield; O EE _ E : Experimental oil expression efficiency; O EE _ T : Theoretical oil expression efficiency; E N _ E : Experimental energy; E N _ T _ 1 : Theoretical energy at X 2 = 5 (0) mm/min; E N _ T _ 2 : Theoretical energy at X 2 = 4 (–0.5) mm/min.
Table 13. Oil point analysis of pumpkin seeds at optimum temperature, X 3 of 80 °C.
Variable D X O P   ( mm ) F R O P   ( kN ) Y D O P   ( % ) E N O P   ( J )
X 2 = 5 (0)42.25 (46.96 **)49.876.99331.88
* X 2 = 4 (–0.5)42.48 (46.96 **)57.328.68360.77
X 2 and * X 2 : Speed (mm/min) and coded values; DX OP : oil point deformation; FR OP : oil point force; YD OP : oil point yield and EN OP : oil point energy; ** Upper oil point at maximum deformation.
Table 14. ANOVA results of the fitted data of the experimental force–deformation curve of pumpkin seeds at optimum factors X 1 = 200 (+1); X 2 = 4 (–0.5) and X 3 = 80 (+1).
Samples
N
A
(kN)
B
(mm–1)
N (–)Fratio (–)Fcritical (–)P value (–)R2 (–)
15.8480.03121.15·10–143.8650.9910.999
25.4040.0321.07·10–33.8470.9741
35.0290.0328.712·10–43.8470.9761
Mean ± SD5.427 ± 0.4100.03 ± 0.00126.471·10–4 ± 0.0013.853 ± 0.0100.980 ± 0.0090.999 ± 0.001
CV (%)7.551.90
N: Samples repetitions; A is the force coefficient of mechanical behavior (kN), B is the deformation coefficient of mechanical behavior (mm-1), n is the fitting curve function exponent (–); X 1 : Force (kN); X 2 : Speed (mm/min); X 3 : Temperature (°C).
Table 15. Determined coefficients of the generalized Maxwell model with five elements at optimum processing factors ( X 1 = 200 (+1); X 2 = 4 (–0.5) and X 3 = 80 (+1)).
Samples
N
E 1
(MPa)
E 2
(MPa)
E 3
(MPa)
η 1
(MPa · s−1)
η 2
(MPa · s−1)
139.5979.35738.658421.245990.532
233.4748.44544.196356.102881.34
337.4769.82339.293346.998893.019
Mean ± SD36.849 ± 3.1099.208 ± 0.70140.712 ± 3.031374.781 ± 40.495921.630 ± 59.966
N: Number of samples repetitions; E 1 , E 2 and E 3 are coefficients of moduli of elasticity; η 1 and η 1 are coefficients of viscosity.
Table 16. Statistical analysis of the generalized Maxwell model at optimum processing factors ( X 1 = 200 (+1); X 2 = 4 (–0.5) and X 3 = 80 (+1)).
Samples
N
F r a t i o
(–)
F c r i t i c a l
(–)
P v a l u e
(–)
R2
(–)
10.0353.8550.8530.996
20.0323.8560.8570.994
30.0453.8560.8330.995
Mean ± SD0.037 ± 0.0073.856 ± 0.0010.847 ± 0.0130.995 ± 0.001
N: Samples repetitions; F critical > F ratio and P value > 0.05 means significant (Mathcad 14 software); R2 is the model coefficient of determination.
Publisher’s Note: MDPI stays neutral with regard to jurisdictional claims in published maps and institutional affiliations.

